
Abstract
Background:
Nepal has a long tradition of designing good multisectoral nutrition policy. However, success of policy implementation has varied. More evidence on how to successfully carry out multisector nutrition policy is needed.
Objective:
We tracked the influence of Nepal’s multisectoral nutrition plan (MSNP) on the process of priority setting and budgeting from 2014 to 2016.
Methods:
This study used a mixed-method longitudinal design to track qualitative and budgetary changes related to MSNP processes nationally as well as in 3 districts. Qualitative changes in each study area were assessed through interviews, observation, news content, and meeting notes. Changes in allocations and expenditures were calculated based on budget documents, work plans, and validation interviews.
Results:
Improved understanding of the MSNP was documented nationally and in study districts but not in VDCs. Human resources, ownership, bottom-up planning, coordination, advocacy, and sustainable structures all emerged as important factors within the enabling environment. Evidence suggests the MSNP influenced improvements in the last 3 factors. We also found notable increases in activities and financing for nutrition—allocations increased steadily between FY 2013–2014 and FY 2015–2016, and 28% of total nutrition allocations in the final year came from new or expanded MSNP-affiliated activities. Data from 3 districts highlight challenges linking local planning and budgeting to central-level structures.
Conclusions:
The MSNP appears to have strengthened the nutrition system in Nepal and increased priority and funding for nutrition. Next steps include strengthening linkages to the districts and below. Other countries can learn from the MSNP’s success in increasing investment for nutrition.
Introduction
From 2001 to 2011, Nepal achieved record reductions in child stunting, despite political instability and moderate economic growth. 1 This accomplishment aside, more than 40% of Nepali children were stunted in 2011 and nearly 30% were underweight. 2 The World Bank estimated that 2% to 3% of Nepal’s gross domestic product is lost every year because of undernutrition. 3
Nepal has a long tradition of multisectoral approaches to address high undernutrition rates, starting in the 1970s with the establishment of the National Nutrition Policy Coordination Committee and the institution of the Joint Nutrition Support Program (JNSP). 4 However, in the 1980s, momentum slowed after the closure of the JNSP due to the lack of results and donor dissatisfaction. 5 Interest in multisectoral approaches resurfaced after the Government of Nepal (GoN) signed on to the Millennium Development Goals. This led to more wide ranging nutrition plans in the 2000s, the 2009 Nutrition Assessment and Gap Analysis, and GoN’s commitment to the global Scaling Up Nutrition (SUN) Movement. The Multisector Nutrition Plan (MSNP) 2013 to 2017 was developed out of this series of events. 6
The MSNP includes nutrition activities across 5 official sector ministries and various external development partners (EDPs).These activities were designed to achieve 3 MSNP outcomes across 8 output areas (Box 1). There is a vertical nutrition oversight committee structure that starts with parliament and goes down to the village (VDC) level. The National Planning Commission (NPC) is responsible for coordination across stakeholder groups.
Summary of MSNP Outcome and Output Areas
The MSNP outcomes relate to: 1.improving policies, plans, and multi-sectoral coordination; 2. improving practices relating to optimal use of nutrition services; and 3. strengthening nutrition capacity.
Outputs have indicative activities attached - Unless an age group is specified, all activities relate to those in the 1,000 days window.
Source: Multi-sector Nutrition Plan (GoN and NPC, 2012)
Nepal rates well on World Health Organization nutrition governance indicators; however, as with any country, there are some continuing challenges and capacity gaps. 7 These include low community understanding of nutrition and a lack of multisector collaboration, high-level advocacy for nutrition, national nutrition capacity, and bottom-up planning to ensure effective implementation. 8,9 The MSNP was designed to address these challenges and gaps.
Objectives and Background
Little has been documented from Nepal’s rich nutrition policy history. 8 Gillespie et al (2013) identified the need for greater evidence on enabling environments for nutrition and on systematic ways to capture and share learning on nutrition policy. 10 The Nepal Pathways to Better Nutrition (PBN) study helps to fill these gaps. The objective of the PBN study, designed by the US Agency for International Development (USAID) Strengthening Partnerships, Results, and Innovations in Nutrition Globally (SPRING) project in collaboration with NPC, is to document whether and how the MSNP influenced the enabling environment for nutrition action (including enabling factors, prioritization, and funding) over 2 years (2014-2016). The study was timed to capture a significant portion of the MSNP (2013-2017) but was not designed to measure the impact of the plan.
We have focused on changes in prioritization and funding for several reasons. Even well-executed policies or plans cannot immediately impact nutritional status—they must be operationalized, and this can take time, especially when many sectors are involved. 11 Our observation period of 2 years meant we focused on areas where we expected to be able to see change. Systems-strengthening results frameworks note that governance and financing are the first inputs that can be influenced, which can then lead to improvement in longer term outcomes and impacts. 12 Lamstein et al (2016) note that MSNPs, in particular, must create systemic improvements in governance, prioritization, and financing in order to support nutrition actions across such a diverse set of sectors and stakeholders. 13 Therefore, while we know these areas are necessary but not sufficient to attain full scale-up of nutrition interventions, measurable improvements in these areas would indicate the Nepal is on the right track.
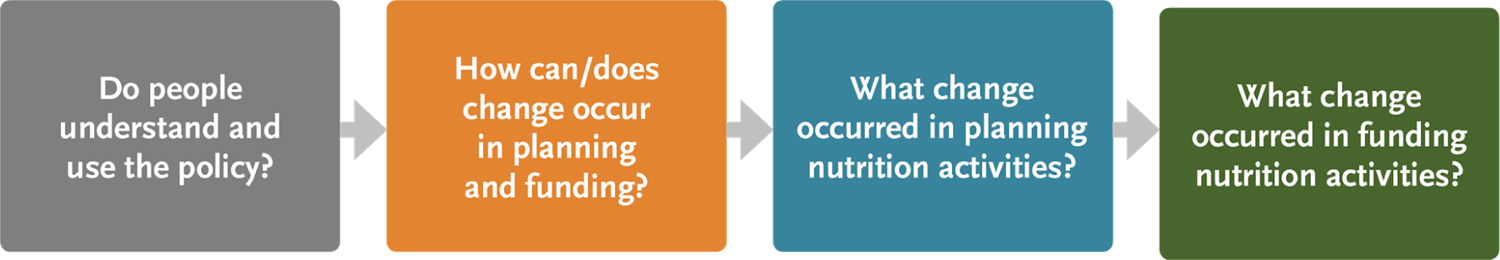
Our hypothesis, based on Nepal’s documented political commitment to multisectoral nutrition and their positive track record for reducing undernutrition, is that the MSNP would improve the stakeholder’s understanding of nutrition and would lead to changes in key factors within the enabling environment, which would in turn increase the prioritization of nutrition activities during work plan development each year. This would result in greater funding for nutrition activities over the course of the study’s tenure. To test this, the study followed 4 key study questions:
Taken together, these study questions guided data collection to identify changes brought about by the MSNP. The PBN is unique for its perspective and purpose. We looked longitudinally at the functioning of the MSNP policy cycle, priority setting, and funding to provide practical, relevant recommendations for improving the effectiveness of that cycle. Several other studies have explored the complex nature of multisectoral policy and planning in the Asian region but focused on global themes. 14 –16 Others looked retrospectively to learn why a country’s multisectoral approach was successful. 17,18 Lapping et al investigated the process of national nutrition policy advancement in Vietnam and found that purposeful, contextually sensitive strategies are key. 19 Within Nepal specifically, several studies looked retrospectively at barriers to advancing nutrition and nutrition policy but do not explore these themes over time. 3,8,9,20 –22 Webb et al (2016; also in this FNB Supplement) describes prospective longitudinal research in Nepal that traces the implementation of the MSNP across 21 districts down the 5 subnational levels of governance. 23 This work complements our findings with an implementation-level perspective of governance themes.
Regarding funding analyses in Asia, Pakistan and the Indian State of Rajasthan have recently published estimates of nutrition financing, focusing in particular on nutrition-specific activities. 24,25 In the most widespread effort of its kind to date, the SUN Movement has also supported 35 countries (9 from Asia including Nepal) to document nutrition financing, but so far, these exercises have not included in-depth validation. 26 The Civil Society Alliance for Nutrition in Nepal documented the outcomes of the SUN scoping exercise in 2015. 27 By linking our results on policy processes to funding estimates, we can provide a more nuanced understanding of what specific actions are needed to produce increases in nutrition financing within the policy cycle.
Methods
At the national level, the PBN study used a “one-to-many” longitudinal mixed-method design—this means that both the qualitative and budget components ran over the same 2-year period but used a different time scale, as shown in Figure 1. 28
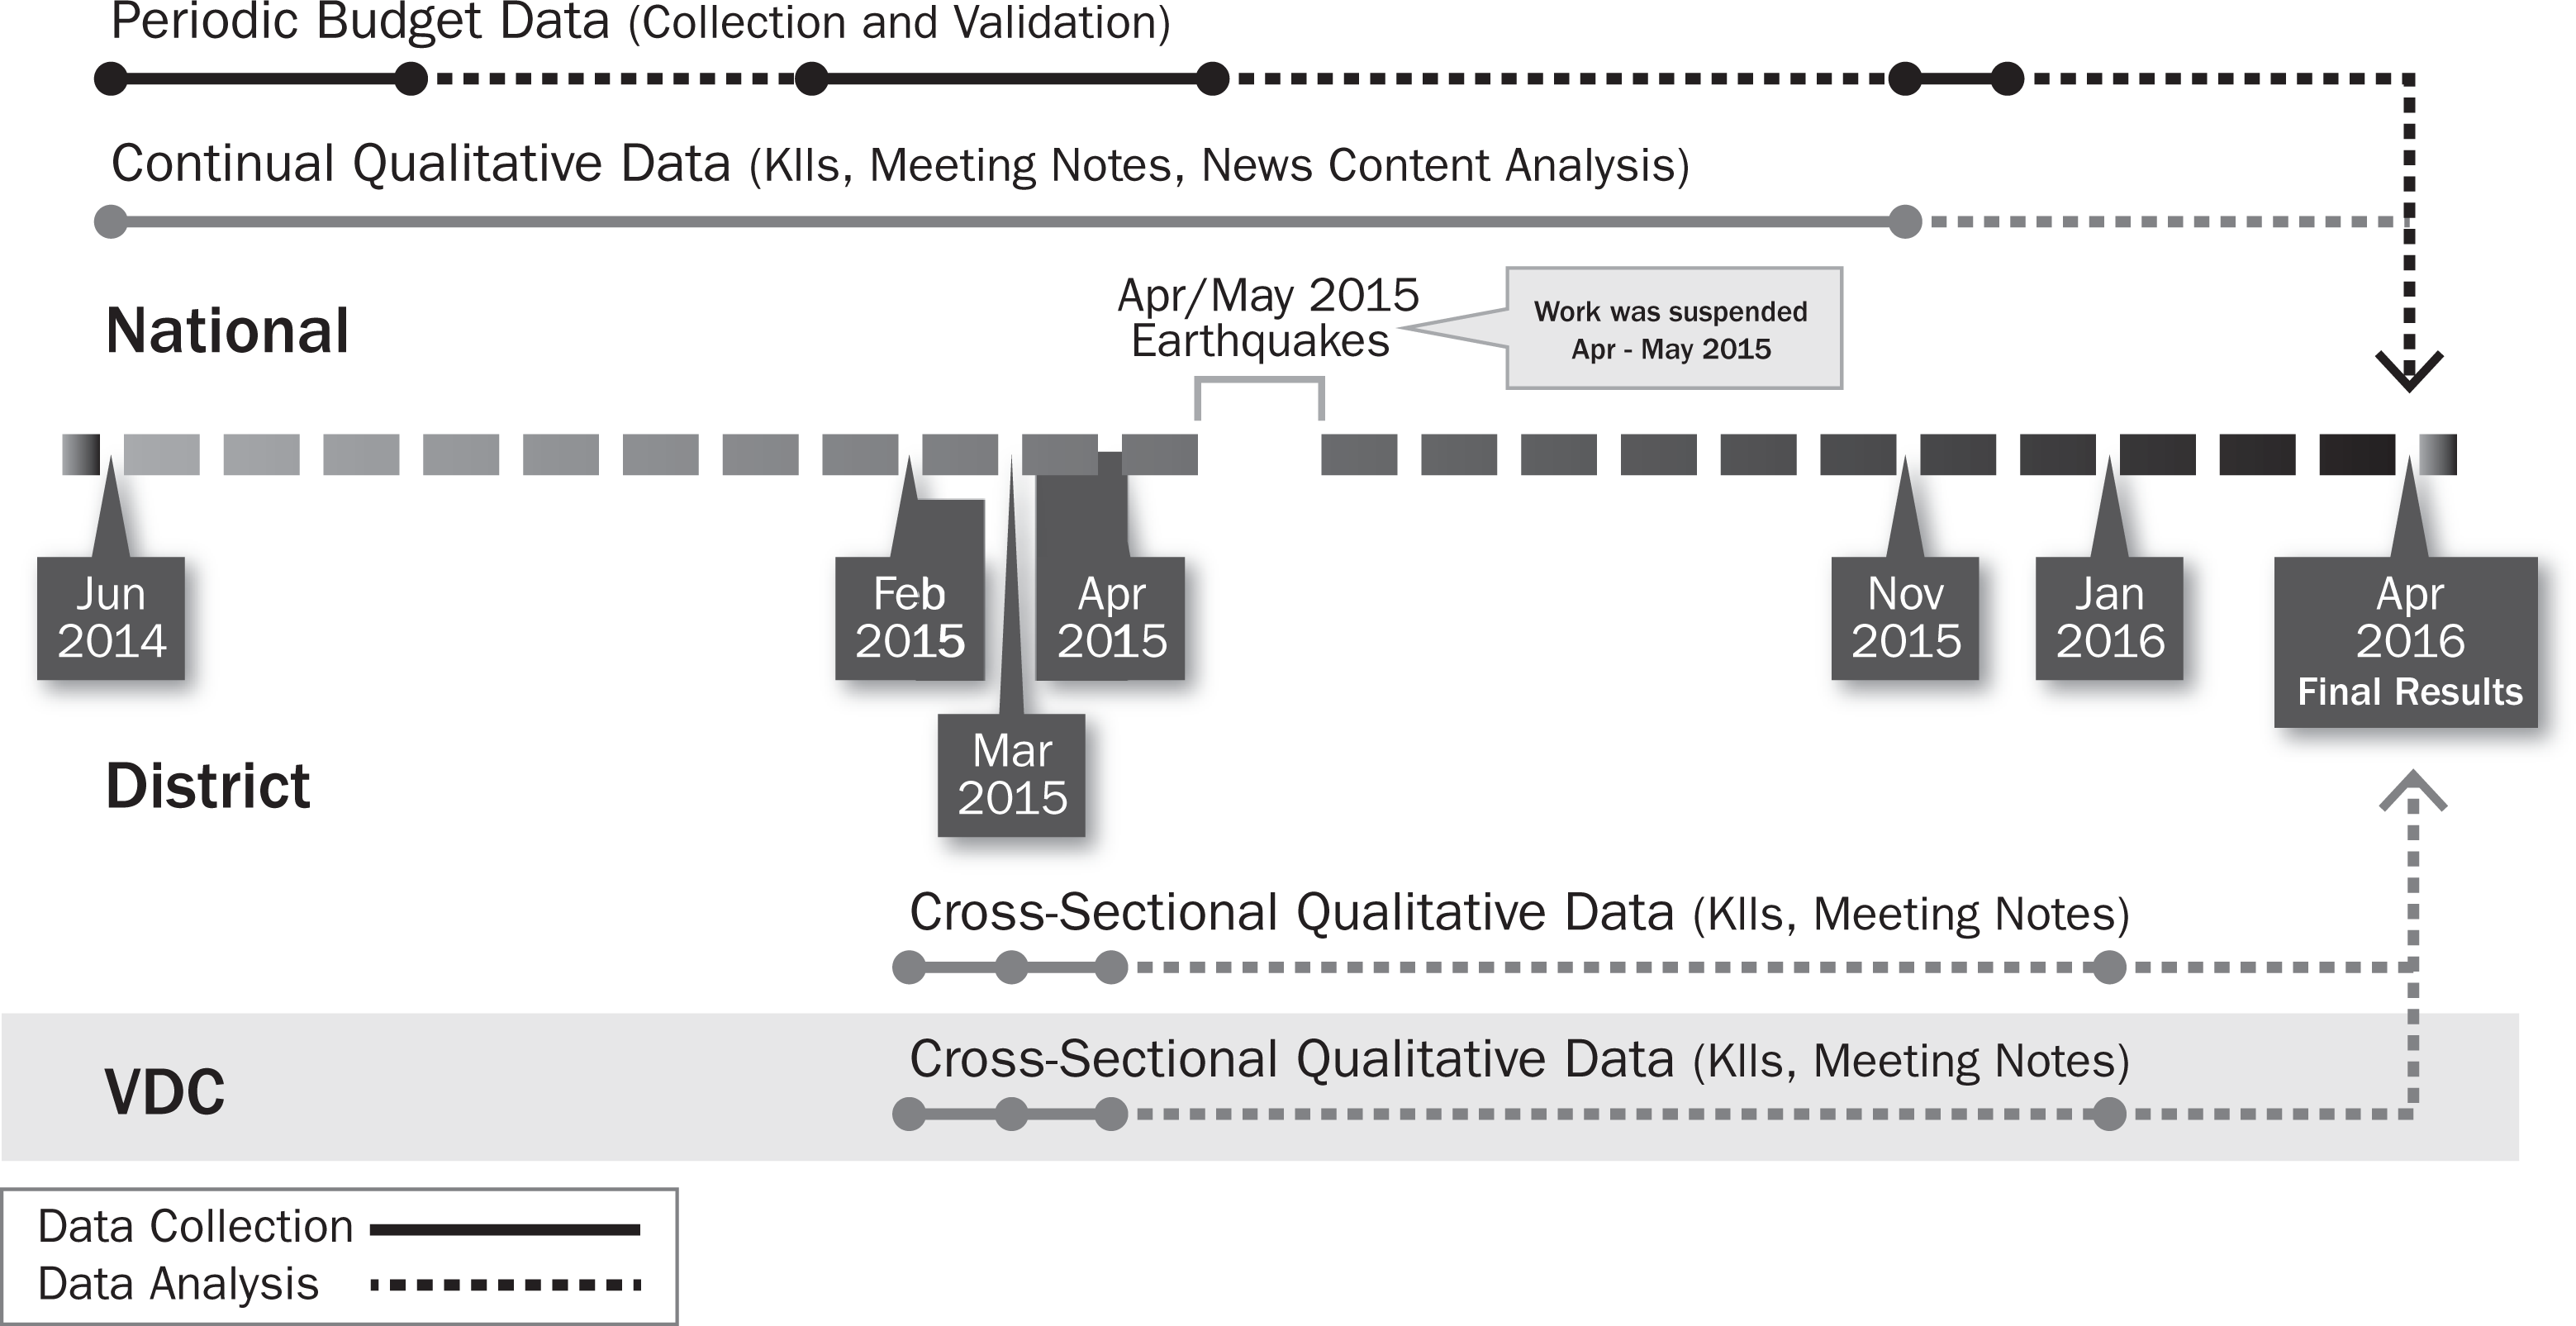
Timeline and levels of the study.
Budget data were collected yearly, whereas qualitative data were collected as often as weekly and at least quarterly. At the district level, we planned 2 repeated cross sections, though our second round of data collection was truncated due to earthquakes in the Spring of 2015, which suspended field work at all levels, and a blockade of the Indian border restricting travel to some southern districts between September 2015 and February 2016. 29
The NPC was consulted on the timing of the study, relevant study areas, and the confirmation of sectors to be included. See Pomeroy-Stevens et al (2016) for full details of the data collection, validation, and analysis for each of these data sources. 30
Study Participants
Nationally, the study was designed to follow 6 distinct stakeholder groups, as categorized by the SUN Movement in 2012. 31 These include government, donors, UN groups, civil society organizations (CSOs), academia, and the private sector. The last 2 could not be followed for the budget portion of the study.
Within government, we selected representation from each nutrition-related ministry and representation from policy and oversight bodies related to the MSNP (NPC, National Nutrition and Food Security Secretariat [NNFSS], Ministry of Finance [MoF], and any related Parliamentarians). The MSNP-related ministries included Ministries of Agriculture Development (MoAD), Education (MoE), Health (MoH), Federal Affairs and Local Development (MoFALD), and Urban Development (MoUD). The Ministry of Women, Children, and Social Welfare was included into MSNP activities after the plan was launched. All nongovernment stakeholder groups will be referred to as EDPs for the remainder of this article.
Three case study districts, Achham, Parsa, and Kapilvastu, were selected to provide a subnational perspective. These districts were selected as 3 of the 6 MSNP “prototype” districts. One of 2 prototype VDCs were also selected from each district. We followed the same stakeholder groups in our districts and VDCs, with some modifications. First, all members of the district development committees and equivalent VDC committees were included. Second, few donor and UN agencies had district-level representation, so instead we selected representatives of key projects funded by these agencies. Third, community-level opinion leaders and community-based organizations were also included.
At all levels, stakeholders were selected purposively to represent all those holding formal nutrition positions within the MSNP, ministry, and/or organizational structures. We followed these positions, so if the incumbent of a position changed during the study, we began following the new position holder. This was true for both qualitative and quantitative data collection. Full details of the number and dispersion of stakeholders across groups and time are available in the Supplemental Annex and in the study of Pomeroy-Stevens et al (2016). 30
Qualitative Methods Summary
Collection
Qualitative data were collected across 3 sources. Interviews and observation
Two rounds of structured key informant interviews were conducted with 44 national-level stakeholders. Semi-structured follow-up interviews were also conducted quarterly in the intervening period, depending on news and events. Observation of turnover in position holders was also recorded. In the Districts and VDCs, 1 point-in-time structured interviews were conducted with 55 district and 30 VDC-level stakeholders in early 2015; modified follow-up field visits were done in early 2016 in each district and VDC to validate interview results, receive rapid feedback, and collect informal interviews on any changes since the first interviews.
News content analysis
Weekly news searches were conducted for 7 news outlets, using a set of search terms to identify activities, events, and actions related to individual and institutional nutrition stakeholders in all 6 groups, nationally and in our 3 districts. In total, 281 articles were included via this source.
Nutrition-related meeting notes
Study team members tracked official MSNP stakeholder meetings and notes from other nutrition-related meetings, trainings, or workshops. We also noted any new or changed activities listed in these documents. 71 national documents were added via this source.
Analysis
Final data processing and analysis were conducted in NVivo 10.
32
To identify changes over time, we developed a grid-style template that allowed analysis of stakeholder group data over multiple time points and all emergent themes. Within themes, we acknowledged that change had occurred if evidence between 2 or more time points showed the following tangible markers of change: Stakeholders noted changes in their own or others’ perceptions, attitudes, or knowledge; Stakeholders noted changes in their own or others’ behavior; Observed changes in organizational structures, priorities, strategies, or hiring practices; change in a policy or guideline (new or existing); political shifts; or new positions or change in position; Observed changes in implemented activities (both new activities and increased emphasis in existing activities) or funding (both new funding and increases in funding for existing line items).
Validation
We provided a written summary of preliminary qualitative findings to NPC quarterly, and dissemination and validation meetings with all stakeholders were held at the end of year 1 and after the close of data collection in year 2. District and VDC validation was completed in early 2016.
Budget Methods Summary
Our budget analysis methodology included 3 distinct phases: collection, validation, and analysis. Validation was completed prior to analysis to fill data gaps found during data collection. Data were cross-checked across sources to avoid double counting of funds.
Collection
We followed all 117 activities named across 8 output areas in the MSNP consolidated action plan. We searched for allocations and expenditures from the same set of activities every year, supplemented with information from the qualitative data.
For on-budget funds, which are GoN and EDP funds run through the government budget (including both on- and off-treasury EDP funds): National on-budget data came from the approved Estimates of Expenditure (“Red Books”); any available work plans or descriptions of activities sourced from planning and technical offices in the 7 MSNP-related sector ministries. In total, 40 budget headings were found. In the 3 case study districts, MSNP line item data came from MoFALD internal budget documents and district-level budget memos.
For off-budget funds, which are EDP funds run outside the government budget: For national off-budget data, our main source was the Aid Management Portal (AMP; overseen by MoF’s Office of International Economic Cooperation Coordination Division). Off-budget content in this portal is entered by EDPs and updated 4 times a year (Note 1). We searched an initial list of 1100 entries for the 2013 to 2014 and 2014 to 2015 fiscal years and an additional 210 entries for the 2015 to 2016 fiscal year. A total of 121 EDP projects were selected. No district level off-budget funding was collected for this study.
Validation
Nationally, we conducted in-depth validation interviews with all relevant budget planning offices as well as selected EDPs to confirm the following for each budget line item or EDP activity: objectives, relevance to MSNP, percentage related to nutrition, and nutrition-specific or nutrition-sensitive designation (Note 2). 12 Some EDPs participated in this validation via e-mail, whereas the remainder of EDP activities (90%) were validated by online project document review to answer these same questions.
Analysis
These data were analyzed in Excel 2010 and Stata 13. 34–36 Data were reported in both Nepali Rupees (Rs) and United States dollars (USD). Interbank exchange rates and inflation rates from the Nepal Rashtra Bank were used for the conversions, averaged over each fiscal year. Data adjusted for inflation at the last year of analysis.
Ethical Approval
The study protocol was approved by the institutional review boards of Nepal Health Research Council and the John Snow, Inc (JSI), Boston, Massachusetts.
Limitations
We faced several limitations in collecting these data. The first is the truncated second round of district- and VDC-level data collection due to the earthquakes and the blockade. We addressed this by doing abbreviated field visits after final national data collection to collect rapid group feedback from our district and VDC stakeholders and conduct some informal interviews to assess any major changes since the 2015 interviews. Second, sharing preliminary qualitative data can be complicated—we took into account feedback to make our work more accurate and relevant to current events but did not make any changes to groups or stakeholders and were not asked to censor any findings.
Regarding these budget data, while the AMP has been rapidly improving since its inception, there were still major gaps in reporting of yearly figures—over 80% of off-budget projects in 2015 to 2016 were missing actual yearly commitments or disbursements and required imputation from total project commitments. The UN groups in particular regularly underreported. In addition, we could not break down figures below the activity level, meaning we do not know how overhead, personnel, and unit costs differed by funder or funding mechanism. Finally, conducting validation interviews over multiple years means we may have increased nutrition awareness of our stakeholders and the accuracy of the figures. This could lead to inflated figures in the later years. However, the only changes to percentages came from changes to totals in actual subheading budgets or other objective data sources—all percentages based on stakeholder estimation stayed constant over time.
Results
We summarize our results by the 4 key study areas:
Understanding
In general, evidence points toward widespread improvement in understanding and knowledge of the MSNP and multisectoral nutrition actions, both nationally and in the 3 case study districts. There were also small improvements in knowledge of stakeholder roles and responsibilities but not among the private sector or academia. Understanding was substantially lower in the VDCs visited—little had been done to orient VDC stakeholders to MSNP. Full details on this first study area can be found in Pomeroy-Stevens et al (2016), but this article will focus on changes in the last 3 study areas pertaining to the enabling environment, including prioritization and financing.
Key Factors in the Enabling Environment
Positive changes in certain factors can strengthen the enabling environment for nutrition action. We identified key factors by considering the answers given for why nutrition priority and funding did or did not improve over time, as well as responses to specific questions about what challenges stakeholders faced. Factors mentioned most often by stakeholders are listed in Table 1.
Key Factors Most Often Mentioned by Stakeholders.
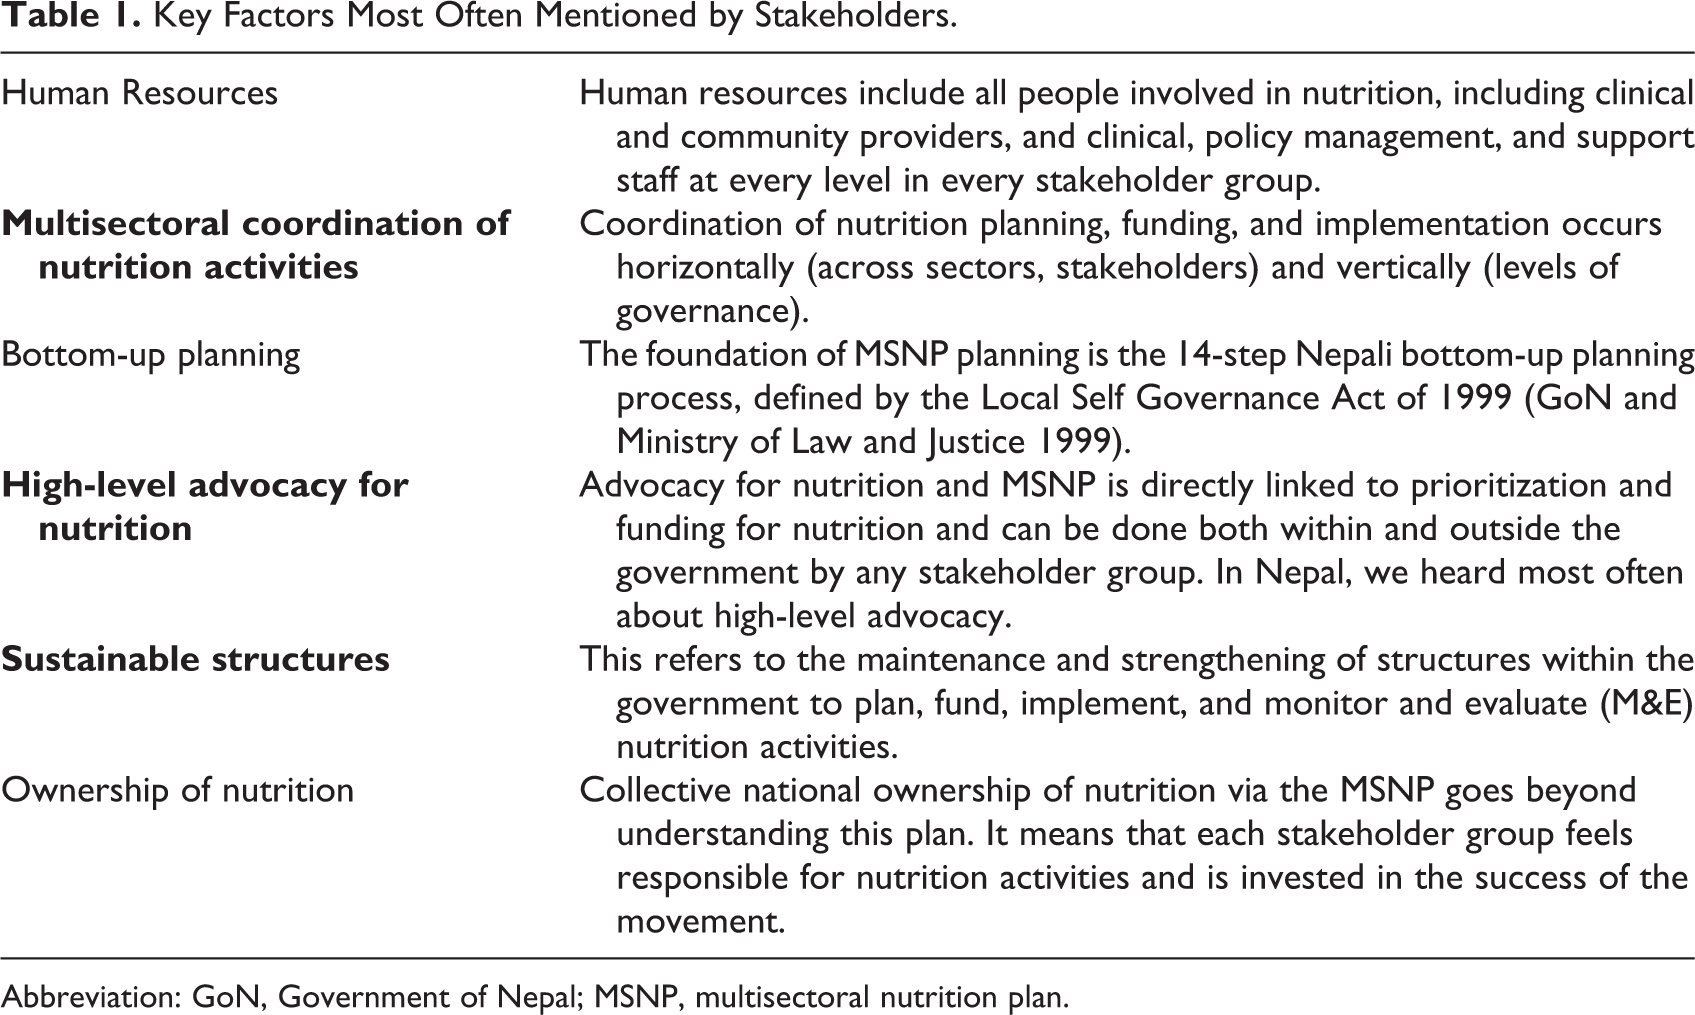
Abbreviation: GoN, Government of Nepal; MSNP, multisectoral nutrition plan.
We found evidence of improvements over the course of the study in the factors indicated in bold face—there were a greater number of positive changes in these 3 factors over time and also some critical actions that shifted the status quo for those factors. 30
Some of the most meaningful markers of change within multisectoral coordination included the increased functionality of several of the NNFSS MSNP working groups. Not only did stakeholders note that these meetings had become more regular but they also spurred a greater number of follow-up activities, such as MSNP trainings, strategy development, and advocacy campaigns. Government and donor stakeholder groups in particular felt that coordination at the national level had improved over the course of the study, and many attributed it to the MSNP structures, particularly the placement of NNFSS in NPC and the creation of active working groups across stakeholder platforms. However, academia and the private sector involvement in coordination activities remained relatively unchanged over the course of the study. Within 2 of the 3 districts visited, we heard that coordination worked well—“Coordination in the district is good. There is no difficulty. Meetings of the nutrition steering committees are frequently conducted every three months.” (district government stakeholder). However, at the VDC level, we heard in our 2015 interviews and anecdotally during follow-up that nutrition coordination mechanisms within VDCs were not functioning. Vertical coordination (from national to district to VDC and below) was consistently noted as a barrier at every level.
All stakeholder groups except the private sector provided examples of improvements in high-level advocacy throughout the study. Most examples occurred in the second half of the study period except for the multigroup effort to lobby for a dedicated MSNP budget line item in 2014. Another notable change was the finalization of the MSNP communication and advocacy strategy around the middle of the study period. This was used by the NNFSS-led communications and advocacy working group to mobilize parliamentarians and policy makers to increase their commitment to nutrition and the MSNP later in the study period. Although some barriers still remained, most MSNP stakeholder groups both understood the importance of and participated in advocacy for nutrition. The end game for most advocacy efforts also seemed to be clear to MSNP stakeholders—“Advocacy is major part because it is about high-level authority. If we are able to advocate the situation then it will facilitate to allocate the money.” (national government stakeholder).
Regarding notable changes in sustainable structures, the most meaningful was the creation of the MSNP budget line item. This was instituted for the 2014 to 2015 fiscal year to provide a dedicated funding for nutrition activities in the 6 MSNP prototype districts, which has now expanded to cover 7 more in the 2015 to 2016 fiscal year (Figure 2).
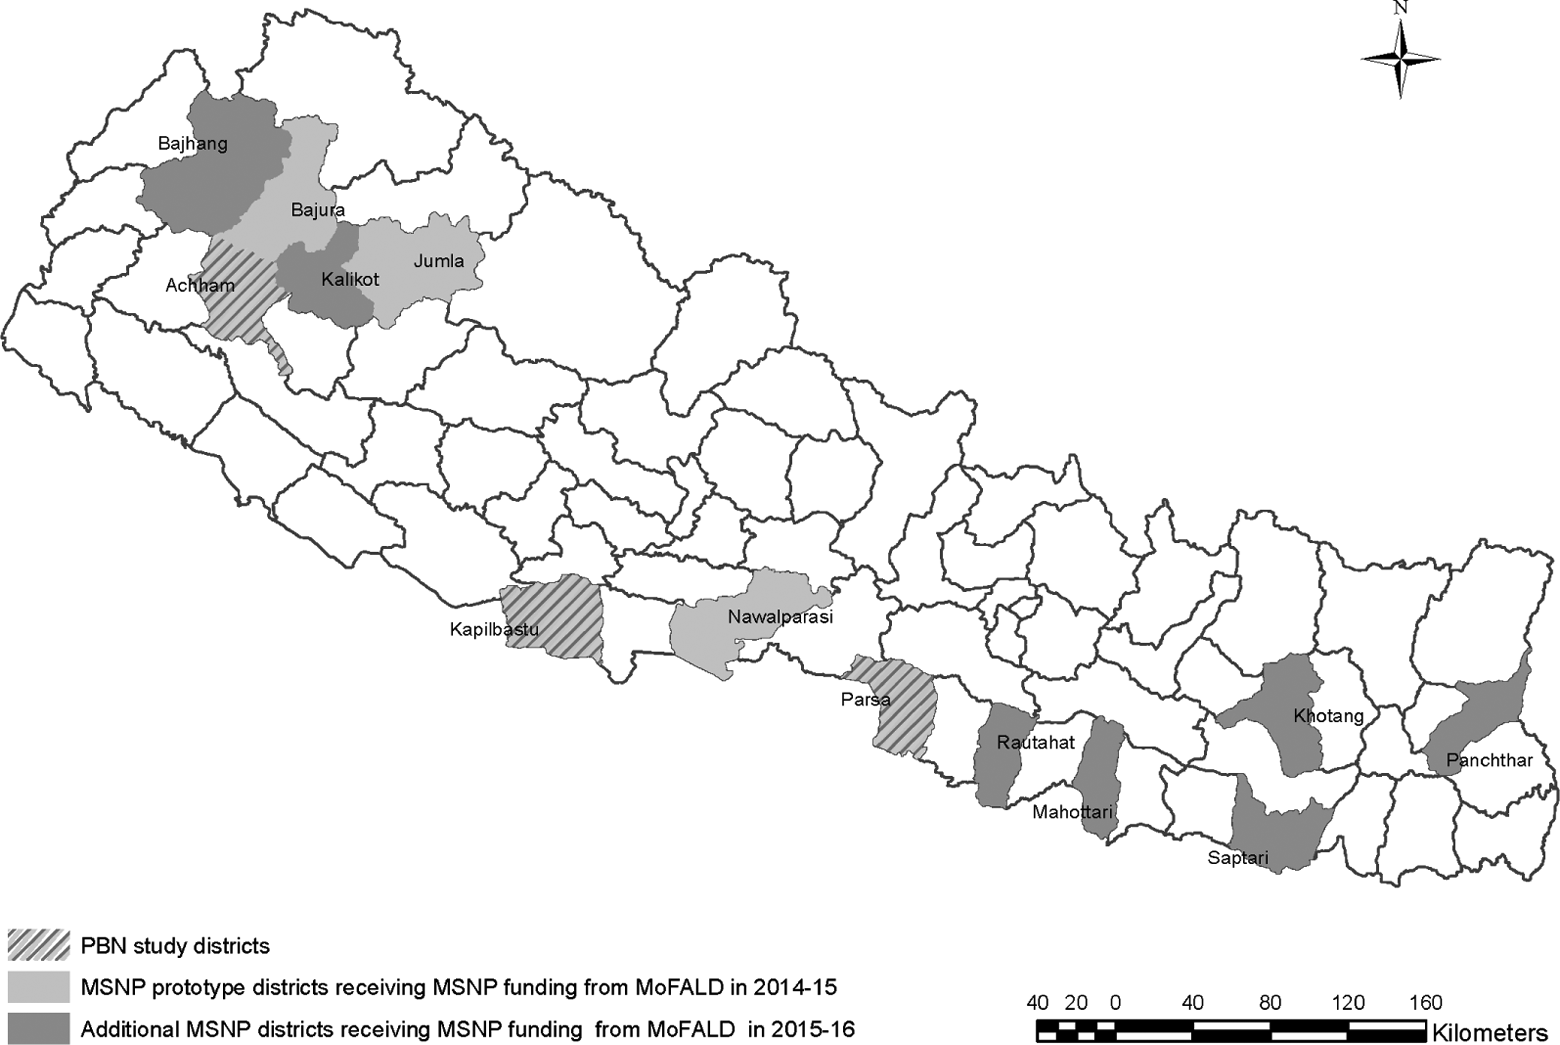
Map of districts receiving multisectoral nutrition plan (MSNP)-specific funds.
Government planning structures also improved, with 4 of the 6 ministries revising their own sector policies in consideration of the MSNP, and some included nutrition as part of their periodic review meetings. However, monitoring and evaluation structures for the MSNP seemed to lag behind; we heard throughout the study of an unmet need by various stakeholder groups for feedback mechanisms and a monitoring system for the MSNP. “It’s always anecdotal, OK, MSNP came and then we improved, but [how] much did MSNP improve?” (national UN stakeholder).
The remaining 3 factors identified had some positive changes but were still more likely to be noted as a barrier than an enabler by the end of the study:
Human Resources: High staff turnover affected almost every level and every stakeholder group—“In the government, those who are assigned in the position will not have known anything, not even an “n” of the nutrition. Then again by the time you make them aware, understand, they will get transferred and you have to restart all over.” (national CSO stakeholder). Also, in all 3 study districts and VDCs, we heard of a lack of nutrition staff for implementation of nutrition activities.
Bottom-Up Planning: We heard across the study period that the national-level ministries were not seriously considering the plans and budgets sent up from the bottom level or providing enough time for planning—“If you visit the people and ask them to prepare a plan in two hours, what can we expect the plan to be?” (district government stakeholder). Even when lower-level plans were considered, district- and village-level stakeholders often were not demanding nutrition activities.
Ownership of Nutrition: Many stakeholders (particularly in study districts and VDCs) mentioned the reason for lack of ownership was weak connection between the national stakeholders and those at the level of implementation (VDCs and below). Other reasons given for lack of ownership of MSNP and the nutrition cause included poor outreach to academia and the private sector; channeling of MSNP line item funds through just 1 ministry (MoFALD); and heavy donor involvement in some key MSNP activities that dissuaded government stakeholder engagement.
Measurable improvements in enabling factors over the 2 years of this study can be linked to the extent to which stakeholders were able to effectively prioritize and fund nutrition activities, as can remaining barriers.
Prioritization of Nutrition Actions
We defined prioritization as the process of deciding which topics, programs, or activities are most important to include in annual work plans. Nationally, we looked for the same tangible markers of change as listed in the Methods section, with some additional priority-focused criteria: Inclusion of nutrition as a priority in a strategy and investment document; Creation of a nutrition and/or food security unit, division, or department or addition of a major nutrition initiative or program; Inclusion of nutrition within regular sector/organizational review processes; Explicit discussion of planning for nutrition that would imminently result in one of the above; or New or expanded nutrition activities included in the next year’s work plan.
This helped us to determine the extent to which nutrition was prioritized by each stakeholder group. We found that there were tangible improvements in the prioritization of nutrition action during the course of the study within the government among the all 5 criteria and some positive change among EDPs in criteria 2, 4, and 5.
Government
When compared to responses from earlier in the study, we saw tangible markers of improvement in the priority of nutrition in 4 of the 6 ministries. Three sector ministries (MoAD, MoFALD, and MoH) had nutrition as a named priority in their official sector strategy by the end of 2015, and an additional sector (MoE) had named nutrition as a core theme. These changes in strategy were preceded by other related changes—some notable examples where MSNP was influential include: A new food and nutrition security section was formed within MoAD in 2014 (though human resource issues affected this section early in the study). This section is now active in nutrition advocacy within the ministry. The MoFALD helped launch the nutrition and food security committees in several prototype districts to support nutrition priority setting during bottom-up planning and was also developing district MSNP implementation guidelines. By 2015, MSNP activities and nutrition were discussed as part of the national MoH review meetings.
Stakeholders in all but 1 ministry identified increased coordination as an influence on prioritization of nutrition. Insufficient human resources and ineffective bottom-up planning were often mentioned as hampering priority setting. In the 3 study districts, we heard that despite some positive improvement, the priority for planning was still on physical infrastructure (like roads or schools), rather than nutrition. This may be related to concerns about cuts to district and VDC plans by the central level—“If we [district] demand funds for nutrition then there is fear of not getting budget for other physical infrastructure needs. It will be more effective if a framework and budget for nutrition programming comes from the central level.” (district government stakeholder).
External development partners
Donors, UN groups, and CSOs supporting health and agriculture activities saw an overall increase in the level of priority for nutrition. However, donor and UN groups cited the global nutrition agenda—not the MSNP—as the primary reason for these improvements. The CSO stakeholders stated that MSNP had been influential in this change, primarily via its influence in increasing their ownership of the nutrition cause. We saw no tangible changes in priority for the private sector, despite intention to engage at the start of the study. Lack of coordination, ownership, and nutrition capacity among private sector staff were named as related barriers.
New or expanded MSNP activities
The primary new government-funded nutrition activity during the study was the MSNP line item, administered by MoFALD and utilized at the district level, starting in the 2014 to 2015 fiscal year. In addition, MoH realigned some existing The United Nations Children’s Fund funding to cover MSNP district health activities starting in 2014.
Several new or expanded EDP activities were related to the MSNP—indeed, we heard across multiple stakeholder groups of explicit and intentional alignment with the MSNP. “Suaahara mirrors MSNP; it’s a huge program with the funding of 72 million. The activities under the upcoming EU funding will be driven by the MSNP. The Golden Thousand Days program is also driven by MSNP. It is clear that MSNP is guiding nutrition programming and planning in Nepal.” (national UN stakeholder). Table 2 lists all EDP and government MSNP-related projects planned for the fiscal years included in this study. These increases in nutrition activity directly influenced the amount of funding available for nutrition, as outlined in the next section.
Description of New or Expanded Activities Explicitly Aligned With MSNP.
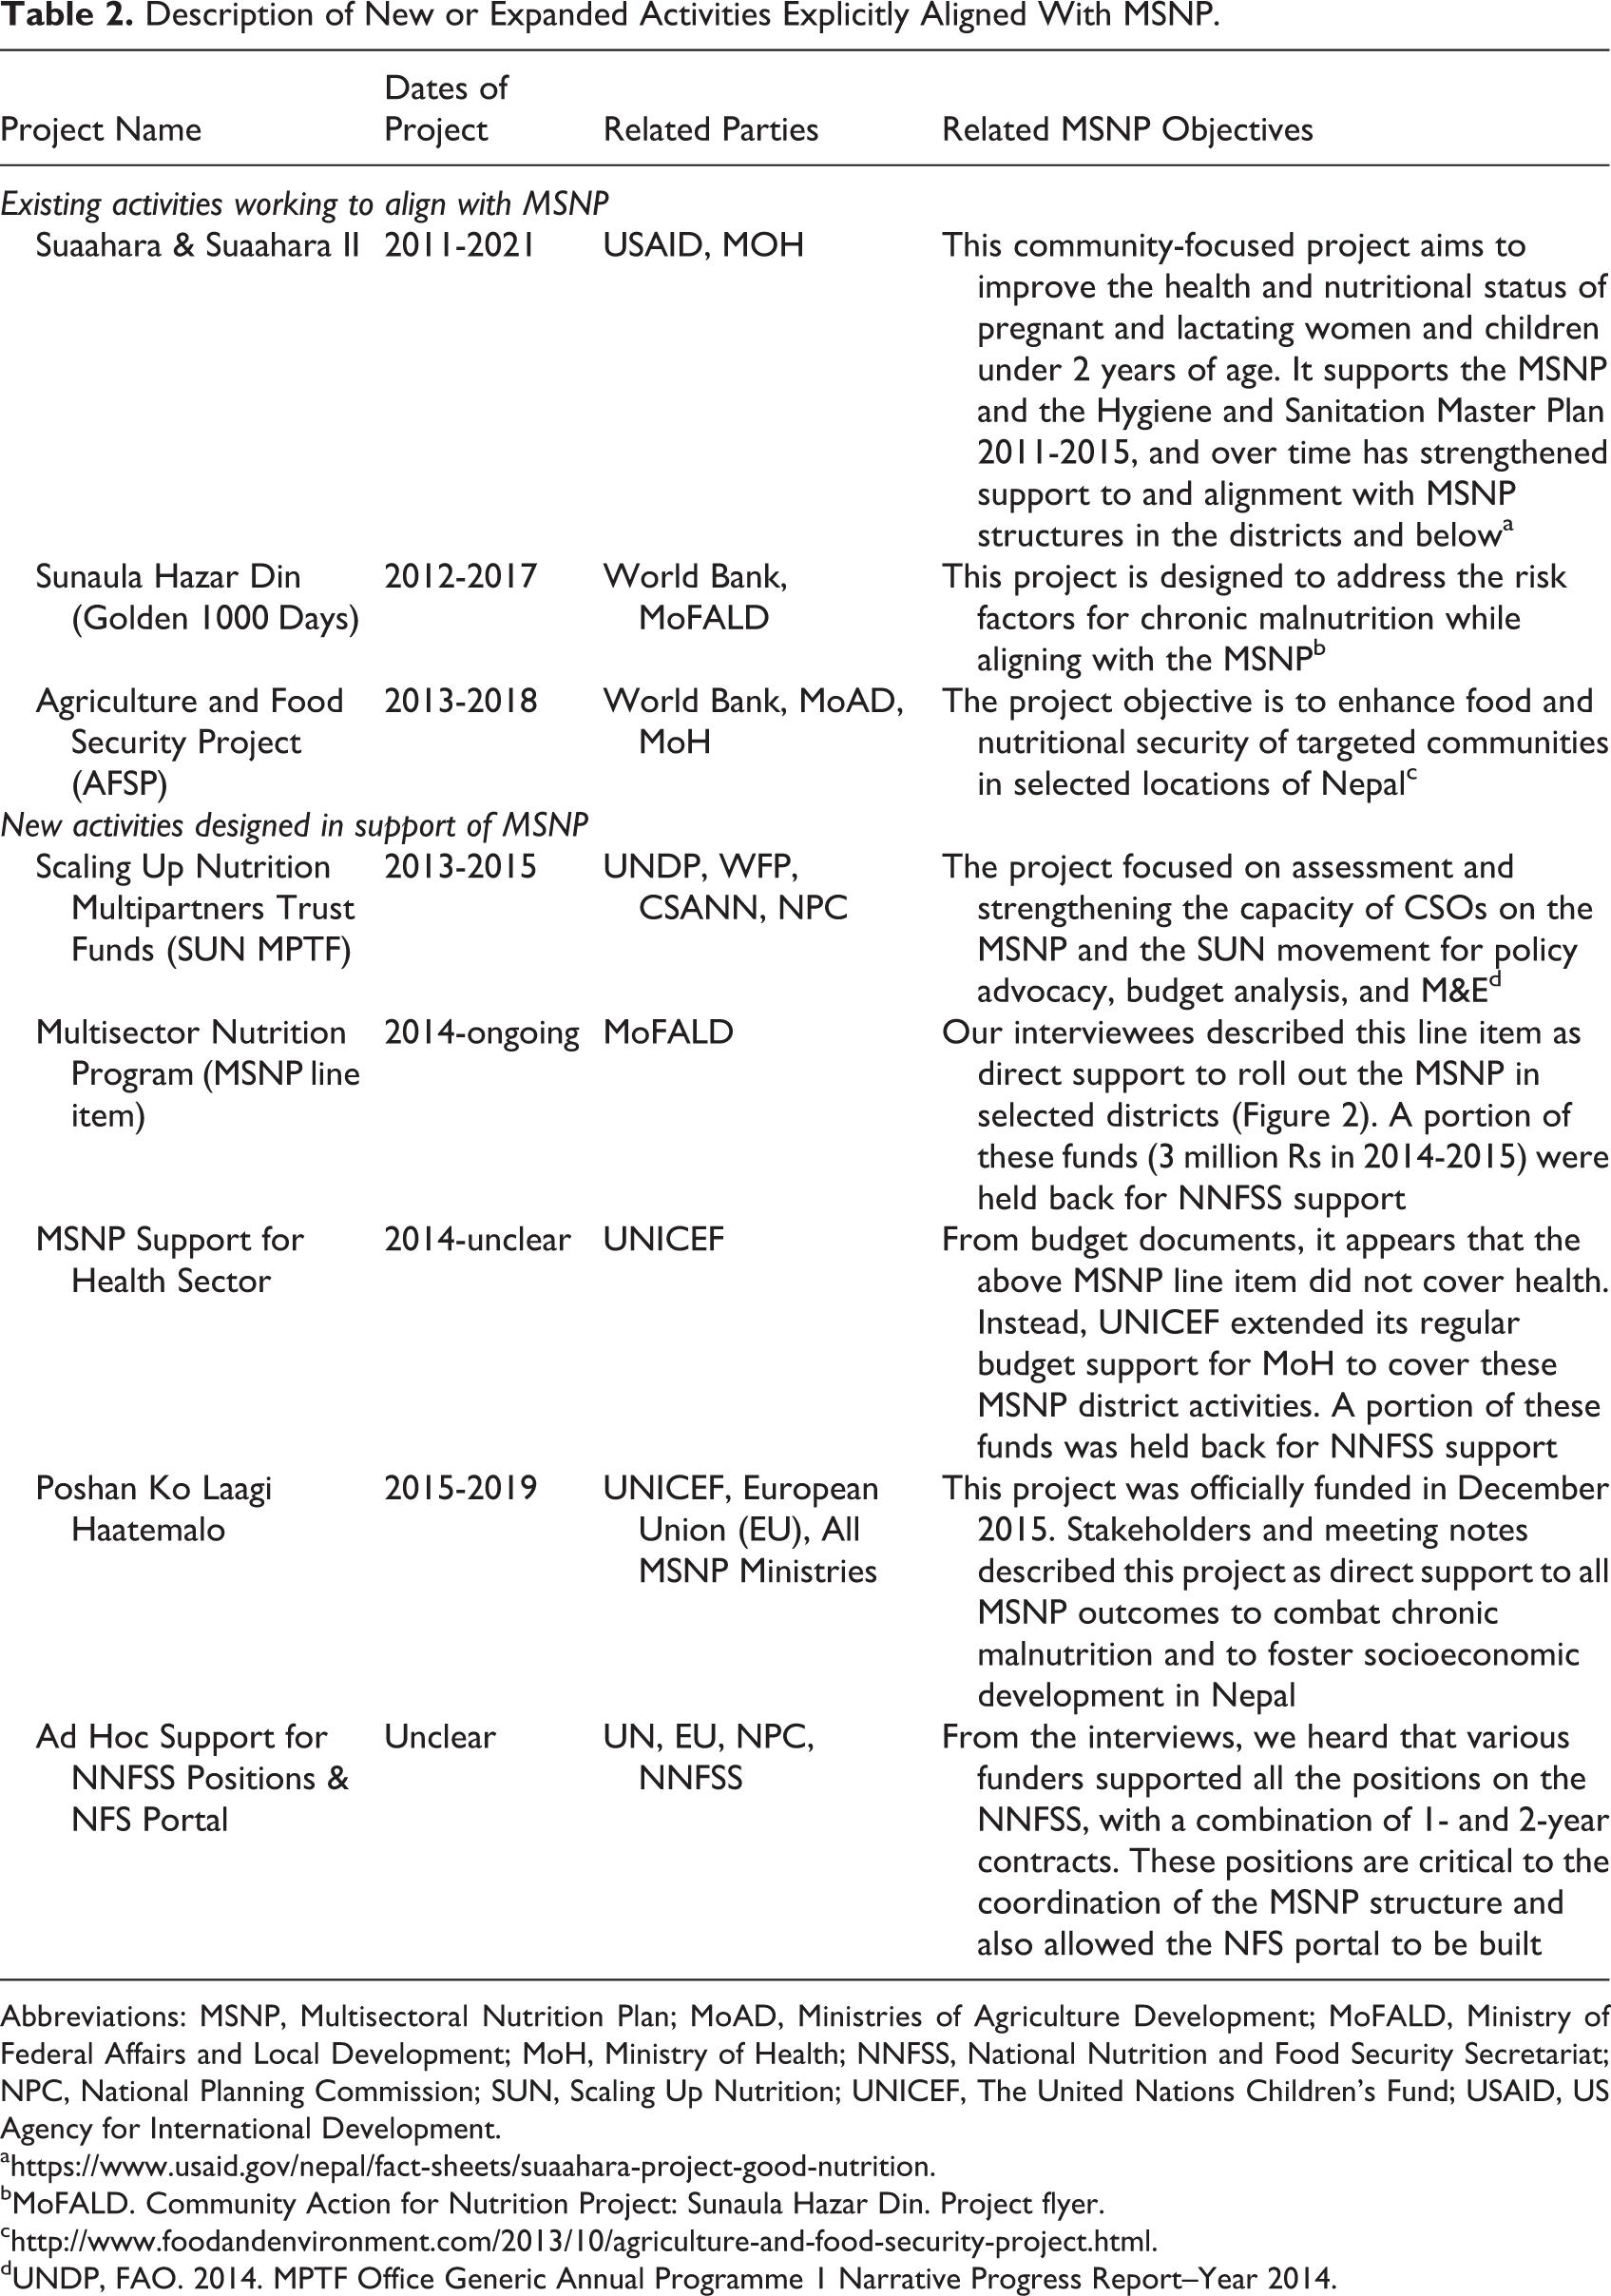
Abbreviations: MSNP, Multisectoral Nutrition Plan; MoAD, Ministries of Agriculture Development; MoFALD, Ministry of Federal Affairs and Local Development; MoH, Ministry of Health; NNFSS, National Nutrition and Food Security Secretariat; NPC, National Planning Commission; SUN, Scaling Up Nutrition; UNICEF, The United Nations Children’s Fund; USAID, US Agency for International Development.
bMoFALD. Community Action for Nutrition Project: Sunaula Hazar Din. Project flyer.
dUNDP, FAO. 2014. MPTF Office Generic Annual Programme 1 Narrative Progress Report–Year 2014.
Funding for Nutrition
We found real yearly increases in nutrition-related funding between 2013 to 2014 and 2015 to 2016 of about 17%. Total nutrition funding was fairly equally distributed by funding mechanism (on- and off-budget) and source (GoN and EDP), while there was large variation in allocations and expenditures across sector and MSNP objective area. In addition, we found on-budget expenditure rates were higher for GoN funding than for EDP funding.
Funding for nutrition has increased yearly across multiple funding mechanisms and sources
Figure 3 shows the total (on- and off-budget) nutrition allocations and expenditures for the 3 years included in this study. Combined nutrition allocations in 2015 to 2016 totaled Rs 17 billion (USD 169 million). After adjusting for inflation, the real increase was about 17% per year or ∼35% total between 2013 to 2014 and 2015 to 2016. About one-fourth of this funding (28%) in 2015 to 2016 came from activities listed in Table 2.
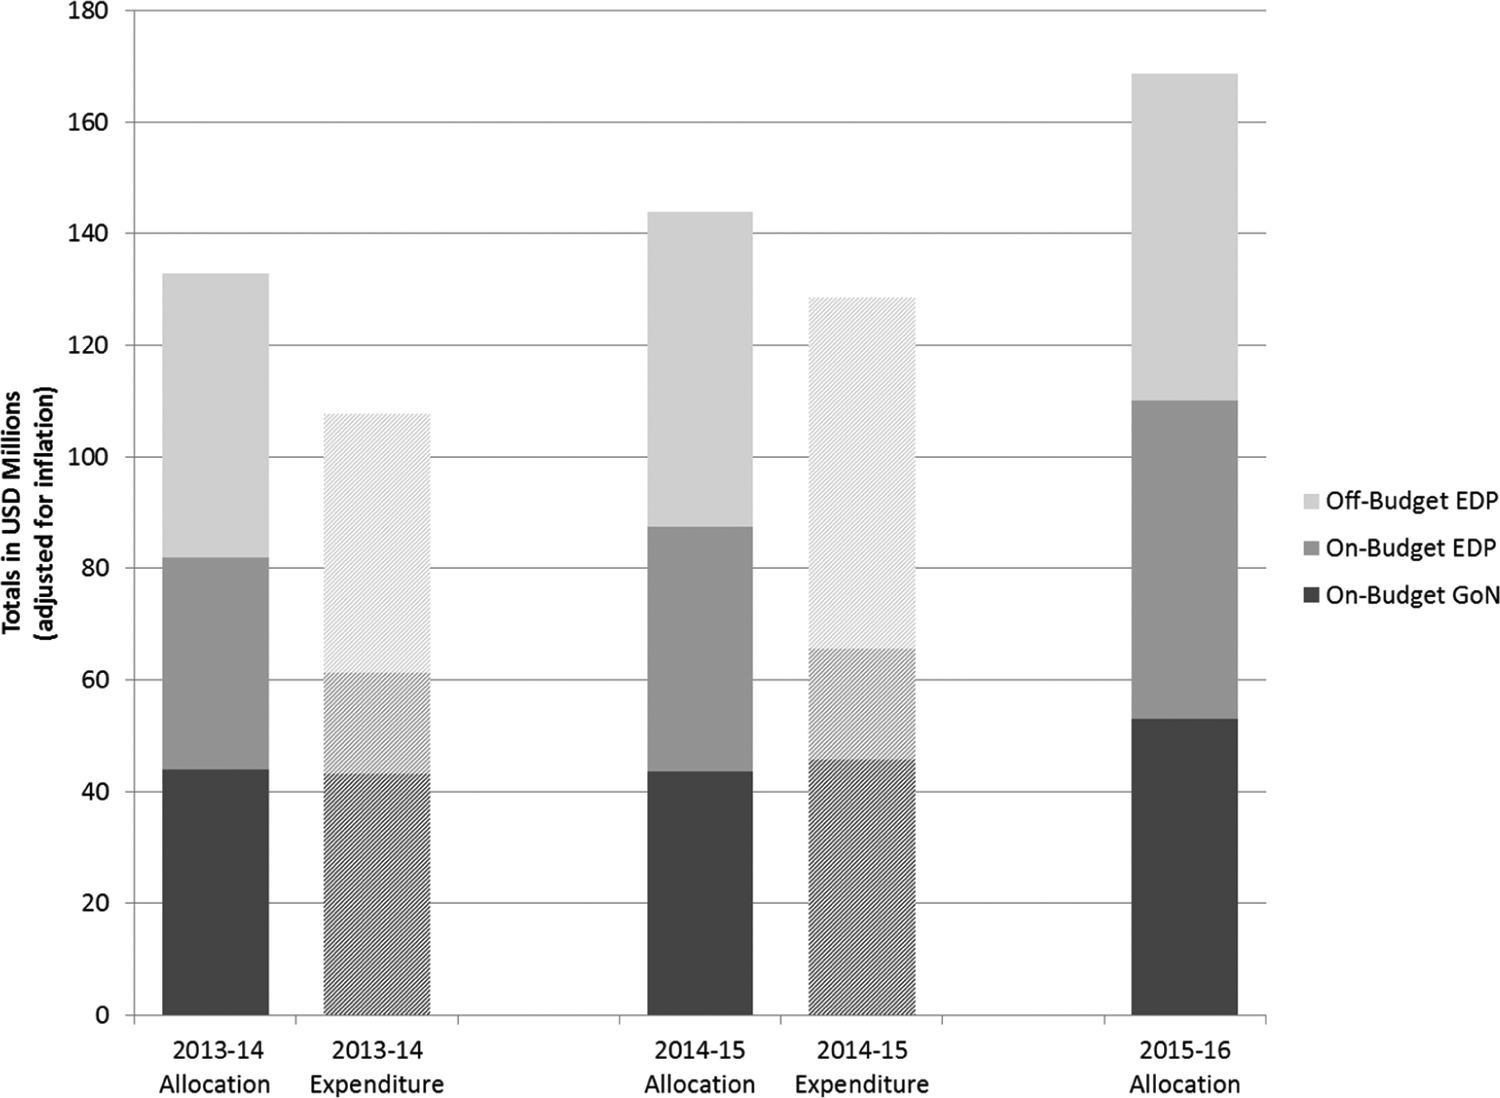
Total nutrition-related allocations and expenditures, 2013-2014 to 2015-2016.
Separating these trends by funding mechanism, on-budget nutrition allocations steadily increased between each year, making up approximately two-thirds of yearly totals. To put this in perspective, on-budget nutrition allocations made up almost 1% of the total GoN Budget in 2015 to 2016. The remainder came from off-budget funding, though increases in these figures may be muted due to missing data on actual yearly funding—in these cases, we extrapolated yearly allocation by using total project commitments divided by the length of the project where those data were available.
Breaking figures down by funding source, GoN funds made up about 30% of all nutrition allocations over time. Approximately two-thirds of GoN nutrition-related allocations each year came from sector ministries, whereas the remainder was estimated to come from grants to district, VDCs, and municipalities. 49% of all EDP allocations were on-budget by 2015 to 2016, an increase from 43% in 2013 to 2014.
Expenditure data are released with a 1-year time lag. On average, 100% of GoN nutrition-related allocations were spent. Average on-budget spending of EDP funds was much lower; just under half of these allocations were expended, whereas estimates suggest that nearly all off-budget EDP funds were spent (all caveats noted on off-budget data quality).
Nutrition allocations and expenditures vary widely by sector
Figure 4 shows the contribution each sector made to national on-budget total allocations. When compared to the expected breakdown of costs projected in the MSNP, only MoAD contributed the expected proportion of funds to MSNP activities—MoH was to contribute almost 50% of total MSNP costs; but in our analysis, it is closer to 12%. Meanwhile, MoFALD and district-level funding was projected to contribute 3% of costs, but we found them to be the largest contributor of nutrition-related allocations, at around 60%. The MoE and MoUD both had lower than expected contributions (Note 3). 3
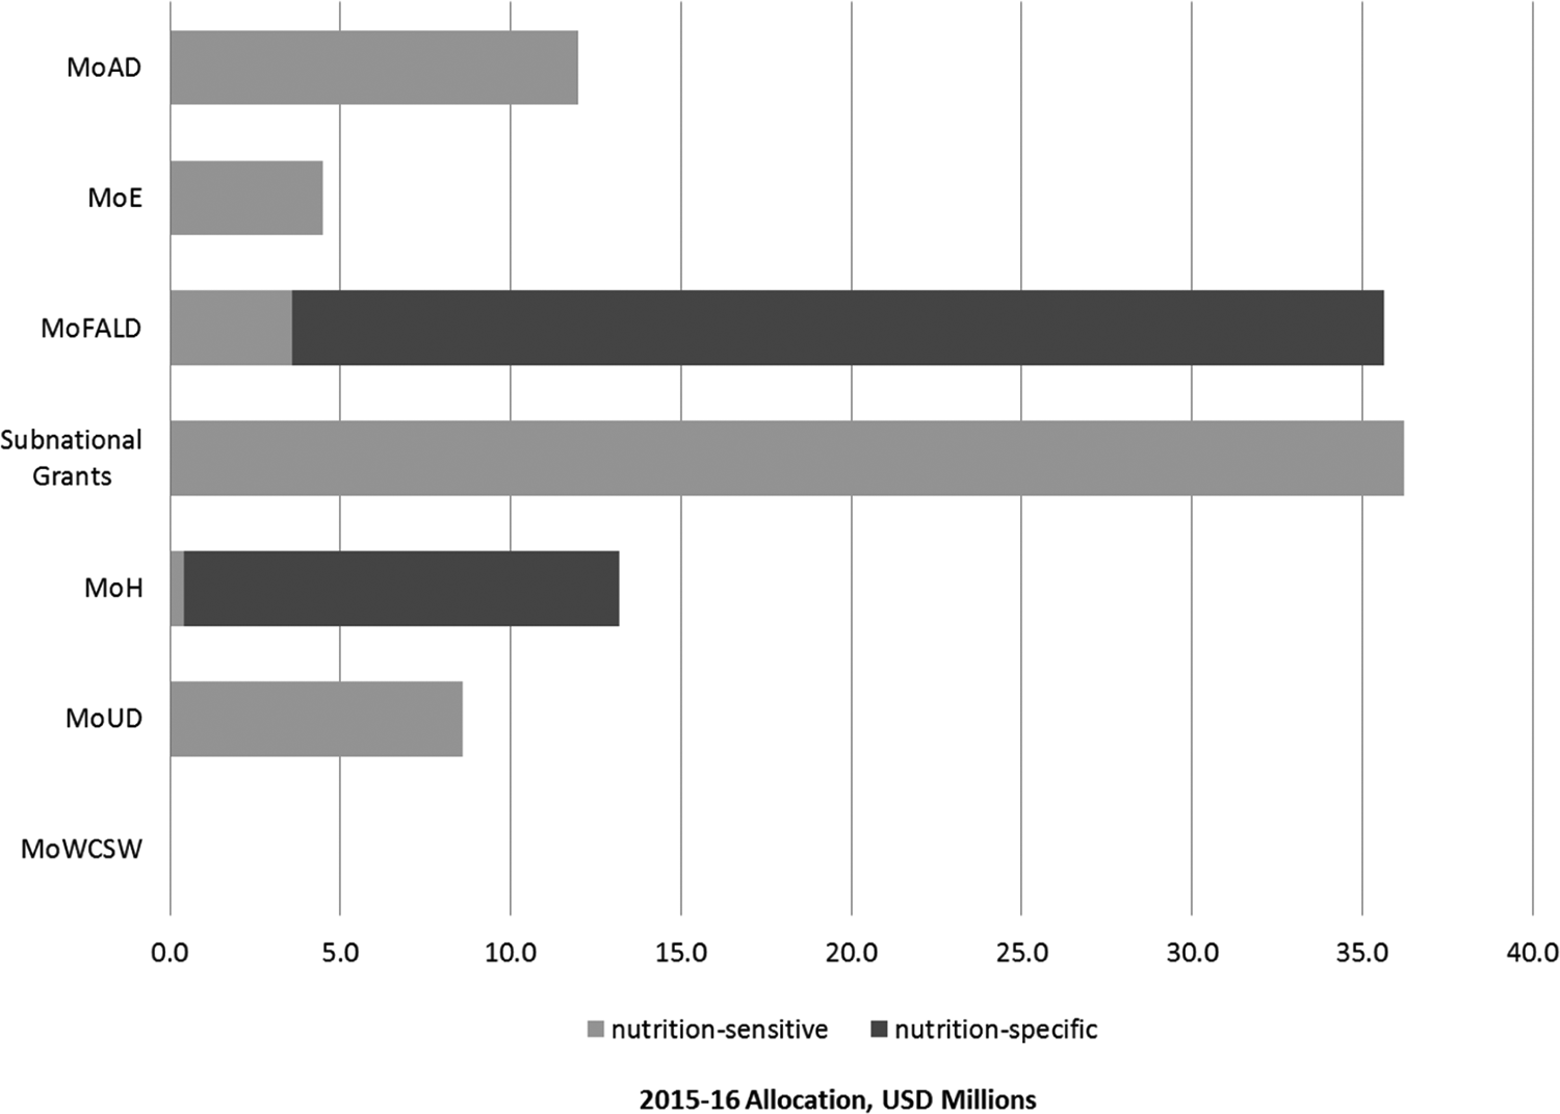
2015 to 2016 On-(government and external development partner [EDP]) budget allocation for nutrition, by sector.
In terms of volume of financial contributions in the last year of analysis, MoFALD provided the highest nutrition-related allocations, with and without subnational grants. The MoH provided the next largest contribution to nutrition-related funding, with MoAD close behind. The MoFALD and MoAD both increased nutrition allocations over time, whereas MoH saw a real decrease of 25% in nutrition allocations during the study period. 97% of MoH funding was nutrition specific.
Subnational grants are often overlooked in estimations of nutrition financing. From both this study and the sister PBN study in Uganda (described elsewhere in this Supplement by Pomeroy-Stevens et al, 2016), we find that these funding flows for nutrition are quite substantial but very difficult to estimate. Nepal’s municipal, district, and VDC subnational grants are unconditional, meaning they can be spent at the grantee’s discretion, making it impossible to validate nationally. We took a conservative percentage of these grants of 13% based on district analysis done in Uganda, but this could be higher or lower depending on lower government priorities. Most conditional subnational funds (for instance, the MSNP line item) were funded through discrete budget headings, making it easier to validate percentages and attach to sectors and activities.
Off-budget allocations primarily came from EDP projects related to the health, agriculture, and water, sanitation and hygiene.
Table 3 breaks down expenditure by sector and source. The high average spending rates of GoN funds seem to be primarily driven by overspending of MoFALD allocations, though nearly all sectors had higher GoN spending than EDP on-budget spending in 2015 to 2016.
Expenditure Rates by Sector.
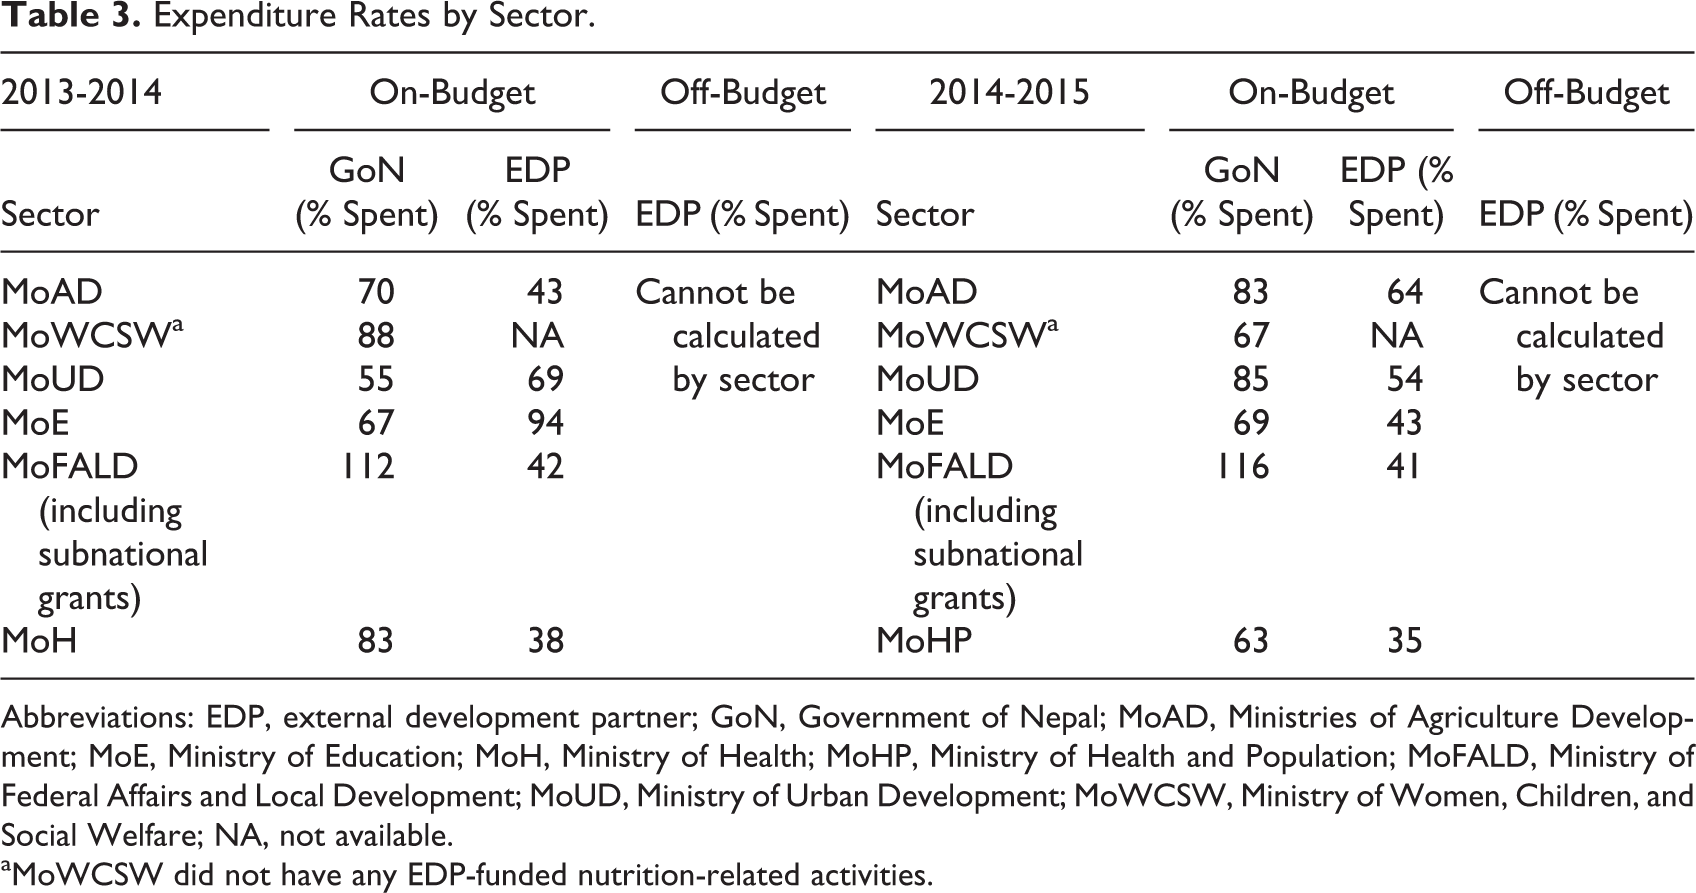
Abbreviations: EDP, external development partner; GoN, Government of Nepal; MoAD, Ministries of Agriculture Development; MoE, Ministry of Education; MoH, Ministry of Health; MoHP, Ministry of Health and Population; MoFALD, Ministry of Federal Affairs and Local Development; MoUD, Ministry of Urban Development; MoWCSW, Ministry of Women, Children, and Social Welfare; NA, not available.
aMoWCSW did not have any EDP-funded nutrition-related activities.
From our interviews and the news content analysis, 2 primary reasons appear to be causing the gap in sectoral on-budget spending for both GoN and EDPs.
Delayed release of funds: Sector ministries authorize spending after the start of the fiscal year; but in some cases, this can be delayed for many months, reducing the time available to complete the work. This issue affects much of the Nepali budget.
13
Frequent staff transfers also slowed release of funds.
Procurement delays: Stakeholders noted that for community-led projects in particular, any given project can be delayed during the bidding and proposal process. This delays spending and reduces the amount of time to spend those funds within the fiscal year.
The effect of the earthquake on spending is unclear. We heard that it impeded implementation of some routine activities, but we heard in other interviews that funds were shifted from underspent activities to be utilized for disaster relief. 37
Allocations do not align with planned costs by MSNP output area
We can try to identify funding sufficiency and efficiency of allocation by comparing allocations to the projected costs for each MSNP output area, estimated in the MSNP costed action plan. 6,38 Allocations appear more than sufficient to cover projected costs. However, allocations do not always align with the relative priority given to each objective in the costing exercise. We see some mismatch in relative proportions, as seen in Figure 5. This could signal some inefficiency in the allocation of nutrition funds.
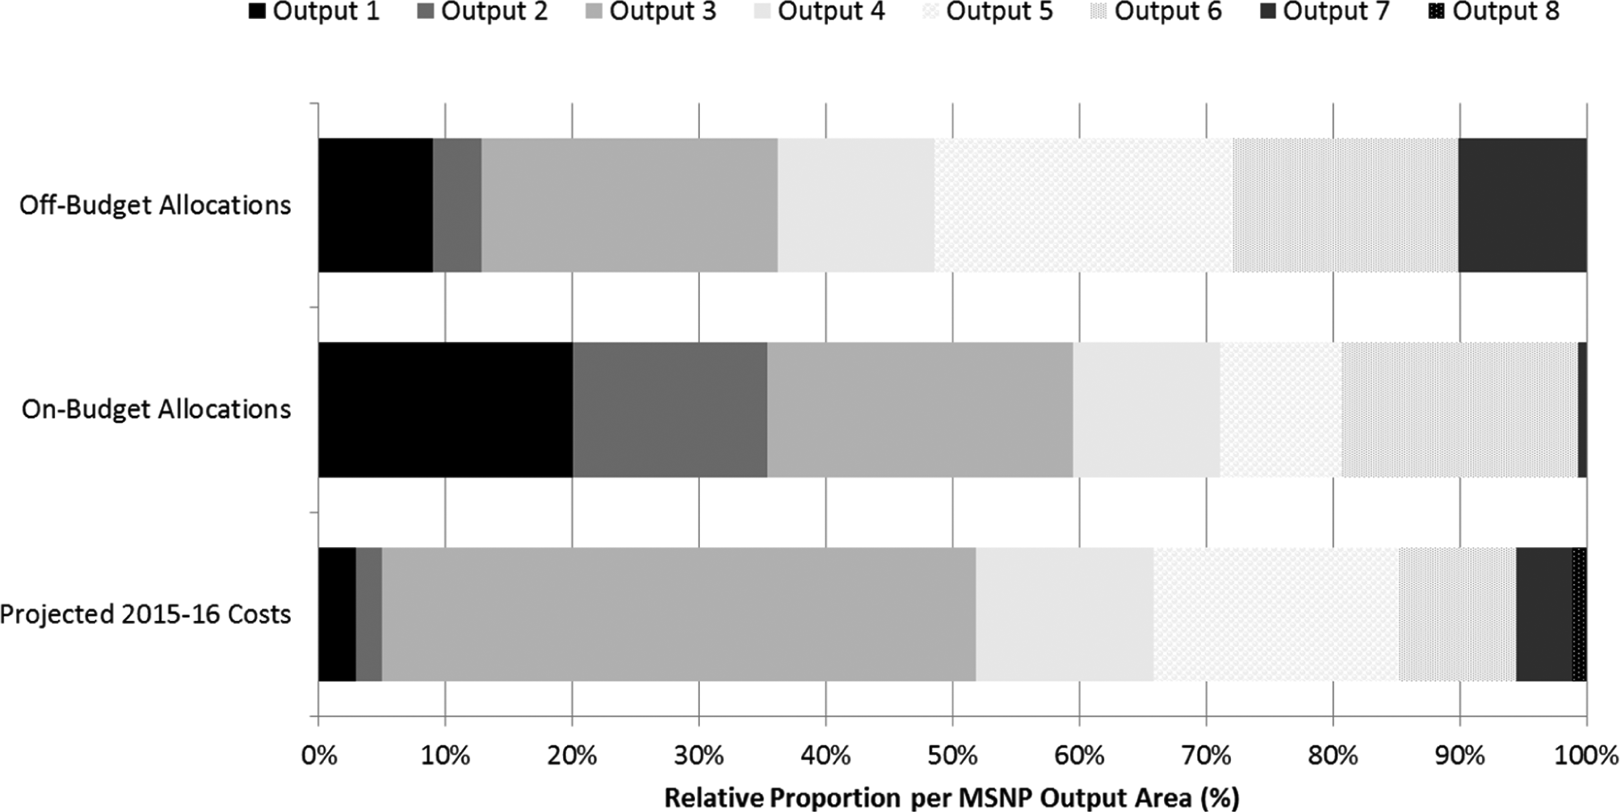
Comparison of on-budget ministry allocation to projected costs by multisectoral nutrition plan (MSNP) objective area.
Allocations for output areas 7 and 8 (strengthening nutrition capacity and information systems) were neither sufficient to meet costs nor equal in emphasis to the costed plan. Meanwhile, the relative proportion of funding for output areas 1 (policy and planning), 2 (coordination), and 6 (food security) was much higher than the expected proportion in the costed plan. For output area 3 (nutrition care), allocations were a much smaller percentage (or emphasis) as compared to the costed plan.
Discussion
The MSNP has contributed to strengthening the enabling factors of multisectoral coordination, advocacy, and sustainable structures for nutrition. The MSNP-related activities increased over time, as did total nutrition funding. Activities related to the MSNP contributed one-fourth of all nutrition-related funding in 2015 to 2016. Government stakeholders often cited the MSNP as an influence on their prioritization of nutrition; EDPs were just as often to cite the global nutrition agenda for any changes.
This study contributes real-time learning on the nutrition policy process and enabling environments for nutrition, linking this evidence to comprehensive estimates of nutrition financing . By looking across the policy cycle over several fiscal years, we can detect patterns that describe how to overcome barriers and bottlenecks. Globally, this study can be considered alongside other research in this special supplement to assess best practices improving function of the policy cycle in each context. Our results also corroborate earlier work on key enabling factors in Nepal. 8,9
There are some limitations on how we can interpret our results. Our data come from just 2 years within the 5-year MSNP policy cycle, which means we may have missed important events outside our study period. In addition, we cannot link our data to program coverage—having the ability to do so would give us a sense of the cost-effectiveness of current nutrition spending. Shekar et al (2016) and others have acknowledged the need to ensure the cost-effectiveness of existing and new spending on nutrition. 39 Our data can only provide total allocation and expenditure figures and simple comparisons of efficiency of allocation when compared to projected costs by sector or objective area. Finally, because of budget data gaps, we also cannot identify how comparable on-budget and off-budget projects are in terms of overhead, personnel, and unit costs. These important questions need to be answered in future research on nutrition costing and financing.
The MSNP builds on Nepal’s long history of multisectoral nutrition approaches and appears to have increased investments in nutrition. The MSNP stakeholders need to push further to ensure these activities are implemented to overcome the limitations of past plans. As stated by a stakeholder at the end of the study, “Success is 10 percent planning, 90 percent implementation.” (national academic stakeholder). Alignment of all stakeholder groups to MSNP objectives is critical, and use of government structures where possible will reduce transaction costs and increase sustainability of the results. In addition, much more work is needed to bring the power of the MSNP down to the VDC level and below. Stakeholders from every level highlighted the breakdowns of vertical MSNP programming.
We recommend the following as practical next steps in the development of more effective nutrition policy processes (Box 2, and also described in detail in Pomeroy-Stevens et al, 2016). 30 Some are specifically relevant to Nepal, whereas others are applicable to other country settings as well. Globally relevant recommendations include building in knowledge transfer mechanisms to lessen the impact of turnover in nutrition human resource positions, strengthening of bottom-up planning processes, and working across GoN and EDPs to reduce delays in releases and procurement to address underspending. The GoN and partners should continue to track planning and funding for the MSNP for the remaining 2 years of the plan’s tenure for the purpose of process improvement.
Other countries can benefit from similar process improvement analyses during the nutrition policy cycle. The SPRING has developed a budget data analysis tool that can be used to assist in this analysis. 40 Rapid assessment techniques based on this methodology can be built into regular sector or NNAP coordination activities, via platforms similar to the NNFSS, as long as they engage relevant stakeholders regularly and refer back to the NNAP activities and objectives. Identifying successes is as important as identifying barriers in order to learn how to effectively tackle the complexity of multisectoral nutrition.
Footnotes
Authors’ Note
This study was made possible by the generous support of the American people through the US Agency for International Development (USAID). The contents are the responsibility of JSI and do not necessarily reflect the views of USAID or the United States Government.
Acknowledgments
The authors are thankful for the input and feedback provided by USAID Bureau of Global Health representatives Elaine Grey, Anne Peniston, Mike Manske, and Kellie Stewart, and USAID/Nepal colleagues Hari Koirala and Debendra Adhikari. The authors would also like to thank Professor Dr Geeta Bhakta Joshi, Mr Madhu Marasini, Mr Bishnu Nepal, Dr Yagya Karki, and Mr Radha Krishnan Pradhan from the National Planning Commission for their kind support to this activity. The authors want to acknowledge the Helen Keller International (HKI) Nepal office and the Nepal Health Research Council and also Dale Davis, Dr Madhu Devkota, Sascha Lamstein, Anu Narayan, Gwyneth Cotes, Manisha Shrestha, and Akriti Rana for their insight and contribution to this work. Finally, the authors owe a debt of gratitude to the key informants at both the national level and in Achham, Kapilvastu, and Parsa for their time and thoughtful insight into the nutrition prioritization and budgeting process.
Declaration of Conflicting Interests
The author(s) declared no potential conflicts of interest with respect to the research, authorship, and/or publication of this article.
Funding
The author(s) disclosed receipt of the following financial support for the research, authorship, and/or publication of this article: The author(s) received financial support for the research, authorship, and publication of this article from United States Agency for International Development (USAID) under the terms of the Cooperative Agreement AID-OAA-A-11-00031 (The SPRING Project), managed by the John Snow Research and Training Institute, Inc. (JSI).