
Abstract
Background:
In 2010, Uganda began developing its first multisectoral nutrition plan, the Uganda Nutrition Action Plan (UNAP), to reduce malnutrition. While the UNAP signals high-level commitment to addressing nutrition, knowledge gaps remain about how to successfully implement such a plan.
Objective:
We tracked the UNAP’s influence on the process of priority setting and funding for nutrition from 2013 to 2015.
Methods:
This study used a longitudinal mixed methods design to track qualitative and budgetary changes related to UNAP processes nationally as well as in 2 study districts. Qualitative changes were assessed through interviews, news content, and meeting notes. Changes in allocations and expenditures were calculated based on budget documents, work plans, and validation interviews.
Results:
Important enabling factors named by stakeholders included identity, human resources, sustainable structures, coordination, advocacy, and adaptation of the UNAP to local needs. Evidence suggests that the UNAP facilitated improvements in the last 3 factors. We found no systematic increases in planned nutrition activities, nor did we find increases in allocations or expenditures for nutrition between fiscal years 2013-2014 and 2014-2015. Expenditure data were not always available for all funding mechanisms. In the 2 study districts, there was little flexibility within financing structures to allow for additional nutrition activities.
Conclusions:
Results suggest the UNAP has played an important role in strengthening the enabling environment for nutrition action. The next UNAP will need to translate these improvements into a greater number of nutrition activities and higher levels of funding at the national and subnational levels.
Introduction
Since 2001, Uganda has seen decreases in malnutrition. 1 However, even with these improvements and continued nutrition investment by the Government of Uganda (GoU) and external development partners (EDPs), one-third of all children under 5 were stunted in 2011, and nearly 50% were anemic. 1,2 Malnutrition will cost Uganda an estimated 19 trillion Ugandan shillings (UGX; US$7.7 billion) in lost productivity between 2013 and 2025. 3,4
Uganda Nutrition Action Plan (UNAP) 2011 to 2016 was borne out of the 2010 United Nations General Assembly, where the GoU committed itself to tackling its high rates of malnutrition through a multisectoral approach. 5 The UNAP’s main goal is to reduce malnutrition levels among women of reproductive age, infants, and young children, which intentionally aligns with the Scaling Up Nutrition (SUN) Movement’s focus on the “1000 days” period. 6
The UNAP suggests a set of nutrition activities across 5 major objective areas (see Box 1), 6 sector ministries, and various EDPs. These activities, together with the responsible ministry and partners, are detailed in the UNAP’s implementation cost matrix. 5 The UNAP coordination secretariat was placed in the office of the prime minister (OPM) to signal high-level commitment to the cause of nutrition. The OPM is responsible for coordination of all UNAP activities but does not implement nutrition activities directly.
The Uganda Nutrition Action Plan Objective Areas.
Abbreviation: GoU, Government of Uganda. Source: Adapted from Uganda Nutrition Action Plan 2011-2016.5
The requirements for an effective multisectoral nutrition action in any country are stringent and involve deliberate action during the policy cycle and regular interaction among key stakeholder groups. 7,8 While Uganda earned high ratings on the World Health Organization nutrition governance composite indicator, which assesses a set of elements for successful development and implementation of national nutrition policies, the 2011 UNAP gap analysis identified several remaining barriers to effectively address malnutrition in the country. 5,9 These included weak advocacy at all levels, weak infrastructure, weak coordination, weak information management systems, limited involvement of communities in nutrition work, and low coverage of nutrition services at all levels. 5 The UNAP objectives were designed to address these barriers.
Objectives and Background
Gillespie et al call for greater research efforts focusing on defining enabling environments for nutrition, and identifying systematic ways to capture and share learning on nutrition policy. 10 The Uganda Pathways to Better Nutrition (PBN) study has helped answer this call. The objective of the PBN study, designed by the US Agency for International Development (USAID) Strengthening Partnerships, Results, and Innovations in Nutrition Globally (SPRING) project in collaboration with the OPM, is to document if and how the UNAP influenced the enabling environment for nutrition action (including enabling factors, prioritization, and funding) over 2 years (2013-2015). The study was timed to capture a significant portion of the UNAP (2011-2016) but was not designed to measure the impact of the plan.
We have focused on changes in prioritization and funding for several reasons. Even well-executed policies or plans cannot immediately impact nutritional status—they must be operationalized, and this can take time, especially when many sectors are involved. 11 Our observation period of 2 years meant we focused on areas where we expected to be able to see change. Systems strengthening results frameworks note that governance and financing are the first inputs that can be influenced, which can then lead to improvement in longer-term outcomes and impacts. 12 Lamstein et al note that multisectoral nutrition plans, in particular, must create systemic improvements in governance, prioritization, and financing in order to support nutrition actions across such a diverse set of sectors and stakeholders. Therefore, while we know these areas are necessary but not sufficient to scale-up nutrition efforts, measurable improvements in these areas would indicate that Uganda is heading in the right direction.
We hypothesized that based on Uganda’s documented political commitment to multisectoral nutrition action, the UNAP would improve stakeholders’ understanding of nutrition and the policy itself and would lead to changes in key factors in the enabling environment, which would in turn increase the prioritization of nutrition activities during work plan development each year. This would result in greater funding for nutrition activities over the course of the study’s tenure.
To test this, the study followed 4 key study questions:
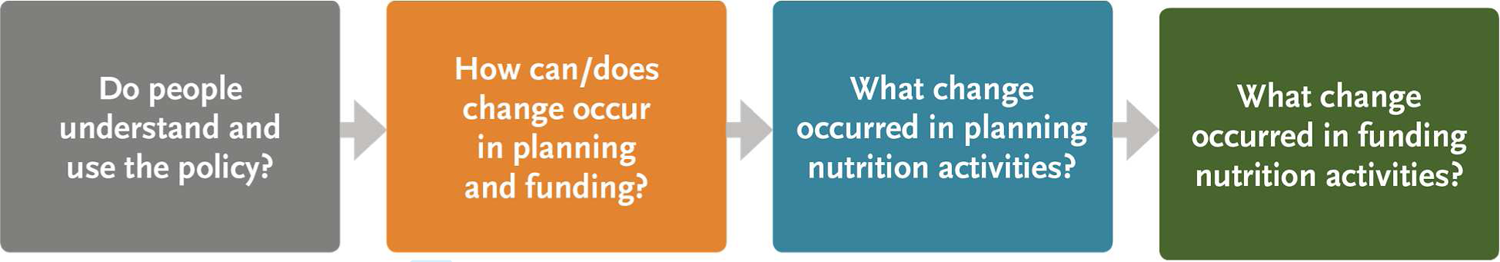
Taken together, these study questions guided data collection to identify changes brought about by the UNAP.
To our knowledge, this is the first prospective study on multisectoral nutrition policy processes in Africa. Several studies since 2010 have looked at the challenges to successful multisectoral approaches, but the majority did not tie data collection to study of a specific policy or national nutrition action plan (NNAP). 14 –16 Kennedy et al explored governance and implementation of the Ethiopian multisector nutrition plan around the time of its launch, which is perhaps the closest methodology to this study. 14 Specific to Uganda, RESULTS, UK, and Concern Worldwide conducted a retrospective desk review of success and challenges relating to scaling up nutrition in Uganda. 18 One of their conclusions was that strong political commitments did not translate into changes in domestic nutrition financing. Beyond nutrition, Colenbrander et al explored similar linkages between priority setting and financing in Uganda at a single point in time within the health sector. 19 They found that spoken and written priorities (as well as government and bilateral priorities) did not always align and that conflicts over spending led to a greater number of EDP projects being funded off budget. This literature can be useful to cross-reference with this study’s findings—they also highlight how influential policy prioritization decisions are to budget allocations and financing decisions.
Regarding nutrition financing, this is among the first studies to define country-level estimates in Africa. Tanzania conducted the first ever Public Expenditure Review for nutrition in 2014. 20 Madagascar has developed a mechanism to track on-budget nutrition financing in support of their NNAP. 21 In the most widespread effort of its kind to date, the SUN Movement has supported 35 countries (18 in Africa) to begin documentation of nutrition financing, but so far these exercises have not included in-depth validation. 22 Specific to Uganda, no other analyses of nutrition budgeting and expenditures have been conducted; however, the Cost of Hunger and PROFILES studies have both developed estimates of the cost of persistent malnutrition, 4,23 which provided an investment case to prioritize nutrition on the national Ugandan agenda.
The purpose of this article is to summarize our study findings and discuss the implications of these findings for Uganda as well as for other country efforts to monitor nutrition policies in Africa.
Methods
At the national level, the PBN study used a “one-to-many” longitudinal mixed method design—this means that both the qualitative and budget components ran over the same 2-year period but used a different time scale, as shown in Figure 1. 24
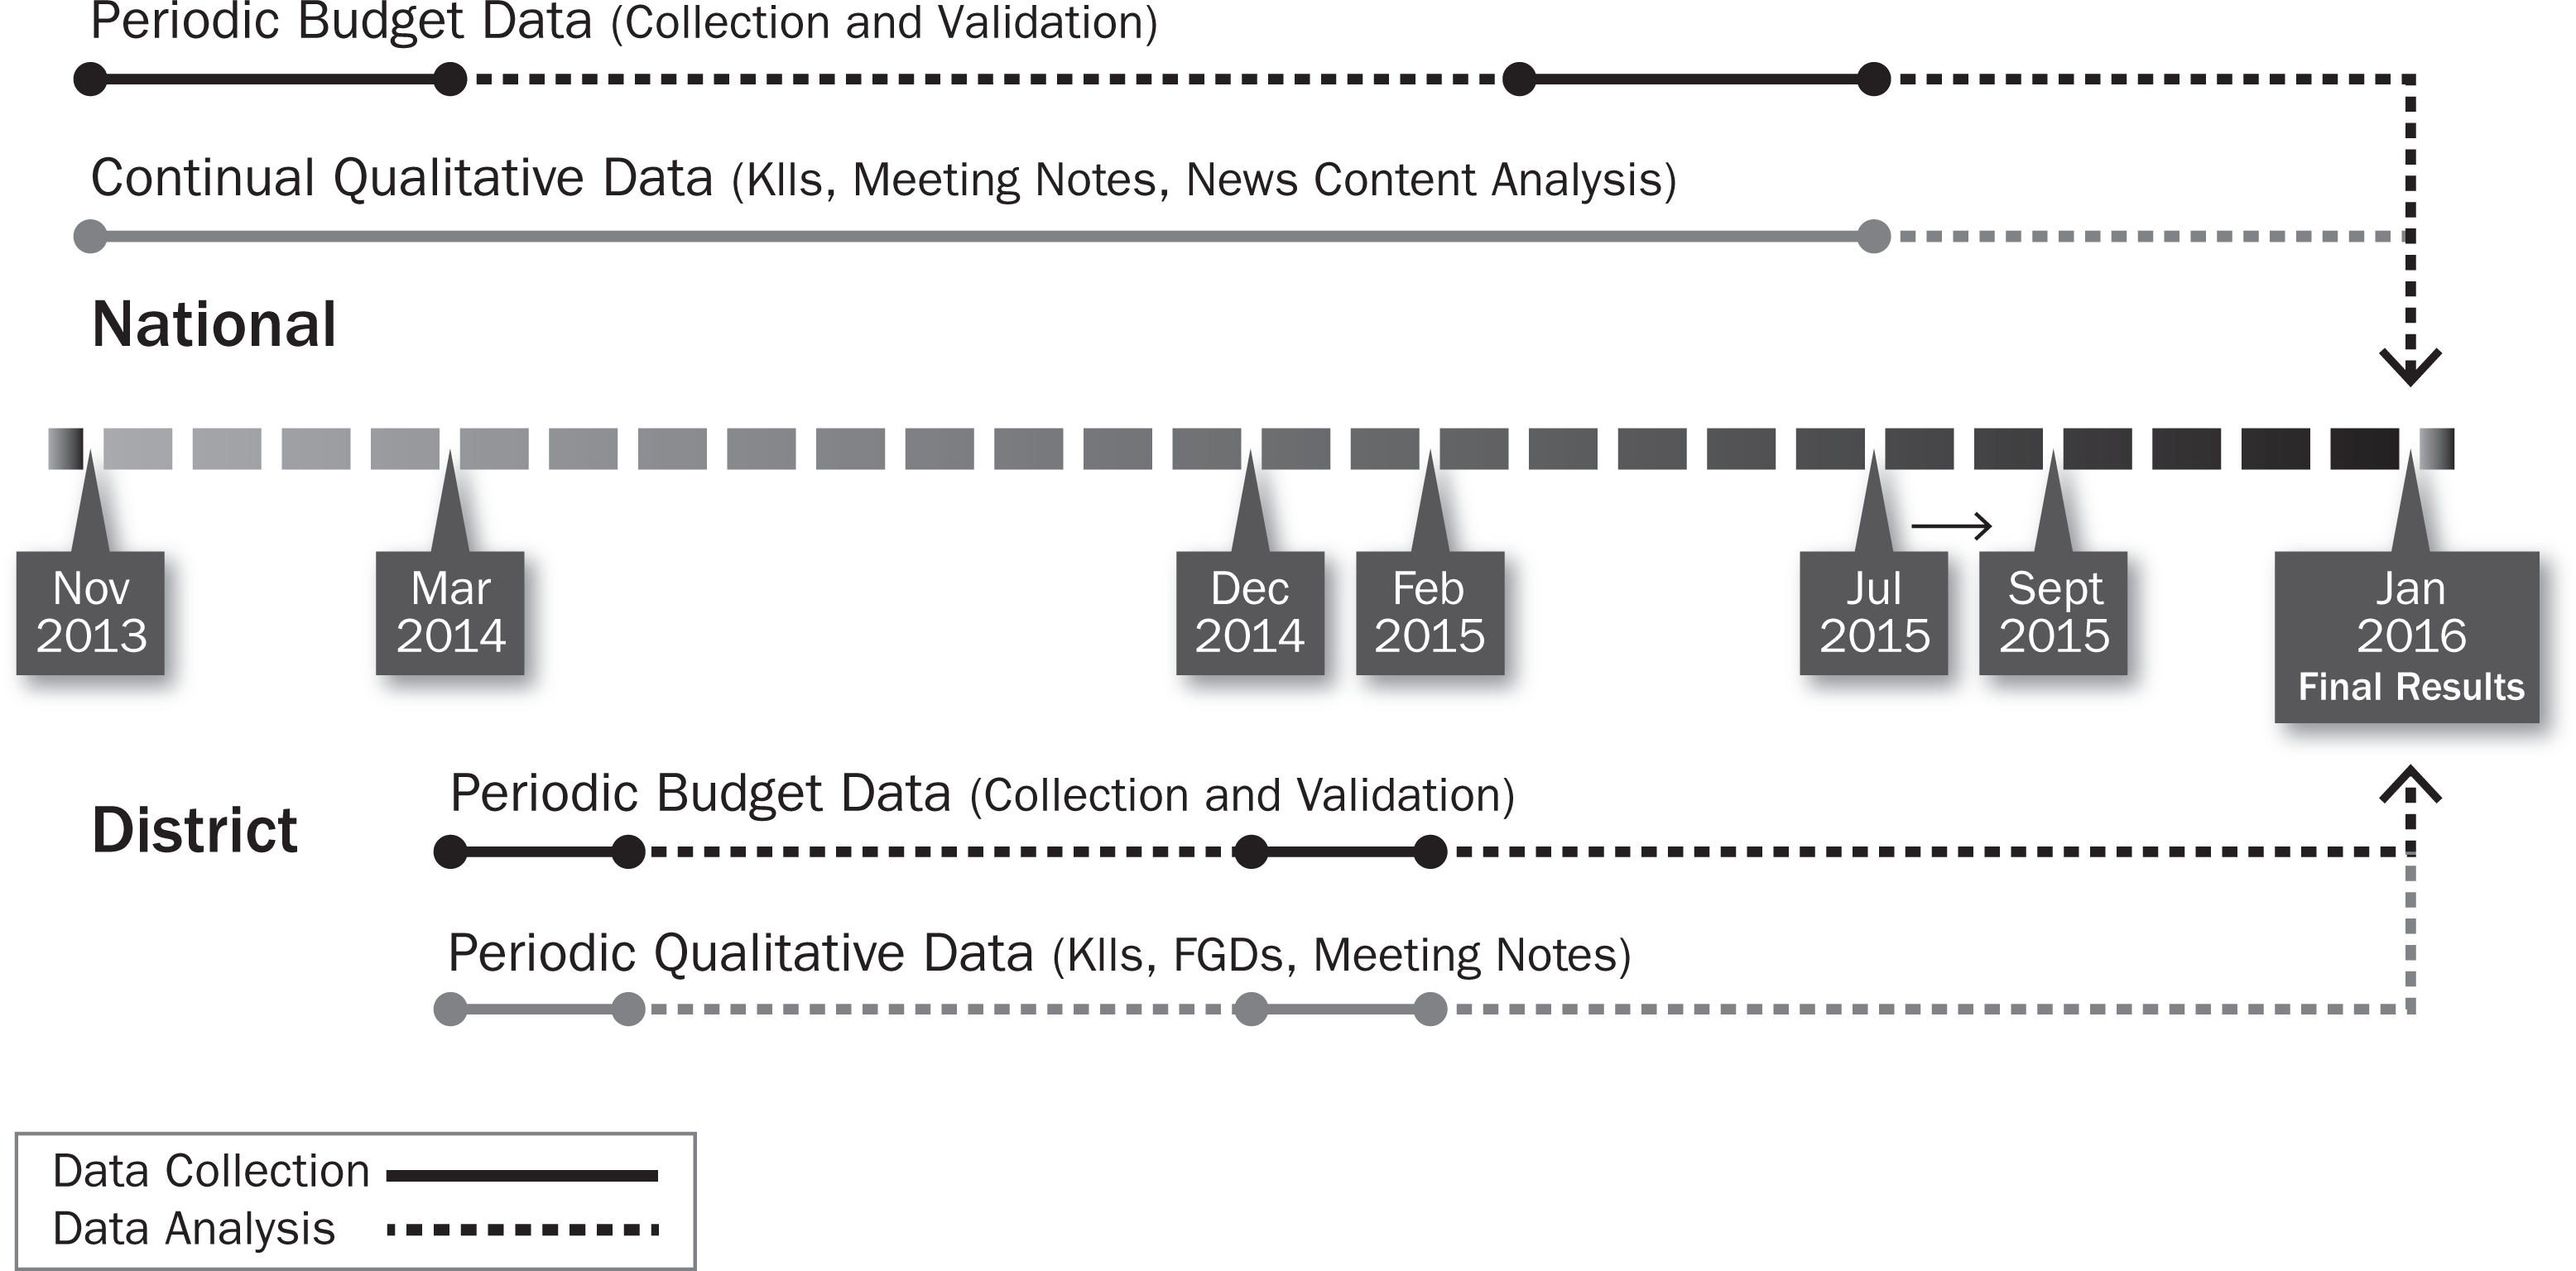
Timeline and levels of the study.
Budget data were collected yearly while qualitative data were collected as often as weekly and at least quarterly. Both data sources generated questions for follow-up interviewing. At the district level, we used repeated cross-sectional data to provide insights from the subnational perspective.
The OPM was consulted on the timing of the study, relevant study areas, and the confirmation of sectors to be included. See Pomeroy-Stevens et al for full details of the data collection and analysis for each of these data sources. 25
Study Participants
At the national level, the study was designed to follow 6 distinct stakeholder groups, as categorized by the SUN Movement in 2012. 26 These include government, donors, United Nations (UN) groups, civil society organizations, academia, and the private sector. The last 2 could not be followed for the budget portion of the study.
Within government, we sought representation from each nutrition-related ministry and a representation from policy and oversight bodies related to the UNAP (OPM, National Planning Authority [NPA], Ministry of Finance, Planning and Economic Development [MoFPED], and any related Parliamentarians). The UNAP-related ministries included Ministry of Agriculture, Animal Industry, and Fisheries (MAAIF); Ministry of Education, Science, Technology and Sports (MoESTS); Ministry of Gender, Labor and Social Development (MoGLSD); Ministry of Health (MoH); Ministry of Local Government (MoLG); and Ministry of Trade, Industry, and Cooperatives (MTIC). The Ministry of Water and Environment (MWE), while not an official UNAP signatory, has become involved in the implementation of UNAP activities, and thus OPM requested its inclusion in this analysis. All nongovernment stakeholder groups will be referred to as EDPs for the remainder of this article.
Two case study districts, Kisoro and Lira, were selected to provide a subnational perspective. These districts were selected to provide case studies of districts that have already begun the UNAP rollout process. We followed these same stakeholder groups in our districts, with some modifications. First, all members of the District Nutrition Coordination Committee (DNCC) were included. Second, few donor and UN agencies had district-level representation, so instead we selected representatives of key projects funded by these agencies. Third, community-level opinion leaders as well as community-based organizations were also included.
At all levels, stakeholders were selected purposively to represent all those holding formal nutrition positions within the UNAP, ministry, and/or organizational structures. We followed these positions, so if the incumbent of a position changed during the study, we began following the new position holder. This was true for both qualitative and budget data collection. Full details of the number and dispersion of stakeholders across groups and time are available in the supplemental annexure and in Pomeroy-Stevens et al.25
Qualitative Methods Summary
Collection
Qualitative data were collected across 3 sources: Interviews and observation
Two rounds of structured key informant interviews (KIIs) were conducted with 26 national-level stakeholders as well as with 47 district-level stakeholders. Nationally, semi-structured follow-up interviews were also conducted quarterly in the intervening period, depending on the news and events. In the districts, some focus group discussions were used when individual interviews could not be arranged. Finally, observation of turnover in position holders was also recorded. News content analysis
Weekly news searches were conducted for 6 news outlets, using a set of search terms to identify activities, events, and actions related to individual and institutional nutrition stakeholders in all 6 groups, nationally and in our 2 districts. In total, 262 articles were included across the study time frame. Nutrition-related meeting notes
Study team members tracked official UNAP stakeholder meetings and notes from other nutrition-related meetings, trainings, or workshops. We also noted any new or changed activities listed in these documents. An additional 33 national documents were added via this source.
Analysis
Final data processing and analysis were performed by NVivo 10.
27
To identify changes over time, we developed a grid-style template that allowed analysis of stakeholder group data over multiple time points and all emergent themes. Within themes, we acknowledged change had occurred if evidence between 2 or more time points showed the following tangible markers of change: Stakeholders noted changes in their own or others’ perceptions, attitudes, or knowledge. Stakeholders noted changes in their own or others’ behavior. Observed changes in organizational structures, priorities, strategies, or hiring practices; change in a policy or guideline (new or existing); political shifts; or new positions or change in position. Observed changes in implemented activities (both new activities and increased emphasis on existing activities) or funding (both new funding and increases in funding for existing line items).
Validation
We provided a written summary of preliminary qualitative findings to OPM quarterly and held dissemination and validation meetings for the multisector technical committee at the end of year 1 and after the close of data collection in year 2. District validation was completed on a similar schedule.
Budget Methods Summary
Our budget analysis methodology included 3 distinct phases: collection, validation, and analysis. Validation was completed prior to analysis to fill data gaps found during data collection. Data were cross-checked across sources to avoid double counting of funds.
Collection
We followed all 66 activities named across 5 objective areas in the UNAP implementation cost matrix. We searched for allocations and expenditures from the same set of activities every year supplemented by qualitative data.
For on-budget funds, which are GoU and EDP funds run through the government budget (including both on- and off-treasury EDP funds): National on-budget data came from Ministerial Policy Statements for the 7 UNAP-related ministries, official estimates of revenue and expenditure, and any available work plans or descriptions of activities, sourced from sector planning and technical offices. In total, 26 budget headings were found. In the 2 case study districts, on-budget data came from district development plans, annual local government and sector work plans, relevant referral hospital documents, as well as all approved revenue and expenditure estimates, budget performance reports, and national government transfers.
For off-budget funds, which are EDP funds run outside the government budget: For national off-budget data, the best publicly available source was the “summary of project support managed outside government systems.”
28
This source provided planned allocations for the fiscal year 2013 to 2014 and projected allocations for the fiscal year 2014 to 2015 (no source could provide actual allocations for any year after 2012 to 2013). We searched an initial list of 350 entries for these fiscal years. A total of 100 EDP projects were selected. Expenditure data were not available for any of the off-budget projects listed. For off-budget district data, we used reports, work plans, and district budgets supplied by civil society organizations (CSOs), donors, and UN projects. Some of these sources could not provide us with a fiscal year breakdown of allocations for the fiscal year 2014 to 2015.
Validation
Nationally, and in both districts, we conducted in-depth validation interviews with budget planning offices, district planning officials, and EDPs to confirm the following for each budget item or EDP activity: objectives, relevance to UNAP, percentage related to nutrition, and nutrition-specific (note 1), or nutrition-sensitive designation. 29 For national validation, some EDPs participated in this validation via e-mail, while the remaining EDP activities (41%) were validated by online project document review.
Analysis
Budget data were analyzed in Excel 2010. 30 Data were reported in nominal terms for both UGX and US$. Interbank exchange rates and inflation rates from the Ugandan Central Bank, averaged over each fiscal year, were used for the conversions. 31 Budget data were adjusted for inflation to the last fiscal year of the study for analysis.
Ethical Approval
The study protocol was approved by institutional review board for the School of Biomedical Sciences Ethical Committee at Makerere University. Final clearance was obtained from the Uganda National Council for Sciences and Technology.
Limitations
We faced several limitations in collecting these data. The first was difficulty developing regular feedback mechanisms across stakeholders over time, particularly in the first 6 months of data collection. Second, several stakeholder positions went vacant during our study, limiting our ability to follow up. Finally, sharing preliminary qualitative data can be complicated—we took into account the feedback to make our work more accurate and relevant to current events but did not make any changes to groups or stakeholders and were not asked to censor any findings. Regarding the budget data, the major limitation was regarding off-budget reporting. Without recent and accurate data on allocations, or any information on off-budget expenditure, we could not report to the same level of detail for this funding mechanism. In addition, we could not break down figures below the activity level, meaning we do not know how overhead, personnel, and unit costs differed by funder or funding mechanism. Finally, conducting validation interviews over multiple years meant we may have increased nutrition awareness of our stakeholders and the accuracy of the figures. This could lead to falsely inflated figures in the second year. However, the percentages changed so rarely that we do not believe this occurred. We also tried wherever possible to base the percentage breakdowns on actual subheading budgets or other objective data sources.
Results
We summarize our results by the 4 key study areas:
Understanding
In general, we found good existing understanding of the UNAP at the start of the study and positive changes over the course of the study in understanding the concept of multisectoral nutrition efforts but persistent confusion about specific roles stakeholders could play to support the policy. Full details on this first study area can be found in Pomeroy-Stevens et al, but this article will focus on the details pertaining to changes found in the enabling environment, including prioritization and financing. 25
Key Factors in the Enabling Environment
Positive changes in certain factors can strengthen the enabling environment for nutrition activities. We identified key factors by considering the answers given for why nutrition priority and funding did or did not improve over time as well as responses to specific questions about what challenges the stakeholders faced. Factors mentioned most often by stakeholders are listed in Table 1.
Key Factors Most Often Mentioned by Stakeholders.
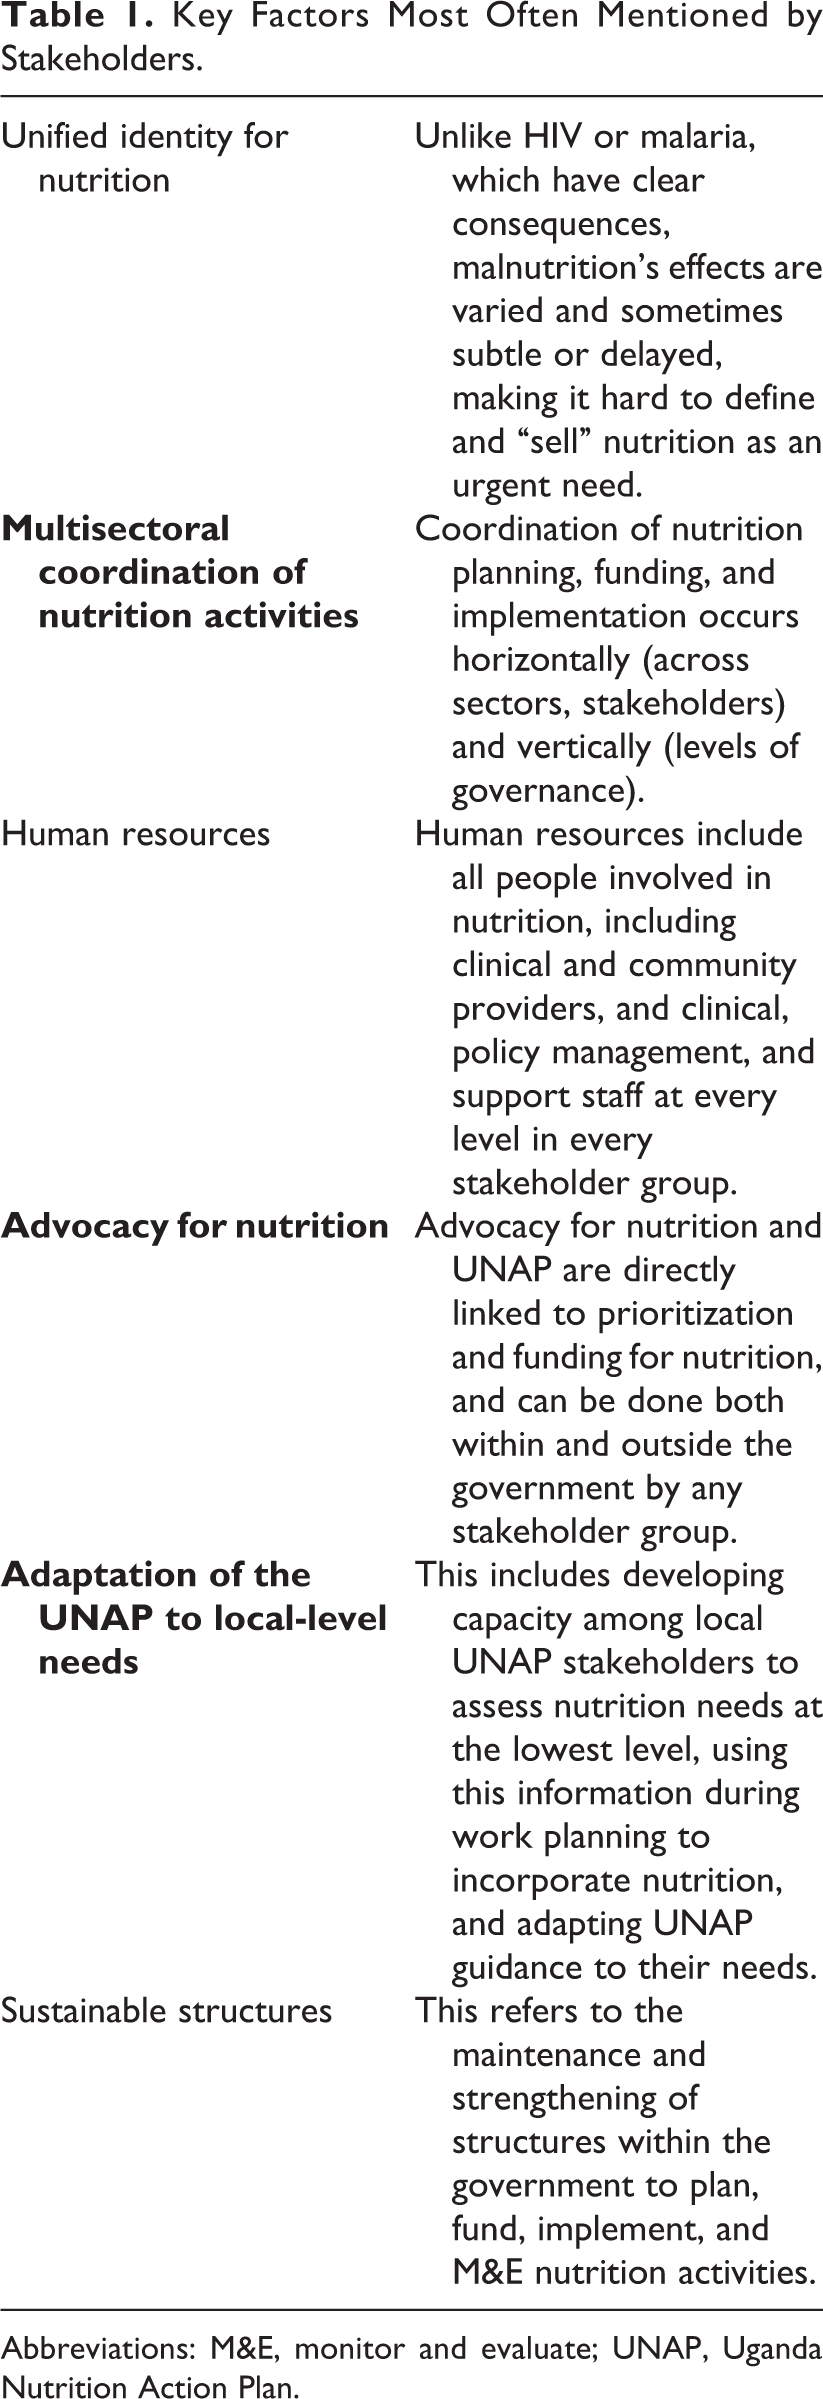
Abbreviations: M&E, monitor and evaluate; UNAP, Uganda Nutrition Action Plan.
We found evidence of improvements over the course of the study in the factors indicated in boldface—there were a greater number of positive changes in these 3 factors over time and also some critical actions that shifted the status quo for those factors. 25
There was significant improvement in multisectoral coordination of nutrition and UNAP activities in the latter half of the study. Some of the most meaningful examples included increased participation in the national multisectoral coordination structure (meetings, trainings, etc) by the donor and UN groups. “When we were developing the UNAP partners were not interested. But now those that were not involved in the development of the UNAP are more interested than those that did participate” (national UN stakeholder). Intersectoral coordination across units and departments also increased within almost all ministries, and district-level coordination structures were established in Kisoro and Lira.
However, even at end line, key informants noted a lack of engagement from academia and the private sector. Nonacademic stakeholders rarely spoke of coordination with academia; we found no active UNAP-related projects where academia was a partner, and private-sector stakeholders remained interested but unaware of UNAP coordination activities.
Advocacy for nutrition also appeared to increase over the course of the study period and building up to the launch of the National Development Plan II (NDP II) in mid-2015. Advocacy efforts organized by OPM, NPA, and CSOs pushed nutrition to a higher priority level in the NDP II than in the previous NDP. At the district level, we also learned that staff within the health sector had advocated including nutrition in the next round of district development plans. CSO stakeholders emphasized their role in advocating to political leaders at the district level and below to develop local-level champions for nutrition. Other important examples of how advocacy was an important positive driver of change included the launch of a Nutrition Advocacy and Communication Strategy by OPM and increased CSO advocacy to meet the Sustainable Development Goals. Many stakeholders suggested that advocacy is most needed within the MoFPED to lobby for funding. A potential barrier was the lack of vocal nutrition champions on the national stage, such as celebrities and parliamentarians.
The study found moderate improvements (relative to other factors) in adaptation of the UNAP to local needs. The most notable change in this area was the development and launch of the The National Nutrition Planning Guidelines for Uganda, released near the end of 2015, which offers a more practical understanding of what the UNAP means for planning and implementation by government stakeholders. 32 The OPM (with the support of EDPs) also developed and launched a series of UNAP trainings in over half of all districts to orient DNCCs about the nutrition planning process. The DNCCs were, in turn, working to engage subcounty nutrition coordination committees (SNCCs) and parishes in their planning processes by the second round of district data collection to take into account the needs of the community. However, DNCCs in the 2 case study districts mentioned that even when they were aware of local needs, they were not necessarily able to address them since the conditionality of national-level grants did not provide flexibility to develop and implement targeted programs. We also learned that the functionality of DNCCs and SNCCs across the country varied, depending on the EDP support.
For the remaining 3 factors, we identified little positive change:
Unified identity of nutrition: At the baseline and continuing throughout the study period, many stakeholders (both at the national level and in our 2 case study districts) mentioned the lack of a singular identity for nutrition in Uganda. They indicated that this was a barrier to more concerted efforts for nutrition, both at the community level—where it hinders partner buy-in—and at the national level, where it hinders awareness and advocacy.
Human resources: There was a persistent call for greater human resources for nutrition throughout the study period, both for planning and for implementation. Concerns focused on availability, capacity (“There is need to build capacity of clinical and health workers since most of them are not trained in nutrition and nutrition interventions or treatment” [District government stakeholder]), and excessive turnover of existing staff. Three of the 7 key UNAP national focal positions followed through the study period had at least 1 turnover, while 2 more were vacant by the end of the study.
Sustainable structures: While some small positive changes were noted over the study period, most represented nascent movement rather than full-fledged change in sustainable structures. Remaining barriers included insufficient financial buy-in by GoU, a lack of specific funding for nutrition or the UNAP, particularly at the district level, and an unapproved monitoring and evaluation (M&E) framework that lacked ministry implementation guidance.
Progress was made in strengthening enabling factors over the 2 years of this study, but remaining barriers exist, which influenced the extent to which stakeholders were able to effectively prioritize and fund nutrition activities.
Prioritization of Nutrition Actions
We defined prioritization as the process of deciding which topics, programs, or activities are most important to include in annual work plans. We looked for the same tangible markers of change as listed in the Methods section, with some additional priority-focused criteria: inclusion of nutrition as a priority in strategy and investment documents; creation of a nutrition and/or food security unit, division, or department, or addition of a major nutrition initiative or program; creation of a nutrition review process within a sector/organization; explicit discussion of planning for nutrition that would imminently result in one of the above; and new or expanded nutrition activities included in the next year’s work plan.
This helped us to determine the extent to which nutrition was prioritized by each sector and stakeholder group. We found that there were tangible improvements in the prioritization of nutrition activities during the course of the study within the government among the first 4 criteria, and some positive change among EDPs (though less so relative to the changes seen in government) in criteria 1 and 4. However, these changes did not result in any new or expanded nutrition activities planned for nutrition (criterion 5), as of the last fiscal year studied.
Government
While several nontraditional nutrition sectors did not identify nutrition as a priority for them at the beginning, responses from KIIs conducted toward the end of the study indicate improvements in prioritization for 4 of the 7 ministries. Three ministries (MAAIF, MoH, and MTIC) took multiple steps in 2015 to get interministry agreement to include nutrition as a named priority in their development strategy and investment plans, which we understood was the primary sector document used for priority setting each fiscal year. “[Leadership] are spearheading the whole of nutrition seeing how the Development Strategy and Investment Plan (DSIP) can integrate nutrition. So I have seen a deliberate move […]I believe that the next [agriculture] DSIP coming will have direct nutrition initiatives” (national government stakeholder). In addition, by the end of the study, the MoLG treated nutrition as a formal cross-cutting issue in its planning process and also launched the subnational nutrition planning guidelines. We also saw changes within MoGLSD that culminated in that ministry successfully lobbying parliament for a new activity to support children—the majority of this activity will focus on feeding programs. Unfortunately, this activity was not officially included into the work plan during the study period, but it does potentially reflect positive change for the future. All of these changes evolved over the course of the study, and stakeholders most often cited the positive changes previously mentioned in interministry coordination, increased advocacy, and improved planning structures as enablers of these changes.
External Development Partners
We saw less obvious changes in the prioritization of nutrition among donors, UN groups, and private-sector stakeholders. At the end of the study, they still said they primarily followed internal planning and policy documents for national and strategic funding decisions. Some donor and UN groups indicated that their intention was to use the UNAP to update internal strategies, but given the 5-year life of many of these policies, this had not yet happened. Most EDPs did note that their activities were funded and planned in cooperation with the GoU, so national priorities were always considered. 33 However, only 1 donor listed the UNAP in the top tier of national plans was consulted when planning nutrition activities.
The EDPs had a generally positive view of how ministries were now discussing nutrition, although some mentioned they wanted to see greater government buy-in on key nutrition issues. “As we think of the UNAP II, I think clarity in ministries’ planning on nutrition issues and location of resources is going to be key because the amount of resources that is going to come from projects and so on is very minimal” (national donor stakeholder). Other factors mentioned as barriers to further EDP prioritization were lack of identity (primarily affecting private sector), lack of M&E feedback structures for nutrition programming, and high turnover of EDP staff in positions that could advocate for nutrition during work plan development.
No New UNAP Activities
We found little evidence of implementation of new nutrition projects explicitly developed to support UNAP activities or existing projects that have increased alignment with the UNAP. “The last 2 years of the UNAP have been around either developing strategic documents to allow their operationalization of the UNAP…in terms of the actual implementation in the district, I must say that is a little bit limited” (national UN stakeholder). While a handful of new nutrition activities were implemented during the study time period, implementation was usually the result of existing EDP priorities, non-UNAP government plans or priorities, or non-UNAP-related assistance requests by districts. In the 2 study districts, there was a modest increase in nutrition activities between the first and second rounds of interviews, but only the UNAP trainings were explicitly conducted in support of the plan.
With little evidence of new or expanded nutrition activities, this limits how much change we can expect to see in financing for nutrition.
Financing for Nutrition
We found that allocations did not increase over the 2 years of data included in the study. We saw differences by funding mechanisms (on and off budget) and sources (GoU and EDP), and UNAP objective area. In addition, we found some volatility in expenditure rates across all categories of nutrition funding. Funding for nutrition exists across multiple funding mechanisms and sources, but on-budget levels remain stagnant.
Figure 2 shows the total (on and off budget) nutrition allocations for the 2 years included in this study.
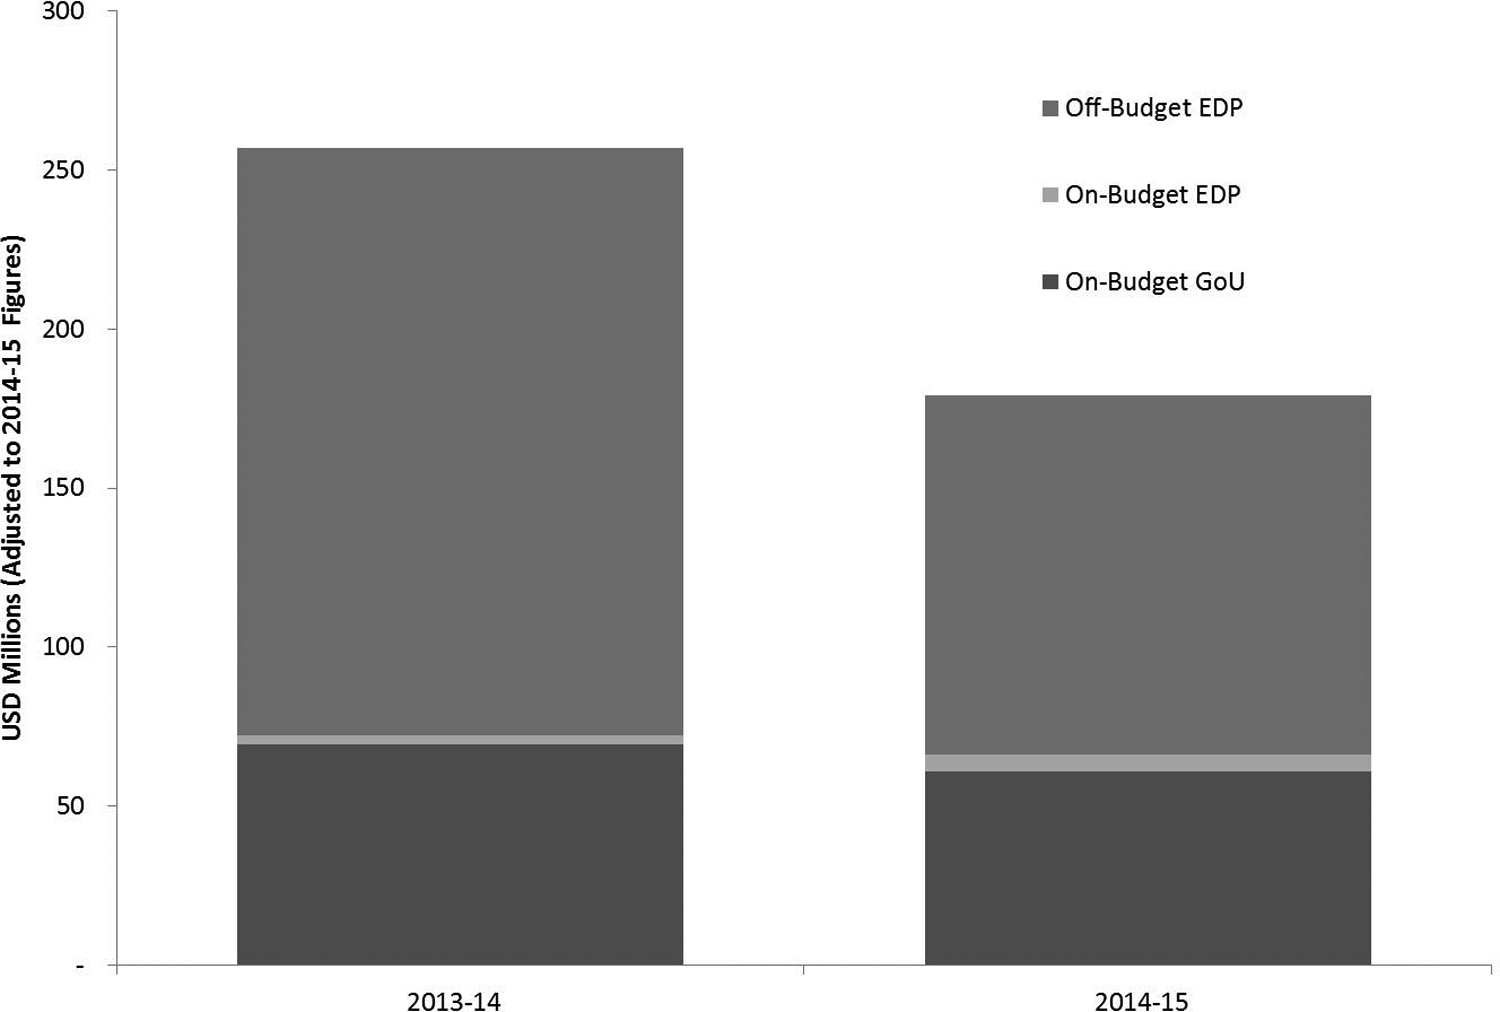
Total nutrition-related allocations for 2013 to 2014 and 2014 to 2015.
Combined nutrition allocations in 2014 to 2015 totaled 472 billion UGX (US$179 million using 2014-2015 exchange rates). It appears there was a large decrease in nutrition allocations from year to year driven primarily by decreasing off-budget funds. Examining this funding mechanism, it is likely that off-budget allocations for 2014 to 2015 were underestimated, as they were projections and thus did not include any projects planned since the last published document from 2013. From our qualitative data, there was no mention of major funding cuts to existing off-budget nutrition projects. If we focus on the more accurate on-budget allocations for assessing change over time, we find a moderate decrease of approximately 8% between the 2 years, after adjusting for inflation.
Breaking figures down by funding source, GoU funds made up one-fourth of all nutrition allocations in 2013 to 2014, and just over one-third in 2014 to 2015. This represents roughly 1% of the total GoU budget for 2014 to 2015. Nutrition funding from EDPs, which comprised the majority of total nutrition-related allocations in these 2 years, was primarily provided off budget (96%) in 2014 to 2015.
Regarding spending, we found no public record of expenditures for on-budget central transfers or off-budget allocations. Expenditure data are available for on-budget national ministry allocations; just over half (55%) of those nutrition-related allocations were spent in 2014 to 2015. This is a decrease in spending from the previous year. Spending rates decreased for both GoU nutrition-related funding (from 69%-52%) and on-budget EDP funding (from 152%-83%).
Nutrition Allocations and Expenditures Vary by Sector
Figure 3 shows the contribution each sector made to national on-budget total allocations.
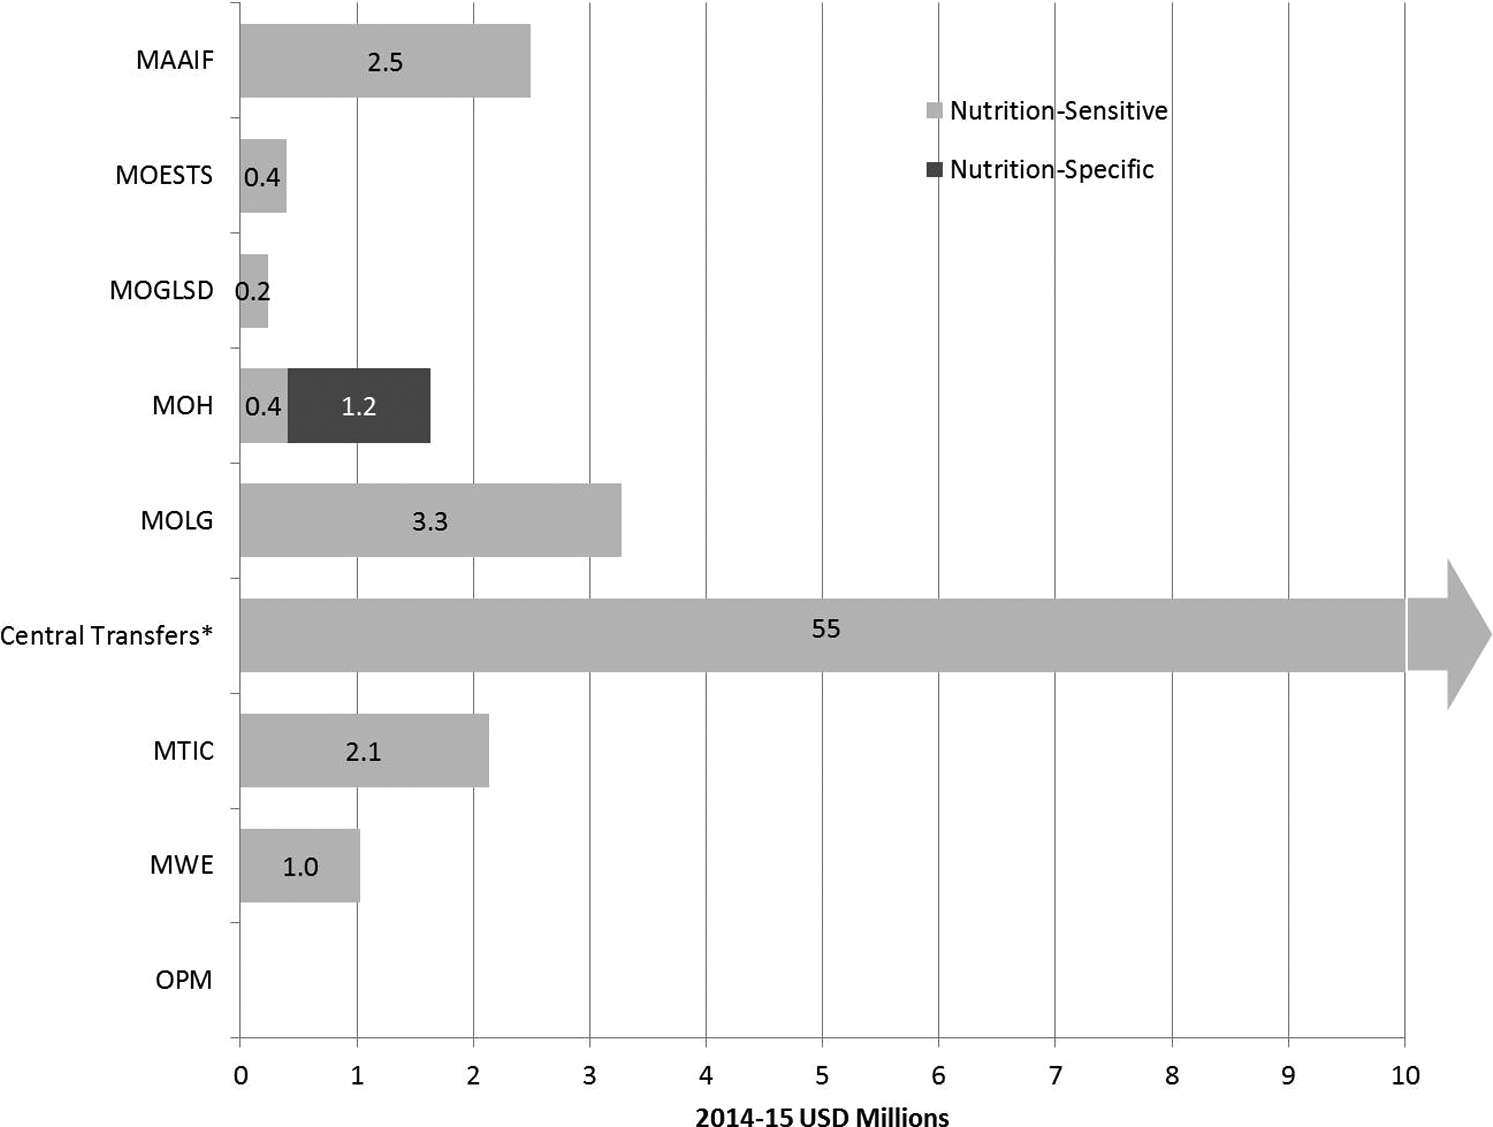
The 2014 to 2015 on-(government and EDP) budget allocation for nutrition, by Sector. EDP indicates external development partner.
When compared to the costs projected for the UNAP, MAAIF and MoESTS contributions matched their expected share of support for UNAP activities, while MoH and MoGLSD contributed less than expected, and MoLG and MTIC contributed more than expected (note 2).
In terms of relative financial contributions in the last year of analysis, MoLG had the highest total allocations for nutrition, with or without central transfers included. The MoLG nutrition activities primarily related to strengthening local service delivery and development. The MAAIF provided the second largest sector contribution but also saw the largest decrease in nutrition-related allocation between 2013 to 2014 and 2014 to 2015 (nearly 50%). The MTIC provided the third highest allocation for nutrition, focusing on value-addition activities under UNAP objective 2. Although the MoH contributions were not as high as that of these 3 ministries, the MoH provided the only nutrition-specific allocations within the government.
Central transfers to the districts were by far the largest contributor to total national on-budget allocations but presented a methodological challenge. In our detailed analysis of allocations in Kisoro and Lira, we verified that significant portions of total district nutrition-related allocations came from central transfers for our study years. 34,35 However, we were unable to validate these transfers nationally for all the 112 districts. To develop some sense of the magnitude of their contribution, we used the validated percentages for conditional transfers from these 2 districts to extrapolate for Uganda as a whole. Conditional central transfers include items like local health-care services, hygiene activities, agriculture extension services, schools and education services, rural sanitation, and community mobilization activities. 34,35 Unconditional transfers (those that can be spent on anything designated by the district) are even more difficult to estimate. We took the average of conditional transfers (13%) for these 2 line items, which make up only 7% of the total national on-budget allocation.
For off-budget allocations, health-related EDP projects contributed the most nutrition funding by far in both years, with 26% of that total going to nutrition-specific activities. For 2014 to 2015, the health projects represented nearly two-thirds of the total off-budget nutrition-related allocations.
Expenditures by sector showed no particular patterns, and there was volatility by sector and year (see Table 2). On-budget spending among EDPs was heavily influenced by a large overspend of 1 health program, though overspending of EDP allocations appeared to be an issue for MWE as well.
Expenditure Rates by Sector.
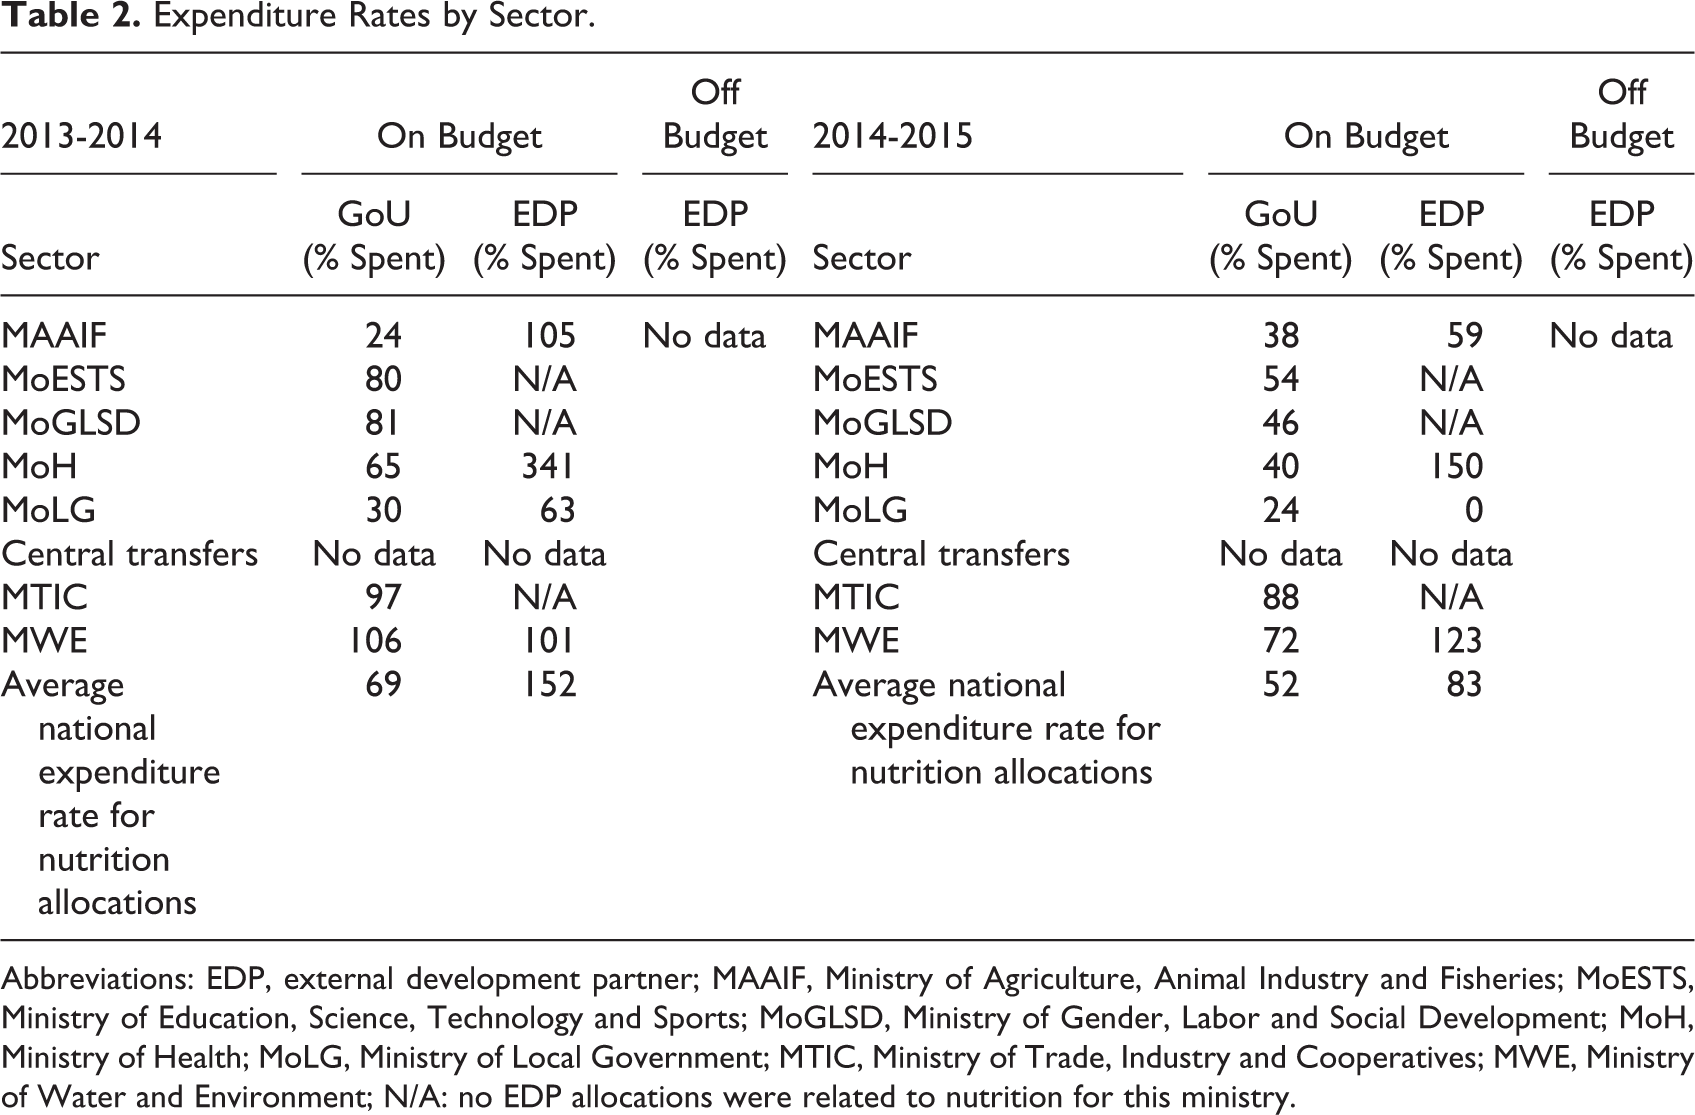
Abbreviations: EDP, external development partner; MAAIF, Ministry of Agriculture, Animal Industry and Fisheries; MoESTS, Ministry of Education, Science, Technology and Sports; MoGLSD, Ministry of Gender, Labor and Social Development; MoH, Ministry of Health; MoLG, Ministry of Local Government; MTIC, Ministry of Trade, Industry and Cooperatives; MWE, Ministry of Water and Environment; N/A: no EDP allocations were related to nutrition for this ministry.
From our interviews and the news content analysis, 2 primary reasons appear to be causing the gap in spending across sectors for on-budget funds.
Delayed release of funds: Prior to 2015, tax proposals and allocations were debated well into the start of the fiscal year, delaying the release of funds.
36
Also, because Uganda utilizes a cash budget based on tax revenue projections, there is some volatility in the actual funding releases, which is destabilizing the budget process.
Procurement delays: The bidding process for commodities, capital investments, building projects, and engineering works was stated as a major delay and a hindrance to the sector’s ability to “absorb” new funds.
37
–39
Bureaucracy was named as a primary culprit for these delays.
Allocations Do Not Align With Planned Costs by UNAP Objective Area
We can try to identify funding sufficiency and allocation efficiency by comparing allocations to the projected costs for each UNAP objective area estimated in the UNAP implementation cost matrix. 5
Allocations appear more than sufficient to cover projected costs; they were almost 10 times the projected yearly cost for 2014 to 2015. However, allocations do not always align with the relative priority given to each objective in the costing exercise. When we compare allocations to costs by UNAP objective area, we see some mismatch in relative proportions, as seen in Figure 4. This could signal some inefficiency in the allocation of nutrition funds.
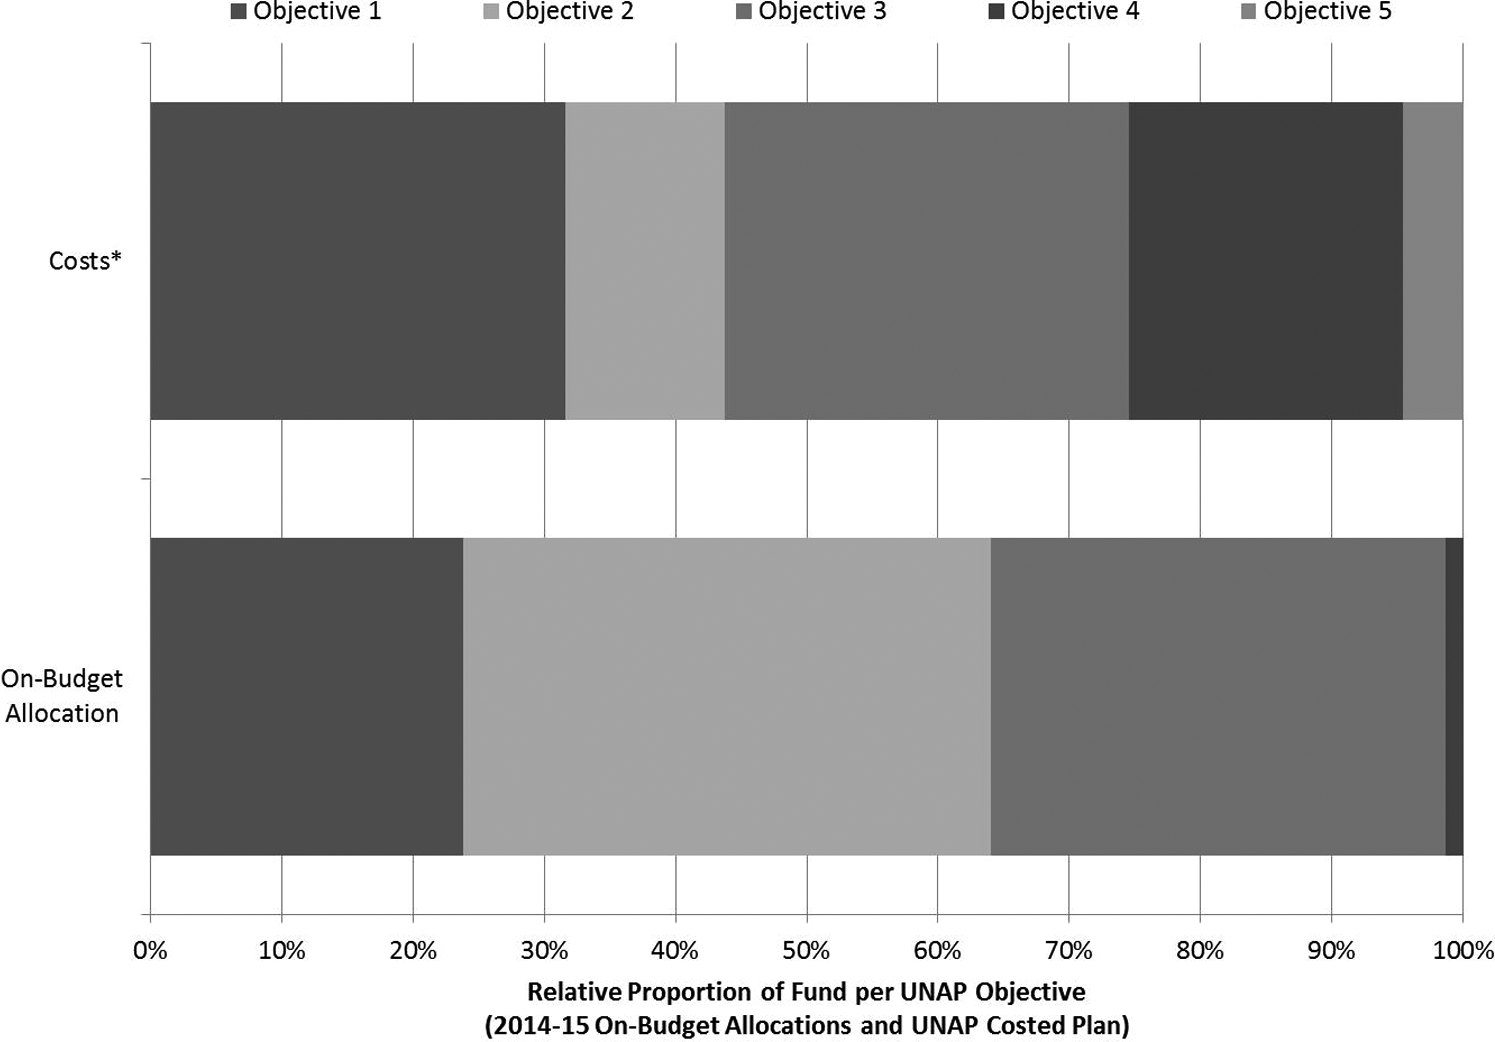
Comparison of on-budget ministry allocation to projected costs by the Uganda Nutrition Action Plan (UNAP) objective area, 2014 to 2015.
Objective 2, related to dietary diversity and food security, was allocated nearly triple the percentage projected in the costed plan. Conversely, for objective 4, related to systems strengthening, allocations were a much smaller proportion of the amount included in the costed plan. Objective 5, related to creating nutrition awareness, received no allocations at all despite an estimated cost of nearly 2 UGX billion (US$760 000).
Discussion
Our results suggest the UNAP has played a role in improving the enabling environment for nutrition via its influence on 3 key factors—multisector coordination, advocacy, and adaptation of the plan to local needs. Slow progress in the remaining 3 factors (unified identity for nutrition, human resources, and sustainable structures) could explain why these improvements did not translate to any major increases in new UNAP-related activities within our study period. Further improvements in off-budget financing data are also needed to accurately track the majority of nutrition-related resources.
This study contributes evidence on enabling environments for nutrition and real-time learning on the nutrition policy process, linking this evidence to comprehensive estimates of nutrition financing. By matching rich qualitative data to budget data, we can better explain the “why” and “how” behind the financial figures. Globally, this study can be considered alongside other research in this special supplement to assess best practices for multisectoral nutrition approaches.
There are some limitations on how we can interpret our results. Our data come from just 2 years within the 5-year UNAP policy cycle, which means we may have missed important events outside our study period. In addition, we cannot link our data to program coverage—having the ability to do so would give us a sense of the cost-effectiveness of current nutrition spending. Because of budget data gaps, we also cannot identify how comparable on-budget and off-budget projects are in terms of overhead, personnel, and unit costs. Finally, our data can only provide total allocation and expenditure figures and simple comparisons of efficiency of allocation when compared to projected costs by sector or objective area.
The UNAP is the first major multisectoral nutrition plan the GoU has implemented. The improvements identified by this study do not indicate that scaling up of nutrition interventions has occurred, but they do indicate that a stronger foundation has been laid for scaling up in the future. When comparing our findings to the original UNAP gap analysis, we see progress in many key areas they noted, including strengthened advocacy and coordination. 5 Other SPRING work on scaling up NNAPs found that it may be unrealistic to see major increases in the implementation of nutrition activities within just 5 years, precisely because of the need to strengthen the underlying enabling environment. 40 Additional strides in implementation do need to be made—if nutrition activities are not scaled up, an additional 840 000 Ugandan children’s lives will be lost to stunting and wasting in the next decade. 2
We recommend the following as practical next steps inward the development of more effective nutrition policy processes. Some are specifically relevant to the Uganda setting, while others are applicable to other country settings as well (see Box 2, also described in detail in Pomeroy-Stevens et al).25 Globally relevant recommendations include improving human resources and sustainable structures for nutrition, addressing volatility and delays in funding releases, and improving reporting of expenditure data for off-budget funds and central transfers. The GoU and partners can continue to monitor planning and funding until the end of the UNAP and beyond.
Abbreviations: EDPs, external development partners; GoU, Government of Uganda; PBN Uganda, the Uganda pathways to better nutrition; UNAP, the Uganda Nutrition Action Plan.
Other countries can benefit from similar analyses to test where breakdowns are occurring between NNAP commitments and spending on nutrition activities; SPRING has developed a budget data analysis tool that can be used to assist in this process. 41 These analyses do not need to be as in-depth, and can be built into regular sector or NNAP coordination activities, as long as they engage all relevant stakeholders regularly and refer to the NNAP activities and objectives. It is also critical to identify where successes are occurring, in order to maintain motivation and capitalize on these positive changes.
Footnotes
Authors’ Note
This study was made possible by the generous support of the American people through the US Agency for International Development (USAID). The contents are the responsibility of JSI and do not necessarily reflect the views of USAID or the US Government.
Acknowledgments
The authors are thankful for the input and feedback provided by USAID Bureau of Global Health representatives Elaine Grey, Anne Peniston, Mike Manske, and Kellie Stewart, and USAID Uganda colleague Alfred Boyo. We would also like to thank Ssansa Mugenyi, Maureen Bakunzi, and Boaz Musiimenta from the Uganda Office of the Prime Minister for their kind support for this activity. We want to acknowledge our excellent technical partners Deutsche Stiftung Weltbevölkerung (DSW), USAID’s Nutrition Innovation Lab, and Manohar Shenoy, Sascha Lamstein, Louise Sserunjogi, Hallie Eilerts, and Heather Pitorak for their insights and contributions to this work. Finally, we owe a debt of gratitude to the key informants who participated in this study for their time and thoughtful insights into the nutrition prioritization and budgeting process.
Declaration of Conflicting Interests
The author(s) declared no potential conflicts of interest with respect to the research, authorship, and/or publication of this article.
Funding
The author(s) received no financial support for the research, authorship, and/or publication of this article.