
Abstract
Background:
The 2011 Uganda Nutrition Action Plan (UNAP) established 2016 maternal and child nutrition targets. However, there is a lack of routine district-level data collection to assess UNAP implementation.
Objective:
To use Nutrition Innovation Lab (NIL) data to inform policy makers on the progress of UNAP-related indicators.
Methods:
The NIL collected serial household-level survey data (n = 3600) in 6 districts, including 2 UNAP implementation districts, in 2012 and 2014. Questionnaires focused on food security, nutrition, and health, among others, and included specific indicators relevant to UNAP’s targets.
Results:
In 2012, outcomes in Kisoro and Lira districts were below national average for some UNAP key indicators, including dietary diversity and anemia prevalence, but above average for others (exclusive breastfeeding and underweight among women and children). The prevalence of child stunting was higher than national averages in Kisoro but below national averages in Lira. In 2014, anemia among women and children decreased significantly. Kisoro also saw improvements in several other UNAP target indicators including underweight, breastfeeding, and stunting.
Conclusion:
Although the study showed improvements in key UNAP indicators, there is a need to invest in appropriate methods to gauge its progress because the NIL was not designed to assess UNAP. Since the quality of implementation of complex multisectoral programs can differ widely across different contexts, it is critical that effective monitoring of progress be part of such programs. National endorsement of nutrition plans doesn’t in itself result in desired outcomes, hence, the allocation of scarce resources has to be based on rigorous evidence.
Keywords
Introduction
The Ugandan government recognizes that nutrition plays a crucial role in socioeconomic development. 1,2 It also recognizes that undernutrition is responsible for about 35% of deaths among children younger than 5 years due to stunting, severe wasting, and intrauterine growth retardation and needs to be in the forefront amid the country’s economic growth and poverty reduction efforts. 1,2 Child undernutrition in Uganda remains largely a “hidden problem”; for example, micronutrient deficiencies are high. Undernutrition remains one of the Uganda’s most fundamental challenges for human welfare and economic growth. It is against this background that the government developed the Uganda Nutrition Action Plan (UNAP) in 2011. 3 The UNAP is a national multisectoral nutrition plan developed by the Government of Uganda to ensure adequate nutrition to all Ugandans in order to live healthy and productive lives, especially reproductive-age women, infants, and young children. 3 Such an investment is a necessary prerequisite to help the country achieve the sustainable development goals and National Development Plan (NDP) objectives.
One NDP objective includes the commitment to significantly reduce stunting among children younger than 5 years from 33% to 25% by 2020. 4 The NDP incorporates nutrition as a crosscutting issue that requires multisectoral action in key sectors: health, agriculture, education, trade and industry, local government, and gender and social development. The development of the UNAP has created an unprecedented opportunity to achieve NDP objectives in nutrition. The UNAP’s ultimate goal is to reduce levels of undernutrition among reproductive-age women, infants, and young children; ensuring that all Ugandans are properly nourished will enable them to live healthy and productive lives. 3
The UNAP strategy targets the 1000-day period between birth and a child’s second birthday because of the increasing scientific evidence showing that meeting the specific nutritional needs during this period will positively influence short- and long-term health and development outcomes. Specifically, the developmental trajectories established in early life influence the response of an individual to later exposures. 5,6 The UNAP achieves its objectives in addressing the multiple forms and cause of undernutrition through building linkages among different sectors (public and private), implementing proven high-impact interventions in reducing maternal and child undernutrition, identification and implementation of cost-effective, scalable nutrition program models, and equipping local institutions to provide leadership and capacity in nutrition policy and programming.
There are several key elements that need to be in place for the successful implementation of such a national strategy. Firstly, there is a need to translate this strategy into operational guidelines and working documents. This information is disseminated to the local governance, local implementers, and subsequently to the frontline workers who are the key to implementation success in plans such as the UNAP. Second, there is a need for buy in at the local level for such implementation such that the disseminated information in the plan/strategy is actually implemented. Last but not least, a robust monitoring and surveillance system that will allow tracking of the progress in indicators that have been identified and ratified in the national plan is required.
Within this context, although UNAP is a well-developed plan, 3 the transfer of knowledge has not been adequate. This led to the establishment of the 2015 National Nutrition Planning Guidelines, 7 developed by the National Planning Authority. They call for more and better use of district-level data for planning. These guidelines are aimed at helping local government leaders identify, analyze, integrate, monitor, and evaluate nutrition issues as part of processes for sector development plans and local government development plans.
There is no established monitoring and evaluation system that is specific to the implementation of UNAP. Thus, understanding the progress on UNAP indicators requires the examination of existing data collected for other purposes. While not the most robust method, it will allow for the understanding of trends within the context of the implementation of UNAP. There are several sources of existing data including the Demographic Health Survey (DHS), the Health Information Management Systems (HMIS), and other population-based surveys such as the Uganda National Household surveys (UNHS). Challenges and limitations exist in utilizing any of these sources. For instance, the DHS is conducted approximately every 5 years, thereby not being extremely sensitive to the changes that could occur over shorter periods of time. Furthermore, the DHS sampling scheme is representative of national and regional but not local trends.
Another potential source of nutrition information comes from health-care facilities, especially from the HMIS of the Ministry of the Health. 8 However, the existing HMIS does not capture data to feed most of the UNAP indicators and there are no mechanisms to test for the reliability of the data. Furthermore, these data are not representative of all children within district and reflect only those households that have health-care-seeking practices. Similar to the HMIS and the DHS, the UNHS is not designed to answer questions at the district level. Small-scale surveys by academic institutions and partners lack a central repository of such data, and therefore, most information is lost or not compiled.
Several ongoing research activities in Uganda offer the potential for generating insights that would be useful to the government as well as donors and implementers. Two US Agency for International Development (USAID)-funded nutrition research activities were considered for such work: (1) household-level data collected by the Feed the Future Innovation Lab for Nutrition (hereafter the Nutrition Innovation Lab [NIL]) and (2) the Strengthening Partnerships, Results, and Innovations in Nutrition Globally (SPRING) project’s “Pathways to Better Nutrition” (PBN) case studies. In both of these operations, research activities provide data relevant to UNAP objectives. For the purpose of this article, we utilize the data from the district-level panels of the NIL to measure the UNAP indicators and examine progress, if any, in the 2 UNAP districts, Kisoro in the southwest of Uganda and Lira in the north of Uganda. Because of the limitations of these data sources for local-level monitoring, the NIL has collected and analyzed district’s nutrition-related data that can help districts evaluate progress on key UNAP indicators.
Methods
Two serial cross-sectional panel surveys were conducted by the NIL in the late 2012 and 2014. 9 These panel surveys are part of a study to understand the effectiveness of ongoing interventions such as the USAID Community Connector, which is an integrated nutrition program that is aligned to UNAP objectives. This study is a repeat panel survey on a sample of 3600 households from 4 subcounties of each district. In this article, we utilize 2 of the panels. The first panel was conducted in November 2011 to January 2012 and the second panel at the same time and on the same households in 2013/2014. There was an attrition of about 300 households in the second panel.
With respect to sampling and sample size, a priori, a district sample size of 600 households was determined as feasible within the existing budget and sufficient to represent the district size. A total of 4 subcounties were selected (3 USAID community connector and 1 randomly selected district counterfactual). At the subcounty level, 25% of the parishes were selected using a list from Uganda Bureau of Statistics (UBOS) and households were randomly selected with probability proportional to the population of the village. Prior to the selection of households to participate in the survey, the estimated number of households in each parish was obtained from UBOS. Using the population proportional to size (PPS) sampling at the parish level within each district, the number of households to be interviewed within each parish were then calculated. The calculated number of households to be interviewed in each parish was then allocated equally across all the villages within the parish. In some cases, a few additional households were added to make up the number needed from the parish. Given the use of PPS, the sample allocation at the parish level is considered self-weighting.
Ethical approvals of this study were sought and obtained from Makerere University School of Public Health, the Uganda Science and Technology Council, Tufts University, and the Harvard T.H. Chen School of Public Health.
The NIL panel study has 6 districts—3 in the north and 3 in the southwest. For the purposes of this comparative analysis and to account for differences in agroecology, culture, and ethnicity, we randomly selected 1 district from southwest—Kisoro—and 1 district from the north—Lira.
The survey focused on the household, the mother of the household (and/or primary care giver), 1 index child aged 6 to 23 months, and all other children between the ages of 0 and 59 months.
Data were collected electronically using predesigned questionnaires loaded onto computer-assisted personal interviewing equipment (android tablets) administered in person to mothers/caregivers and/or household heads in their homes. Data domains include household demographics (including education) and socioeconomic factors as well as the following topics: diet and health status of mothers/primary caregivers, household food security, water, sanitation, and hygiene, infant and young child feeding of the index child, and anthropometric and hemoglobin measurements of the index child, his/her primary caregiver/mother, and all other children in the household who were younger than 5 years.
We analyzed quantitative household-level panel data of the 2 study districts. Data on individual maternal and child outcomes were computed for n = 600 households in each study district, and SPSS version 22 was used for analysis. 10 The indicators selected for this analysis come from the UNAP’s table of key target indicators that have also been prioritized by the government of Uganda. 3
Anthropometric indices were calculated using the World Health Organization 2006 growth standards as a reference. 11 For all variables that utilized cutoffs, standard definitions were applied. The key variables that included cutoffs include height for age, weight for age, and weight for height (stunting, underweight, and wasting, respectively). The prevalence of anemia among mothers and children, as defined by hemoglobin below 12 g/dL in nonpregnant women and 11 g/dL for pregnant women and children, was also calculated. Comparisons of UNAP indicators were conducted by district frequency estimates and population means using the 2-sample t test to determine the significant difference between the 2 time periods.
Results
A total of 598 households in Kisoro and 603 households in Lira were surveyed in panel 1 and 544 households in Kisoro and 552 households in Lira were followed up in panel 2. The sociodemographic characteristics of the households included in the 2 panel surveys are provided in Table 1.
Sociodemographic Characteristics.a
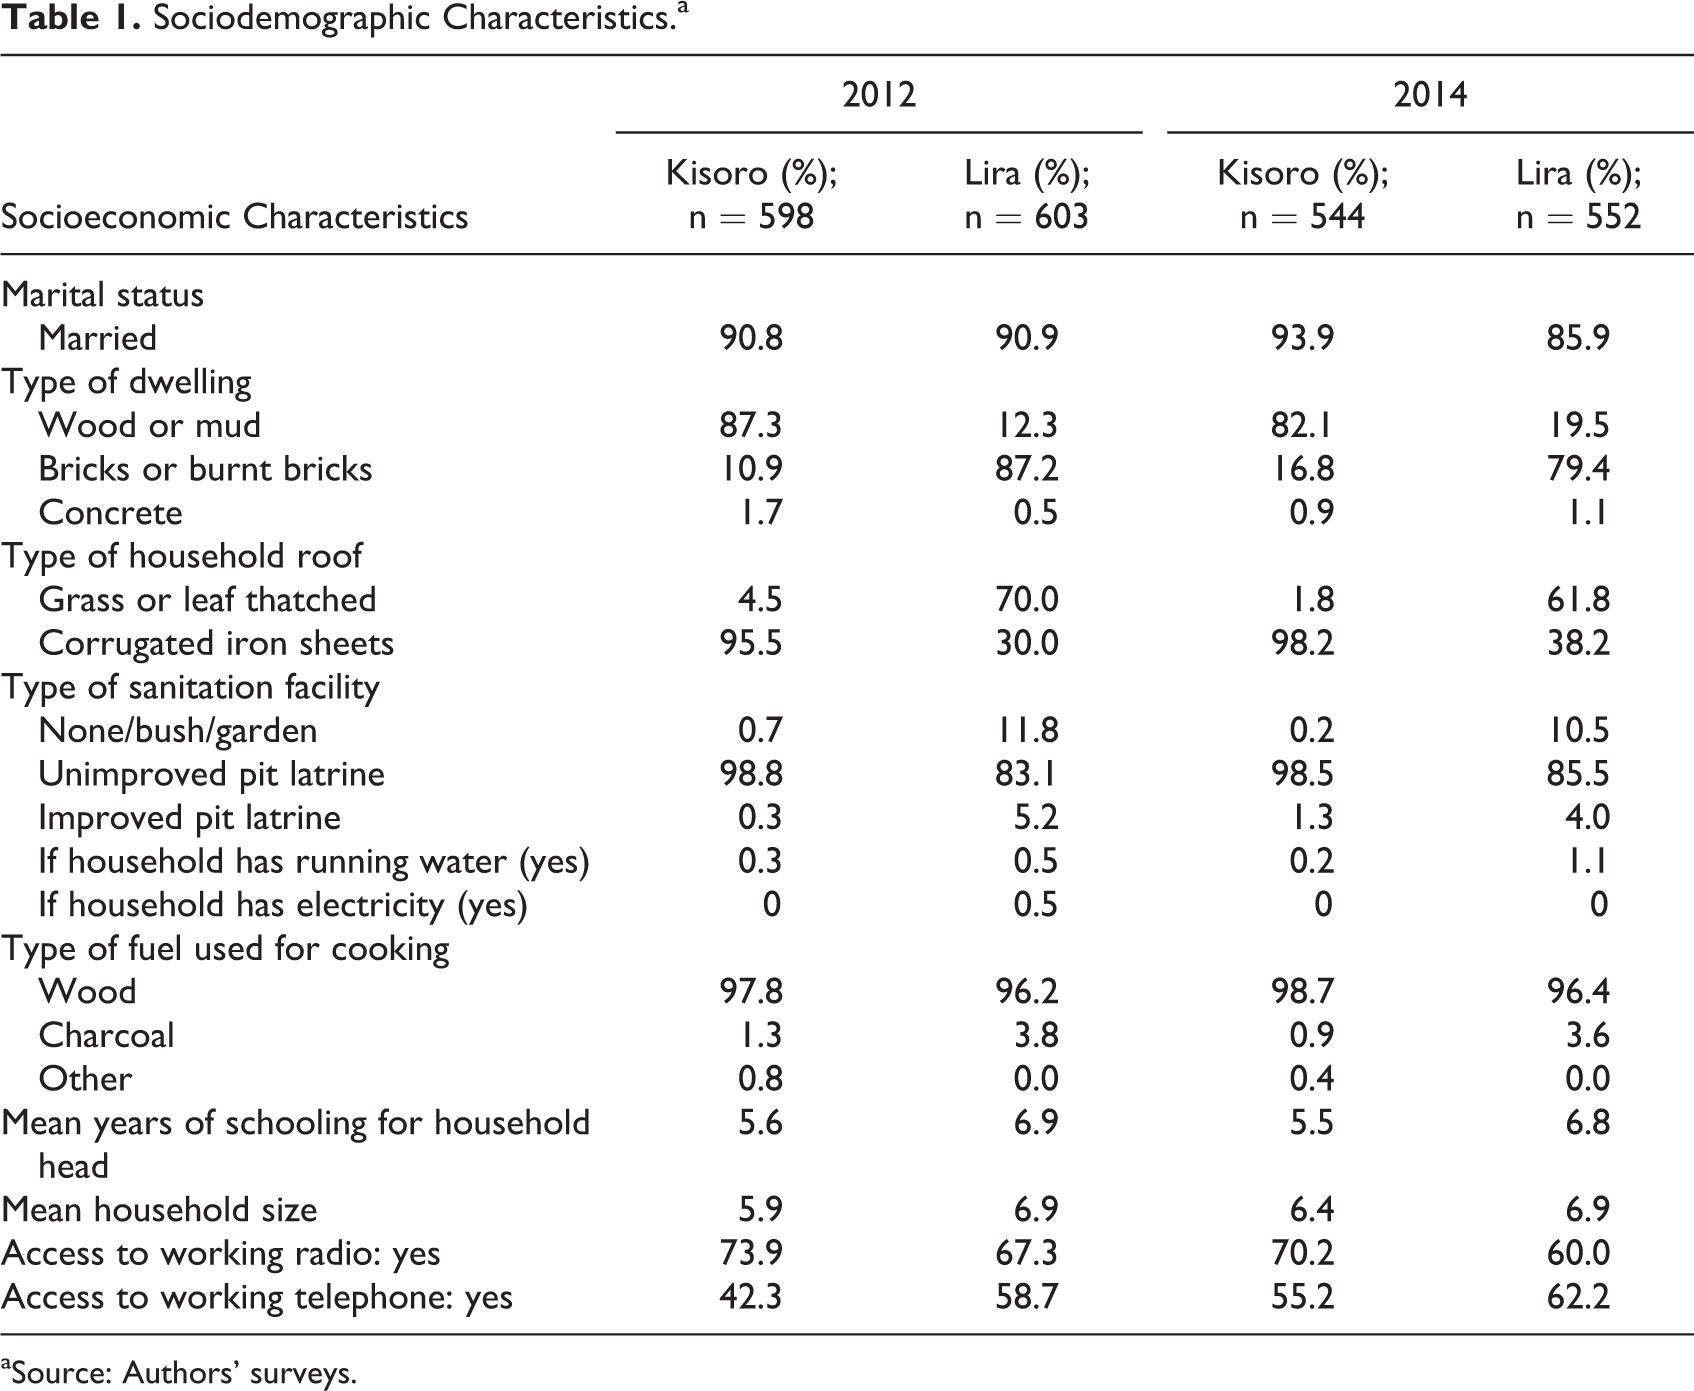
aSource: Authors’ surveys.
Tables 2 and 3 describe the status of UNAP target indicators in Kisoro and Lira in each round of the panel survey. We also provide the UNAP target level for each indicator, to be achieved by 2016.
Status of UNAP Target Indicators in Kisoro, 2011/2012 and 2013/2014.
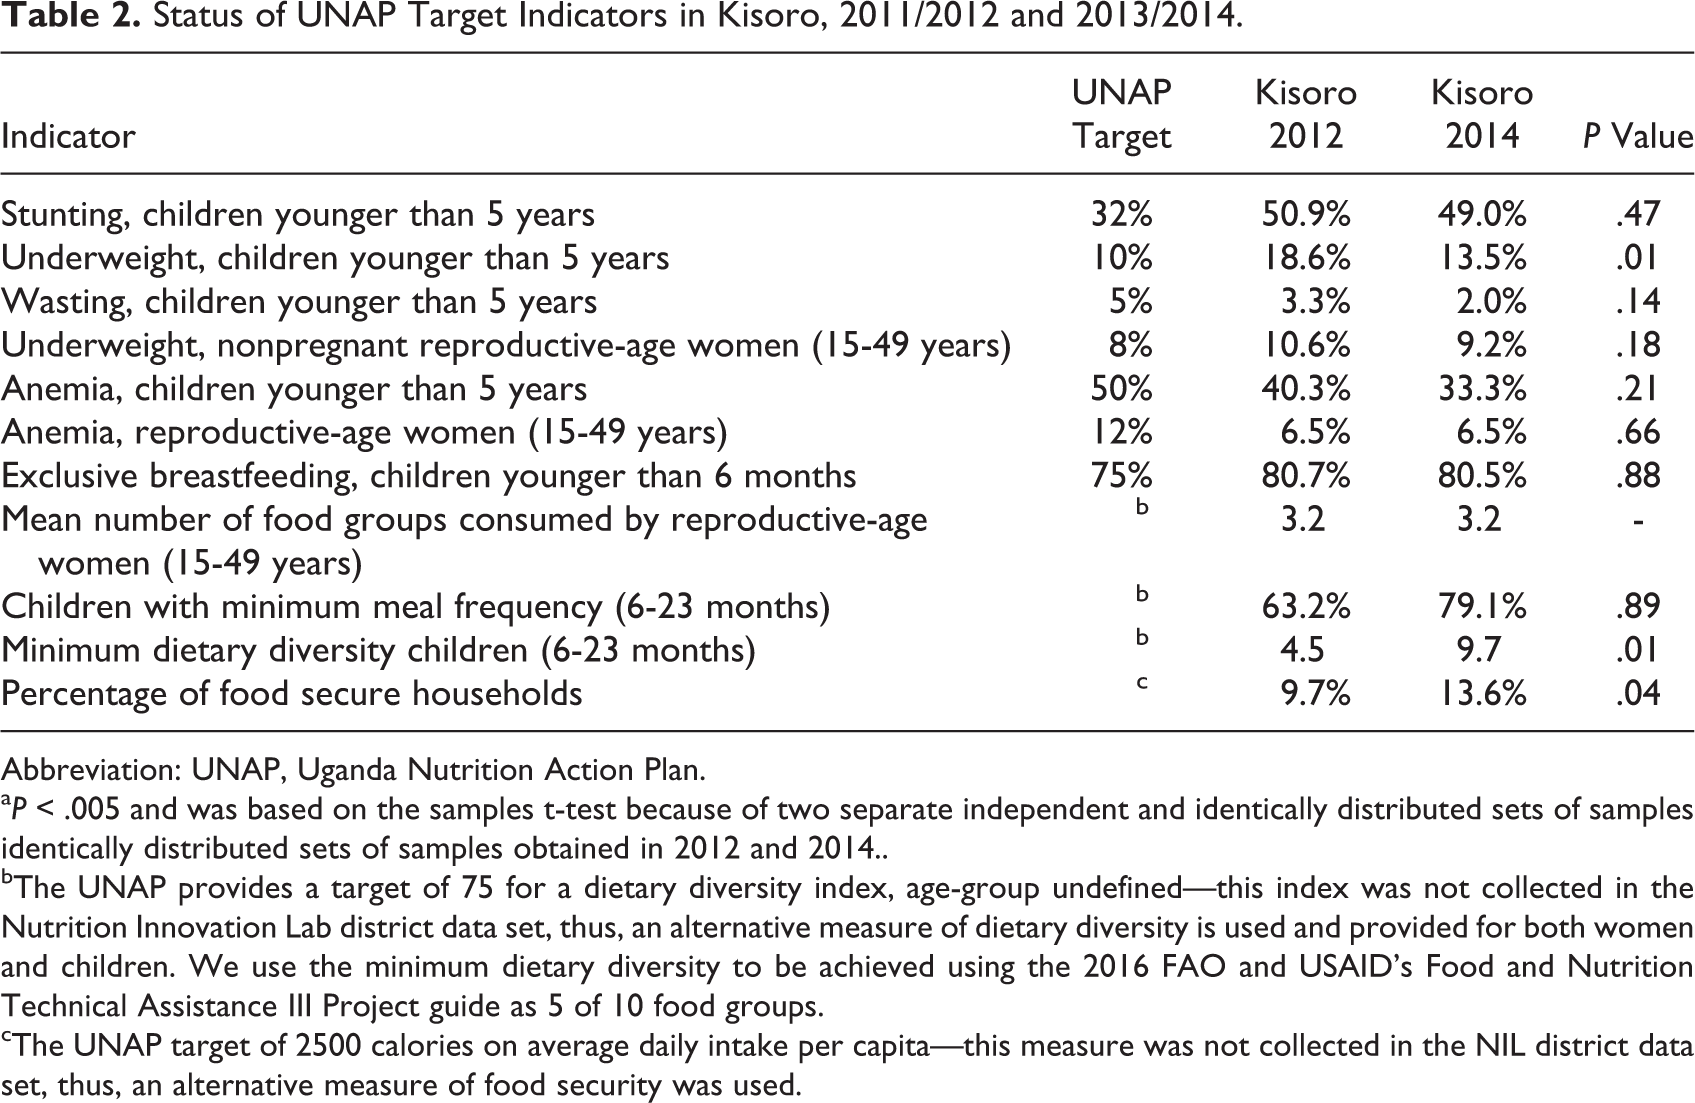
Abbreviation: UNAP, Uganda Nutrition Action Plan.
a P < .005 and was based on the samples t-test because of two separate independent and identically distributed sets of samples identically distributed sets of samples obtained in 2012 and 2014..
bThe UNAP provides a target of 75 for a dietary diversity index, age-group undefined—this index was not collected in the Nutrition Innovation Lab district data set, thus, an alternative measure of dietary diversity is used and provided for both women and children. We use the minimum dietary diversity to be achieved using the 2016 FAO and USAID’s Food and Nutrition Technical Assistance III Project guide as 5 of 10 food groups.
cThe UNAP target of 2500 calories on average daily intake per capita—this measure was not collected in the NIL district data set, thus, an alternative measure of food security was used.
Status of UNAP Target Indicators in Lira, 2012 and 2014.
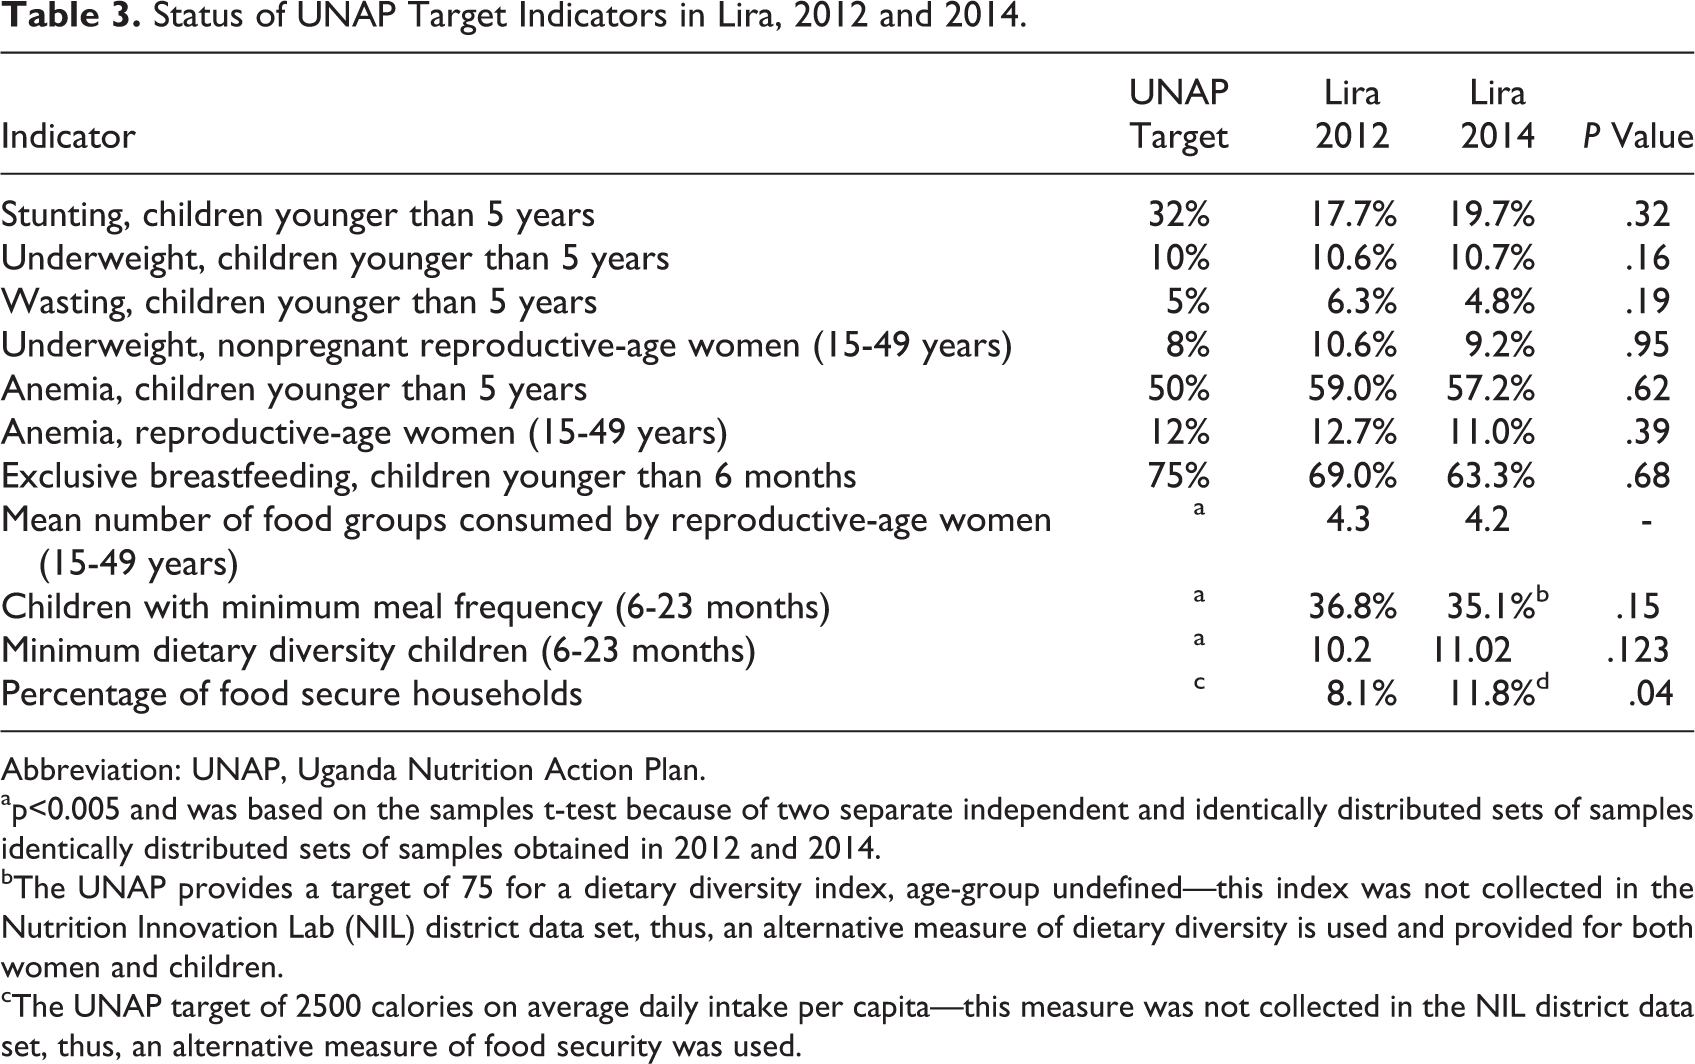
Abbreviation: UNAP, Uganda Nutrition Action Plan.
ap<0.005 and was based on the samples t-test because of two separate independent and identically distributed sets of samples identically distributed sets of samples obtained in 2012 and 2014.
bThe UNAP provides a target of 75 for a dietary diversity index, age-group undefined—this index was not collected in the Nutrition Innovation Lab (NIL) district data set, thus, an alternative measure of dietary diversity is used and provided for both women and children.
cThe UNAP target of 2500 calories on average daily intake per capita—this measure was not collected in the NIL district data set, thus, an alternative measure of food security was used.
The data in Table 2 show that a significant reduction occurred in the prevalence of underweight among children younger than 5 years in Kisoro district (P < .01). There was also a significant increase in children of 6 to 23 months receiving a minimum diet (P < .01). Other child nutrition indicators improved between the 2 rounds of the panel survey (wasting, iron deficiency—both in women and children—and exclusive breastfeeding), although the changes did not achieve statistical significance. The prevalence of stunting and underweight among children younger than 5 years is still above the UNAP targets. To achieve targets set by the UNAP, the prevalence of stunting would need to reduce by another 17 percentage points and the prevalence of underweight an additional 3.5 percentage points. Dietary diversity, a UNAP goal, was addressed. We note that the UNAP caloric intake target (2500 kcal/d for adults) requires quantitative dietary intake data that are rarely collected by field surveys.
The data in Table 3 are results for Lira district. They indicate that there has been little to no improvement in UNAP targets achieved in Lira for either children or their mothers/caregivers. None of the changes in the child nutritional status indicators—stunting, underweight, and wasting—were significant improved. Although, in most cases, the changes are positive (albeit not significant), for some indicators the change is negative. For instance, there is an increase in the prevalence of child anemia in the district, though it was not statistically significant. That being said, we find a positive and significant (P < .05) increase by 4% in food secure households based on the Household Dietary Diversity Score, which can reflect the ability of a household to access a variety of foods. The prevalence of exclusive breastfeeding also declined. Both of these could be the focus of enhanced district efforts.
Discussion
The NIL and the USAID/SPRING project have published district snapshots as part of the PBN case study evaluations that provide the status of the key target indicators from the UNAP in 2 districts, as well as the status of key infant and young child nutrition indicators related to the UNAP objectives. 12 The aim of these snapshots was to identify the diversity of factors affecting undernutrition in these districts at the time of the UNAP’s commencement (∼2011). We build on that analysis to provide a comparison of prevalence on these indicators in the 2 districts at the midpoint of the UNAP (2013-2014). This article addresses how using nutrition data at the district level can help districts monitor UNAP targets and outcomes and better plan and coordinate nutrition activities. We analyzed 2 aims in 2 districts as an example of how a critical data gap can impede effective decision-making for nutrition in Uganda, particularly related to the UNAP and inform decision-makers.
We demonstrate that NIL data can be used to understand progress in achieving Ugandan national goals at the district level. In Table 1, we have highlighted the baseline socioeconomic status of households in Lira and Kisoro. Tables 2 and 3 show the status of UNAP target indicators in Kisoro and Lira in 2012 and 2014. We have noted in Tables 2 and 3 the positive changes on key UNAP indicators for both maternal and child nutrition and food security over a 2-year period. Overall improvements in reduction of anemia and wasting and improvements in the number of children having a minimum dietary diversity and exclusive breastfeeding can potentially contribute to the reduction in morbidity and mortality. The statistically significant reduction in underweight levels could be related to improved food security and other Maternal, child health and nutrition (MCHN) initiatives. We have also outlined how these data could provide a rationale for targeted district efforts to address unchanging or worsening nutrition metrics.
In Uganda, nationally relevant MCHN initiatives including the USAID-funded Community Connector project, the SPRING and Food and Nutrition Technical Assistance III Project III projects, and those of the Government of Uganda, United Nations Children’s Fund, and other stakeholders may not explain such improvements. It could also be reflective of secular trends in these districts (that is, changes that occur irrespective of intervention). Multistakeholder initiatives have proved to be influential and locally owned and more sustainable than single-stakeholder initiatives. 13 However, ascribing a given change to a specific project is difficult. We believe that a strong District Nutrition Coordination Committees’ (DNCCs) role in nutrition planning and implementation, particularly in Kisoro, may explain the significant changes in child-related nutrition indicators indicated in Table 2. The Kisoro DNCC has been very influential in building strong coordination, monitoring, and collaboration of a variety of stakeholders in helping district leadership align its nutrition targets with different implementing partners. 14 A strong DNCC can help coordinate the work of multiple actors in the district context and form a bridge to the various district administrative actors that characterize a multisectoral effort.
The UNAP target indicators were chosen as sentinels of better nutrition in the Ugandan population. The data outlined above toward the UNAP 2016 targets indicate some progress is occurring in these districts to support the nutritional needs of women and children. The results of the PBN study of the SPRING project 15 showed that the UNAP has played an important role in increasing knowledge, perceptions, and behaviors related to planning and financing for nutrition. There was also an increase in understanding and penetration of the UNAP into existing nutrition stakeholder organizations. This may help explain the positive changes in this publication. Combining enhanced knowledge and behaviors with actual performance data may optimize planning, implementation, and the achievement of targets.
Continually assessing nutrition indicators at the district level can support district decision-makers to achieve UNAP-derived nutrition goals. This is all the more critical, given the meager nutrition-specific resources available to Ugandan district governments. This can also help districts to align their development partners to district goals by mapping district needs to possible interventions. Using data for monitoring district performance also signals commitment to nutrition goals by district leadership and the DNCC. This is often a symbolically important first step in combating the causes of undernutrition. Monitoring data can be used by a DNCC to persuasively advocate for comprehensive, multisectoral planning at the district level.
In 2015, the Uganda National Planning Authority developed the National Nutrition Planning Guidelines for Uganda. It dedicated a chapter to planning for nutrition at local government levels, outlining the steps required for such activities. It underscored the importance of using evidence to monitor nutrition programs at the district level. It should be noted that although districts may have challenges in accessing representative nutrition data that is up-to-date, districts can increase their capacity to utilize other existing databases such as the District Health Information System (DHIS-2), 16 which has data on nutrition from different health facilities and community sites and can be used for planning. The use and analysis of data from organizations such as the NIL, the DHIS, or other sources may challenge district administrations. This challenge can be mitigated by the efforts of planning units, with biostatisticians, at the district level. These units can align district human resources with the available data resources to produce data useful to planning and implementation efforts to achieve nutrition goals.
Conclusion
This analysis showed improvements in key UNAP indicators. Although we are able to note such improvements, there is a need to invest in appropriate methods to gauge its progress toward its goals because the NIL or other surveys are not designed to assess this. There are also other investments going on or it could be a reflective of secular trends in these districts. Also since the quality of implementation of complex multisectoral programs can differ widely across different geographies and infrastructural contexts, it is critical that effective monitoring of progress be part of all such programs. National endorsement of nutrition plans does not in itself result in desired outcomes, hence, the allocation of scarce resources has to be based on rigorous evidence. We also believe that Ugandan districts should develop better capacity to acquire and use data relevant to nutrition targets. Empowering DNCCs to use data in planning is critical since they are the custodians of nutrition planning at the district level. We have shown that NIL data can be used to track UNAP indicators until more routine systems are developed. Furthermore, we suggest that districts should explore incorporating UNAP target indicators into existing systems such as DHIS-2 monitoring data for district local government planning.
Footnotes
Acknowledgments
The authors wish to thank Dr. Patrick Webb and Hassan Waswa at IFPRI Kampala office for their comments and support during the development of the transcript.
Declaration of Conflicting Interests
The author(s) declared no potential conflicts of interest with respect to the research, authorship, and/or publication of this article.
Funding
The author(s) disclosed receipt of the following financial support for the research, authorship, and/or publication of this article: Authors acknowledge funding for the research from Feed the Future Nutrition Innovation Lab as well as SPRING Project.