
Abstract
Retailing plays a pivotal role in the functioning of urban systems. While upstream supply chain activities such as manufacturing and distribution primarily affect freight movement, the retail interface translates consumer demand into individual travel behavior, shaping local traffic conditions and feeding back into upstream logistics. Despite its importance, shopping-related travel remains under-modeled in urban mobility research. To address this gap, this study develops a purpose-specific travel forecasting and simulation framework for predicting shopping trip demand in urban areas. The forecasting model integrates commercial-environment attributes, trip characteristics, and sociodemographic factors. A suite of machine learning (ML) models is evaluated, and the best-performing model is selected for the proposed simulation. Microlevel predictions are then scaled to the full urban region, followed by zonal aggregation and k-means spatial clustering to identify distinct retail-demand patterns and support scenario testing. Numerical results show that the random forest model outperforms alternative ML classifiers and, when implemented in the simulation, generates a citywide estimate indicating that shopping trips represent 14.3% of all weekday travel, in line with external regional benchmarks. The combined ML–simulation framework demonstrates strong predictive performance and reveals meaningful spatial and behavioral insights relevant to policymaking and planning applications. Although applied to Halifax, the modular structure of the framework makes it transferable to other urban regions and adaptable to additional trip purposes, supporting future extensions involving multiactivity modeling, causal impact analysis, and integration with passive mobility datasets.
Keywords
Introduction
The supply chain spans from raw material extraction to manufacturing, distribution, and ultimately retailing, where goods and services reach the end consumer. Each segment of the supply chain is interconnected, collectively shaping the movement of goods and the corresponding transportation patterns, as illustrated in Figure 1. While upstream components such as production and distribution are central to freight logistics, the retail phase, particularly the consumer interface, plays a disproportionately significant role in shaping urban mobility patterns ( 1 ). Consumer demand directly drives personal travel behavior, influencing traffic flow, congestion levels, land use policy development, and the larger structure of urban transportation systems ( 2 ).
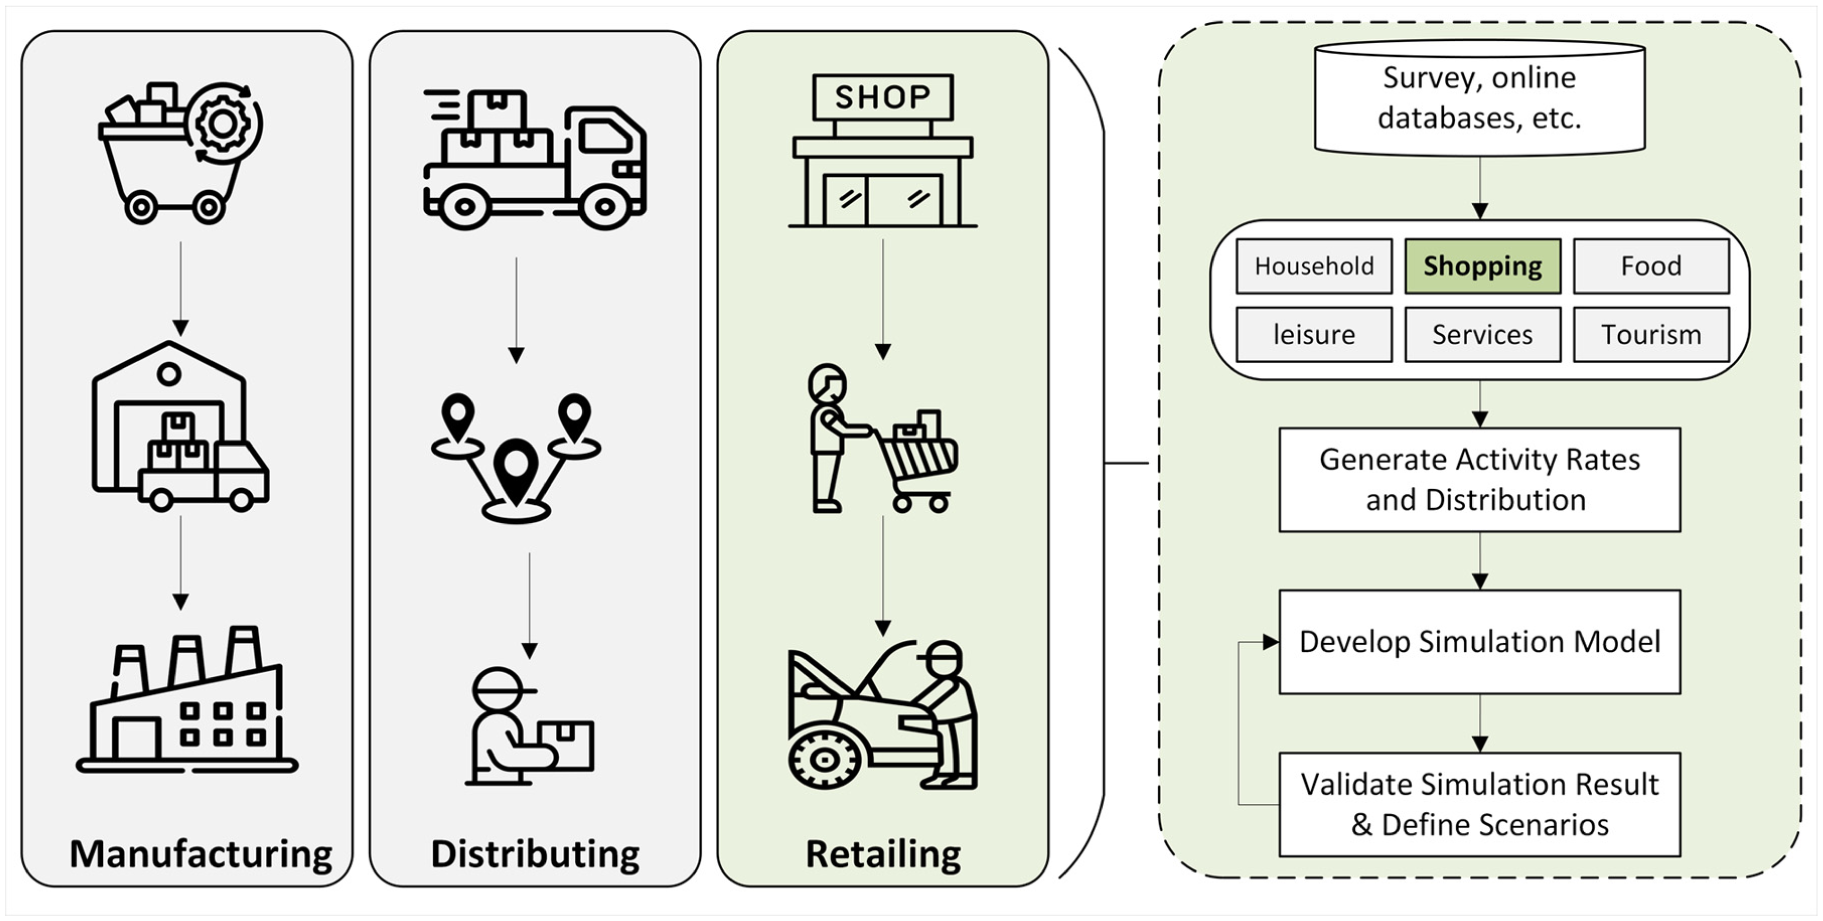
Proposed framework for simulating shopping-related travel behavior in the supply chain and urban transportation context.
Urban travel behavior has undergone substantial transformation in recent decades. While commuting continues to receive significant planning attention, nonwork travel including shopping, leisure, and personal business accounts for a growing share of overall trip demand in many metropolitan regions ( 3 – 5 ). Shopping trips, in particular, differ fundamentally not only from mandatory travel such as commuting, school trips, and medical appointments, but also from routine maintenance activities such as banking or administrative errands. They are largely discretionary, exhibit greater temporal flexibility, and are often embedded within multipurpose trip chains rather than being standalone activities. Their timing, frequency, and spatial distribution vary widely across individuals and are heavily shaped by retail accessibility and household needs ( 6 ), making them more behaviorally complex and less predictable than fixed-schedule travel ( 7 ). Therefore, in rapidly growing cities, such trips can significantly contribute to congestion in commercial corridors and create new demands for parking, transit, and curbside infrastructure ( 8 ).
The integration of in-person shopping and e-commerce has introduced new complexities into travel behavior and urban logistics systems ( 9 – 11 ). These shifts highlight the limitations of traditional four-step models, which rely on zonal averages and broadly categorize trip purposes, often overlooking individual-level and context-specific variation ( 12 ). In particular, the four-step model is less suited to representing shopping travel because its aggregate structure offers limited sensitivity to behavioral heterogeneity, trip chaining, temporal flexibility, and retail-specific built environment characteristics. As a result, it may not fully capture the discretionary and spatially diverse nature of shopping trips. More recent methods, including regression-based and machine learning (ML) approaches, have improved travel demand prediction. While some recent studies such as Dasoomi et al. ( 13 ) apply ML to shopping-related behavior, the broader travel-demand literature such as Ghasri et al. ( 14 ) and Morton et al. ( 15 ) still focuses mainly on commuting or total trips, and purpose-specific models that incorporate commercial and trip-level attributes remain limited.
To address these gaps, we propose a disaggregate, bottom-up framework for modeling, forecasting, and simulating shopping-related travel behavior in urban environments. Unlike conventional top-down approaches, our framework captures heterogeneity at the individual and household level. It leverages detailed travel survey data including trip-level attributes (e.g., purpose, mode, timing), sociodemographic variables (e.g., age, car ownership), and business-side characteristics (e.g., proximity to stores, commercial density) to develop a ML model for predicting shopping trips. These predictions are then scaled through a synthetic population simulation to estimate citywide demand. The added value of simulation is that it extends individual-level ML predictions to population-scale, spatially explicit demand estimates, enabling scenario testing under alternative demographic, retail, and land-use conditions. The resulting outputs enable spatial clustering of traffic analysis zones (TAZs) based on shared demand patterns, supporting evidence-based policy design related to retail accessibility, congestion management, and land use planning.
Literature Review
Travel demand forecasting has evolved considerably over the decades, moving from traditional four-step models to more behaviorally nuanced, data-driven approaches ( 12 , 16 ). While four-step models remain foundational for forecasting trip generation, distribution, mode choice, and route assignment, their aggregate structure limits their ability to represent individual-level behavior and finer contextual influences relevant to discretionary travel. To overcome these limitations, disaggregate methods such as activity-based models and ML techniques have been developed to offer greater realism and adaptability ( 17 , 18 ), especially for evaluating discretionary shopping travel patterns.
Early efforts to model shopping travel predominantly used regression-based approaches, often relying on gross floor area (GFA), a measure of the total floor space within a building, as the primary predictor of trip generation. For example, Portugal et al. ( 19 – 21 ) applied linear models with GFA, parking, and occasionally the number of stores or restaurants. However, these models lacked behavioral granularity and often overestimated trip rates when generalized trip generation rates were used (e.g., Institute of Transportation Engineers [ 22 ]). Kikuchi et al. ( 23 ) conducted a field-based study in Delaware to calibrate trip attraction rates, but did not account for sociodemographic or behavioral features. Similarly, Al-Masaeid et al. ( 24 ) modeled trip generation using GFA and employment numbers but failed to capture trip chaining or temporal flexibility. More recent models such as those by Meena and Patil ( 25 ), Rogić et al. ( 26 ), and Bujak et al. ( 27 ) introduced better spatial calibration but still operated at an aggregate level, overlooking individual variation and behavioral complexity.
In response, data-driven approaches have emerged to address these limitations. Ghasri et al. ( 14 ) developed a random forest (RF)-based model capable of predicting trip generation, purpose, mode, and timing at the individual level, using sociodemographic features and built environment indicators, including the SocioEconomic Indexes for Areas. However, their model was general-purpose and did not focus on shopping trips. Morton et al. ( 15 ) applied eXtreme Gradient Boosting regression to model commuting trips, incorporating land use and census data, but also excluded discretionary travel. Similarly, Li and Guo ( 28 ) employed a generative adversarial network (GAN)-based approach to simulate trip travel time variability, offering a general-purpose model without purpose-specific modeling or behavioral features.
More recent studies have begun to incorporate advanced ML architectures for retail-related forecasting. Dasoomi et al. ( 29 ) developed a convolutional neural network model combined with a gray wolf optimization focused specifically on shopping trips, using input features such as delivery cost, timing, product price, and car ownership. In a related study, Dasoomi et al. ( 13 ) trained a deep neural network to classify online versus offline shopping behaviors based on sociodemographic variables such as age and vehicle ownership. Naji et al. ( 30 ) used a GAN-based model to forecast taxi demand using GPS, weather, and point of interest data, offering valuable insight into short-trip urban mobility, albeit not tailored specifically to shopping. Rakić et al. ( 31 ) developed a regression model for southeast European cities to estimate shopping-related traffic based on location, GFA, and population metrics. Though effective for localized forecasting, these models often rely on region-specific or high-resolution data, restricting their generalizability and suitability for simulation-based policy analysis. Table 1 summarizes the relevant studies on travel demand forecasting, highlighting a growing interest in modeling shopping-related travel using data-driven and artificial intelligence-based methods. However, the existing literature is subject to the following several limitations:
Lack of purpose-specific modeling. Many models generalize across all trip purposes (e.g., [14, 22]) or focus on commuting (e.g., [15, 28]), overlooking the distinct behavioral dynamics of shopping travel.
Underutilization of commercial and locational attributes. While GFA remains a common predictor, there is a limited integration of retail-side or business attributes in many predictive frameworks. Studies such as Dasoomi et al. ( 13 ), Goldner and Portugal ( 20 ), Al-Masaeid et al. ( 24 ), and Naji et al. ( 30 ) largely omit business-side diversity and proximity effects.
Limited behavioral and trip features. Shopping trips are often flexible, multipurpose, and influenced by sociodemographic factors. Yet, models such as Andrade and Portugal ( 19 ), Bujak et al. ( 27 ), and Kikuchi et al. ( 23 ) are based on static regression frameworks, lacking behavioral or trip-related components.
Insufficient clustering outputs. Despite growing use of ML and simulation, few studies translate their results into strategic, zone-level outputs that are directly usable for planning. While Rogić et al. ( 26 ) and Rakić et al. ( 31 ) incorporate location type, their forecasts are not readily integrated into planning tools or scenario testing platforms.
High data requirements. Models such as Dasoomi et al. ( 13 ), Dasoomi et al. ( 29 ), and Naji et al. ( 30 ) demonstrate strong predictive performance, but depend on detailed behavioral surveys or GPS-based data, limiting scalability in resource-constrained settings.
Summary of Relevant Travel Demand Forecasting Studies
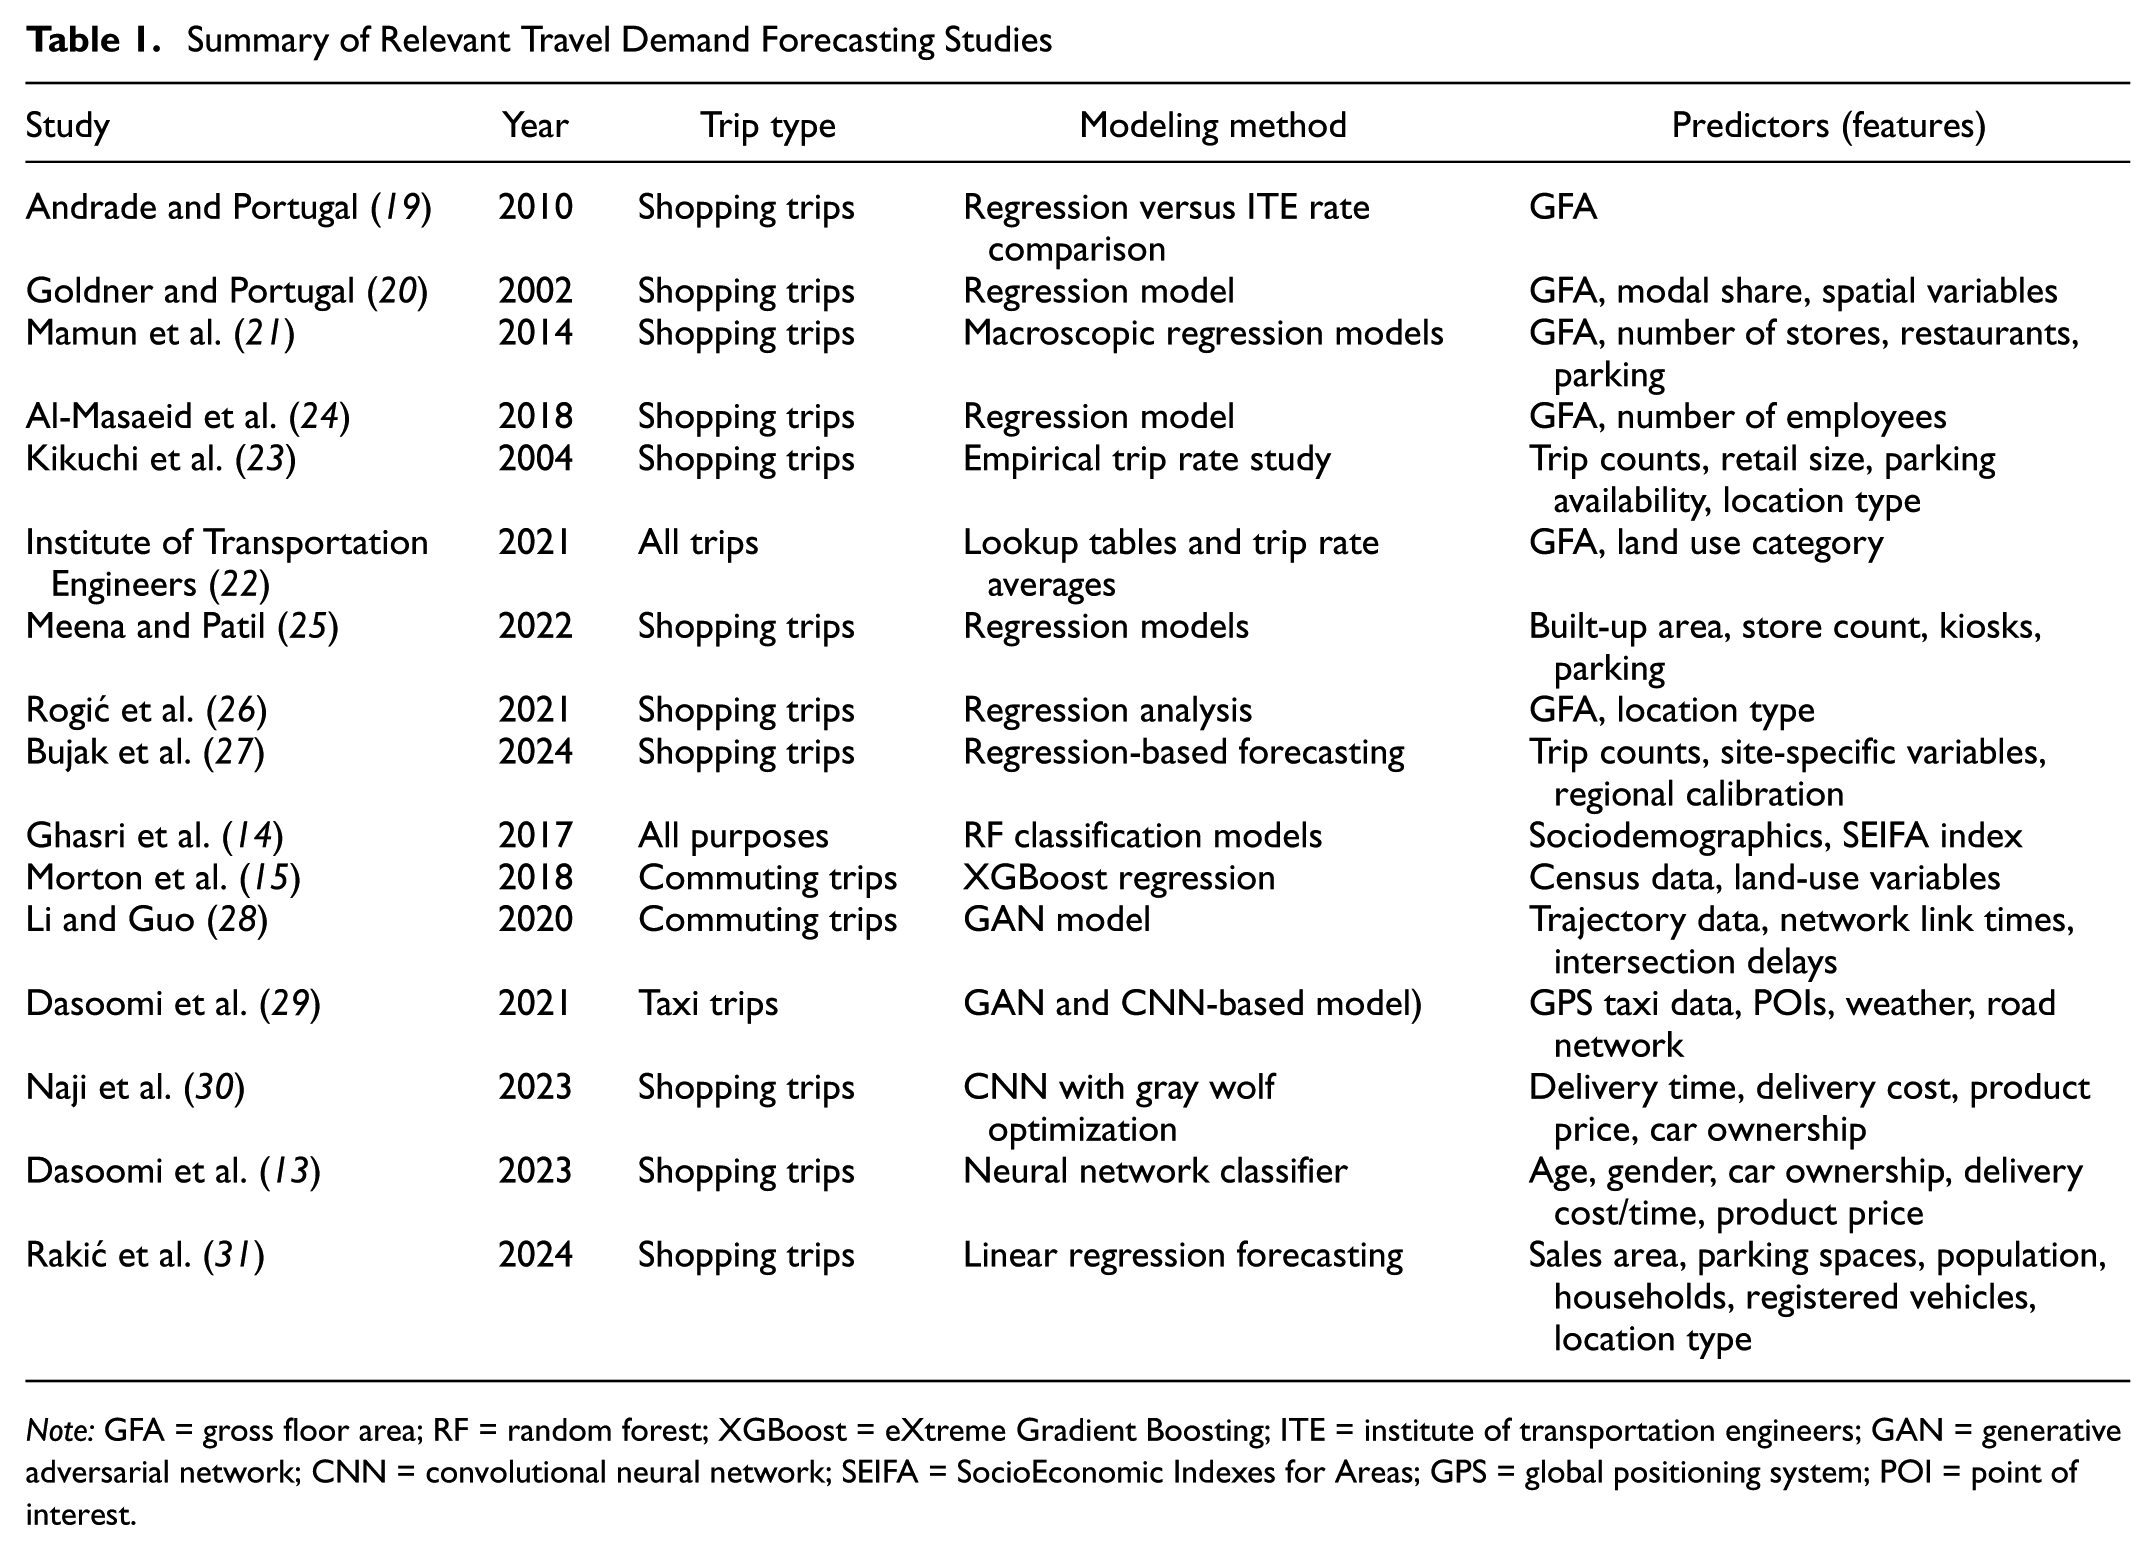
Note: GFA = gross floor area; RF = random forest; XGBoost = eXtreme Gradient Boosting; ITE = institute of transportation engineers; GAN = generative adversarial network; CNN = convolutional neural network; SEIFA = SocioEconomic Indexes for Areas; GPS = global positioning system; POI = point of interest.
Research Contributions
To address the limitations in existing travel demand models, this study introduces a comprehensive and purpose-specific framework that takes into account the retail business environment for forecasting shopping-related travel behavior. Unlike generalized models that focus on commuting or overall travel demand, our approach is specifically tailored to in-person shopping trips. It builds on detailed individual-level travel survey data and integrates ML and simulation techniques to extend predictions to the city scale. The model incorporates individual sociodemographic factors, trip characteristics, and commercial attributes to provide a behaviorally grounded view of retail-driven mobility. The framework is also designed to generate spatially interpretable outputs for planning applications. By simulating shopping activity at the population level and clustering spatial units with similar travel patterns, the framework offers policymakers a practical tool for urban planning and land-use decisions. The key contributions of this study are as follows:
Purpose-specific and integrative ML modeling. The forecasting framework is uniquely designed to model shopping trips by integrating diverse attributes, including commercial-environment variables, trip-level factors, and individual demographics, to capture the multifaceted nature of shopping behavior. From a planning perspective, this purpose-specific modeling helps explain how retail land-use patterns and demographic characteristics shape shopping mobility, informing decisions on retail zoning, mixed-use development, and accessibility planning.
Simulation-driven framework for modeling shopping travel behavior. By combining microlevel ML predictions with a synthetic population simulation, the model estimates shopping activity across a large population and supports citywide scenario testing. This integration captures population-scale demand forecasts and enables flexible forecasting under various planning assumptions (e.g., retail rezoning and demographic shifts). This scenario-testing capability provides planners with a tool to assess the impacts of interventions such as new commercial centers, retail corridor redevelopment, or population growth in emerging neighborhoods.
Behaviorally informed spatial clustering for strategic planning. The proposed framework generates spatially explicit, behaviorally grounded outputs and clusters zones with similar retail-demand profiles. The clustering analysis offers a clear typology of zones that supports targeted planning interventions and enables scenario testing for various policy strategies, allowing planners to assess their impacts on shopping travel demand across different demographic and spatial contexts. These spatial typologies can help planners identify areas with high retail travel demand, accessibility gaps, or emerging retail hubs, thereby supporting more effective planning of commercial services and transportation infrastructure.
Together, these contributions directly correspond to the gaps identified in the literature review, particularly the need for purpose-specific modeling, integration of commercial and behavioral attributes, and spatially interpretable outputs. More importantly, the proposed framework links travel demand modeling with practical planning by converting behavioral predictions into actionable spatial insights for retail and land-use–transport planning. To the best of our knowledge, this is the first study to develop a purpose-specific forecasting and simulation model for shopping travel that simultaneously integrates business characteristics, trip attributes, and individual-level behavioral factors.
Study Area and Data Description
The Halifax Regional Municipality (HRM) is a midsized and rapidly growing Canadian region with a compact urban core surrounded by auto-oriented suburban communities ( 32 ). Retail activity is highly concentrated in major commercial hubs such as Bayers Lake, Dartmouth Crossing, Mic Mac Mall, and Sunnyside Mall, which generate substantial cross-zone travel ( 33 ). HRM exhibits relatively high car ownership and limited transit accessibility to suburban retail areas, contributing to strong reliance on personal vehicles for shopping trips ( 34 ). These characteristics, that is, continued population growth, dispersed suburban development, and big-box retail clusters, make HRM a representative case for studying shopping-related travel demand in North American midsized cities ( 35 ).
This study draws on two primary datasets. The first is individual-level travel behavior data collected through the 2022 HaliTRAC survey, administered by the Dalhousie Transportation Collaboratory (DalTRAC) in partnership with the HRM. The survey employed a multiphase, multi-instrument data collection approach, including online questionnaires, telephone interviews, and mail-back surveys, to ensure broad participation from a diverse cross-section of households across the municipality, located in Nova Scotia, Canada. A randomized sampling strategy, incorporating landline, digital and social media-based recruitment, was used to enhance coverage and representativeness.
The demographic and behavioral characteristics captured in the HaliTRAC dataset closely mirror the regional census distributions, with deviations ranging from 0% to 7%. This high degree of alignment confirms the dataset’s suitability for modeling urban travel behavior and provides a robust empirical foundation for simulating shopping-related travel patterns across the population. (For further details on the HaliTRAC survey, refer to Rifat Hossain Bhuiyan and Ahsanul Habib [ 36 ]). This study focuses on HRM-based households from the survey, resulting in 3,731 households, which collectively reported 13,242 trips. Of these trips, 3,775 were identified as shopping trips, while the remainder were nonshopping trips. Importantly, the forecasting model is trained on the full set of all 13,242 trips as the prediction task is formulated as a binary classification problem (shopping versus nonshopping). This ensures a sufficiently large dataset for supervised ML. This dataset serves as the basis for data cleaning, model training, and validation.
The second dataset utilized in this study is the InfoCanada Business database, provided by Data Axle Canada ( 37 ), which compiles firm-level panel data through government filings, business directories, websites, and phone verifications. This commercial dataset offers comprehensive annual snapshots of business establishments across Canada, making it particularly useful for spatial and longitudinal analysis because of its extensive coverage and geographic precision. For this study, we used the most recent available dataset for the HRM, extracting detailed information on 715 shopping destinations, including grocery stores, retail outlets, and other businesses that influence in-person shopping behavior.
Methodology
The proposed methodology is a multistage framework for forecasting shopping trip demand, integrating data processing, ML, simulation, and spatial clustering, as illustrated in Figure 2. Each component of the framework is described in detail in the following subsections.
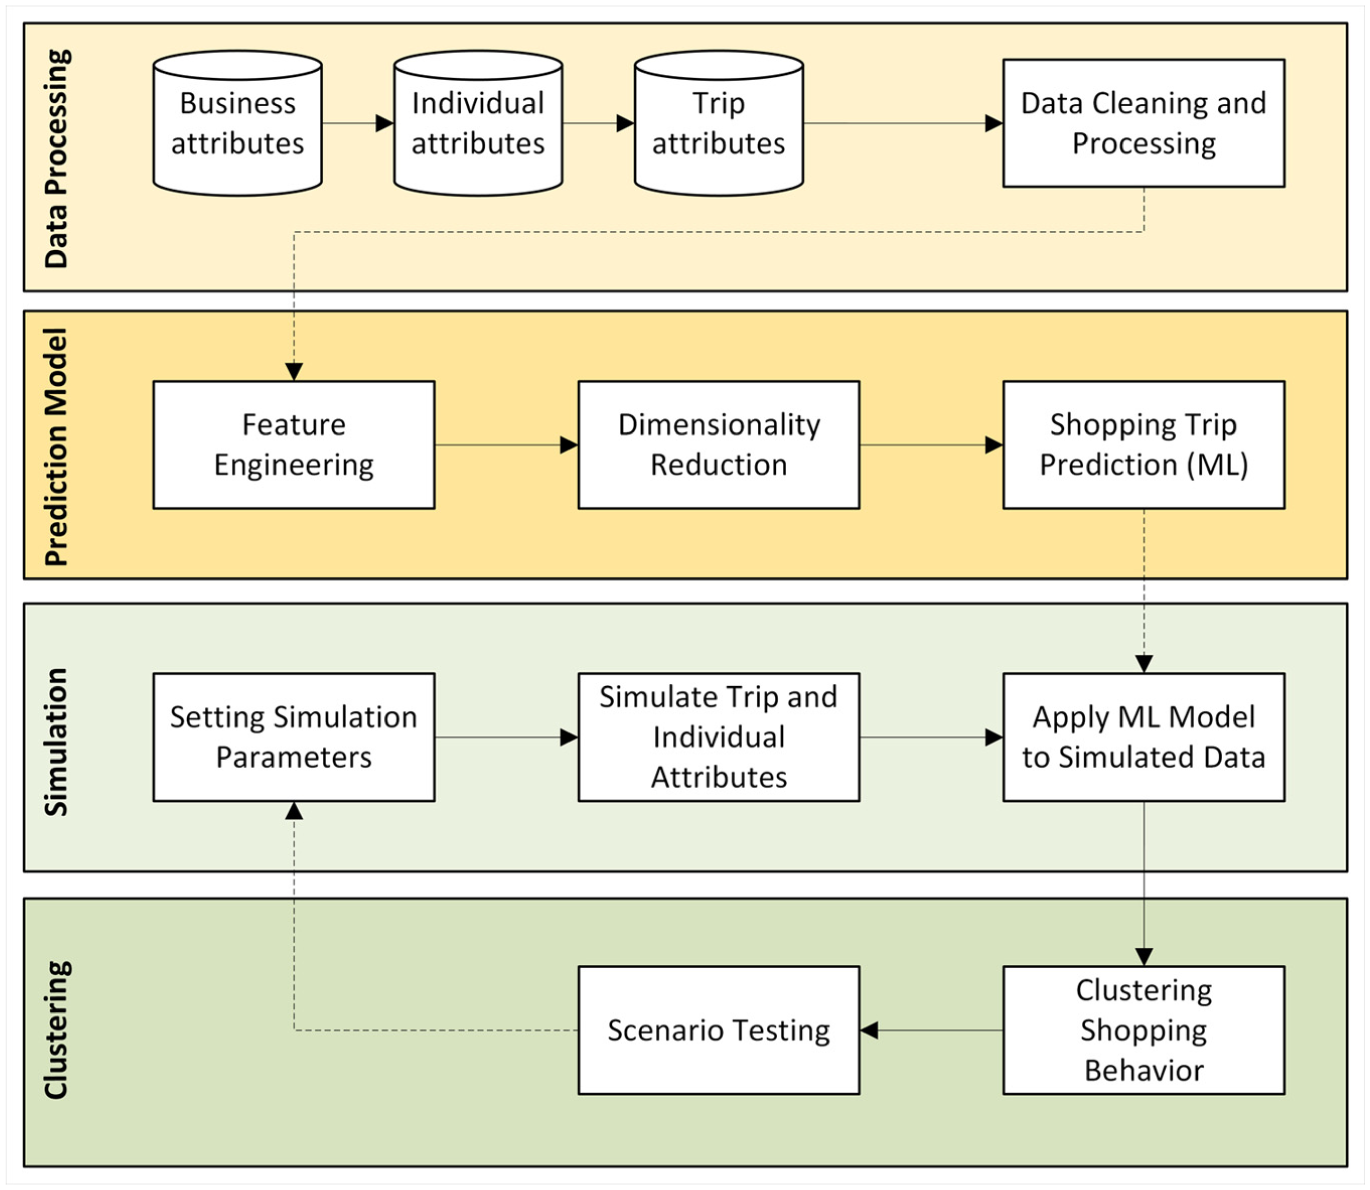
Proposed shopping trip forecasting and simulation framework (Solid arrows represent the primary sequential workflow and dotted arrows indicate cross-stage flows).
Data Processing
The first phase of this methodology involved developing a comprehensive data processing framework to integrate multiple information sources, moving beyond the limitations of conventional travel behavior studies. While traditional approaches often emphasize household demographics or spatiotemporal trip patterns, our framework incorporates a richer set of predictors spanning three complementary domains: individual attributes, trip-level characteristics, and business environment factors. To this end, we first integrate two primary sources: the HaliTRAC household travel survey, which provides individual- and trip-level information, and the InfoCanada Business dataset, which supplies geospatial records of retail establishments. These datasets were first harmonized and then processed to ensure consistency, comparability, and suitability for ML applications.
To ensure consistency and analytical robustness of the combined dataset, missing values were imputed or removed based on their frequency and contextual relevance, and categorical inconsistencies (such as variations in employment-status entries) were standardized. Numerical variables exhibiting nonlinear behavioral patterns (e.g., age and trip arrival time) were discretized into categorical bins. All categorical variables were subsequently transformed into binary indicators using one-hot encoding, preserving their nonordinal nature and ensuring compatibility with ML algorithms.
Table 2 provides an overview of all variables, including their encoded (dummy) forms used in model training. Individual attributes (e.g., income, employment status, age, education, and shopping frequency) capture sociodemographic variations that influence shopping propensity. Trip attributes including origin and destination TAZs represent spatial dimensions of travel; zone identifiers were treated as categorical variables and encoded as dummies to preserve their spatial meaning and avoid unintended numerical interpretation. Business environment attributes (e.g., access to grocery stores or malls and the number of retail establishments in each destination TAZ) reflect commercial opportunities that shape destination attractiveness and shopping accessibility.
Overview of All Variables Used in the Model
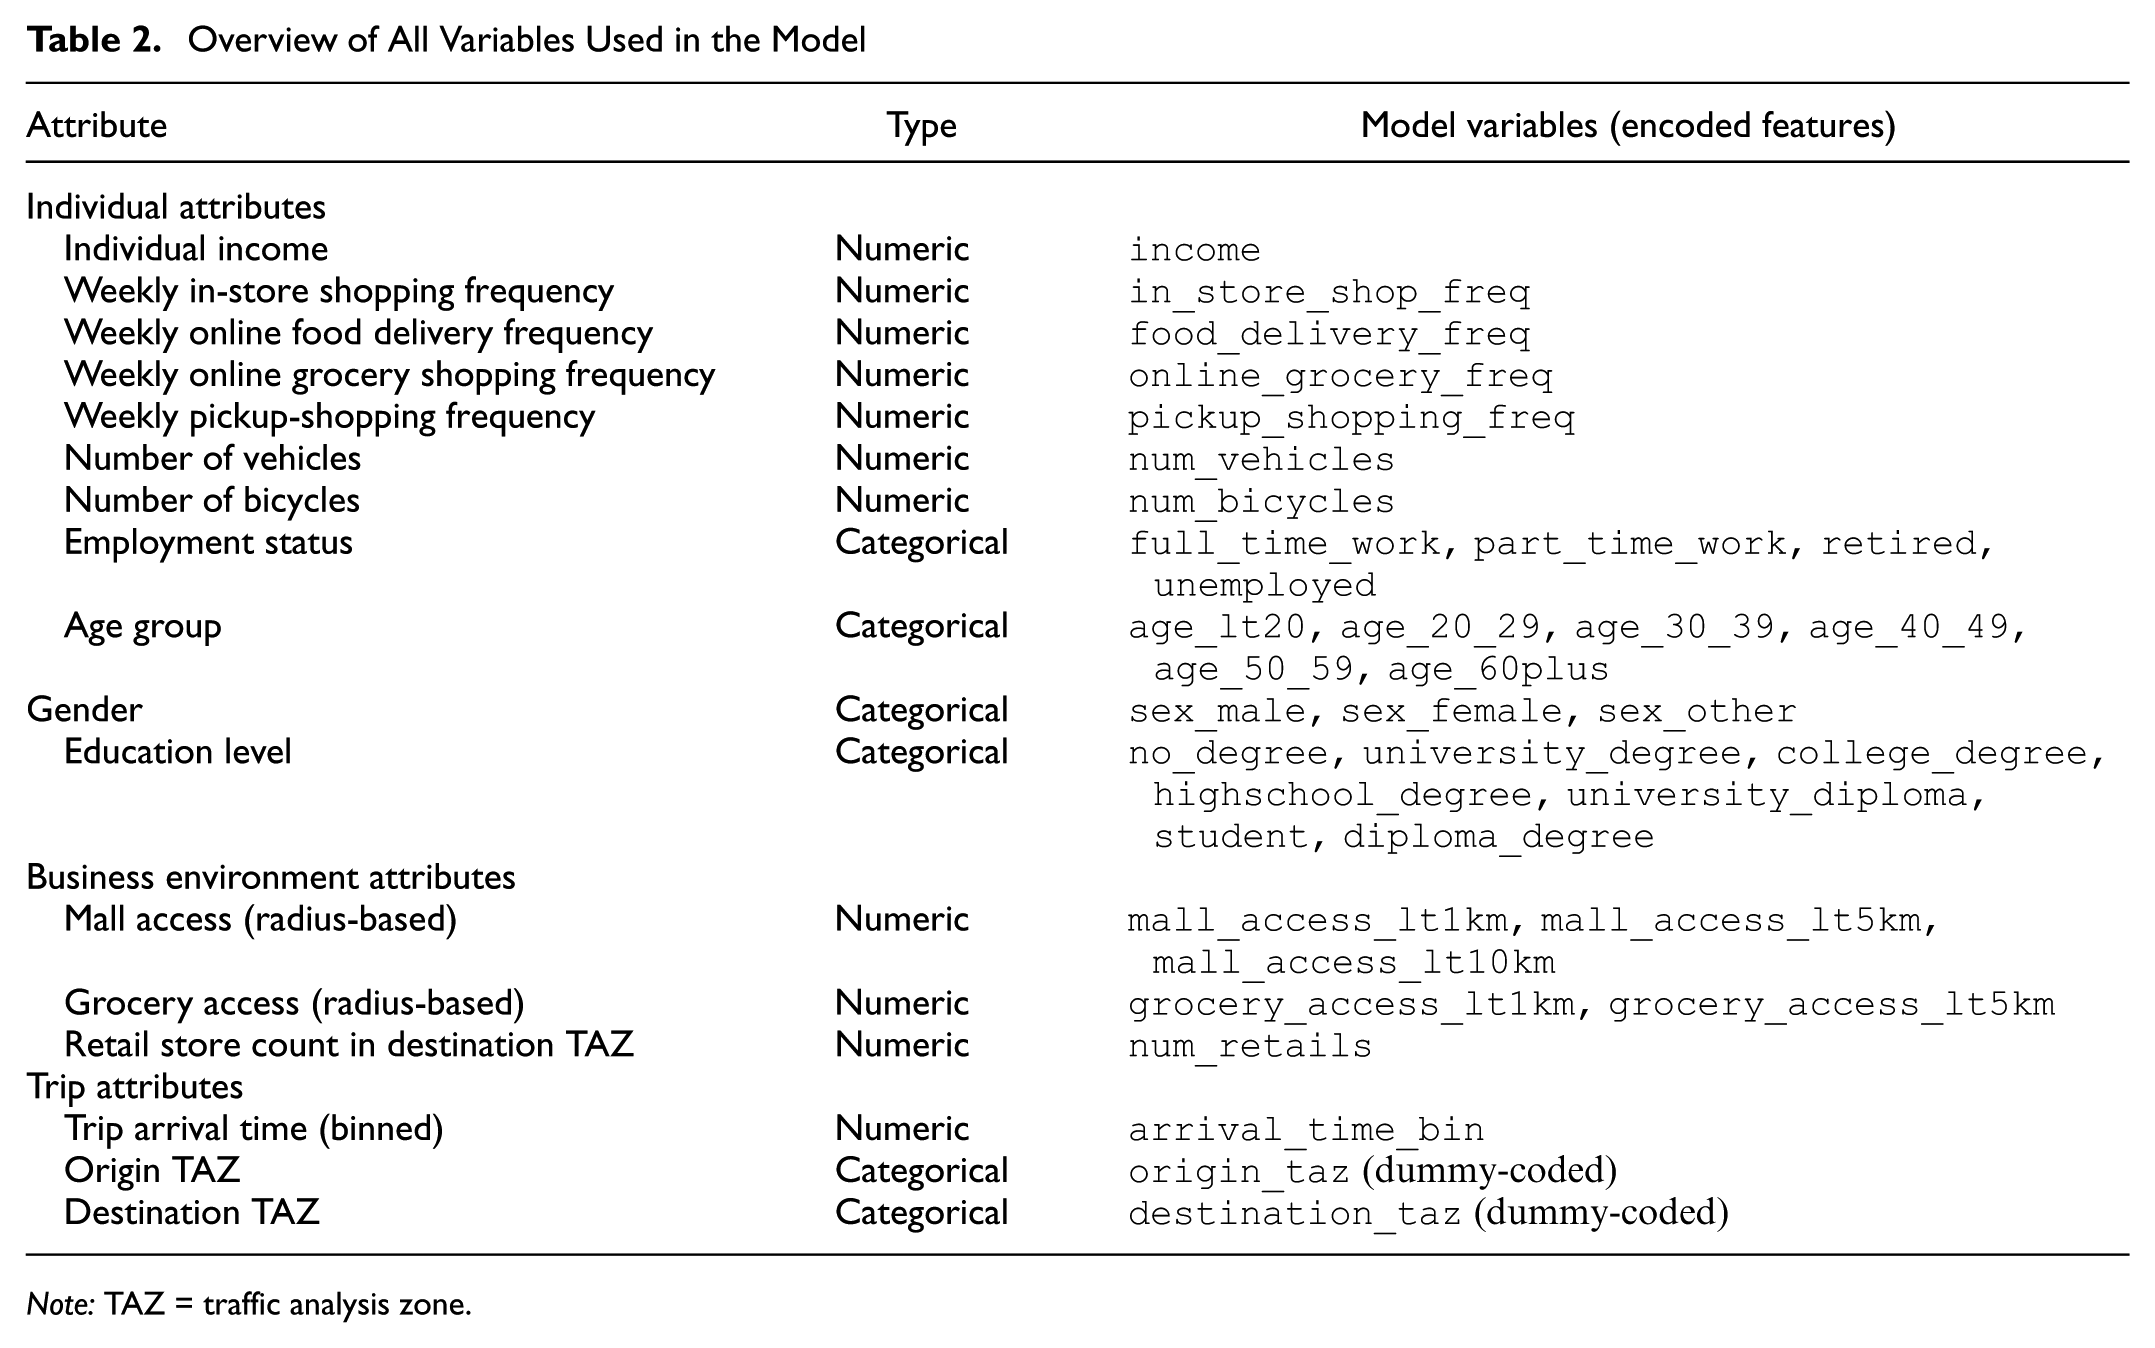
Note: TAZ = traffic analysis zone.
The HaliTRAC sample closely mirrors HRM census distributions (with deviations between 0% and 7%). Thus, additional survey weighting was not required. Nonetheless, minor residual sampling bias remains possible and is acknowledged in the revised manuscript. After preprocessing, the combined dataset was divided into training (90%) and testing (10%) subsets for model validation. In addition to the primary 90/10 train–test split, we also performed a fivefold cross-validation procedure to assess model stability, following standard ML practice (
38
). In k-fold cross-validation, the dataset is partitioned into
Prediction Model
The forecasting phase of the framework is designed to predict whether an observed trip is a shopping trip based on individual, trip-level, and business-environment attributes. Formally, the task is framed as a binary classification problem in which each trip

where
Feature Selection and Interpretability
A critical step in developing a robust forecasting model is ensuring that the input variables meaningfully capture the behavioral and contextual factors influencing shopping trips. As noted by Zohdi et al. ( 41 ), careful feature engineering and selection substantially improve predictive accuracy, generalization, and interpretability. While Table 2 provides an overview of all variables incorporated into the model, not all features contribute equally to determining shopping behavior. Accordingly, this section aims to identify the predictors that exert the greatest influence on the likelihood that a trip is classified as a shopping trip, while implementing dimensionality reduction by progressively eliminating less informative variables and continually assessing the resulting predictive performance.
To achieve this, we employed SHapley Additive Explanations (SHAP) with a light gradient-boosting machine (LightGBM) classifier serving as the underlying model. LightGBM was chosen because its gradient-boosted tree structure is natively supported by SHAP’s TreeExplainer, allowing fast and exact computation of feature contribution values. SHAP provides game-theoretic importance scores that quantify each feature’s marginal impact on the predicted likelihood of a shopping trip, offering both global and instance-level interpretability. Unlike traditional impurity-based importance metrics, which may be biased by variable scale or tree construction, SHAP yields a consistent and model-agnostic framework capable of capturing nonlinear effects and interactions among individual, trip-level, and business-environment attributes.
Figure 3 presents the SHAP summary plot ranking all features according to their average absolute contribution to model predictions. The results indicate that trip-level characteristics, particularly arrival time and destination TAZ cluster, are among the most influential predictors, suggesting that shopping behavior is closely linked to temporal patterns and spatial accessibility. Within individual attributes, income per person, retirement status, and vehicle availability exhibit strong effects, reflecting differences in mobility resources and lifestyle. In the business environment domain, the number of retail establishments in the destination TAZ and measures of mall or grocery proximity demonstrate meaningful contributions, underscoring the role of commercial accessibility in shaping retail-oriented trips.
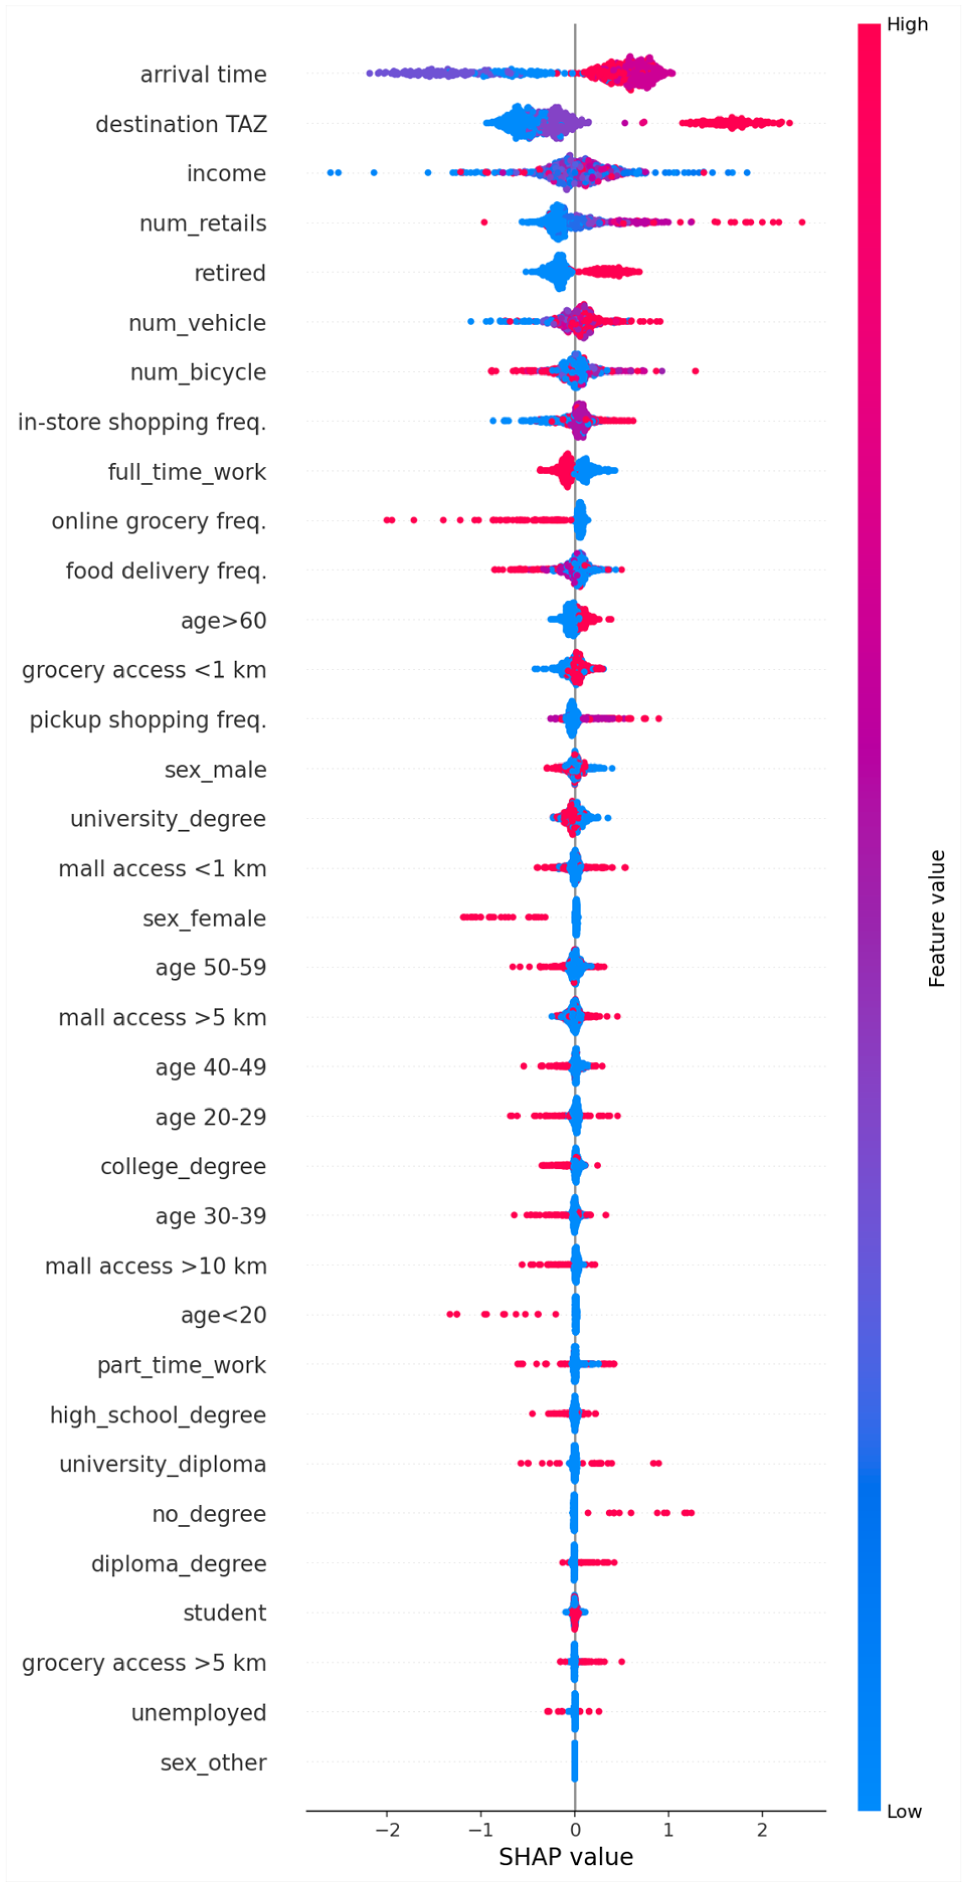
Variable (feature) importance derived from SHAP values.
The proposed framework refines feature selection through an iterative elimination procedure designed to evaluate the model’s sensitivity to each predictor. At each step, the two least influential features, based on SHAP contributions, are removed and the forecasting model is re-trained and re-evaluated to observe changes in predictive performance. This process continues until only a single feature remains, providing a transparent sensitivity analysis that reveals how model accuracy and other performance-related measures respond to progressive reductions in feature inputs. As discussed in the Results section, this iterative procedure promotes parsimony by identifying a compact yet behaviorally meaningful subset of predictors while achieving performance nearly identical to the full model. The resulting feature set is interpretable, computationally efficient, and well suited for downstream scenario testing and policy analysis.
Model Selection and Implementation
To forecast shopping trips, we implemented a set of ML algorithms that differed in complexity, interpretability, and computational efficiency. This comparative approach enabled the identification of the most suitable model for balancing predictive accuracy with practical considerations such as scalability, transparency, and data availability ( 42 ). The selected models include RF, artificial neural networks (ANN), GB machines (GBM), light GB decision trees (LightGBDT), logistic regression, and decision trees. These models span a diverse range of ML paradigms, from simple linear classifiers to complex ensemble and neural network architectures, each offering distinct capabilities to capture the behavioral intricacies of shopping-related travel.
Kashifi et al. ( 42 ) provided a comprehensive discussion on the strengths and limitations of each model. RF and GB are robust ensemble techniques that effectively model nonlinear relationships and variable interactions. LightGBDT, an optimized implementation of GB, provides improved computational performance and scalability for large datasets. ANN offers high flexibility in learning complex data patterns but lacks transparency, making interpretability a challenge. Logistic regression, though limited in modeling nonlinear behavior, serves as a strong and interpretable baseline for classification tasks. Decision trees yield intuitive rule-based outputs but may be prone to overfitting without appropriate pruning strategies. This diverse selection supports a rigorous comparative analysis, which allowed us to evaluate not only which model achieved the highest predictive performance but also which aligned best with the operational needs of urban transportation planning and retail accessibility forecasting.
Model Performance Evaluation Metrics
Model performance was assessed using a suite of standard classification metrics derived from the confusion matrix, a widely adopted tool for evaluating the predictive accuracy of binary classifiers. The confusion matrix in Table 3 provided a structured comparison between the actual and predicted classifications, distinguishing between correct and incorrect predictions for each class.
Confusion Matrix for Trip Classification
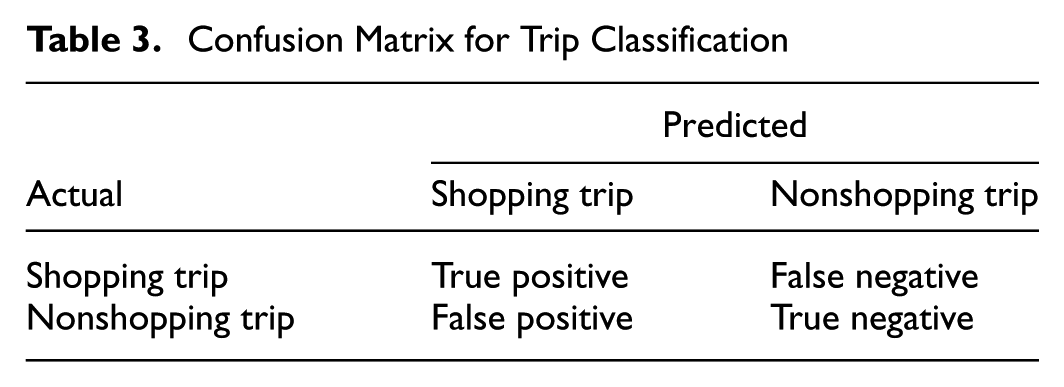
From this matrix, four widely used performance indices were computed as follows:


Each performance metric offered distinct insights. Accuracy captured the overall correctness of the model but may not be reliable under class imbalance. Precision was critical for minimizing false positives, ensuring that predicted shopping trips are indeed correct. Recall emphasized the model’s ability to detect all shopping trips, avoiding missed detections. Finally, the F1-score provided a balanced evaluation by harmonizing precision and recall. This was especially informative when both types of classification errors are consequential.
The final model selection in this paper is based on comparative performance across these metrics on the test dataset, resulting in a robust and interpretable forecasting framework for shopping travel demand.
Simulation Model
Simulation serves as a critical extension of the forecasting model, enabling the application of behaviorally informed, survey-based ML predictions at the urban scale. While the forecasting model predicts the probability that an observed trip is a shopping trip, the simulation extends these microlevel predictions to the full HRM population by generating a synthetic population and a complete set of daily trips, and then applying the trained ML classifier to each simulated trip. This enables citywide estimation of total shopping demand and its spatial distribution, capabilities that cannot be achieved by the prediction model alone, which is limited to observed survey records. Moreover, the simulation framework operationalizes one of the key contributions of this study by enabling flexible scenario testing: demographic shifts, land-use changes, or modifications to retail supply (e.g., new shopping centers, store closures) can be evaluated to understand their potential impact on shopping travel patterns. In this way, the simulation model transforms individual-level behavioral predictions into a scalable forecasting tool that supports regional planning, policy evaluation, and evidence-based decision-making.
Individual attributes were assigned to the simulated population through a synthesis process that maintained consistency with zone-level population densities and sociodemographic characteristics, using data from municipal censuses and transportation planning sources. In parallel, a set of purpose-agnostic trips was generated for each individual based on empirically derived trip generation rates and spatial mobility patterns across the city. These trips served as inputs to the prediction model, which identified shopping-related trips from the full set of generated travel activity.
To enrich the spatial context, business-side variables were integrated using the InfoCanada Businesses dataset, which provides geospatial data on grocery stores, shopping malls, and other retail establishments. These attributes were assigned to relevant TAZs, capturing the distribution and density of retail opportunities across the region. Incorporating these variables enables the model to account for the influence of spatial accessibility on shopping behavior, a factor often underrepresented in traditional travel demand models.
Once both the synthetic population and the contextual features were defined, the best-performing machine learning models (MLM), previously identified through evaluation metrics, was applied to classify trips as shopping or nonshopping. The classification process mirrored the original feature structure used during training to ensure behavioral consistency. The output is a disaggregate set of simulated shopping trips, spatially distributed across TAZs and reflective of both individual preferences and regional accessibility.
Overall, the proposed simulation framework bridges the gap between microlevel behavioral modeling and macrolevel policy analysis. It allows for detailed scenario testing involving demographic shifts, policy interventions, or infrastructure changes, and supports practical applications in mobility forecasting, commercial development planning, and urban form optimization.
Clustering
To further interpret the spatial distribution of shopping travel demand, a clustering analysis was performed on the simulated model outputs. This step supports spatial generalization by identifying zones with similar retail activity characteristics, allowing planners to target interventions and policy tools more effectively.
For each destination TAZ, two key indicators are computed: the total number of predicted shopping trips and the proportion of all trips classified as shopping-related. These metrics jointly capture the volume and intensity of shopping demand within each zone. To enable comparison across zones, a composite index is constructed by normalizing both metrics and allowing for adjustable weighting between absolute and relative demand.
The k-means clustering algorithm was employed to segment TAZs based on this composite index. k-means is an unsupervised learning technique that partitions data into k distinct clusters by minimizing the within-cluster sum of squared distances. The optimal number of clusters was determined by evaluating clustering performance across alternative values of k and selecting the solution that provided the best balance between minimizing within-cluster variation and maintaining interpretability of the resulting spatial groups. Specifically, it uses the squared Euclidean distance between each zone and its assigned cluster centroid ( 43 , 44 ). k-means was selected in this study because its centroid-based structure effectively captures magnitude-driven differences, such as high-demand retail hubs versus low-activity zones, making it well suited for grouping zones by similar shopping-trip intensity rather than enforcing spatial contiguity or modeling autocorrelation. Each zone is assigned to the cluster with the nearest centroid, and the centroids are iteratively updated until the algorithm converges. The optimal number of clusters was selected using the elbow method, which identifies the point where adding more clusters produces only marginal improvements in cluster cohesion ( 45 ). In this context, cohesion refers to how closely the zones within a cluster resemble each other, measured by how compactly they are grouped around the centroid.
Based on this analysis, a four-cluster solution was adopted. Clusters were labeled as low, moderate, high, and very high based on the average level of shopping activity within each group. This classification offered a spatial hierarchy of shopping demand, supporting zone-level policy formulation, infrastructure prioritization, and commercial development planning. By linking microlevel behavioral forecasts with aggregate spatial patterns, the clustering analysis strengthened the model’s applicability to real-world urban planning decisions.
Numerical Results
Model Performance Evaluation and Validation
To assess the effectiveness of the proposed forecasting framework, we evaluate the predictive performance of multiple MLMs using standard classification-based validation techniques. To ensure a fair comparison across models, all algorithms were tuned using a standard cross-validated hyperparameter search (grid/random search depending on the model). A fivefold cross-validation (CV) procedure was applied during tuning, and early stopping was enabled for boosted-tree models. This approach provided robust parameter estimates without requiring full nested CV, and model performance was found to be stable across folds.
Table 4 presents the evaluation results for each model using the complete feature set introduced in Figure 3. This initial analysis served as a baseline comparison, allowing us to benchmark the relative strengths of each model before implementing feature engineering and dimensionality reduction. The impact of these enhancements on model performance is explored in detail in subsequent sections.
Performance Comparison of MLMs for Shopping Trip Prediction Considering All Features
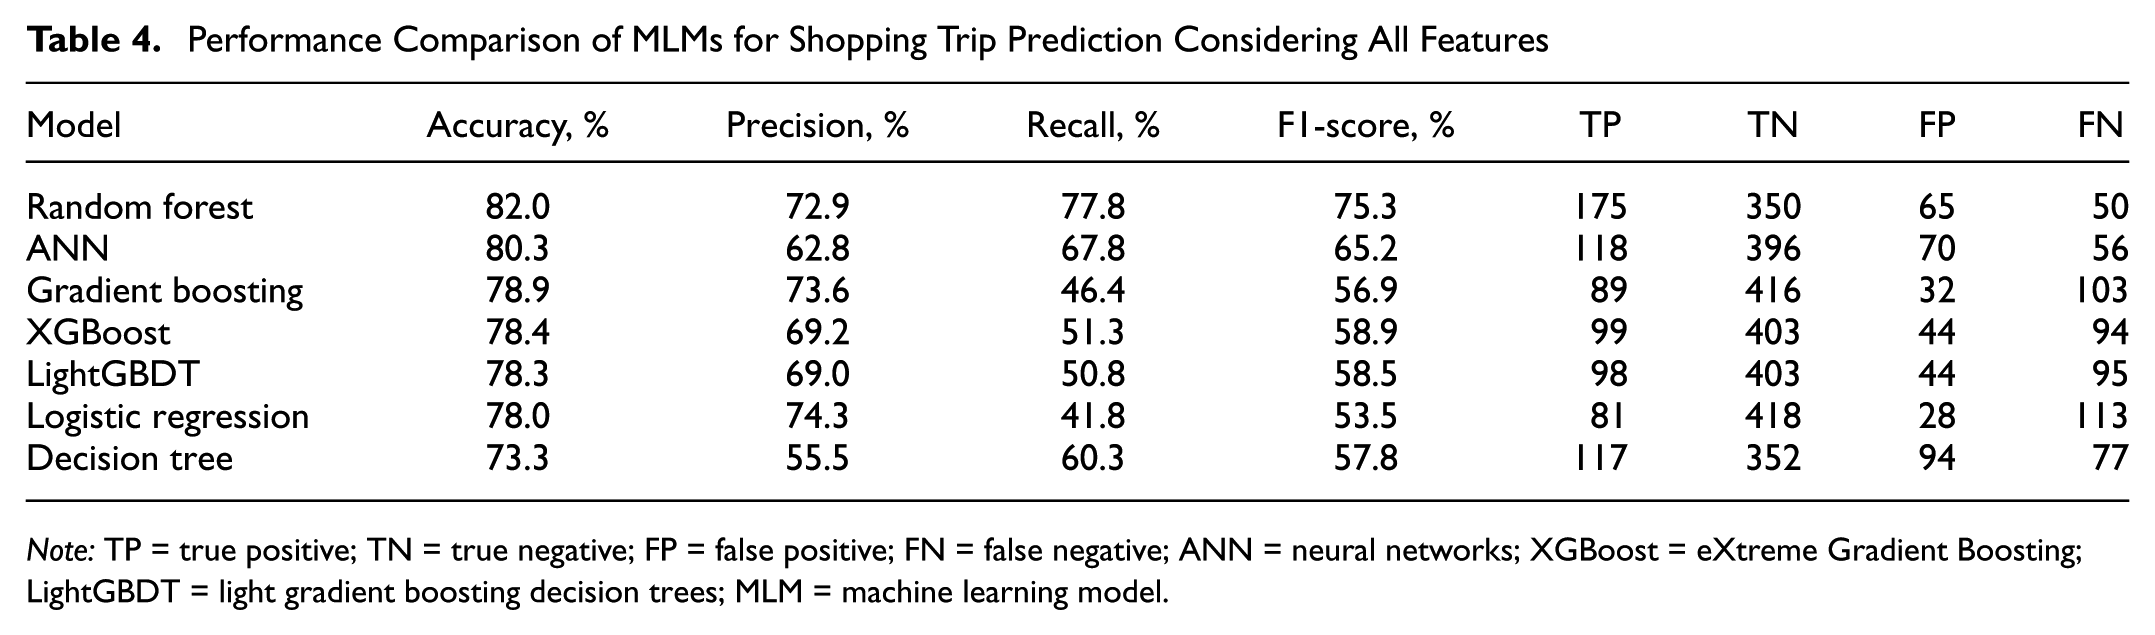
Note: TP = true positive; TN = true negative; FP = false positive; FN = false negative; ANN = neural networks; XGBoost = eXtreme Gradient Boosting; LightGBDT = light gradient boosting decision trees; MLM = machine learning model.
The reported metrics are based on predictions generated from the test dataset. Among all evaluated models, the RF classifier demonstrated the most robust and consistent performance. It achieved the highest overall accuracy (82.0%), along with a balanced precision (72.9%) and recall (77.8%), resulting in the highest F1-score (75.3%). These results indicate that RF was particularly effective in detecting shopping trips while minimizing misclassification errors. As our results show, the stronger performance of RF may be attributed to its ability to capture complex and nonlinear relationships among the heterogeneous predictors used in this study, including sociodemographic characteristics, trip attributes, and commercial-environment variables. Compared with the other evaluated models, RF provided a better balance between correctly identifying shopping trips and limiting misclassification, suggesting that it was better able to represent the interdependent structure of shopping-related travel behavior. Accordingly, this model was selected for deployment in the simulation and spatial clustering phases of the proposed framework, because its strong predictive capabilities and practical reliability.
While other models, such as ANN and gradient boosting, achieved reasonably high accuracy scores, they lacked consistency across all metrics. For example, although the ANN model performed well in relation to overall accuracy, its lower recall and precision resulted in a notably reduced F1-score. Similarly, gradient boosting yielded relatively high precision but suffered from very low recall, suggesting difficulty in detecting true shopping trips.
These results collectively highlight the superior predictive capability of the RF model, especially for practical applications where both sensitivity (recall) and reliability (precision) are critical for capturing shopping behavior in travel data.
Feature Selection Analysis
To identify the optimal feature set that balance predictive accuracy with model simplicity, we conducted an iterative feature elimination analysis. We started with the complete set of features, total of 35 features, as highlighted in SHAP Figure 3. In each iteration, the two least important features were removed, and the RF model was retrained. Feature importance rankings were recalculated after each iteration to guide the next step in the elimination process.
Figure 4 presents the model’s performance trajectory across four key classification metrics as a function of the remaining feature subset size. As illustrated, model performance improved notably after removing redundant or less informative features. The optimal configuration was achieved with 25 features remaining, following the elimination of the least important features in earlier iterations. These excluded features are: sex_other, age_less_than_20, student, unemployed, no_degree, part_time_work, grocery access within 5 km, age_20–29, diploma_degree, and univ_diploma. At this point, the RF model attained its peak predictive performance, with an accuracy of approximately 85%, and simultaneously achieved the highest values for precision, recall, and F1-score. This outcome indicates that the model is both effective and parsimonious, capturing relevant behavioral complexity while minimizing unnecessary inputs.
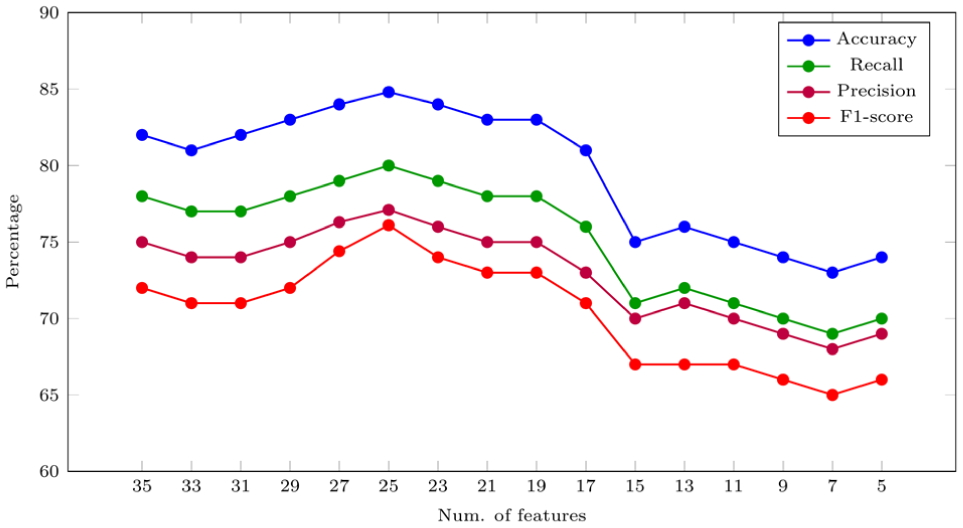
Performance metrics of RF model under different feature set sizes.
When the feature count dropped below 15, however, all performance metrics begin to deteriorate sharply. This decline can be attributed to underfitting, where the model becomes too simplistic to capture the nuanced patterns of shopping travel behavior. The exclusion of essential predictive features reduces the model’s ability to generalize across diverse demographic and spatial contexts, leading to a significant loss of both accuracy and interpretability. This pattern reinforces the importance of preserving a sufficient level of input richness to ensure robust model performance.
Figure 5 presents the confusion matrices for the RF classifier using both the full feature set and the optimized 25-feature subset derived through feature selection. The comparison illustrates the predictive gains achieved through dimensionality reduction and highlights how the refined model improves classification performance and reduced misclassification rates.
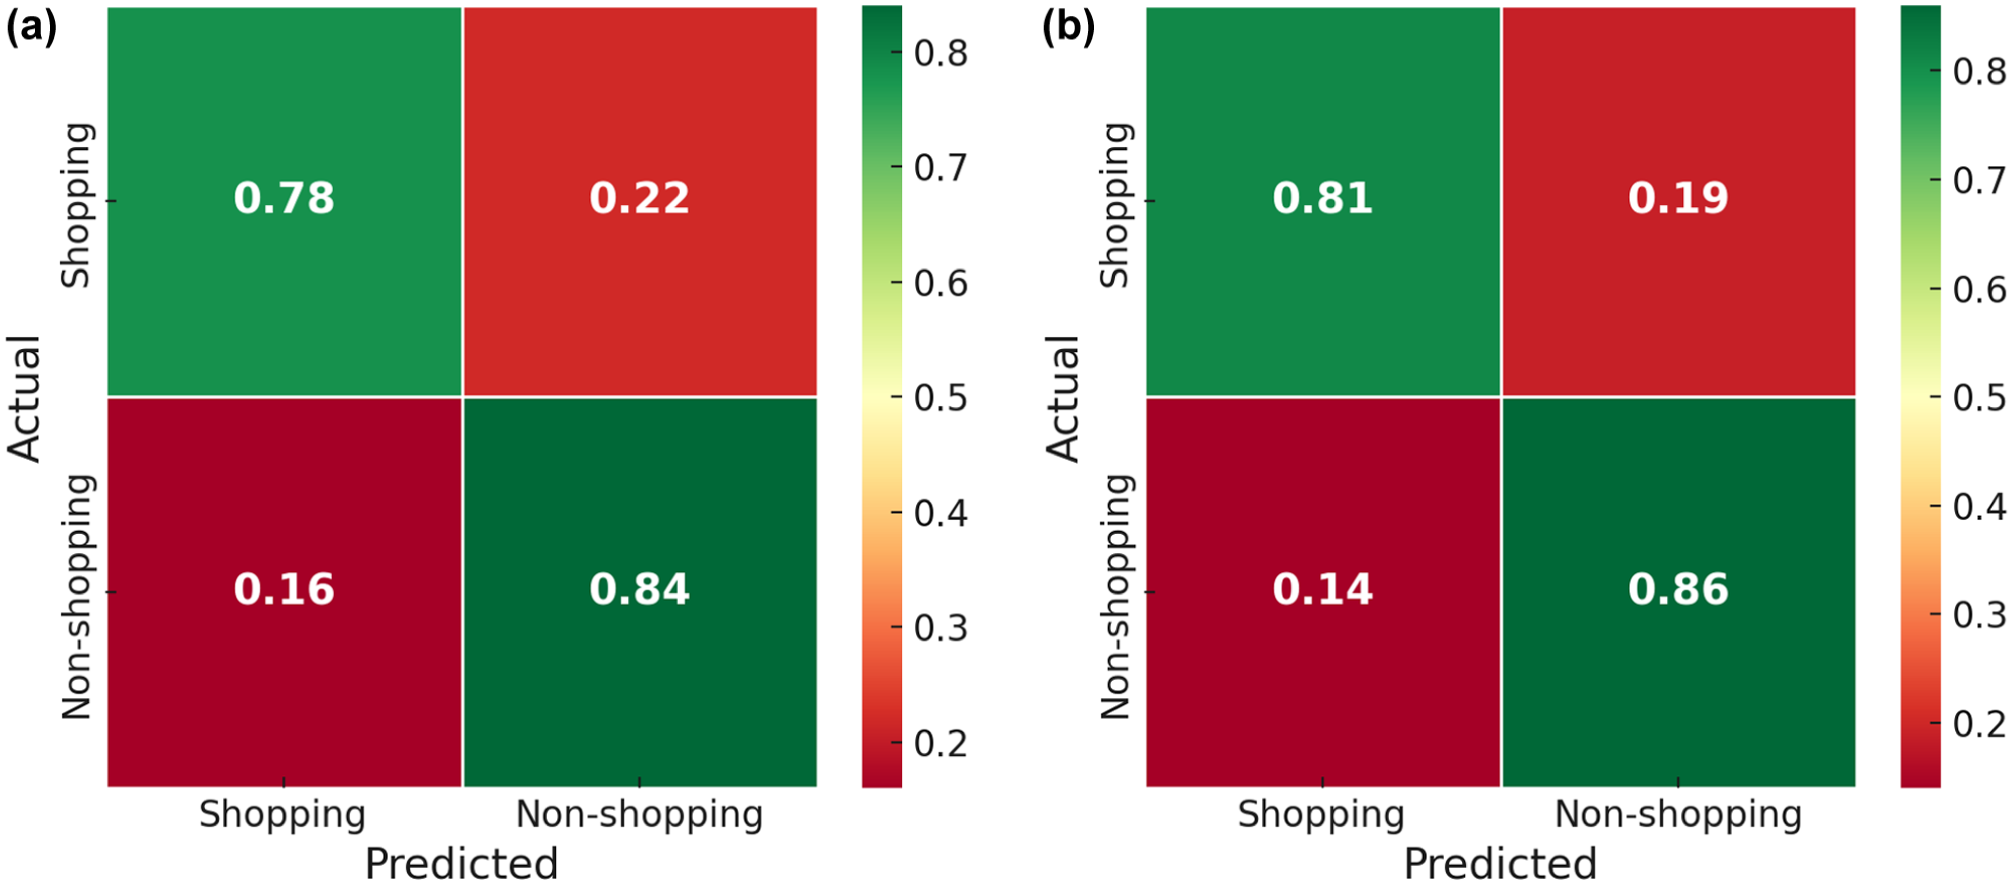
Comparison of confusion matrices: before and after feature selection. (a) Confusion matrix of RF with complete set of features (35 features). (b) Confusion matrix of RF with optimal set of features (25 features).
Simulation Results and Clustering Analysis
The proposed framework was applied to the HRM using a synthetic population consistent with 2025 projections from the integrated transportation, land use, and energy model, which estimates a regional population of approximately 505,000 ( 46 ). A weekday travel participation rate of 65% is adopted, indicating that roughly 328,250 individuals are expected to make at least one trip per weekday. This assumption aligns with participation rates observed in other Canadian urban areas—for instance, the 2024 Okanagan Travel Survey – Report 3 reports a comparable rate of 63.9% ( 47 ). The model allows for this parameter to be easily updated based on local survey data, alternative participation scenarios, or for the purposes of sensitivity analysis.
To incorporate temporal dynamics into the simulation, each synthetic trip was assigned a time-of-day category using empirically derived sampling weights from the HaliTRAC survey. The observed arrival-time distribution was aggregated into four standard planning intervals (offpeak, AM peak, midday, pm peak), and the corresponding probabilities were used to stochastically assign a time-of-day to each simulated trip. This probabilistic sampling approach is widely used in activity- and trip-based models and ensures that the temporal structure of simulated travel demand faithfully reflects observed behavior while enabling the ML classifier to capture time-of-day effects in shopping trip prediction.
Using trip frequency distributions from the HaliTRAC survey and regional census data, the simulation generated a total of 1,137,916 trips on a typical weekday. Of these, 162,772 were identified as shopping trips, representing approximately 14.3% of all daily trips. These results align with empirical observations from HaliTRAC and other regional studies, reinforcing the model’s ability to replicate observed patterns of shopping-related travel behavior. To assess the plausibility of the simulation outputs, the resulting shopping–trip share (14.3%) was compared with independent benchmarks from large Canadian household travel surveys, including the 2024 Okanagan Travel Survey ( 48 ) and the Transportation Tomorrow Survey ( 49 ), both of which report discretionary/shopping trip proportions in the 12%–15% range. This external comparison indicates that the simulated outcomes fall within empirically observed bounds. Although this benchmark comparison supports the overall plausibility of the simulation outputs, it should be interpreted as an external consistency check rather than a direct validation against ground-truth, purpose-specific trip counts for HRM. We also acknowledge that HRM does not currently provide population-wide purpose-specific trip counts that would allow for formal calibration or direct validation of simulated shopping-trip volumes at a disaggregate spatial level. These data sources represent important avenues for future enhancement of the simulation framework.
Spatial Distribution of Shopping Trips
To analyze the spatial distribution of shopping-related travel demand, simulation outputs were aggregated by destination TAZ and classified using a clustering algorithm based on the number of incoming shopping trips. A four-cluster solution comprising Cluster 1 (Low), Cluster 2 (Moderate), Cluster 3 (High), and Cluster 4 (Very High) was found to most effectively capture the variability in retail activity across the region.
Figure 6 presents a summary of shopping trip volumes across the four identified clusters, along with the distribution of destination zones within each group. Cluster 1 consisted of 351 zones with low shopping activity, where the number of shopping trips ranged between 5 and 325, and the average was 86 trips per zone. Cluster 2 included 116 zones with moderate retail demand, while Cluster 3 comprised 32 zones characterized by high shopping trip volumes. The most concentrated retail activity was observed in Cluster 4, which contained only 9 zones yet records an average of 2,889 shopping trips per zone. Additional descriptive statistics, such as the quartiles and range, were illustrated in the boxplot, highlighting the spatial variation in shopping activity within each cluster. Our analysis reveals that only a small number of destination zones, primarily those containing major retail centers such as malls, outlets, and shopping plazas, are classified into Clusters 3 and 4. This indicates that a limited number of commercial zones account for a disproportionately large share of shopping trips across the region. Overall, the clustering results highlight significant spatial disparities in shopping trip intensity and provide actionable insights for planners seeking to guide retail infrastructure investment and transportation planning.
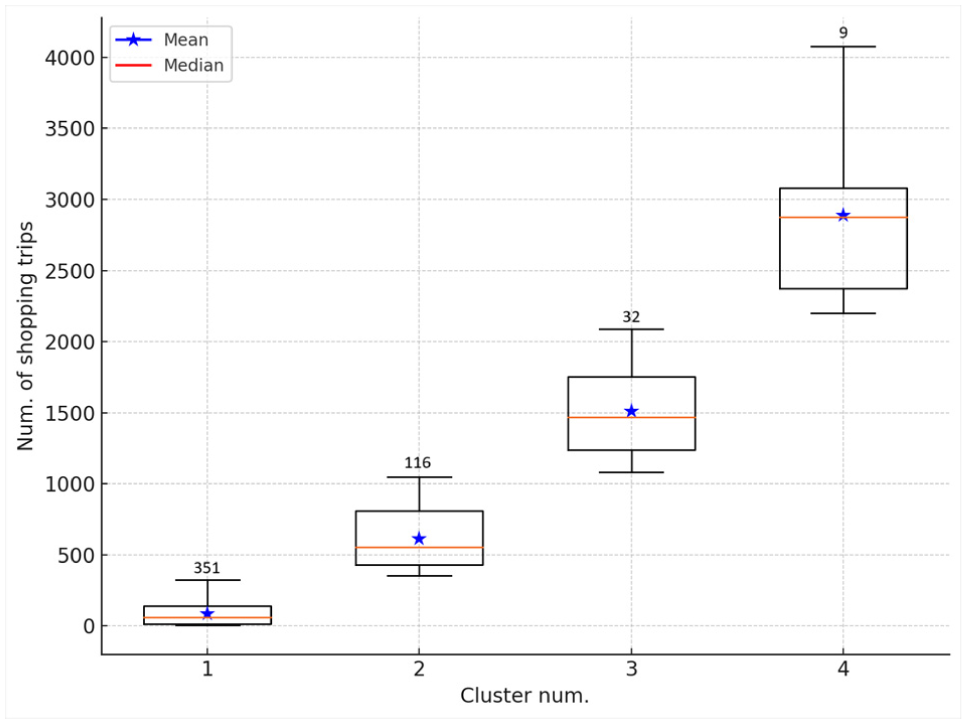
Distribution of shopping trips across clusters.
To enhance the visualization of shopping behavior across HRM, Figure 7 presents the spatial distribution of the identified shopping clusters. Each polygon represents a distinct group of zones with similar shopping trip characteristics, as determined by the proposed framework. The clusters reveal clear spatial patterns, distinguishing areas of high activity, such as Dartmouth Crossing and Chain Lake Drive areas, from zones with moderate or lower demand, including suburban and peripheral communities. These distinctions provide actionable insights for transportation planning, retail development, and land use policy.
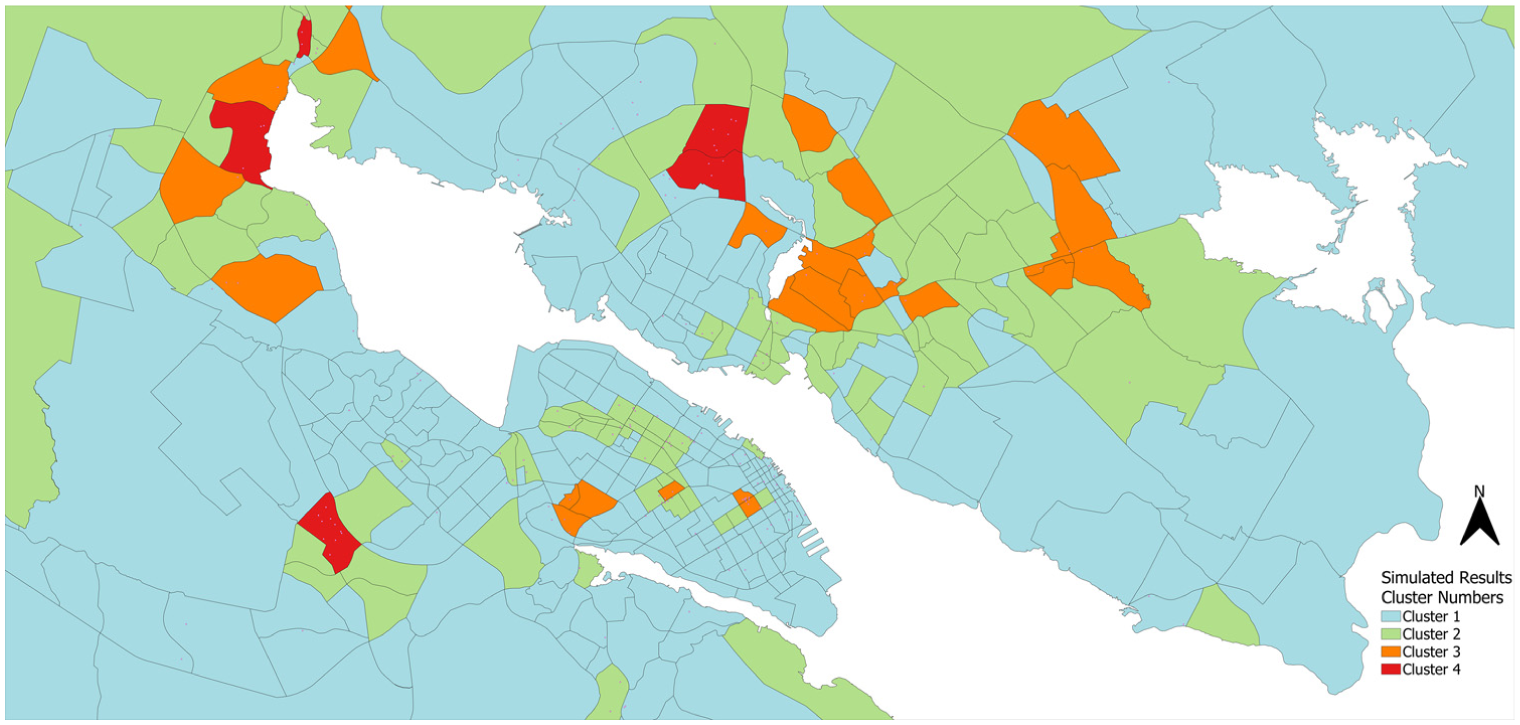
Spatial distribution of shopping behavior clusters across the study area.
Temporal Distributions of Shopping Trips
Understanding the temporal distribution of shopping trips is critical for capturing daily shopping behavior and supporting infrastructure and transportation planning. Figure 8 illustrates the distribution of shopping trips across four defined time intervals: offpeak, am peak, midday and pm peak.
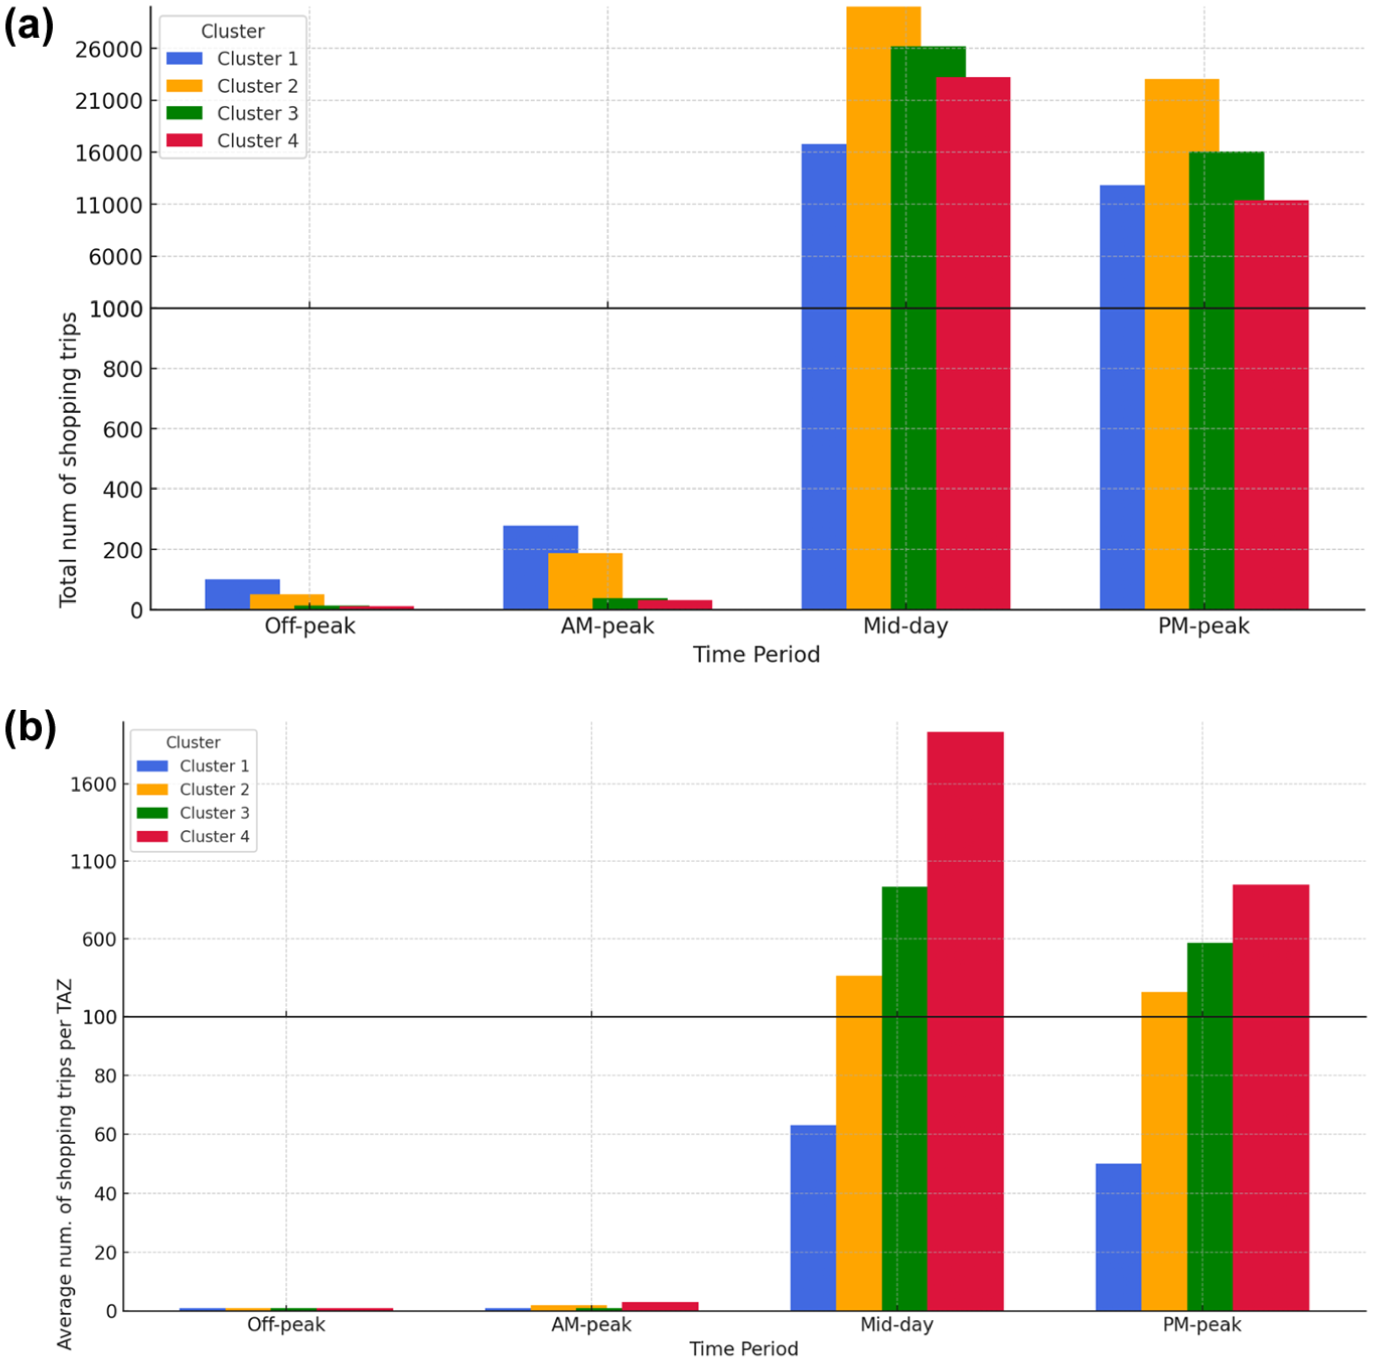
Comparison of average and total shopping trips by time interval and cluster: (a) total shopping trips distribution across time intervals, and (b) average shopping trips per TAZ across time intervals.
Figure 8a presents the total number of shopping trips by cluster, while Figure 8b depicts the average number of shopping trips per destination TAZ. The results in Figure 8a reveal that shopping activity was highly concentrated during the midday and pm-peak periods. In contrast, am-peak and offpeak hours account for only a small share of total trips, indicating that shopping behavior generally aligned with business hours and discretionary leisure time.
Although total trip volumes across clusters appear relatively similar in Figure 8a, this is largely attributable to the substantial number of zones in Cluster 1 (351 TAZs) and Cluster 2 (116 TAZs), which collectively contributed to numerous trips despite their lower per-zone intensity. Figure 8b, which presents the average of shopping trips per zones, indicates significant variation in spatial shopping intensity across clusters. Notably, Cluster 4, consisting of only nine TAZs, recorded the highest per-zone demand, exceeding 1,600 trips per TAZ during the midday period and remaining elevated in the pm-peak period. Cluster 3 exhibits a similar, though less pronounced, trend, further emphasizing the concentration of shopping activity in a small number of high-demand retail zones.
This analysis underscores the importance of incorporating temporal dimensions into travel demand modeling. It also highlights the need for targeted planning interventions, such as scheduling transit service, optimizing retail center accessibility, and managing traffic flows to accommodate peak midday and evening shopping activity in spatially concentrated commercial areas.
Discussion
This study contributes to a growing body of research on shopping-related travel behavior by combining ML, commercial-environment attributes, and simulation in a purpose-specific modeling framework. Our findings align with prior studies that emphasize the role of sociodemographics, accessibility, and retail density in shaping shopping trips ( 20 , 25 , 30 ). Consistent with recent ML-based approaches, variables such as income, vehicle availability, and destination retail intensity emerged as strong predictors. However, our results extend beyond earlier regression-based studies that rely heavily on GFA or basic land-use categories ( 19 , 27 ) by demonstrating the significant influence of temporal factors and detailed business-accessibility metrics. These richer behavioral patterns, particularly the importance of arrival-time bins and spatial clustering of destinations, are rarely captured in prior shopping-trip models.
Compared with existing ML approaches that focus either on online–offline shopping preferences ( 13 ) or narrow retail contexts, the present framework contributes three key advances. First, it integrates trip-level, individual-level, and business-environment predictors in a unified classification model, explicitly tailored to in-person shopping trips. Second, it extends microlevel predictions to the full urban population through a synthetic simulation framework, enabling citywide demand estimation and scenario testing—capabilities not supported by most prior work. Third, the spatial clustering of TAZs produces behaviorally interpretable, policy-ready outputs that translate model predictions into actionable planning insights. Together, these contributions address many of the gaps identified in the literature concerning purpose-specific modeling, commercial-environment integration, and spatial interpretability.
Policy Implications
The combined forecasting–simulation framework supports a range of practical applications for transportation planning and land-use management. Some main policies are listed as follows:
Land Use and Zoning Strategies. As demonstrated in the spatial clustering results (Figures 6 and 7), identifying high-demand shopping zones enables policymakers to align retail zoning, encourage mixed-use development, and manage commercial density to balance accessibility with traffic impacts.
Transportation Infrastructure Planning. By revealing when and where shopping activity concentrates across the region (Figures 7 and 8), the model allows planners to assess whether existing public transit or active transportation infrastructure sufficiently serves major retail clusters. These demand-based insights help justify targeted improvements to multimodal access where current or projected shopping patterns indicate unmet need.
Equity and Accessibility Analysis. Comparing predicted shopping demand with the spatial distribution of retail opportunities helps identify neighborhoods with limited access to essential services. Such insights support equity-focused planning interventions aimed at reducing travel burdens and guiding the placement of future commercial or mobility infrastructure.
Freight and Logistics Coordination. Understanding spatial shifts in consumer shopping behavior enhances retail freight demand forecasting, supporting more efficient warehouse siting, delivery routing, and last-mile logistics management.
Scenario Testing for Policy Evaluation. The simulation framework enables the evaluation of demographic changes, new retail developments, or policy interventions such as congestion pricing. For example, the relocation of a major retailer such as Costco in HRM can be analyzed in relation to changes in trip generation, cluster assignments, and accessibility outcomes under alternative scenarios.
Limitations and Future Research
While the framework offers a detailed and scalable approach to shopping travel estimation, there are opportunities for future work to focus specifically on leisure trips and service-based activities. Integrating multiple activity types would enable a more holistic representation of nonwork travel behavior. Another direction for future development is to utilize complementary data sources such as mobile device traces, traffic counts, or loyalty card/retail transaction data to further refine population and trip generation estimates. In addition, while the present model predicts the likelihood and spatial distribution of shopping trips, future research could incorporate elasticity estimation or causal modeling techniques to evaluate how changes in accessibility, land use, or pricing directly influence shopping trip volumes. Finally, the reproducibility of the framework may depend on the availability of comparable household travel surveys, business establishment data, and local zoning structures in other study areas. Future work should therefore examine the transferability of the framework across cities with different data environments and urban forms.
Conclusions
This paper introduced an integrated forecasting and simulation framework for modeling shopping-related travel behavior, addressing key gaps in both traditional trip-based approaches and recent ML-driven models. By combining individual, trip-level, and commercial-environment attributes with a purpose-specific ML classifier and a synthetic population simulation, the framework provides a behaviorally grounded, spatially explicit, and scalable system for estimating shopping travel demand.
A comparative evaluation of multiple ML algorithms showed that the RF classifier delivered the strongest predictive performance, achieving high accuracy and robust generalization under the tuned hyperparameters and cross-validation procedures. The simulation model produced 1,137,916 weekday trips for the HRM, of which 162,772 (14.3%) were identified as shopping trips—a share consistent with independent Canadian household travel surveys reporting discretionary shopping demand in the 12%–15% range.
Further, this study conducted spatial and temporal analyses, highlighting the key feature of this methodology. A small number of major retail centers, such as Dartmouth Crossing, Bayers Lake, and Mic Mac Mall, dominated regional shopping activity, while most suburban TAZs exhibited low to moderate demand. The results further emphasize that the shopping activity concentrated primarily during midday and pm-peak periods, underscoring its discretionary nature and alignment with retail operating hours. These insights support practical applications including targeted transit service planning, land-use coordination, retail location strategy, and freight–passenger network management.
Although developed for HRM, the framework is readily transferable to other midsized metropolitan regions by updating the commercial descriptors, local trip parameters, and population size, enabling replication under different demographic or land-use contexts. This design supports applications such as suburban retail restructuring, big-box store relocations, transit-oriented development, and multimodal accessibility planning. By enabling scenario testing—including demographic shifts, retail relocations, and accessibility improvements—the framework provides planners with a practical tool for evaluating future conditions and offers a scalable foundation for integrating commercial travel demand into broader urban planning and supply chain decisions. Looking ahead, future research will expand the framework to incorporate a wider range of end-user activities at the retail stage of the supply chain. Integrating multiple activity types will allow more comprehensive simulation of how consumer behavior drives travel demand, congestion, and infrastructure needs, strengthening scenario analysis and supporting more cohesive strategies for land use, multimodal planning, and emissions management.
Footnotes
Authors’ Note
The authors used ChatGPT-4o to assist with language editing and grammar refinement in selected sections of the manuscript. All content was subsequently reviewed and validated by the authors through multiple rounds of revision before final submission.
Author Contributions
The authors confirm contribution to the paper as follows: study conception and design: P. Bagheri, H. Afshari, M. A. Habib; data collection: P. Bagheri, M. A. Habib; analysis and interpretation of results: P. Bagheri, H. Afshari, M. A. Habib; draft manuscript preparation: P. Bagheri, H. Afshari, M. A. Habib. All authors reviewed the results and approved the final version of the manuscript.
Declaration of Conflicting Interests
The authors declared no potential conflicts of interest with respect to the research, authorship, and/or publication of this article.
Funding
The authors disclosed receipt of the following financial support for the research, authorship, and/or publication of this article: This work was supported by the Climate Action Awareness Fund, the Natural Sciences and Engineering Research Council of Canada through an Alliance Grant and a Discovery Grant, and the Halifax Regional Municipality.
Data Accessibility Statement
The datasets analyzed in this study are not publicly available because they contain personal information from respondents and are subject to privacy and confidentiality restrictions.