
Abstract
A primary justification for transit is that it can draw people out of cars, yet previous research on new transit routes suggests that few users formerly drove for that trip. However, despite public transit’s potential to help seniors maintain their mobility, older adults ride transit less than working-age travelers. We explore these two core issues—mode-switching and transit use among the elderly—in a case study of Route 49, a new local bus route in Philadelphia. The route connects two low-income neighborhoods with a jobs-rich area and is the first new local bus route to have been added to Philadelphia’s network in over a decade. We conducted over 350 on-board intercept surveys of riders in the 6 months following Route 49’s start of service in early 2019. We found that compared with working-age riders, adults aged 65 plus were more likely to have taken their surveyed trip before Route 49 and less likely to be new Southeastern Pennsylvania Transportation Authority users. This suggests that older adults have travel needs that remain more stable over time. Older adults also took more complex trips and were less likely to use Route 49 to commute. Given the limited incidence of mode-switching and the distinct travel behaviors of older adults in our data, we strongly recommend that agencies consider the needs of older adults and current riders, rather than overly emphasizing trip generation from new users.
Keywords
When justifying funding for public transit, many policy makers argue that transit can draw people out of their private cars ( 1 ). Greater public transit use, per this logic, helps to reduce the negative externalities of auto travel like greenhouse gas emissions and congestion ( 1 ). To increase transit ridership, many agencies have expanded the reach of their services to improve their availability and attractiveness ( 2 ). Despite the theoretical benefits of expanding service, however, not all riders of new transit services have switched from driving cars ( 3 ). A new transit route may primarily serve travelers switching from less convenient transit lines or non-automobile-based modes (such as walking or bicycling) ( 4 ). They may also make new trips ( 4 ). If planners design new services with only current auto travelers in mind, they may make decisions that poorly serve their most likely users.
Another policy imperative for public transit is to support the mobility needs of older adults, who often face unique travel constraints. Researchers have found that older Americans take fewer total trips than younger ones ( 5 ). This partly reflects the emergence of health conditions ( 6 ), lower rates of automobile ownership ( 7 ), and driving cessation ( 6 ) among older adults. Concerningly, researchers find that globally, about a third of older adults have unmet travel needs ( 8 ). The issue of older adult travel has recently grown more urgent in the United States given its aging population of Baby Boomers (the generation born from 1945 to 1964) ( 9 ). Public transit may offer a solution to the transportation challenges facing older adults. However, if new transit services fail to meet their needs, older adults may continue to struggle with limited mobility.
Here, we explore the connections between these two issues: 1) mode-switching to public transit and 2) the travel behavior of older adults. To address these topics, we examined riders’ experiences on a new bus route in Philadelphia. In 2019, the Southeastern Pennsylvania Transportation Authority (SEPTA) began running Route 49, its first new local bus service in over a decade. Planners designed the route to connect two low-income peripheral neighborhoods to the job-rich central area of University City ( 10 ). In this unique transit context, we explored several questions. First, how did the start of Route 49 shift traveler behaviors? Second, did certain demographics of travelers—particularly older adults—shift their behaviors in unique ways? Third, did older adults use Route 49 for different trip purposes than working-age adults? To answer these questions, we conducted on-board intercept surveys with over 350 riders about 6 months after Route 49 began service.
We found that most Route 49 riders were not new to SEPTA, nor were they previous automobile drivers or passengers for that trip. Instead, most riders switched from other SEPTA bus and rail lines. Via statistical analyses of survey responses, we found that older Route 49 riders behaved differently from working-age riders both before and after the line began service. They were more likely to make the same trip before Route 49 began service, more likely to take multiple bus routes on the current (surveyed) trip, and to use the line for noncommute trips. Based on these findings, we have two suggestions for transportation planners: that they 1) work to better assess the unique needs of older adult transit riders; and 2) frame service planning not as a tool to shift people from other modes, such as automobiles, but as expanding and enhancing access for current transit riders. We advocate for a wider view of the benefits of new transit services—thus accounting for both gains to existing users and the travelers who need new services the most.
Background
Below, we review literature that explores why people choose to ride public transit and switch to it from another travel mode. We also describe research on the travel needs of older adults and how this might influence their use of a new transit line. We conclude by presenting gaps in the literature. Note that we mostly reviewed studies from North America, given its unique transportation context.
Travel Mode Choice and Switching Behaviors
Most of the scholarship on mode choice assumes that people make rational choices, trading off the costs of time and money spent on travel ( 11 ). Researchers have also examined how nonfinancial factors—for example, physical comfort or emotions such as fear or frustration—influence mode choices ( 12 ). Regardless of the factors they consider, most scholars hold that travelers choose the mode that offers them the most utility—financial, emotional, or otherwise ( 13 ). Understanding why, when, where, and for whom public transit offers utility can improve efforts to attract riders to public transit. Yet public transit is not the mode of choice for many travelers for several reasons, some of which are especially pertinent in the United States. Relative to private cars, public transit offers slower speeds and long waiting periods, which together cause longer travel times ( 14 ). Compared with private cars, transit also offers lower coverage of areas and thus less total access within a fixed time budget ( 15 ).
However, public transit also offers significant benefits to travelers. First, riding public transit costs less than owning and operating a private automobile ( 16 ). Public transit also allows a person to multitask while traveling ( 17 ) and can be less stressful than driving ( 18 ). It also does not require people to find parking, paid or otherwise. Beyond the automobile, other modes compete with public transit. These modes include active travel like walking and bicycling as well as newer shared mobility services like ridehail, carsharing, bikesharing, and shared e-scooters. These modes have their own disadvantages and advantages over public transit. For example, ridehail tends to offer faster travel times but is more expensive than transit ( 19 ), whereas active travel may offer greater temporal flexibility and cost less than public transit but can be too slow or physically exhausting for longer trips ( 20 ).
The travel behavior literature on switching to public transit primarily addresses rail. Researchers have examined whether light and heavy rail lines, in particular, draw new users out of their cars or attract travelers from other transit lines or active modes ( 4 ). Studies note that light rail riders often switch from adjacent bus lines ( 3 ). Yet other studies have found net gains in bus ridership along light rail corridors, including in Minneapolis ( 21 ) and Salt Lake City ( 22 ). A recent meta-analysis of eight studies found that new light rail lines decrease the share of both automobile and bus travel in adjacent areas but have no meaningful effect on active travel trips ( 4 ). This suggests that many travelers on new rail services formerly drove or took bus transit for the trip ( 4 ). We identified a single study of an express bus line in New York City and its impact on walking distance ( 23 ). However, we could find no such study of mode-switching to a new local bus line in North America.
Income, Older Adults, and Public Transit
Public transit is often geared toward people with travel constraints ( 24 ), a category that includes some older adults. Concerningly, mobility levels tend to decline with age ( 5 ), partially because of falling driving rates ( 6 ). Older Americans are far more likely not to travel on any single day than younger adults ( 5 ). On average, they make fewer trips and travel fewer miles per day ( 5 ). Such constrained mobility may limit out-of-home activities like socializing ( 25 ), which has been associated with a lower quality of life for seniors and even depression ( 26 ).
Though public transit has the potential to close mobility gaps for older travelers, it has had limited success doing so ( 27 ). U.S. transit agencies receiving federal subsidies must offer reduced fares to seniors ( 28 ). Despite these lower fares, however, national studies of the United States indicate that older adults ride public transit less often than younger adults do ( 29 ). These trends mirror findings on patterns in travel preferences. In a national survey of older adults who had ceased driving, most respondents preferred getting rides over taking public transit ( 30 ). Further, a study of older Canadian adults found that some of them—particularly those with little previous experience riding transit—struggled to transition to taking the local bus service ( 31 ).
Differences in trip purpose, particularly rates of commuting, also help explain why older adults travel differently than younger ones. Compared with younger adults, older adults take fewer work-related trips ( 32 ). This presents a challenge for public transit, which disproportionately serves the traditional 9-to-5 commute in the United States ( 33 ). One unique transportation resource available to older adults is paratransit (also known as demand-responsive service) ( 27 ). Yet it, too, has its limitations, including a lack of temporal flexibility. Indeed, researchers found via surveys that elderly people in North Texas lacked consistent access to grocery stores, given the need to schedule paratransit trips days before travel ( 34 ). Policy makers thus appear to recognize the public’s responsibility to provide mobility for seniors, yet public transit often falls short in doing so.
Gaps in the Literature
This paper contributes to several gaps in the planning literature on older adult travel and changes in mode choice. As noted above, some researchers have examined mode-switching for riders of new rail services ( 4 ). Mode-switching to local bus services may differ, as local bus offers more limited benefits—including in speed and comfort—compared to rail service ( 35 ). This could mean, for example, that driving replacement rates are lower for new local bus routes than for heavy or light rail.
We also contribute to the literature on the travel needs of older adults and their use of public transit. As we describe above, researchers have established that the travel needs of older adults differ from those of working-age adults ( 32 ). Public transit, the prevailing subsidized shared mobility mode, may not adequately serve these unique needs ( 27 ). Understanding the utility that older adults derive from public transit may inform efforts to help them maintain their independence and mobility. Comparing older adults to people aged 18 to 64 (a category we call “working-age adults”) allows us to determine the degree to which their needs diverge from those of the population more likely to use transit for commuting ( 32 ). Finally, we address these questions using robust data from on-board transit surveys, a rich source of information often unavailable in studies of mode-switching behavior ( 36 ).
Another gap in the travel behavior literature pertains to our study area of Philadelphia, a large metropolitan area that has received relatively limited attention from researchers of public transit ( 37 ). The city had a population of 1.6 million in 2019 ( 38 ). Similar to other large Northeastern cities like Boston and New York City, Philadelphia has a legacy transit system and a relatively high share of transit use ( 39 ). However, its residents face uniquely high rates of disadvantage, as Philadelphia is the most impoverished large city in the United States ( 40 ). Low-income older adults represent a population especially at risk of low mobility ( 5 ) and who may benefit from improved public transit access ( 41 ). Route 49, in particular, serves several neighborhoods with very high poverty rates ( 10 ). Given its unique transportation and socioeconomic landscape, Philadelphia is thus a prime environment for studying riders of a new local bus route.
Methods
Below, we describe the location of the case study, data collection protocol, and analytical approach. We conclude with the strengths and weaknesses of our methodology and their implications for interpreting our findings.
Case Study Area and Data Collection
Our study addresses riders of Route 49, a SEPTA local bus route that began service in February 2019 ( 42 ). It runs north–south through central Philadelphia and connects two low-income peripheral neighborhoods (Strawberry Mansion in North Philadelphia and Grays Ferry in South Philadelphia) with the more affluent central area of University City. In addition to its higher residential incomes, University City has the second-highest concentration of jobs among Philadelphia neighborhoods. In materials and media interviews before the route began operation, SEPTA officials emphasized Route 49’s potential to increase access to employment in University City ( 42 ). Agency officials also noted that many University City workers did not take transit to work ( 43 ), indicating a robust market of commuters on which to draw. In addition to these considerations, Route 49’s ridership trajectory makes it an optimal case for examining trends among users. Although Route 49 exhibited lower-than-average ridership in the pre-COVID period ( 44 ), it has seen the highest recovery rate of any SEPTA local bus route following the pandemic: as of September 2024, Route 49’s ridership was at 121% of prepandemic levels, compared with a systemwide rate of 74% ( 45 ). Owing to its ridership growth, use of Route 49 provides insight into sustained demand for public transit, including in the post-COVID-19 travel environment.
Figures 1 and 2 show maps of the study area and Route 49 overlaid on data for proportions of household poverty and residents over the age of 64. Figure 1 indicates that the northern and southern terminuses of the line have higher rates of poverty than the central section of the route and much of the rest of Philadelphia. Figure 2 shows that Route 49 serves neighborhoods with roughly typical levels of adults aged 65 and older.
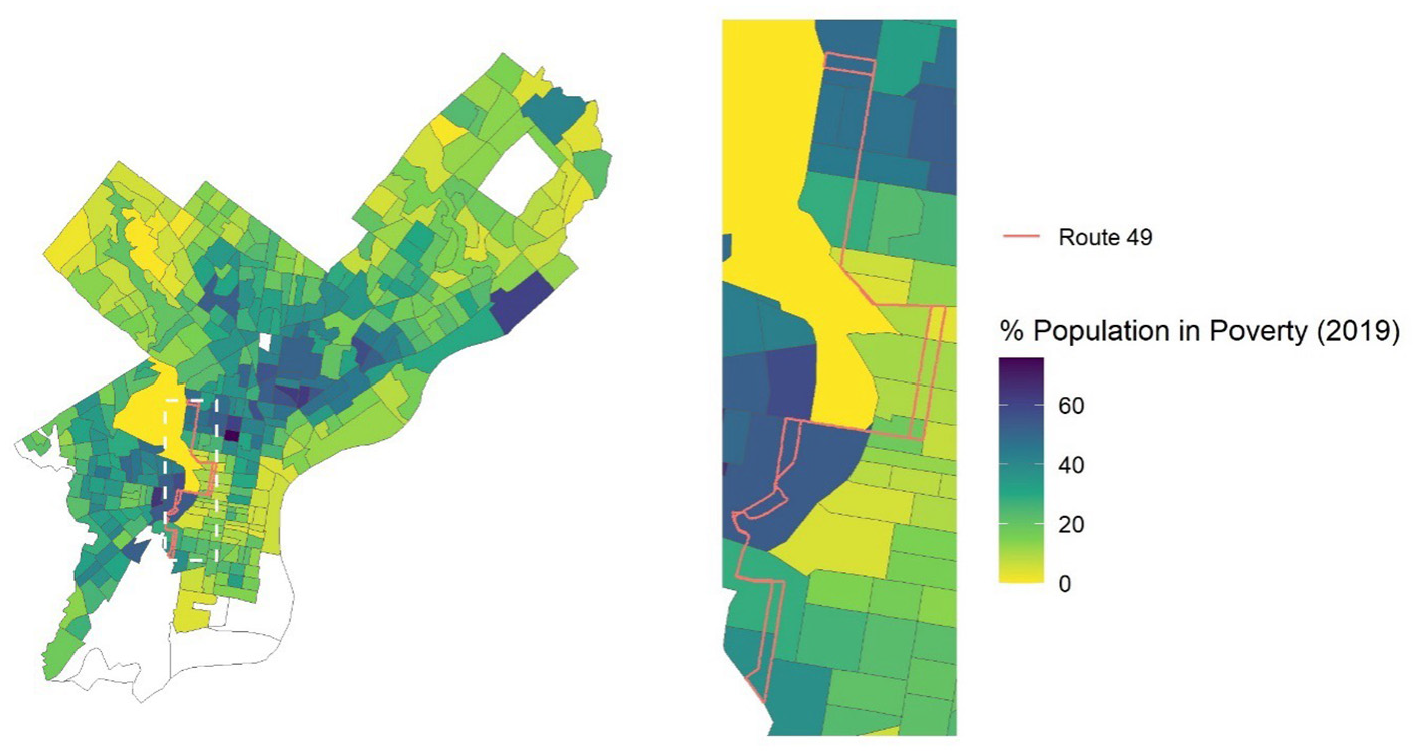
Route 49 study area (with percent of households in poverty, 5-year estimates for 2015 to 2019).
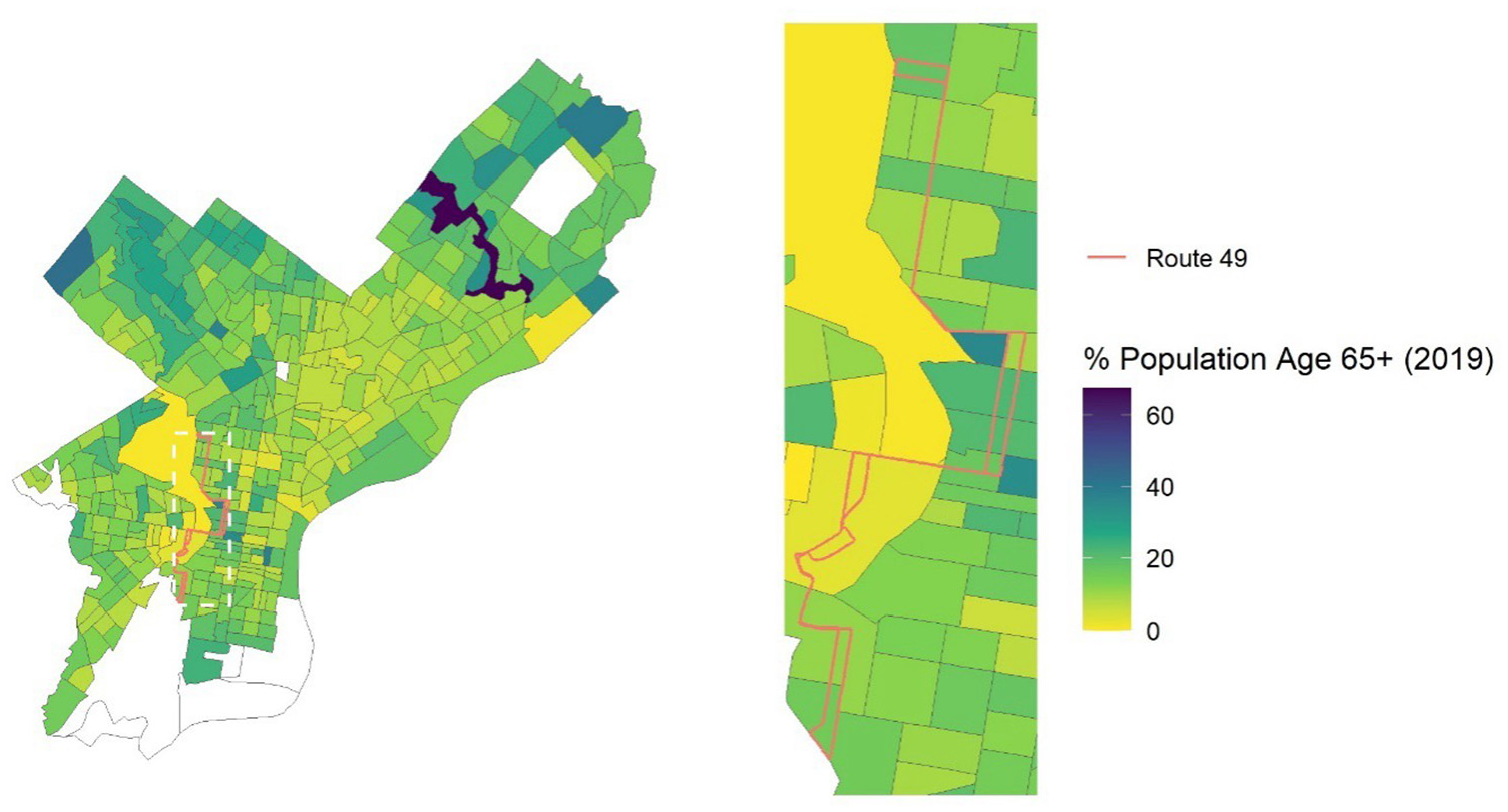
Route 49 study area (with percent of residents aged 65 plus, 5-year estimates for 2015 to 2019).
We conducted on-board intercept surveys from June to September 2019. Surveys included both multiple-choice and open-response questions and were administered on digital tablets. The average survey took about 7 min. Surveyors collected data on both weekdays and weekends, during off-peak and peak periods, and boarded Route 49 at various stops along the route. Although we offered the survey in several languages, all users chose the English version. The full text of the survey instrument is available on request. Except for people under the age of 18, all riders on board Route 49 were eligible for the survey; this conformed to Institutional Review Board requirements (University of Pennsylvania Institutional Review Board Protocol #833148). Surveyors administered the intercept survey to all riders they encountered over the survey period.
We employed a convenience sampling approach in conducting the intercept surveys. Given the dynamic nature of boardings and alightings, we could not calculate an exact nonresponse rate. However, the two survey administrators estimated that about 80% to 90% of those asked to take the survey did so. We did not provide any compensation to take the survey, and we administered the survey shortly after SEPTA launched Route 49 as a “pilot” (the line is no longer in the pilot stage). This may have increased response rates, as respondents may have believed that their input would shape the design or operation of the route.
Methodological Approach
After collecting the on-board survey data, we eliminated several observations from the final analysis, including data from respondents under 18. We also dropped observations in which the respondents withheld critical information for the analysis (for example, on the modes used for the trip before Route 49 began service). This reduced our sample from 356 to 315 survey responses, a value that allowed us to conduct tests assessing statistical significance. Our focus on mode-switching behaviors reflects SEPTA’s original impetus for the route ( 42 ). However, as we completed the data collection, we noticed a high proportion of older adults using this new route. This allowed us to assess the association between age and travel pre- and post Route 49’s start of service, and to engage with previous research on the travel behavior of older adults (and, in particular, their use of public transit).
We employed two methods to address our research questions. First, we investigated mode-switching and trip generation using a multinomial logistic (MNL) regression model that took the following form:

where Previous mode reflects the mode choice for the same trip taken before Route 49 was added to the network and the reference category for Previous mode is public transit (e.g., another SEPTA bus or rail line); Age is a binary variable for age greater than 64 with the reference category of age under 65 years; Gender is a binary variable for female with the reference category of male; Income is a binary variable for a respondent having income less than $40,000 with the reference category of income greater than or equal to $40,000; and the link function is generalized logit.
Second, we interpreted changes in the travel behaviors of older adults through a series of chi-squared tests of independence. We used age 65 as the cutoff to define age groups due to its prominence in the social science literature ( 47 ). Policy researchers in the United States often select this age given its association with eligibility for retirement and Medicare, federally subsidized health insurance ( 48 ).
Strengths and Weaknesses of our Approach
Our analysis has several strengths, most notably the novelty of the data. First, we have data about a phenomenon—ridership on a new local route—that had not occurred for over a decade in Philadelphia. We thus gathered empirical data from observed trips, whereas most surveys only capture statements about hypothetical situations. Further, several of the studies of light rail ridership we describe above only conducted cross-sectional surveys of travel behavior, for example, ridership declines on adjacent transit lines, and so cannot conclusively establish whether an individual directly switched from one mode to another (21, 22). Further, our survey measured changes in travel behavior that had occurred recently, which reduces recall bias ( 49 ). Additionally, surveying people at least 4 months after the beginning of the route’s service allowed respondents sufficient time to learn of Route 49 and establish new travel patterns.
Although conducting surveys in-person and on board routes is resource-intensive, it provides critical and accurate information about travelers ( 36 ). Transit agencies often use opt-in digital surveys to save money and time. Given their lack of representativeness, such digital surveys often suffer from issues with external validity ( 36 ). More recently, researchers have relied on passively collected data sources, for example, location-based service data from cellphones, to infer information about travel patterns. These sources, however, face considerable sources of error and bias, particularly for studies of public transit ( 50 ). Studies have also used in-vehicle Automated Passenger Collection data and inferred information about users from the characteristics of the census tracts at which they board or alight ( 51 ). Assigning demographic factors to riders based on geography, however, introduces the issue of ecological fallacy, or the assumption that a person who lives somewhere has the same average characteristics of that area. Further, because of resource constraints, most transit agency-led surveys of riders gather data on all riders throughout the system rather than on specific routes ( 52 ). Our focus on Route 49 allowed us to collect information for a single line serving a relatively compact geographic area.
Despite efforts to survey a variety of riders by targeting different times and locations, our sample may not perfectly capture patterns among all Route 49 riders. For example, we conducted most surveys during the summer months, when many students at universities in the area were not living on campus. However, comparing the demographic data on surveyed riders from those of the 2018 Customer Satisfaction Survey ( 52 ) suggests that our respondents did not differ dramatically from the average systemwide SEPTA rider. This reassured us that our data did not suffer from substantial sampling bias.
Results
We present the results in three sections. In the first section, we describe the general demographic characteristics of our sample. We then employ MNL regression to explore the determinants of mode-switching and trip generation that occurred from before and after Route 49 began service. In the third section, we use chi-square tests to document differences in Route 49 use between older and working-age adults.
Characteristics of Route 49 Survey Respondents
Table 1 shows summary statistics about the survey respondents. It includes information on gender/sex, household income, age, and home location (based on the home zip code provided by respondents).
Summary Statistics of Surveyed Route 49 Bus Riders
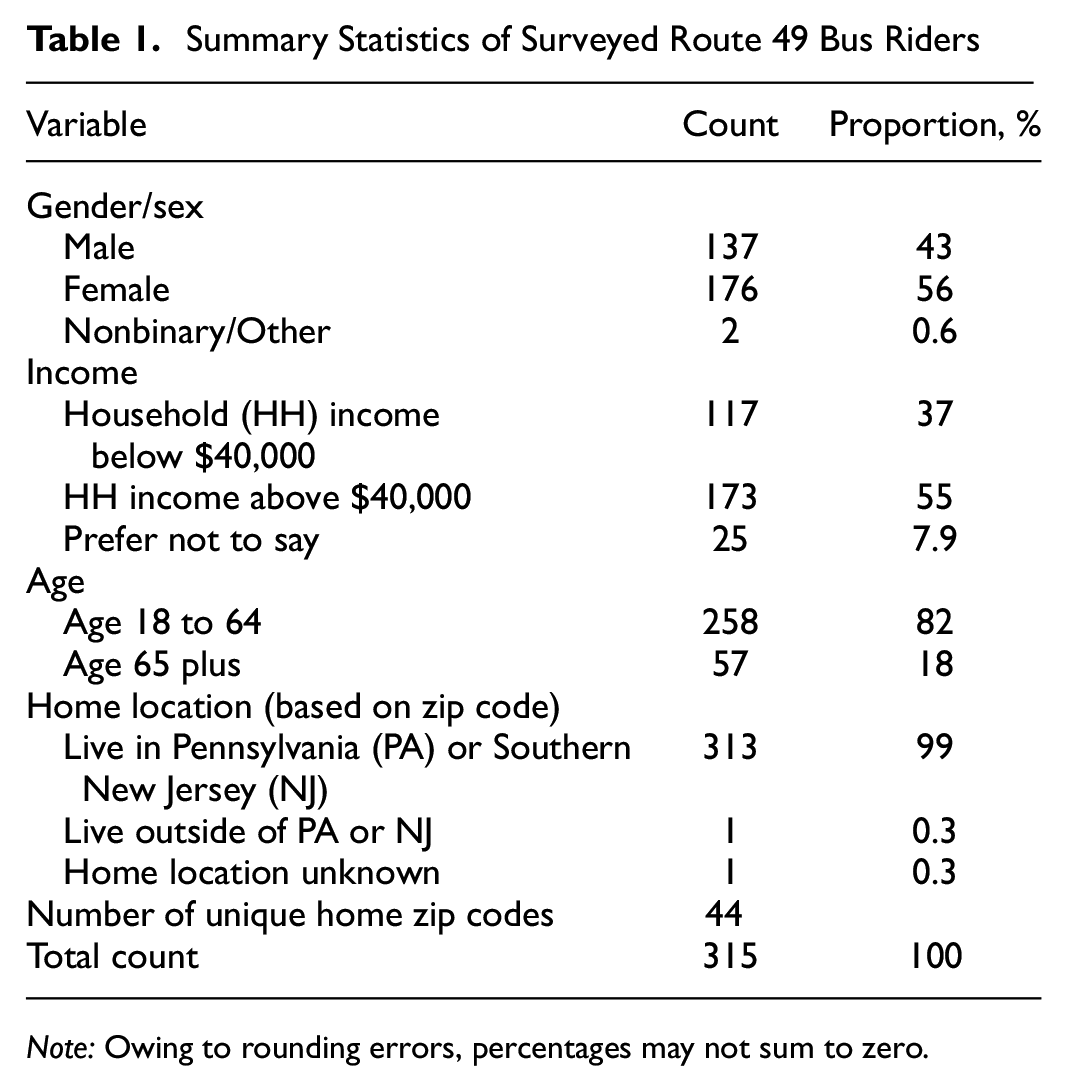
Note: Owing to rounding errors, percentages may not sum to zero.
The demographics of our sample resemble other data on SEPTA transit riders, including from the 2018 on-board survey of SEPTA riders on all services (which include heavy rail, light rail, suburban bus, and local bus). In that survey, 61% of respondents were female ( 52 ), similar to the 56% of our respondents. Further, 41% of our survey respondents who provided household incomes reported values below $40,000, compared with 47% of respondents who had incomes below $35,000 in the 2018 systemwide survey ( 52 ). However, our sample had a greater proportion of older adult riders than in the systemwide survey: only 6% of SEPTA’s surveyed riders in 2018 were 65 plus ( 52 ), compared with 18% of Route 49 survey respondents. Finally, our respondents lived in zip codes across the city, but almost all of them lived in Southeastern Pennsylvania or Southern New Jersey. This reassured us that we gathered representative data on regular local riders.
Trip Generators Versus Mode Switchers
First, we answer two simple questions: what proportion of Route 49 riders were trip generators versus switchers, and from what modes did the switchers come? Figure 3 shows a schematic representation of these relationships, with counts of respondents based on their prior travel behaviors.
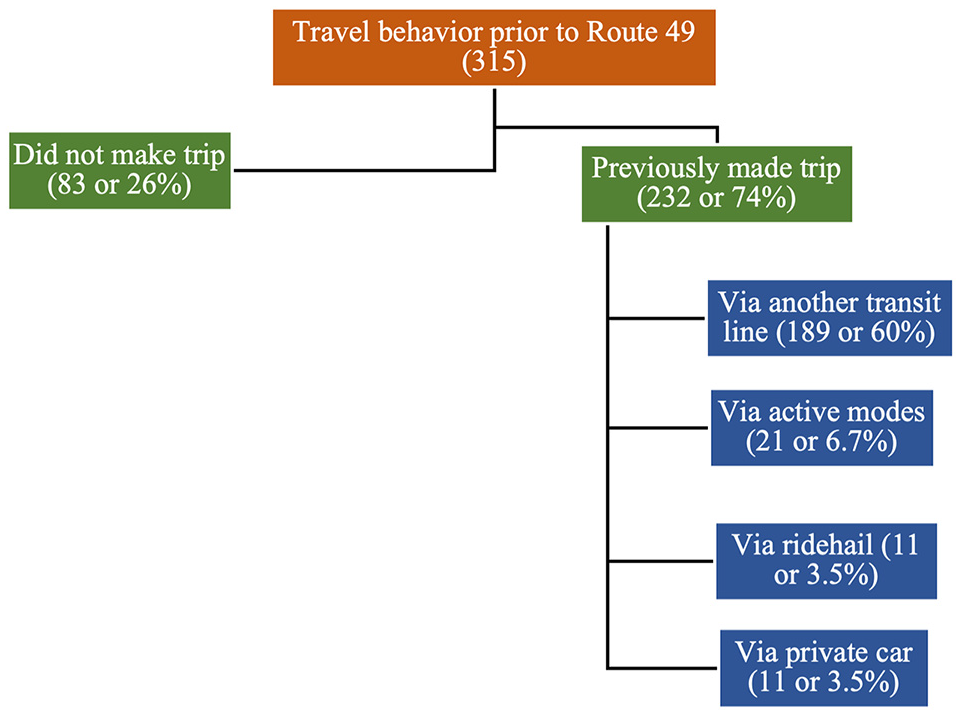
Previous travel behavior of surveyed Route 49 riders.
Per Figure 3, 26% of Route 49 trips were new trips, meaning that respondents had not taken this trip before the line was added to SEPTA’s network. Only a small minority of travelers switched from auto-based modes like private car (3.5%) and ridehail (3.5%). Most travelers (60%) switched from another SEPTA public transit service and primarily another bus route. Another 6.7% switched from active travel modes like walking and bicycling.
Next, we examine whether any mode-switching or generating behaviors varied by demographic characteristics. Table 2 shows the parameter estimates from an MNL regression model predicting the mode used for the same trip before Route 49’s existence. For the model results, the reference outcome was previously taking the trip via another transit line (the most common behavior, as demonstrated by Figure 3). Given the model’s fairly small sample size, it is noteworthy that two of the demographic characteristics were statistically significant (p < .05). First, relative to having taken the trip via public transit, having a household income below $40,000 (rather than above $40,000) had a negative association with the likelihood of the journey being taken via active travel. Second, relative to previously taking the trip via public transit, being 65 plus (rather than age 18 to 64) had a negative association with not having taken the trip at all before the onset of Route 49. We tabulated summary statistics on mode-switching behaviors for travelers aged 65 plus (see Figure A1 in the Appendix for full data). They show that most older adults (81%) previously took the trip via public transit, notably higher than the 60% among all travelers (see Figure 3).
Predicting Mode Switch or Trip Taken (Reference: Trip Previously Taken via Another Transit Line)
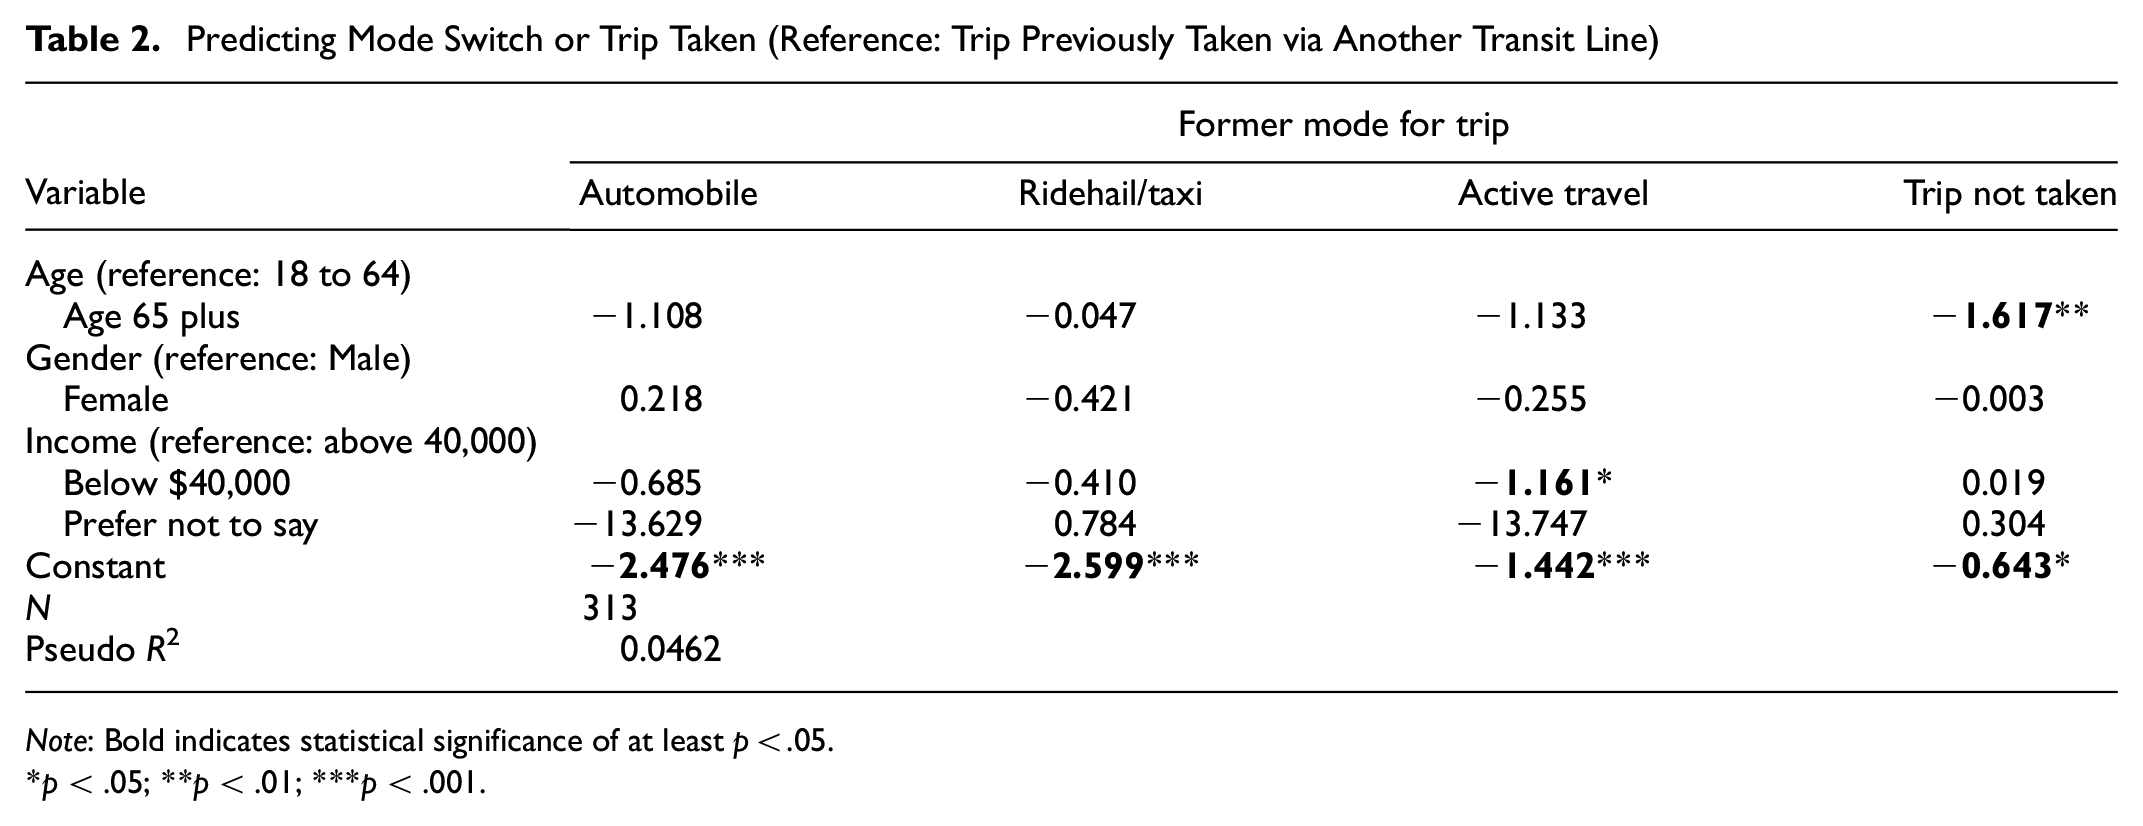
Note: Bold indicates statistical significance of at least p < .05.
p < .05; **p < .01; ***p < .001.
Elderly Riders, Utility, and Trip Complexity
The model above indicates that travel behaviors before Route 49’s service differed between older and younger riders. To further explore this issue, we conducted several chi-square tests to check for behavioral differences between the trips taken by people over 65 versus riders 18 to 64 years of age.
Table 3 shows the results of these tests. It indicates that, indeed, travel patterns on Route 49 differed by age. A larger proportion of older adults took the trip in question before Route 49 began service versus working-age adults (91% versus 70%). Additionally, compared with working-age adults, older adults were more likely to transfer to or from another bus or rail line (in addition to Route 49) as part of their trip (p < .05). Older adults were also marginally less likely to only take the mentioned trip via Route 49 (p < .10). A greater proportion of working-age adults took Route 49 for the commute and one of the ends of their trip was home (p < .001 and p<.05, respectively), compared with older adult riders. Working-age adults were also more likely to take Route 49 more than three times per week (p < .01). Finally, older surveyed Route 49 riders were less likely to be new SEPTA riders (p < .05).
Trip Complexity, Trip Purpose, and Change in Travel Behaviors
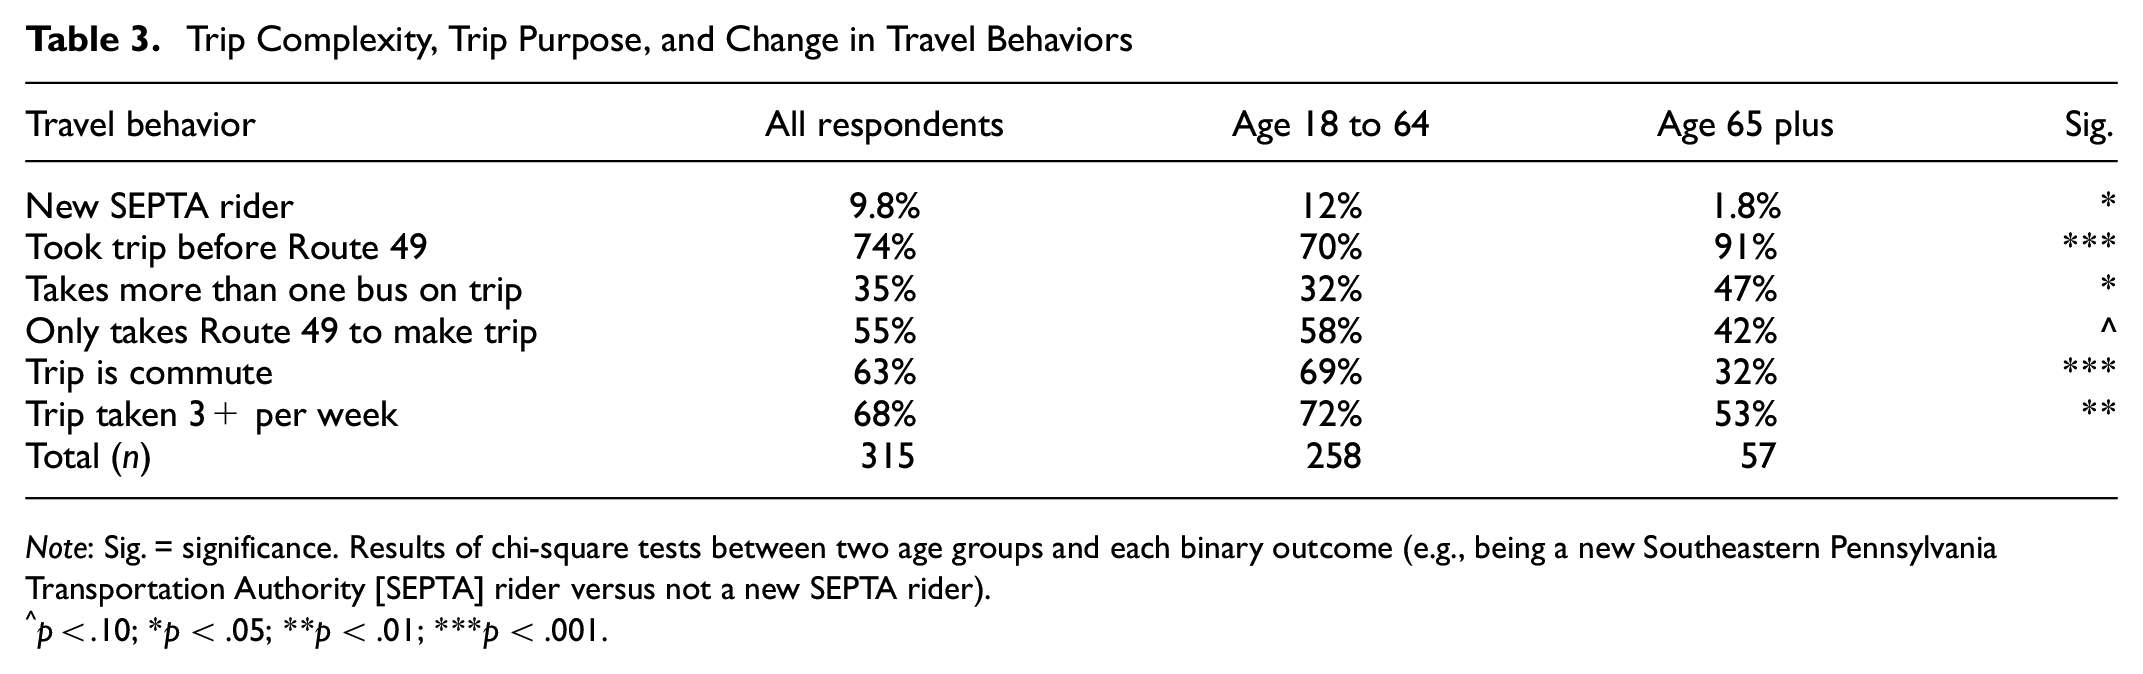
Note: Sig. = significance. Results of chi-square tests between two age groups and each binary outcome (e.g., being a new Southeastern Pennsylvania Transportation Authority [SEPTA] rider versus not a new SEPTA rider).
p < .10; *p < .05; **p < .01; ***p < .001.
Additional Findings
We also inquired about the first- and last-mile solutions Route 49 riders used to reach the transit portions of their trips. The vast majority (97% and 98%, respectively) of travelers walked to began or ended the transit portion of their trips. Table A1 in the Appendix shows these data for all modes. We also assessed satisfaction with Route 49. Almost 97% of respondents reported that they were satisfied with the service. We found no statistically significant differences in access/egress modes or satisfaction with Route 49 between the two age groups (see Table A2 in the Appendix).
Discussion
These survey data allowed us to reach several conclusions. First, despite transit agency goals to attract new users, very few early Route 49 riders were new SEPTA customers. Second, mode-switching was not a frequent phenomenon on the new service; instead, most riders of the new route switched from other SEPTA routes. A small minority of respondents (7.0%) switched from automobile-based modes, including ridehail, whereas a similar proportion (6.7%) switched from active travel modes. New trips were also a substantial portion (26%) of Route 49 travel, meaning that it served many trips that did not occur before February 2019. However, this does not necessarily indicate latent demand for travel suddenly served by the presence of Route 49. Some events likely occurred simultaneously. For example, a person may have begun a new job right after Route 49 began service; without the presence of the route, they might have taken another SEPTA route or used ridehail.
We found associations between some demographic characteristics and certain travel behaviors related to Route 49. Compared with switching from public transit, having a lower income had a negative association with switching from active travel to Route 49. Given the small sample size of four people with incomes below $40,000 who switched from active travel, however, we urge caution in drawing conclusions from this finding. Among other demographic characteristics, age had the most unique relationship with behavioral patterns on the new route. Compared with working-age adults, older adults were more likely to use Route 49 on complex trips (i.e., to take more than one transit line for the current trip). They were also more likely to take that same trip using an alternate mode. Unsurprisingly, older adults were less likely to use Route 49 to commute than working-age adults. Older adults also took the service less frequently. Finally, compared with working-age adults, older travelers were more likely to have already been making the trip served by Route 49 (via some other mode or SEPTA route) before service began.
Our findings contribute to a body of literature that examines differences in how older versus younger adults use public transit ( 53 ). This growing body of literature is relevant because, as we have explained, agencies tend to design public transit services to serve the work commute. Yet older adults—many of whom no longer work—still have important shared travel needs. We documented travel behavior differences by age on a new local bus route in Philadelphia. Compared with working-age adults, older adults had travel needs that were more stable over time, including since the introduction of Route 49. The new service more often motivated working-age adults to begin riding SEPTA. Compared with younger adults, older ones may have seen less elasticity of travel demand over the period before and after Route 49 began service. That older adults were more likely to take multiple bus routes to complete their trips also suggests that their travel demand was inelastic; research shows that switching between routes can add costly time to travel via public transit and thus dissuades people from choosing transit over automobiles ( 14 ). Further, that older adults also took the same route via a non-public-transit route could mean that even when public transit was inconvenient or unavailable, they still made the trip. An alternate interpretation of this finding, however, is that older Route 49 riders had more modal options than working-age ones.
The findings on commute also raise questions about the utility of Route 49 for different age groups, as increased access to employment can be especially important for disadvantaged travelers ( 54 ). SEPTA designed Route 49 to connect travelers from low-income neighborhoods to a jobs-rich center, meaning that the new service could have especially high utility for its commuters who gained increased access to employment via transit. Because we found that working-age adults more often used the service to commute to work, Route 49 may have strong potential to improve economic conditions for this group.
Another noteworthy finding, although somewhat distinct from our main analysis, pertains to how little Route 49 riders integrated their use of the new bus line with other emerging transportation options. In the survey, if a respondent answered that they bicycled to the start or end point of their transit trip, they would then be asked whether they had used Indego, Philadelphia’s bikeshare program that began operating in 2016 ( 55 ). But because no respondents reported bicycling to start their trips, no users were questioned about their use of bikeshare. Similarly, rates of trip replacement and use of other shared transportation services—including ridehail and carshare—were minimal, as we have discussed. Finally, unlike in many other large U.S. cities, shared e-scooter systems are not allowed to operate legally in Philadelphia ( 56 ). As a traditional fixed-route public transit service, Route 49 did not appear to integrate into a newer generation of micromobility and other digitally facilitated shared mobility options.
Policy Implications and Future Research
Our findings have several policy implications. Redesigning and redeploying effective new services are critical tasks for U.S. transit agencies seeking to reverse ridership losses lingering since the end of the COVID-19 pandemic. Efforts to recapture transit ridership—including new local bus routes that better serve a post-COVID environment—should account for the patterns and possible motivations behind mode-switching explored here. Assessing the needs of current riders, in particular, might help increase ridership on new routes.
Although transit agencies may hope to attract new riders when operating new services, our data suggest this did not occur with Route 49 in Philadelphia. Fewer than 10% of surveyed riders were new to SEPTA. Further, only 7% of travelers switched from an automobile-based mode to the new bus line. This does not mean that Route 49 riders did not reap benefits from the route, of course. Instead, it suggests that previous SEPTA riders were the primary market for the line. When designing new services, then, transit agencies should strongly consider the needs of current riders. Indeed, input from previous riders likely contributed to Route 49’s popularity. In 2017, community leaders complained about the route’s original design, which did not serve Strawberry Mansion ( 57 ). SEPTA later extended the route north into the neighborhood. Seeking feedback from the community of current riders—including about route locations—may help increase ridership on new services.
Other findings have noteworthy implications. Some survey respondents were previous SEPTA riders who, before the route began service, did not take the trip available via Route 49. As we explain above, they may have been attracted to the trip by Route 49’s availability or the trip need may have co-occurred with (or shortly after) the line began service. Regardless, this also represents a critical group that benefited from enhanced mobility via Route 49; though these travelers were not car switchers, their additional generated trips clearly provided them with value. Further, most riders made the same trip before Route 49 on another SEPTA service. Many of these riders likely benefited from shorter travel times and first-/last-mile connections. Planners should carefully account for these benefits to current riders when designing new transit services.
Additionally, our findings suggest that older adults have relatively stable needs that local bus routes could better serve. Whereas planners designed Route 49 to connect low-income neighborhoods in Philadelphia with a jobs-rich destination, many older adults in the sample did not use the bus to commute. Given the preponderance of noncommuters among users, SEPTA might modify Route 49’s schedule to better serve the needs of a diverse set of riders. Further, dense clusters of jobs and medical facilities are often collocated in Philadelphia, meaning that commuter-oriented routing could be adjusted to meet the needs of older adults seeking medical care. Older adults were also more likely to take complex routes, including more than one bus line. Flexible transit services might benefit this group by saving them time and energy switching from different routes. Demand response service already exists in Philadelphia, provided by the Customized Community Transportation Connect program ( 58 ). However, it requires users to book trips days in advance ( 58 ), and research finds that such requirements lead to unmet travel needs among older adults ( 34 ). More flexible transit service during nonpeak commute hours, which does not require early booking, could better serve the unique market of older adult transit users.
Future research could build on our findings. Researchers might address mode-switching by collecting longitudinal data in other regions. Though the average Philadelphian takes most trips via automobile, SEPTA’s legacy system offers far greater coverage than most U.S. transit agencies. Thus, the patterns of new riders on local bus routes—and in particular, their mode-switching behaviors—could differ in regions with lower densities of transit service. Additionally, more in-depth survey data could add greater nuance to understanding how travelers choose between different modal options. For example, researchers might survey riders about how travel time reliability, physical access to the service, and safety encourage or discourage their use of new services. They might also study whether or how traditional public transit complements emerging shared transportation options, and why we found limited evidence of a complementary relationship for Route 49. This could help improve shared transportation services and enhance access for existing and future transit riders.
Supplemental Material
sj-docx-1-trr-10.1177_03611981251331012 – Supplemental material for Is This Your First Time Here? Older Adults and Mode-Switching on a New Local Bus Route in Philadelphia
Supplemental material, sj-docx-1-trr-10.1177_03611981251331012 for Is This Your First Time Here? Older Adults and Mode-Switching on a New Local Bus Route in Philadelphia by Julene Paul and Joshua Davidson in Transportation Research Record
Footnotes
Acknowledgements
The authors acknowledge Dr. Megan Ryerson of the University of Pennsylvania and Brandon Miller of SEPTA for their assistance throughout the data collection and initial analysis. We also thank the three reviewers for their insightful comments and feedback.
Author Contributions
The authors confirm contribution to the paper as follows: study conception and design: J. Paul, J. Davidson; data collection: J. Davidson; analysis and interpretation of results: J. Paul, J. Davidson; draft manuscript preparation: J. Paul, J. Davidson. All authors reviewed the results and approved the final version of the manuscript.
Declaration of Conflicting Interests
The authors declared no potential conflicts of interest with respect to the research, authorship, and/or publication of this article.
Funding
The authors received no financial support for the research, authorship, and/or publication of this article.
Data Accessibility Statement
The datasets generated during and/or analyzed during the current study are available from the corresponding author on reasonable request.
Supplemental Material
Supplemental material for this article is available online.
References
Supplementary Material
Please find the following supplemental material available below.
For Open Access articles published under a Creative Commons License, all supplemental material carries the same license as the article it is associated with.
For non-Open Access articles published, all supplemental material carries a non-exclusive license, and permission requests for re-use of supplemental material or any part of supplemental material shall be sent directly to the copyright owner as specified in the copyright notice associated with the article.