



Abstract
This study addresses a research gap in adopting Mobility as a Service (MaaS) in developing countries, focusing on work trips and shared mobility options. It comprehensively analyzes MaaS adoption using joint revealed and stated preference data, which has been underexplored in the existing literature. This study employs discrete choice models: the multinomial logit model under random utility maximization (RUM) and a random regret minimization framework (RRM), separately, along with error component logit with a RUM framework to investigate the effects of socioeconomic and travel characteristics on MaaS adoption in India. The findings reveal that lower-income individuals strongly prefer MaaS over private vehicles. Gender has an insignificant effect, in contrast to findings from developed nations. Travel time, travel cost, travel time reliability, waiting time, and number of transfers negatively affect MaaS adoption. A higher number of transfers, a higher waiting time, a higher travel time reliability, and a higher travel time have a significantly negative effect on MaaS adoption. This study further estimates the reliability ratio of 0.51 for work trips, emphasizing the significance of travel time in mode choice. These insights provide crucial policy implications for fostering inclusive MaaS systems in developing countries.
Keywords
Introduction
Mobility as a Service (MaaS) is an innovative framework that integrates various transportation modes, such as shared mobility, micro-mobility, and public transit, into a unified, user-centric service ( 1 ). By providing a seamless and flexible mobility portfolio, MaaS has the potential to transform urban transportation, especially for work-related trips. This study focuses on developing a cohesive MaaS scheme tailored for work trips in emerging economies, particularly in India.
Rapid urbanization in developing countries has significantly increased the demand for efficient and sustainable mobility solutions ( 2 , 3 ). MaaS, with its shared mobility options, is crucial for reducing the negative effects of urban transport, including traffic congestion, air pollution, and noise pollution ( 4 ). However, these regions face unique challenges, such as inadequate infrastructure, socioeconomic disparities, and technological limitations, which require innovative and context-specific transportation solutions ( 5 ). Understanding the factors that influence MaaS adoption and addressing these barriers are essential for promoting sustainable and equitable urban mobility ( 6 ).
Despite the growing interest in MaaS, most existing studies have concentrated on developed nations, often neglecting the specific challenges and opportunities in developing regions ( 7 ). MaaS can enhance transportation efficiency and user convenience; there is a lack of research on how socioeconomic factors, travel behaviors, and infrastructural constraints affect MaaS adoption ( 8 ). For example, Kamargianni et al. ( 5 ) call for more empirical studies to understand user preferences and socioeconomic determinants for MaaS adoption. In addition, metrics such as value of time (VOT) and value of reliability (VOR) have been well studied in traditional transportation; however, they have not been extensively explored within the MaaS framework ( 9 ). Understanding these metrics is vital for designing MaaS solutions that meet user preferences and improve service reliability ( 8 ). Moreover, the reliability ratio (RR), which evaluates the trade-off between travel time and reliability, remains underexplored in regions with variable travel conditions ( 10 ). In addition, researchers have attempted to explore how smart mobility solutions are evaluated within the MaaS framework ( 11 ).
Research conducted in the Global South demonstrates that MaaS adoption is shaped by fundamentally different behavioral, institutional, and infrastructural conditions than those observed in high-income countries. For example, in Lavras, Brazil, car users prioritize speed and flexibility and show relatively low cost sensitivity; however, non-car users are willing to trade longer travel times for lower costs ( 12 ). In China, the success of MaaS has been strongly dependent on public–private partnerships, government policy support, and data-sharing mechanisms ( 13 ). In Metro Manila, digitally savvy users express willingness to adopt MaaS, but adoption is constrained by gaps between expected service quality and the actual affordability and reliability of available services ( 14 ). Taken together, these heterogeneous findings indicate that MaaS adoption drivers are highly context-specific and cannot be directly transferred from developed to developing economies. This directly motivates the need for MaaS research that is explicitly tailored to the socioeconomic and infrastructural realities of developing countries.
This study aims to contribute by bridging these knowledge gaps using empirical data on MaaS adoption in India, focusing on work trips and shared mobility options, and identifying potential barriers using an analysis of demographic and travel behavior patterns. Addressing the notable lack of studies that integrate revealed preference (RP) and stated preference (SP) data in MaaS research ( 15 , 16 ), this study combines RP and SP data to comprehensively analyze user preferences and socioeconomic determinants of MaaS adoption. This integrated approach captures the actual travel choices and hypothetical scenarios, offering a more robust understanding of travel behavior and overcoming the limitations of relying solely on RP data ( 17 ). For analysis, this study utilized random utility maximization (RUM) as well as the random regret minimization (RRM) framework. In addition, this study estimates the RR for MaaS in a developing country. These metrics are crucial for understanding user preferences and the economic implications of MaaS adoption, informing travel demand models and transportation investment decisions ( 9 , 18 ). The RR provides insights into the trade-offs users make between travel time and travel time reliability in regions with variable travel conditions ( 10 ).
This study addresses three main questions: (1) what are the socioeconomic characteristics of potential MaaS users in a developing country? (2) how do key travel characteristics influence the likelihood of adopting MaaS for work trips? and (3) what is the estimated RR for work trips in a developing country such as India, and what do the results imply for designing MaaS systems that are more accessible and inclusive for disadvantaged user segments? In this study, the term “marginalized groups” refers to commuter segments that face structural barriers to accessing high-quality motorized transport in Indian cities, including lower-income workers, individuals without access to private vehicles, and users with limited or unstable digital connectivity. By answering these questions, this study contributes to the broader discourse on MaaS adoption in emerging economies, offering practical insights for policymakers and urban planners to design and implement effective MaaS systems that meet diverse user needs and preferences.
The remainder of this study is structured as follows. The Literature Review section outlines research gaps in MaaS, particularly in developing countries. The Research Framework section details the design of the SP experiment and the modeling approach. The Study Area and Data Collection section describes site selection, sample size, and the survey questionnaire. The Results and Discussion section analyzes socioeconomic profiles, travel characteristics, and MaaS adoption factors. The Estimating RR provides values for the RR. Finally, Policy Implications and Future Research Directions are discussed, followed by the Conclusions.
Literature Review
Urban transport systems are undergoing rapid change, and MaaS has emerged as one of the most widely discussed approaches to integrate traditional public transport with new shared and digital mobility options. Understanding the academic foundations of MaaS, the evidence from different contexts, and the methodological tools applied is essential to position this study within the existing body of research.
MaaS as a Concept
MaaS integrates multiple modes of transport, public transit, shared mobility, and micro-mobility into a single user-centric platform ( 1 ). Early work defined MaaS as a mobility ecosystem combining trip planning, booking, and payment in a unified interface ( 5 ). Seminal syntheses clarified definitional boundaries and identified business, governance, and institutional challenges ( 8 ). A critical review consolidated definitions and challenges ( 19 ), empirical trials such as UbiGo demonstrated real-world feasibility ( 20 ), and editorials highlighted uncertainties around scalability (1).
Existing Studies on MaaS in Developing Nations
MaaS research has expanded rapidly; much of the evidence comes from developed countries, where institutional capacity, digital infrastructure, and public transport systems differ considerably from those in emerging economies. A systematic review of MaaS in the Global South highlights three recurring structural constraints that shape adoption outcomes: (1) affordability; (2) integration with informal transport; and (3) digital readiness ( 7 ). These constraints interact with fragmented governance structures and uneven access to smartphones and digital payment systems, leading to adoption mechanisms that differ fundamentally from those observed in high-income contexts. Therefore, there is a need for empirical studies that examine MaaS adoption under the socioeconomic, infrastructure, and institutional conditions characteristic of developing countries.
Factors Influencing MaaS
The factors influencing MaaS adoption overlap with those affecting conventional transport choices but have additional MaaS-specific dimensions.
Socioeconomic Characteristics in MaaS Studies
Understanding the socioeconomic traits of potential MaaS users is vital for creating effective and inclusive MaaS solutions. However, there are significant gaps in the literature.
Income and Education
Income and education levels influence transportation choices. Individuals with higher incomes and education levels tend to prefer private cars over public transport ( 9 ). However, the effect of these factors on MaaS adoption in developing countries is not well studied ( 8 , 9 ). Research from Spain and The Netherlands shows that income and education significantly affect MaaS adoption; however, similar studies in developing countries are limited ( 21 ).
Gender and Age
Gender and age also play important roles in transportation preferences ( 22 ). Women and younger people are more inclined to use public transportation compared with men and older adults ( 14 , 23 ). However, their preferences and barriers to MaaS adoption in developing regions are not well documented. Studies indicate that younger, tech-savvy individuals are more willing to adopt MaaS if services are affordable and reliable ( 14 ). In addition, women are more likely to use public transportation, suggesting that MaaS could enhance gender equity in transportation ( 24 ).
Travel Characteristics in MaaS Studies
Travel characteristics are crucial in shaping MaaS user preferences and adoption rates. Despite extensive research on traditional transportation modes, there are gaps in understanding these characteristics within the MaaS context.
Travel Time
Travel time significantly influences transportation mode choice. Shorter travel times increase user satisfaction and the use of public transport ( 9 , 25 ). However, the effect of travel time on MaaS adoption, especially in regions with varying travel conditions, is not thoroughly studied. Research shows that reducing travel time can enhance MaaS appeal by increasing user autonomy ( 26 ).
Travel Cost
Cost is a key factor in transportation decisions ( 27 ). In Brazil, car users prefer faster, more flexible options and are less sensitive to costs, while non-car users are willing to spend more time for lower costs ( 12 ). However, studies on cost sensitivity in MaaS remain scarce. Understanding these dynamics is essential for designing affordable MaaS solutions ( 14 ).
First-and-Last-Mile Mode
First-and-last-mile connectivity is crucial for MaaS success. Shared bicycles and e-scooters are preferred for these segments ( 28 ). However, preferences in developing countries, where infrastructure may differ, are not well analyzed. Recent evidence from Mumbai, India, highlights strong commuter willingness to adopt shared vehicles under reliable and safe conditions ( 27 , 29 ). Strengthening these connections can promote sustainable transport and increase public transport ridership.
Travel Time Reliability
Travel time reliability, the consistency of travel time compared with expectations, affects user satisfaction. While well-researched for traditional modes, it is underexplored in MaaS ( 9 ). Reliable travel times are essential for designing MaaS solutions that meet user expectations ( 30 ).
Waiting Time at Public Transit Stop
Waiting time at transit stops affects user satisfaction and mode choice. Studies are lacking on its effect on MaaS adoption. Reducing waiting times by better service integration can increase MaaS attractiveness ( 5 , 31 ).
Number of Transfers
The number of transfers needed to reach a destination affects user satisfaction and MaaS adoption. Reducing transfers can make MaaS more appealing ( 5 , 24 ). However, this effect is not well studied. Optimizing transfers is essential for a seamless MaaS experience ( 31 ).
Main Mode of Travel
The primary mode of travel, public transit, private vehicles, or shared mobility, affects MaaS adoption. In China, successful MaaS implementation relies on public–private partnerships, government support, and data-sharing ( 13 ). Comprehensive studies on how these factors influence travel mode choices remain limited ( 31 ).
RP–SP Data for MaaS
MaaS studies use RP and SP data. The SP data explores user preferences for new MaaS services by hypothetical scenarios ( 15 ). The RP data analyzes actual travel behavior and MaaS uptake based on observed patterns. Integrating RP and SP data provides a comprehensive understanding of travel behavior, capturing the actual and hypothetical scenarios, which improves demand forecasting models ( 17 ). Despite its benefits, few studies combine RP and SP data in MaaS research, highlighting the need for this approach to develop more effective MaaS solutions.
RR for MaaS
There is a significant research gap on the RR in MaaS. Most studies focus on traditional modes or MaaS in developed countries, lacking empirical data on these metrics in varied travel conditions. Understanding the RR is crucial for designing MaaS that meets user preferences and improves reliability ( 9 , 32 ). Future research should quantify these metrics for MaaS in different contexts to enhance user satisfaction and service reliability ( 10 ).
Research Gap and Study Contribution
Despite extensive research on MaaS, several gaps remain, particularly in developing countries.
Limited studies on MaaS adoption in developing countries such as India.
Few studies focus on MaaS for work trips in these regions.
Lack of research on shared mobility options within MaaS.
Minimal use of combined RP and SP data to assess MaaS adoption factors under RUM and RRM frameworks.
Scarcity of research estimating the RR for work trips in India.
Addressing these gaps will provide policymakers and urban planners with practical insights to design and implement effective MaaS systems that meet user needs and promote sustainable, equitable urban mobility.
Research Framework
This section outlines the design of the SP survey and the modeling framework used in this study.
Design of SP Experiment
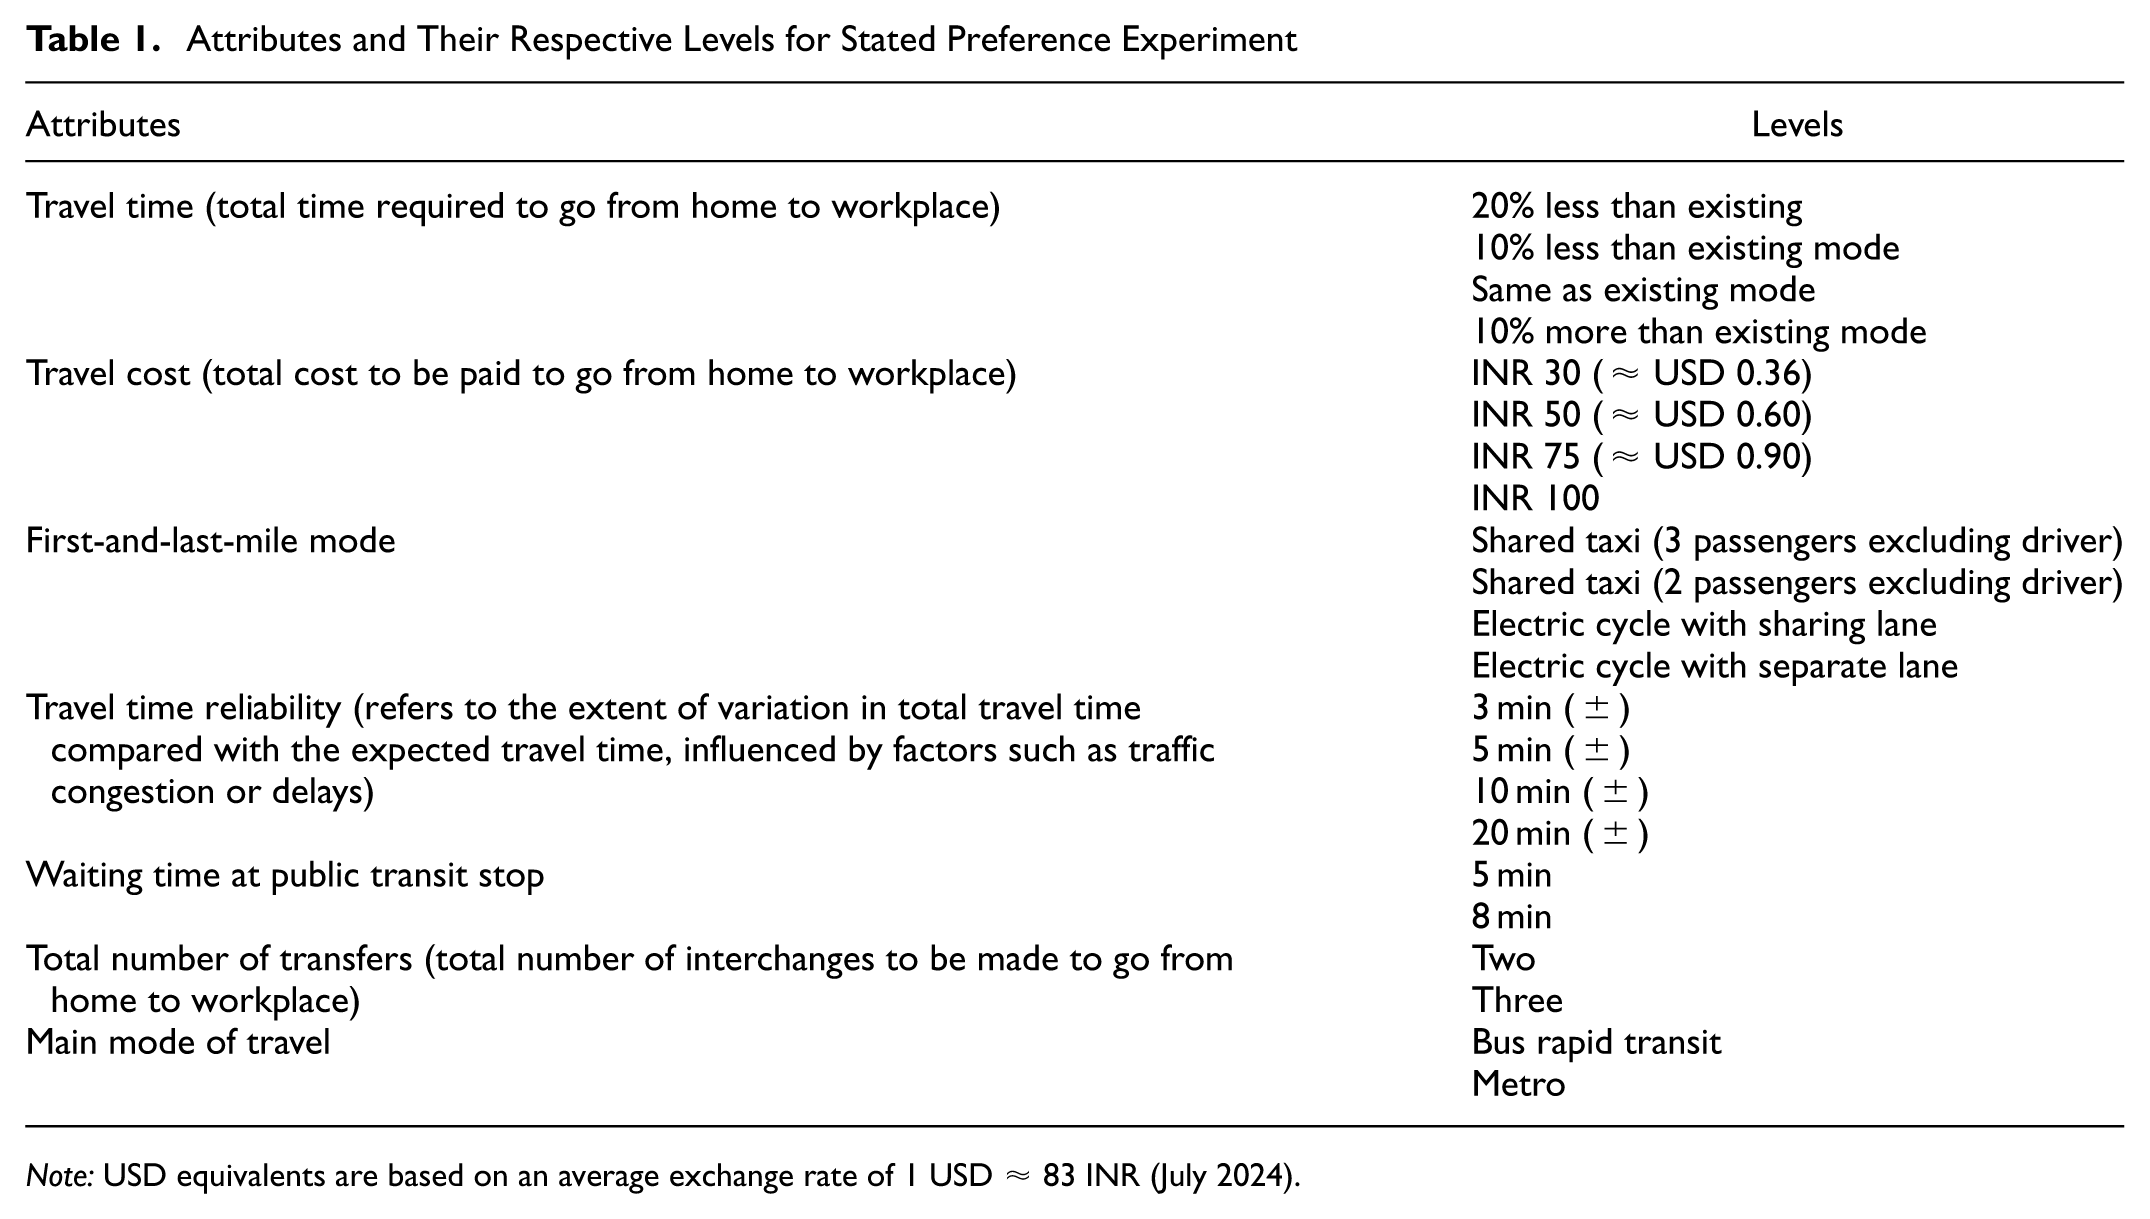
Based on the literature review, seven attributes were selected for the SP experiment: (1) travel time for work trips; (2) travel cost for work trips; (3) travel time reliability; (4) waiting time at public transit stops; (5) total number of transfers; (6) first-and-last-mile mode; and (7) the main mode of travel. Each attribute had varying levels.
Two levels: Design of SP Experiment, total number of transfers, and main mode of travel.
Four levels: travel time for work trips, travel cost for work trips, travel time reliability, and first-and-last-mile mode.
The SP design included seven attributes, three with two levels (waiting time at public transit stops, total number of transfers, and main mode of travel) and four with four levels (travel time, travel cost, travel time reliability, and first-and-last-mile mode). A full factorial combination of these levels results in 2 × 2 × 2 × 4 × 4 × 4 × 4 = 2,048 unique scenarios. Presenting such a large set of scenarios to respondents would be infeasible because of excessive cognitive burden and survey fatigue. To manage the complexity of 2,048 scenarios from a full factorial design, the Taguchi orthogonal array method (L16 specification) was employed, reducing the scenarios to 16 efficient scenario cards while preserving orthogonality and adequate variation across attribute levels. This method ensures efficient data collection while capturing variability across attribute levels ( 33 ). Table 1 presents the attributes and levels used in the SP experiment.
Attributes and Their Respective Levels for Stated Preference Experiment
Note: USD equivalents are based on an average exchange rate of 1 USD ≈ 83 INR (July 2024).
The scenarios involved changes in travel time and cost for MaaS based on participants’ current travel data, along with five other attributes and their levels. Figure 1 shows a sample preference scenario card and this study’s framework, where users choose their preferred travel options among different first-and-last-mile modes. These options include shared taxis for three passengers (excluding the driver), shared taxis for two passengers, electric cycles with shared lanes, and electric cycles with separate lanes. In addition, users can select between the metro and bus as their main mode of travel.

Sample card for stated preference scenario.
All options ensured that respondents would take 3 min to reach public transit stops and would not need to change their departure time. Each mode was detailed with waiting time, travel time, cost, reliability, and number of transfers. Based on the respondents’ current travel patterns, estimates for travel time and cost under various MaaS implementations were calculated. Respondents were then asked whether they would switch to the MaaS option or keep their current travel arrangements.
The surveys were conducted using the online platform 123formbuilder, which calculated and presented values for hypothetical scenarios based on respondents’ existing travel data (RPs). Survey questions included values from the current travel time and cost.
This study’s conceptual framework presents the working population with the choice to adopt MaaS for work trips. Respondents decide whether to switch to MaaS or maintain their current travel mode by weighing factors such as changes in travel time, cost, number of transfers, waiting time, reliability, and available travel modes compared with their existing arrangements.
Joint RP–SP Modeling Approach
This study employs a discrete choice model using pooled RP and SP data to account for scale differences. The joint RP–SP model is formulated as follows (
34
). The notation for the utility maximized by the respondents in their RP

Similarly, the utility function for the SP scenario can be given by

where
Of note, in this notation, it is possible to allow for the existence of measured variables
In utility-maximizing models, choice probabilities are derived based on assumptions about the distributions of unobserved components ε and δ. Specifying distributions for these variables is essential to establishing probability models for data analysis. Given the presence of alternative-specific constants, the unobserved components are assumed to have zero mean. For the multinomial logit model, these components are assumed to follow an independent and identically distributed Type I Extreme Value, or Gumbel, distribution.
It is assumed that the unobserved utility components (ε and δ) exhibit an independent distribution across individuals and alternatives and are independent of each other. These components follow the Gumbel distribution in its limiting form, albeit with unequal variances. Considering

The utility for the SP scenario can be scaled with

where θ denotes the relative scale parameter used to account for differences in the error variance between the RP and SP data; XSP is the vector of observed variables in the stated preference scenario; Z is the vector of additional explanatory variables specific to the SP context, if any; β and γ are parameter vectors to be estimated; and δ is the random error component in the SP utility function. After scaling, the transformed SP error term, θδ, has a variance equivalent to that of the RP error term, ε. This allows the RP and SP observations to be pooled and estimated within a common logit modelling framework.
Incorporation of Correlated Error Term in Discrete Choice Model
Standard multinomial logit (MNL) models assume independence of irrelevant alternatives and independent and identically distributed error terms, which can be restrictive. To address these limitations, the error component logit (ECL) model was employed, allowing for correlated error terms.
ECL models address these limitations by introducing a structure that allows for correlation among error terms ( 35 ). By acknowledging that certain choices may share common unobserved factors, these models offer a more flexible framework capable of capturing the complexities of the decision-making process ( 36 ). The ECL model introduces additional error components to relax these assumptions by allowing for correlation across choices. The utility specification in ECL is given as,

where

where
In this study, along with a standard MNL model, an ECL model was employed for estimation, leveraging its advantageous simplicity in empirical applications. In this study, the error terms for two of the mode choices, MaaS and two-wheelers, are correlated (based on the results obtained from a standard MNL model). The discrete choice models with RP and SP data were simultaneously estimated using the Apollo package in R ( 37 ).
RUM and RRM Framework
Two behavioral frameworks were utilized separately: (1) RUM; and (2) RRM. RUM assumes that individuals choose the option that maximizes their utility, while RRM posits that individuals choose options that minimize anticipated regret, the emotion experienced when unchosen alternatives are better in some attributes ( 38 ).
The utility functions under these frameworks were incorporated into the discrete choice models to compare and understand different decision-making processes in MaaS adoption. By integrating RP and SP data and employing the MNL and ECL models within RUM and RRM frameworks, this study provides a comprehensive analysis of the factors influencing MaaS adoption in a developing country.
Study Area and Data Collection
This section explains the rationale for selecting the survey location, the criteria for selecting respondents, the design of the survey questionnaire, and the data collection methodology.
Site Selection
This study was conducted in the Mumbai Metropolitan Region (MMR), Maharashtra, India, a major economic hub contributing over USD 15 billion to the state’s Gross Domestic Product of approximately USD 37 billion (as assessed by Net State Domestic Product), accounting for about 40% of Maharashtra’s economy ( 39 ). Within the MMR, the Bandra Kurla Complex (BKC) was chosen because of its strategic role as a central business district and employment center, hosting over 400,000 workers ( 39 , 40 ). This study specifically focuses on data collection from employed professionals in MMR, particularly emphasizing their commuting patterns for work trips. The BKC includes diverse industries, such as banking, finance, information technology, and government offices, providing a varied respondent pool. The workforce in the BKC generally has higher job security and income, which correlates with greater digital literacy and smartphone ownership, essential for MaaS adoption. Figure 2 shows a detailed map of the study area.

Map of study area and survey locations (workplace location of respondents).
Sample Size and Approach for Data Collection
To ensure diverse responses, the sample included private vehicle users (cars and two-wheelers) and public transit users (local trains). A pilot survey with 26 respondents tested the main survey form, but its data was excluded from the primary analysis. Using Slovin’s formula with a 5% margin of error, the minimum required sample size was 385.

where
n = sample size,
N = total population, and
A total of 643 surveys were collected, with 627 valid responses after discarding 16 incomplete ones. Stratified random sampling was employed to ensure representativeness, targeting at least 200 samples from each user category ( 41 ).
Data were collected from March to May 2024 using in-person surveys in offices and public areas such as food stalls and malls, using smartphones and the 123formbuilder platform. Respondents were randomly selected and screened for smartphone ownership, crucial for MaaS participation. Consent was obtained from authorities for in-office surveys. Surveyors were trained to administer the questionnaire accurately and verify workplaces using the Google Application Programming Interface. Respondents reviewed their answers before submission to ensure accuracy, and incomplete data were excluded from analysis.
Of note, while travel cost was explicitly varied in the SP design, this study did not differentiate between payment instruments (cash, Unified Payments Interface [UPI], card, or wallet). This choice was deliberate to keep the experiment tractable and because, in India, UPI has already become the most common mode for small daily payments, reducing the potential for strong bias related to payment method.
Survey Questionnaire
The survey questionnaire consisted of three main sections.
Socioeconomic characteristics: age (21–40, 40–60, above 60 years), gender (male, female, or other), monthly income (INR 0–INR 1,00,000) ( ≈ USD 0–USD 1,205); INR 1,00,000–INR 3,00,000 ( ≈ USD 1,205–USD 3,614); above INR 3,00,000 ( ≈ USD 3,614), and education level (higher than graduation: yes/no).
Travel characteristics of respondents: current travel time, travel cost, and mode of travel.
SP survey: 16 scenario cards where respondents selected their preferred MaaS attributes and values.
Result and Discussion
This section outlines primary data observations, presents results from statistical analysis, and offers a comprehensive discussion of the findings.
Socioeconomic Profile and Travel Characteristics of Respondents
Table 2 presents the descriptive statistics of the full sample, including gender, age group, income level, education, existing main mode of travel, and overall travel time and travel cost. The survey analyzed 627 valid responses, with 79.9% male participants, reflecting the lower female workforce participation in major Indian cities ( 40 ). Female underrepresentation may result from socioeconomic barriers, such as limited job opportunities, wage gaps, and balancing work with family responsibilities ( 40 ). However, once approached, women were equally as willing to participate in the survey as men. Therefore, the lower share of female respondents reflects actual workforce participation patterns in the study area, rather than approachability or willingness-to-respond bias. This finding is consistent with previous studies that document similar gender gaps in workforce participation in the MMR ( 42 ). Most respondents (54%) were aged 40–60 years, while those over 60 years were less than 2%, aligning with India’s labor force participation rates, where older individuals often retire or face health issues ( 43 ). While these distributions reflect the realities of the BKC workforce, it is important to acknowledge that the findings are most directly applicable to business districts or employment centers with similar socioeconomic and demographic compositions. Extrapolating to the wider urban population, particularly areas with more informal or gender-balanced workforces, should be performed with caution.
Descriptive Statistics of Socioeconomic and Travel Characteristics of Respondents
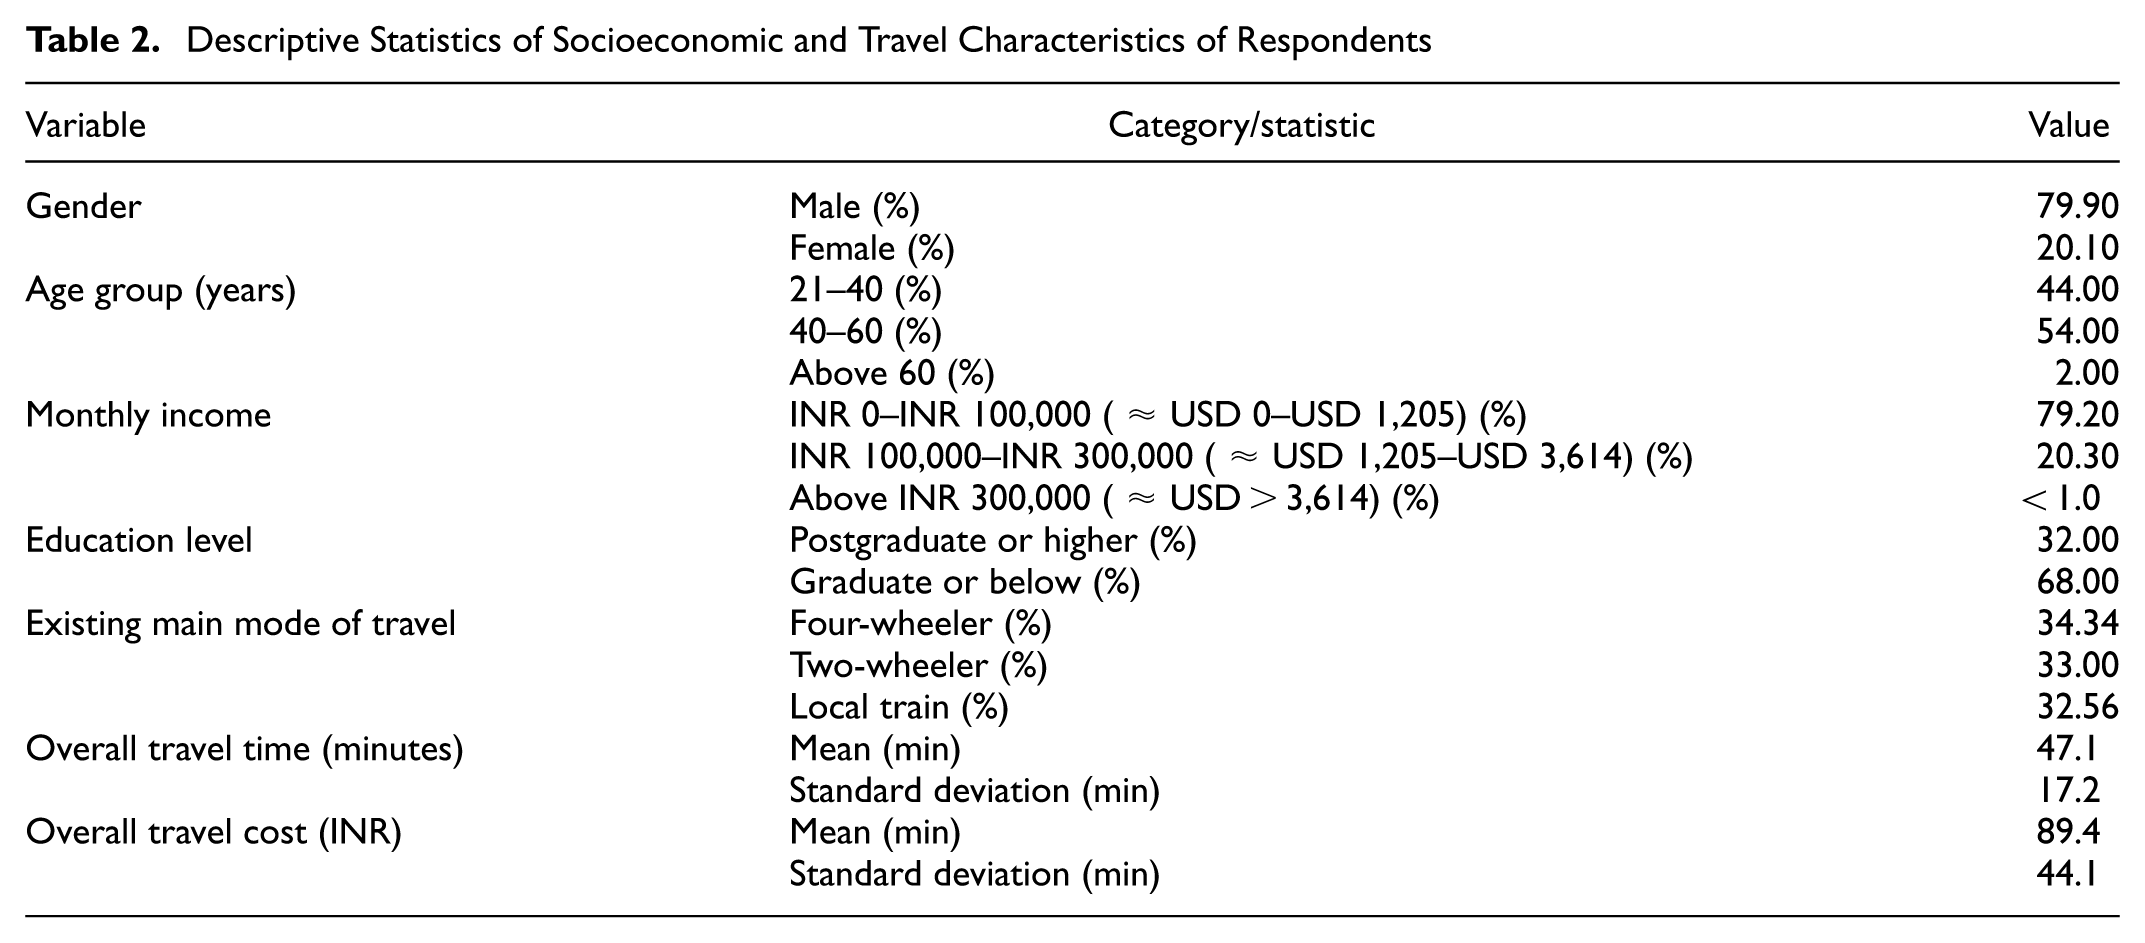
For income, 79% earned between INR 0 and INR 100,000, 20.3% earned between INR 100,000 and INR 300,000, and less than 1% earned above INR 300,000, mirroring India’s lower to middle-income workforce ( 44 ). In addition, 32% had postgraduate or higher education, consistent with higher education correlating with better job prospects and incomes ( 43 ). As discussed in before, to ensure representativeness, using stratified random sampling, participants were categorized by their transportation mode for work trips. After filtering, 627 responses included 216 (34.34%) four-wheeler users, 204 (32.56%) local train users, and 207 (33%) two-wheeler users. Table 3 gives the average travel time and cost for each mode.
Mean Travel Time, Standard Deviation for Travel Characteristics

Note: First-and-last-mile time and cost are included for local trains.
Local train users have the longest average travel time (57.1 min) with the least variability (standard deviation [SD] = 13.2), because of fixed schedules and dedicated tracks. Four-wheeler and two-wheeler users have shorter average times (44.9 and 39.2 min) but higher variability (SD = 19.5 and 18.1), probably from traffic congestion and route choices, common issues in urban areas ( 45 ). For travel costs, local train users have the lowest average cost at INR 38.8 (SD = 14.8), reflecting the subsidized nature of public transportation in India aimed at affordability ( 44 ). In contrast, four-wheeler users incur the highest costs, averaging INR 143.1 (SD = 53.2, because of expenses related to vehicle ownership, such as fuel, maintenance, and parking fees.
The travel time and cost patterns reveal trade-offs between convenience, cost, and reliability. Public transportation is more affordable but typically involves longer travel times and potential inconveniences like transfers and waiting periods. However, private vehicles offer more direct and potentially faster routes but come with higher costs and greater variability because of traffic conditions ( 45 ). These findings highlight the importance of considering the economic and practical factors when evaluating transportation options and developing policies to enhance urban mobility.
Although travel cost was a critical determinant, it is important to note that this study did not include payment method as a variable (e.g., card, UPI, or cash). In the Indian context, this omission is less problematic because the UPI has become the dominant mode of small-value digital payments, widely used for transport and daily transactions, reporting more than 21.7 billion UPI transactions in January 2026 alone ( 46 , 47 ). Therefore, card dependence is relatively low compared with other countries. In addition, some groups, such as older commuters or those with limited digital access, may still rely on cash. Therefore, this design focused on travel cost levels, and the findings remain valid. However, MaaS systems in India should combine UPI-based payments with options for cash-in or agent top-ups to ensure inclusivity.
Factors Influencing the Adoption of MaaS
The MNL and ECL models were developed using 10,659 observations (627 RP and 10,032 SP). Table 4 gives the model results.
Results Obtained from the MNL and ECL Models Developed Under the RUM and RRM Frameworks with Joint RP–SP Data to Assess the Factors Influencing the Adoption of MaaS

Note: MNL = multinomial logit model; ECL = error component logit; RUM = random utility maximization; RRM = random regret minimization; RP = revealed preferences; SP = stated preference; MaaS = Mobility as a service; BRT = bus rapid transit; 0 (fixed) indicates the reference category. - indicates estimated coefficients that were not statistically significant. ***p < 0.01.
Based on the model fit indices, the adjusted coefficient of determination (R2) is 0.303 for the RUM–MNL model, 0.302 for the RRM–MNL model, and 0.648 for the RUM–ECL model. The Akaike information criterion (AIC) values are 20,463.2 for RUM–MNL, 20,097.4 for RRM–MNL, and 10,311.5 for RUM–ECL. Similarly, the Bayesian information criterion (BIC) values are 20,547.3 for RUM–MNL, 20,181.3 for RRM–MNL, and 10,399.9 for RUM–ECL. In this study, the error terms for two of the mode choices, MaaS and two-wheelers, are correlated. Halton draws were utilized for the ECL model.
Models using the RUM framework outperformed the RRM models. The ECL model showed better fit indices (higher adjusted R2, lower AIC and BIC) compared with standard logit models. In addition, the scale factor from the ECL indicated similar variances between RP and SP data, suggesting the model accurately represents both preference types.
Of note, as given in Table 4, travel time appears with a negative coefficient in the RUM and RRM models. Coefficients under RUM and RRM are often expected to differ in sign because an undesirable attribute, such as travel time, typically reduces utility in RUM but increases regret in RRM; however, this is not always the case. In the RRM framework, regret is constructed by pairwise comparisons of attribute levels across alternatives; when an attribute is universally perceived as unfavorable, the estimated parameter may retain the same sign as in RUM. Therefore, the negative travel time coefficient under both frameworks here reflects a strong and uniform disutility of travel time across all alternatives in the data set. Similar outcomes for universally “bad” attributes (time or cost) have been reported in previous RUM/RRM applications ( 48 – 50 ).
The ECL model shows that increased travel time and cost negatively affect mode choice, aligning with the literature that higher time and costs deter new transportation mode adoption ( 51 ). This highlights the need for MaaS solutions to offer competitive travel times and costs. Similarly, more transfers, longer waiting times, and lower travel time reliability negatively affect MaaS adoption, indicating a preference for fewer transfers and higher reliability ( 52 ). This emphasizes the need for seamless and efficient transfers in MaaS.
Analyzing first-and-last-mile mode choices determined that shared cabs with two or three passengers and electric cycles with segregated lanes significantly influence MaaS adoption. Shared cabs have a stronger positive effect than electric cycles, probably because of safety concerns and regulatory issues with electric cycles in India ( 53 ). MaaS providers should prioritize shared cab services. Metro systems are preferred over bus rapid transit (BRT) because of dedicated lanes, higher speed and capacity, and better amenities within stations ( 54 ). This makes the metro a more attractive option within MaaS frameworks, emphasizing the importance of quality infrastructure, reliable service, and supplementary amenities.
In addition, gender did not significantly affect MaaS adoption, aligning with studies that show these factors are less influential than income and convenience ( 55 ). In developing countries such as India, income and technology access overshadow gender effect ( 12 ). Lower-income individuals (INR 0–INR 100,000) show a strong preference for MaaS because of cost savings and better infrastructure, such as air-conditioned cabs and efficient public transit ( 56 ). In contrast, higher-income groups (above INR 100,00) that often use cars are reluctant to switch to MaaS, valuing comfort and status over cost-effectiveness. This reluctance is supported by a negative correlation between car usage, higher education level (which can provide the potential for higher earnings), and MaaS adoption ( 57 ). Older individuals (40–60 years) prefer single-mode travel for simplicity and convenience, making them less inclined toward MaaS, which often involves multiple transfers ( 58 ). MaaS solutions should minimize transfers to attract older users.
Sensitivity Analysis
Sensitivity analysis was performed (as shown in Figure 3) to evaluate how marginal changes in key service attributes influence the probability of adopting MaaS for work trips. In this procedure, each explanatory variable was reduced by 1% from its sample mean, while maintaining all other variables constant. The probability of MaaS adoption was then recalculated using the estimated model parameters. The difference between the recalculated probability and the baseline probability represents the change in adoption likelihood associated with this marginal reduction in the respective attribute.

Sensitivity of key service attributes influencing Mobility as a Service (MaaS) adoption probability for work trips.
The results indicate that travel time has a notable influence on MaaS adoption. A reduction in travel time leads to an increase of approximately 0.17% in the probability of choosing MaaS. Similarly, a decrease in waiting time results in an increase of about 0.05% in the adoption probability. Improvements in travel time reliability also contribute positively to MaaS adoption, although the magnitude of the effect is comparatively smaller, with a corresponding increase of approximately 0.03% in the probability of selecting MaaS.
Estimating RR
The RR is the key to understanding travel demand. The VOT measures the monetary value of reducing travel time, while the VOR measures the value of improving travel time reliability ( 59 ). These values are derived using the marginal rate of substitution between travel time and travel cost for the VOT and between travel time reliability and travel cost for the VOR. The RR, the ratio of the VOR to VOT, indicates the relative importance of travel time reliability compared with travel time reduction. The equations for the VOT and VOR are given as,

and

where

This study estimates RR at 0.51 for work trips, indicating a higher priority on travel time reduction. In addition, several researchers have attempted to estimate the RR in varied regions. A summary of a few of such studies is given in Table 5.
Summary of Selected Studies on the Estimation of Reliability Ratio (RR)

Note: RP = revealed preference; SP = stated preference; GPS = Global Positioning System.
A comparison with other studies reveals significant variability in RR values across different regions and methodologies. For instance, De Jong et al. ( 60 ) reported an RR of 1.6 in The Netherlands using SP data, while Kouwenhoven et al. ( 61 ) found an RR of 0.70 in the same country using RP data. Similarly, Ehreke et al. ( 62 ) reported an RR of 1.00 in Germany using RP data, and Hossan et al. ( 63 ) found an RR of 1.19 in the US using the SP and RP data. These variations underscore the importance of context and methodology in estimating RR. The variability in RR values highlights the need for standardized methodologies to ensure comparability across different studies and regions.
Table 5 summarizes the RR values from various studies across different regions and data types, showing the wide range reported in the literature. This table highlights a significant gap in studies aiming to estimate RR in developing countries such as India. This gap underscores the importance of conducting more research in these regions to better understand the factors influencing travel time reliability and its valuation. The lack of studies in developing countries suggests a need for localized research to capture these regions’ unique travel behavior and preferences. The high RR in this study suggests transportation policies should focus on improving travel time and travel time reliability.
Policy Implications
This study highlights the need for equitable policies to promote MaaS, ensuring benefits across all socioeconomic groups. Key policy recommendations are discussed in the following sections.
Digital Divide
From a policy perspective, the findings suggest that the initial implementation of MaaS should target areas with a higher concentration of formal workforce and relatively stronger digital connectivity because these locations are more likely to adopt technology-enabled mobility solutions without significant barriers. Such a phased approach allows policymakers to build proof of concept in digitally ready regions while simultaneously working to enhance digital infrastructure and literacy in other parts of the city. This dual strategy of early MaaS adoption in tech-savvy areas alongside targeted efforts to reduce digital exclusion can create the foundation for scaling MaaS more inclusively across diverse socioeconomic groups.
Addressing Socioeconomic Barriers
Lower-income individuals (79% earning INR 0–INR 100,000) prefer MaaS for its cost savings and superior infrastructure, while higher-income groups favor private vehicles for comfort. Policymakers should offer targeted subsidies or fare reductions for low-income users to make MaaS more affordable. In addition, developing premium MaaS options can attract higher-income individuals. Aligning these initiatives with the Smart Cities Mission will ensure transportation solutions are accessible to all socioeconomic groups ( 67 ).
Designing for Older Users
Older individuals aged 40–60 years prefer single-mode travel for its simplicity, making them less likely to adopt MaaS with multiple transfers. MaaS solutions should minimize transfers and offer straightforward, single-mode options. Enhancing comfort with air-conditioned vehicles and easy access for those with mobility issues can increase appeal to older users.
Enhancing Travel Time and Cost Efficiency
Higher travel times and costs deter MaaS adoption. Policymakers should subsidize MaaS services to make them cost-competitive, such as reduced fares for frequent or low-income users. Investing in Intelligent Transportation Systems (ITS) can optimize routes and schedules, reduce travel times, and improve efficiency. For example, the Delhi Transportation Corporation has used ITS to enhance route efficiency and shorten travel times, making MaaS more attractive ( 68 ).
Reducing Waiting Time and Improving Travel Time Reliability
Long waiting and unreliable travel times discourage MaaS use. Establishing dedicated lanes for MaaS vehicles can reduce waiting times and enhance reliability by minimizing traffic delays. Developing integrated real time information systems with accurate wait times and travel updates can improve predictability. Pune Mahanagar Parivahan Mahamandal Limited upgraded its buses with ITS, significantly reducing waiting times and improving reliability, increasing user satisfaction ( 69 ).
Minimizing Transfers
Multiple transfers negatively affect MaaS adoption. Investing in seamless transfer infrastructure, such as well-designed transit hubs and a unified ticketing system, can simplify travel experiences. The Port Blair Smart City project successfully integrated various transportation modes, providing a seamless user experience ( 70 ).
Promoting Shared Mobility Options
Shared cabs with two or three passengers and electric cycles with segregated lanes significantly influence MaaS adoption. Policymakers should incentivize these options through tax breaks or subsidies and develop dedicated infrastructure for electric cycles. Beyond user convenience, pooled rides such as carpooling have been shown to deliver substantial carbon dioxide reductions in the Mumbai region, strengthening the argument for integrating pooled ride options into MaaS as a climate-positive strategy ( 71 ). Reduced dependence on privately owned vehicles may also align with broader circular economy and automotive sustainability goals in India, where end-of-life vehicle management remains an important policy challenge ( 72 ). Enhancing safety regulations and infrastructure, like the “Pink” initiatives in Uttar Pradesh, can address safety concerns and promote shared mobility.
Prioritizing Metro Systems Over BRT
Metro systems are preferred for their dedicated lanes, higher speeds, greater capacity, and better station amenities. Policymakers should expand metro networks to cover key areas and improve facilities at metro stations with retail outlets, food stalls, and comfortable waiting areas. The Delhi Metro illustrates how an extensive metro network combined with continuous enhancement of passenger amenities can strengthen the attractiveness of high-quality public transport options relevant to MaaS integration ( 73 ).
Promoting Equitable Transportation
Ensuring equitable access to transportation is crucial for low-income and historically excluded communities. Policymakers should engage these communities to understand their needs and design inclusive MaaS solutions. Aligning land use and transportation policies to support access to resources, such as affordable housing near transit-rich areas, can enhance MaaS accessibility for all users. Utilizing frameworks such as the Smart Cities Mission can help to integrate various transportation modes and promote inclusivity in urban mobility ( 67 , 70 ).
Inclusive Payment Systems
MaaS adoption depends on fare levels and on how payments are made. In India, UPI has achieved near-universal acceptance for small payments; therefore, MaaS platforms should integrate UPI as the default. In addition, policymakers should maintain cash-in or agent-assisted top-up facilities at metro or bus stations and through local retail networks. This ensures that riders who remain cash-dependent or digitally excluded are not left behind, supporting equitable access across socioeconomic groups.
Future Scope of Research
Future research can build on the strengths of this study by exploring several promising avenues. One potential direction is to conduct longitudinal studies that track MaaS adoption trends, allowing for the assessment of how changes in infrastructure, technology, and socioeconomic conditions influence user preferences and behaviors. In addition, expanding the geographical scope to include diverse urban and rural settings across India could provide a more nuanced understanding of regional variations in MaaS adoption. Incorporating qualitative methods, such as interviews and focus groups, would also enrich the quantitative findings by capturing the underlying motivations and barriers experienced by different user groups. This study does not explicitly capture the role of perceived safety during first-and-last-mile connectivity and transfers, which may significantly influence MaaS adoption in developing country contexts. In addition, the survey did not explicitly consider payment methods (card, UPI, wallet, or cash). This was outside the scope of this study; future work should treat the method of payment as an attribute in SP experiments. This is particularly relevant in peri-urban and low-income contexts where digital access is uneven. Including payment preferences would help to separate the effect of travel cost from potential barriers linked to fare media, and future research could examine whether reduced dependence on privately owned vehicles through MaaS aligns with broader circular economy and automotive sustainability goals in India, particularly in relation to end-of-life vehicle management ( 72 ). Future studies could explicitly model service attributes, such as air conditioning availability, cleanliness, and seat availability, because these factors are known to significantly influence mode choice in the Indian context.
In addition, future studies could investigate the effect of emerging technologies, such as artificial intelligence and machine learning, on the efficiency and personalization of MaaS offerings. Exploring the role of environmental factors and sustainability in MaaS adoption could also provide valuable insights, particularly in India’s growing focus on green transportation solutions. Finally, examining the interplay between MaaS and other modes of transportation, as well as the potential for multimodal integration, would further enhance the understanding of the role of MaaS in the broader transportation ecosystem. By pursuing these research directions, researchers can continue to advance the field and support the development of more effective and inclusive MaaS strategies.
Conclusions
This study investigated the adoption of MaaS for work trips in Mumbai, India, by combining RP data from 627 respondents. Using MNL and ECL models under RUM and RRM, the analysis identified the main factors influencing commuter choices. The results show that longer travel time, higher costs, more transfers, longer waiting times, and lower reliability all reduce the likelihood of MaaS adoption. Among these, minimizing transfers and reducing travel time are the most important. Lower-income commuters are more likely to adopt MaaS, while higher-income car users are less interested. Gender level was not significant, suggesting that practical and economic factors dominate. This study also found that commuters prefer shared cabs for first-and-last-mile connections and the metro as the main mode of travel. The estimated RR of 0.51 indicates that commuters place greater value on saving time than on improving reliability.
Beyond confirming findings from previous research, this study extends the literature by addressing socioeconomic and infrastructural challenges specific to a developing country. The integration of RP data, together with the use of ECL models, provides a more accurate representation of travel behavior and helps capture correlations between alternatives. However, the scope of this study is limited to one metropolitan business district and a largely formal workforce. Future research should include different urban and peri-urban settings, consider attributes such as safety and payment methods, and use longitudinal data to track adoption over time. These extensions would build on the results and support the design of inclusive, reliable, and affordable MaaS systems in emerging economies.
Footnotes
Acknowledgements
The authors would like to thank the editor and the five anonymous reviewers for their careful review of our manuscript and for their constructive feedback, which significantly improved the quality of this paper. The authors also acknowledge the Indian Institute of Technology Bombay, India, and Chalmers University of Technology, Sweden, for providing the necessary support and facilities to complete this work.
Author Contributions
The authors confirm contribution to the paper as follows: study conception and design: Aditya Saxena, Deepjyoti Das; data collection: Aditya Saxena; analysis and interpretation of results: Aditya Saxena, Deepjyoti Das; draft manuscript preparation: Aditya Saxena, Deepjyoti Das. All authors reviewed the results and approved the final version of the manuscript.
Declaration of Conflicting Interests
The authors declared no potential conflicts of interest with respect to the research, authorship, and/or publication of this article.
Funding
The authors received no financial support for the research, authorship, and/or publication of this article.

Data Accessibility Statement
All data necessary to support the findings of this study are provided within the paper. De-identified raw data (with all personal identifiers removed) will be made available by the authors on reasonable request.