
Abstract
The availability of ridehailing services, such as Uber and Lyft, affects the way people choose to travel and can enable travel opportunities that were previously suppressed, leading to additional trips. Previous studies have investigated the modal substitution and induced travel caused by ridehailing, yet few have investigated the factors associated with these travel behaviors. Accordingly, this study examines the personal and trip characteristics associated with ridehailing users’ decisions to substitute other modes of travel or conduct new trips by ridehailing. Using detailed survey data collected in three California metropolitan regions from 2018 and 2019, we estimated an error components logit model of ridehailing users’ choice of an alternative travel option if ridehailing services were unavailable. We found that over 50% of ridehailing trips in our sample were replacing more sustainable modes (i.e., public transit, active modes, and carpooling) or were creating new vehicle miles, with a 5.8% rate of induced travel, with public transit being the most frequently substituted mode. Respondents without a household vehicle and who use pooled services were more likely to replace transit. Longer-distance ridehailing trips were less likely to replace walking, biking, or transit trips. Respondents identifying as a racial or ethnic minority or lacking a household vehicle were least likely to cancel a trip were ridehailing unavailable, suggesting their use of ridehailing for essential rather than discretionary purposes. Together, these findings provide valuable insights for policy makers seeking to address the environmental and equity issues associated with ridehailing.
Ridehailing is the term for an on-demand transportation service provided by drivers of personal vehicles who are matched with passengers via an online platform. A ridehailing company or transportation network company (TNC), such as Uber and Lyft, owns the platform and provides a mobile app for drivers and passengers to access it. The seamlessness, convenience, and lower cost achieved through this innovative matching process have in turn contributed to the rapid growth of this industry. Ridehailing services account for as much as 15% of weekly vehicle trips in cities such as San Francisco as of 2017 ( 1 ).
The growth of ridehailing creates both challenges and opportunities for the urban areas where TNCs mostly operate, particularly in relation to mode substitution and complementarity. Proponents of ridehailing claim several benefits could be derived if most people shared rides instead of driving their own cars, including energy savings, less space being devoted to parking, and lower levels of pollutants and greenhouse gas (GHG) emissions ( 2 ). A pooled ridehailing service, such as UberX Share, enables multiple unrelated passengers to share occupancy of a ridehailing vehicle if they are all successfully matched with the driver. Some studies have also found that ridehailing complements public transit by providing a first-mile/last-mile mode to bus and rail travelers ( 3 ). On the other hand, there is evidence that the existence of ridehailing has tended to decrease transit ridership in the United States ( 4 ). A drop in transit ridership in favor of ridehailing will increase vehicle miles traveled (VMT) and decrease revenue for transit companies, which may lead to a cycle of decline in transit services. Although there are multiple results on the rates of substitution of ridehailing for other modes in various cities, relatively few previous studies have modeled the effects of people’s personal traits or the kinds of trip they make on the mode substitution of ridehailing.
Ridehailing provides the convenient door-to-door mobility of car travel without needing to own a car and, compared with traditional taxi trips, ridehailing trips can have much shorter waiting times ( 5 ). Therefore, this relatively new mode may provide people with more travel opportunities and motivate trips that would not have occurred were ridehailing not available, that is, induced travel. Compared with other types of shared mobility, Jiao et al. found that the use of a ridehailing app was associated with more daily trips by respondents of the 2017 National Household Travel Survey (NHTS) ( 6 ). Most studies that have investigated induced travel of ridehailing have been limited to a descriptive statistical analysis and there has been little research into the factors that influence induced travel of ridehailing.
The purpose of the present study was to uncover the personal and trip characteristics associated with ridehailing users’ decisions to substitute other modes of travel or conduct entirely new trips using ridehailing. To this end, we designed a model of ridehailing users’ choice of an alternative travel option were ridehailing not available. We estimated this model on survey data collected in three metropolitan regions of California via a GPS-enabled travel diary app. Our unique data set captured the daily trip records and sociodemographic characteristics of a large, random sample of ridehailing users, and enabled us to overcome some of the limitations of previous studies on modal substitution and induced travel of ridehailing.
Literature Review
Multiple studies have investigated the alternative travel options that riders would choose if ridehailing services were not available. In doing so, such studies have revealed the rate of substitution of ridehailing for other transport modes, and the occurrence of induced travel, that is, travel that would not have occurred without the availability of ridehailing. Induced travel of ridehailing implies an increase in VMT and the associated contributions to congestion, energy use, and GHG emissions. On the other hand, induced travel can also mean (and, to some extent, is the result of) enhanced mobility and more ensuing opportunities for communities with poor access to other modes. Modal substitution may also be beneficial if, for example, pooled ridehailing trips replace single-occupancy private car trips ( 7 )—assuming that the additional deadheading to pick up and drop off passengers does not lead to an increase in VMT with the pooled ridehailing option—but is more often found to be detrimental as ridehailing drains passengers from more sustainable modes such as public transit ( 8 , 9 ). In this section, we review the literature on the patterns of mode substitution and induced travel of ridehailing.
Patterns of Substitution of Ridehailing for Other Travel Options
In his international review of studies about the effects of ridehailing on sustainability and travel behavior, Tirachini found that the three modes most often replaced by ridehailing are taxis, public transit, and private cars ( 10 ). Multiple international studies have reported induced travel rates for ridehailing of between 5% and 7% (5, 11–14), whereas other studies have reported rates as high as 12.2% ( 15 ) and as low as 0.4% ( 16 ).
Two studies based in the United States directly compared the modal substitution patterns of car owners and nonowners ( 5 , 17 ). Both studies—one based in San Francisco, the other in Chicago—found that car owners were more likely to have replaced a private car or taxi trip with ridehailing than nonowners, who in turn were more likely to have replaced a public transit trip. Rayle et al. reported a lower bound of 8% on the induced travel rate in San Francisco ( 5 ), whereas Mahmoudifard et al. did not investigate induced travel in Chicago ( 17 ).
Alemi et al. analyzed the responses to a 2015 survey of Millennials (aged 18 to 34) and members of Generation X (aged 35 to 50) in six regions of California to understand the factors affecting ridehailing use among those groups ( 11 ). Most people in both age categories reported that they would have taken a taxi if ridehailing services had not been available for their last trip made with Uber or Lyft. Millennials were more likely to have replaced public transit and active travel than members of Generation X, who in turn would have been more likely to get a ride from someone else were ridehailing not available. Millennials were found to have a slightly higher rate of induced travel at 9.2% than Generation Xers at 7%.
The results from two other survey studies indicate that ridehailing probably increases VMT in major cities. Among ridehailing users in a 2016 survey of residents in seven metropolitan areas in the United States, Clewlow and Mishra estimated between 49% and 61% would have made fewer trips or would have traveled by walking, biking, or public transit were ridehailing services not available ( 18 ). Notably, a plurality (22%) of respondents confirmed that they would make fewer trips, which once again alludes to the presence of induced demand. In the Greater Boston region, most respondents (59%) in an intercept survey of ridehailing passengers would have used public transit, active modes, or would not have made their present trip were ridehailing service not available ( 12 ).
To summarize, most studies have found significant substitution rates of ridehailing for more sustainable modes and, when investigated, further found that a notable portion of ridehailing trips would not have taken place if this mode had not been available. In this study, we explore the factors that influence which modes people replace with ridehailing and examine the user and trip characteristics associated with induced travel of ridehailing. We now turn to what has already been written on these questions.
Factors Influencing the Substitution of Ridehailing for Other Travel Options
A few studies in different parts of the world have investigated the factors that affect modal substitution and induced travel of ridehailing. Some of these studies have discovered significant results on the substitution of ridehailing for transit and active modes. Based on a survey of commuters in the Dallas-Fort Worth Metropolitan Area, Lavieri and Bhat found people under 65 to be more likely to substitute ridehailing for active travel and transit than their older counterparts ( 13 ). A common pattern of lower household income being associated with a higher probability of substituting ridehailing for transit trips was found in Chicago ( 17 ), Boston ( 12 ), and a study covering 10 cities across China ( 16 ). Based on this finding, some have recommended policies to reduce the cost of ridehailing for lower-income people who may depend on the services for mobility ( 12 ). Mahmoudifard et al. found the number of bus stops at a trip’s origin and destination to be positively associated with the choice of a bus ride if ridehailing services were not available in Chicago ( 17 ). Similarly, people in Boston who live near a rapid transit station were more likely to choose an active or transit mode than a vehicle-based mode if ridehailing services were not available ( 12 ). These findings suggest that introducing ridehailing to a transit-accessible area may attract people away from more sustainable travel options. On the other hand, the lack of public transit services is shown to be a strong motivation for people to use ridehailing services rather than walking or biking in China ( 16 ). Furthermore, there is evidence that ridehailing affects the use of bus and rail differently. In major Chinese cities, Tang et al. claim that the supply of bus routes cannot meet demand, which leads some travelers to opt for ridehailing services instead ( 16 ). In contrast, they found that trips on longer metro routes were less likely to be replaced by ridehailing.
In relation to the substitution of ridehailing for private car and taxi travel, there are conflicting results on the effects of the trip duration and parking issues. Gehrke et al. found that longer trips, which they identified by a higher ridehailing fare, predicted the replacement of vehicle-based trips in Boston ( 12 ). On the contrary, shorter trips predicted the replacement of taxi trips in studies in Lebanon ( 19 ) and China ( 16 ). Furthermore, whereas Tang et al. found parking issues to be a major factor in the replacement of private car trips ( 16 ), Tarabay and Abou-Zeid claimed that drivers in their study were not very sensitive to increases in the cost or search time for parking ( 19 ). However, the latter authors did conclude that more expensive and difficult parking may make people more sensitive to reductions in ridehailing fares.
Only a handful of studies have examined the factors affecting the induced travel of ridehailing. Gehrke et al. found that the possession of a transit pass, the use of pooled ridehailing services, and a high per capita employment at one’s home location predicted induced travel by ridehailing in Boston ( 12 ). This they believe, is because transit pass holders are more likely to rely on transit and would have limited access to destinations outside the transit network were ridehailing not available. The lower cost of pooled rides may also entice some segments of the population to partake in trips that they may elsewise not have undertaken. Lavieri and Bhat found that urban and suburban residence, as opposed to rural, and a household with a high likelihood of vehicle availability best predicted induced travel by ridehailing in the Dallas-Fort Worth Metropolitan Area ( 13 ). They further found that induced trips by ridehailing were more likely to be single-occupancy ( 13 ).
Previous studies of the factors influencing modal substitution and induced travel caused by ridehailing have been limited by a paucity of available and reliable data. Several of these studies have had to rely on convenience samples of intercepted ridehailing users ( 12 , 17 ), students ( 19 ), or mailing list users ( 13 ). In contrast, our study is based on a large, random sample of the general population in three metropolitan regions in the state of California, which improves the generalizability of the results. Some previous studies also limited the scope of their research to recreational trips ( 19 ), or trips by frequent ridehailing users ( 16 ). Studies that have gone beyond a descriptive analysis of induced travel have mainly restricted their analysis to home-based ridehailing trips ( 12 ) and trips made by commuters ( 13 ). The present study contributes to the literature by analyzing data from a large travel survey of ridehailing users (of varying intensity) and nonusers to investigate the factors that influence induced travel by ridehailing for various trip purposes. Finally, our analysis benefits from the use of a panel data set, unlike some previous studies ( 12 , 13 , 17 ), which enabled us to control for variation in the behavior of an individual over time. Whereas Tarabay and Abou-Zeid also analyzed panel data in the form of responses to stated preference questions ( 19 ), we analyzed revealed preference data that describe the attributes and context of real ridehailing trips.
Materials and Methods
Data
We analyzed data from a travel diary survey of residents in three metropolitan areas of California: the San Francisco Bay Area, San Diego, and the Los Angeles and Orange counties in the Los Angeles metro region. Resource Systems Group Inc. (RSG) designed and implemented the survey in collaboration with the metropolitan planning organizations in those regions: the Metropolitan Transportation Commission and San Francisco Country Transportation Authority (MTC/SFCTA), the San Diego Association of Governments (SANDAG), and the Southern California Association of Governments (SCAG).
RSG used a probability sampling framework with oversampling of likely ridehailing users in each region. Households in the three regions were sampled using address-based sampling stratified by census block group. They oversampled ridehailing users by stratifying census block groups based on the expected average intensity of ridehailing per household and inviting a higher percentage of households from block groups with more predicted ridehailing trips. The full data set consists of over 40,000 person-days of travel between November 2018 and November 2019, as well as data on the survey respondents and their households. Each respondent used the rMove™ application to passively record their travel behavior, manually edit trips, and complete questionnaires over a 7-day period. Throughout the survey, 2,532 respondents recorded a total of 7,857 ridehailing trips in the SCAG, MTC/SFCTA, and SANDAG regions, which are the focus of this paper. Ridehailing trips were identified by responses to a question in the questionnaire presented to survey participants after each trip, which asked, “How did you travel?” and provided a list of modes to select from. A trip was identified as a ridehailing trip if ridehailing was one of the first three modes selected from the list. For further information on the survey or the data collection process, please refer to Bradley et al. ( 20 ).
After receiving the data, we performed an exploratory data analysis, which revealed some remaining issues with the quality of trip records. Through our inspection of the distributions of trip characteristics, we observed trip records with exceedingly large or small distances, durations, and estimated vehicle speeds. Multiple explanations exist for these likely erroneous trip data based on the performance of the rMove application. One example is the rMove application failing to register the end of a trip and including the dwell time of the traveler at their destination in the trip duration. We first removed trips with a distance of 50 miles or greater, which comprised only 0.3% of all trips. We then identified and removed potential outlier trip records based on the test proposed by Tukey: having an average trip speed or trip duration, log-transformed to the base 10, outside 1.5 times the interquartile range below the first quartile or above the third quartile ( 21 ). Finally, we removed trip records with missing values for the dependent or explanatory variables of our model, which are described in the next section. After data cleaning, we retained 7,333 ridehailing trips by 2,458 respondents.
Table 1 lists the descriptive statistics of the full sample of individuals in the MTC/SFCTA, SANDAG, and SCAG regions, and the subset of ridehailing users retained by the data cleaning process for several sociodemographic attributes. For individuals with missing demographic data, RSG imputed income, gender, race, and ethnicity, which are included in Table 1. RSG imputed income by generating predictions from an ordered logit model that was estimated on cases with complete income data. Individuals who did not report gender were randomly assigned male or female based on the gender distribution in their age category. Similarly, those with missing data on race or ethnicity were randomly assigned to a racial or ethnic group based on the distribution within their residence block group. We assigned the 209 individuals who identified with more than one race or ethnicity to one of five groups. There were very small sample sizes of other underrepresented racial and ethnic groups, which we considered collectively as “Other race or ethnicity.”
Sociodemographic Characteristics of the Full Sample and Ridehailing Users
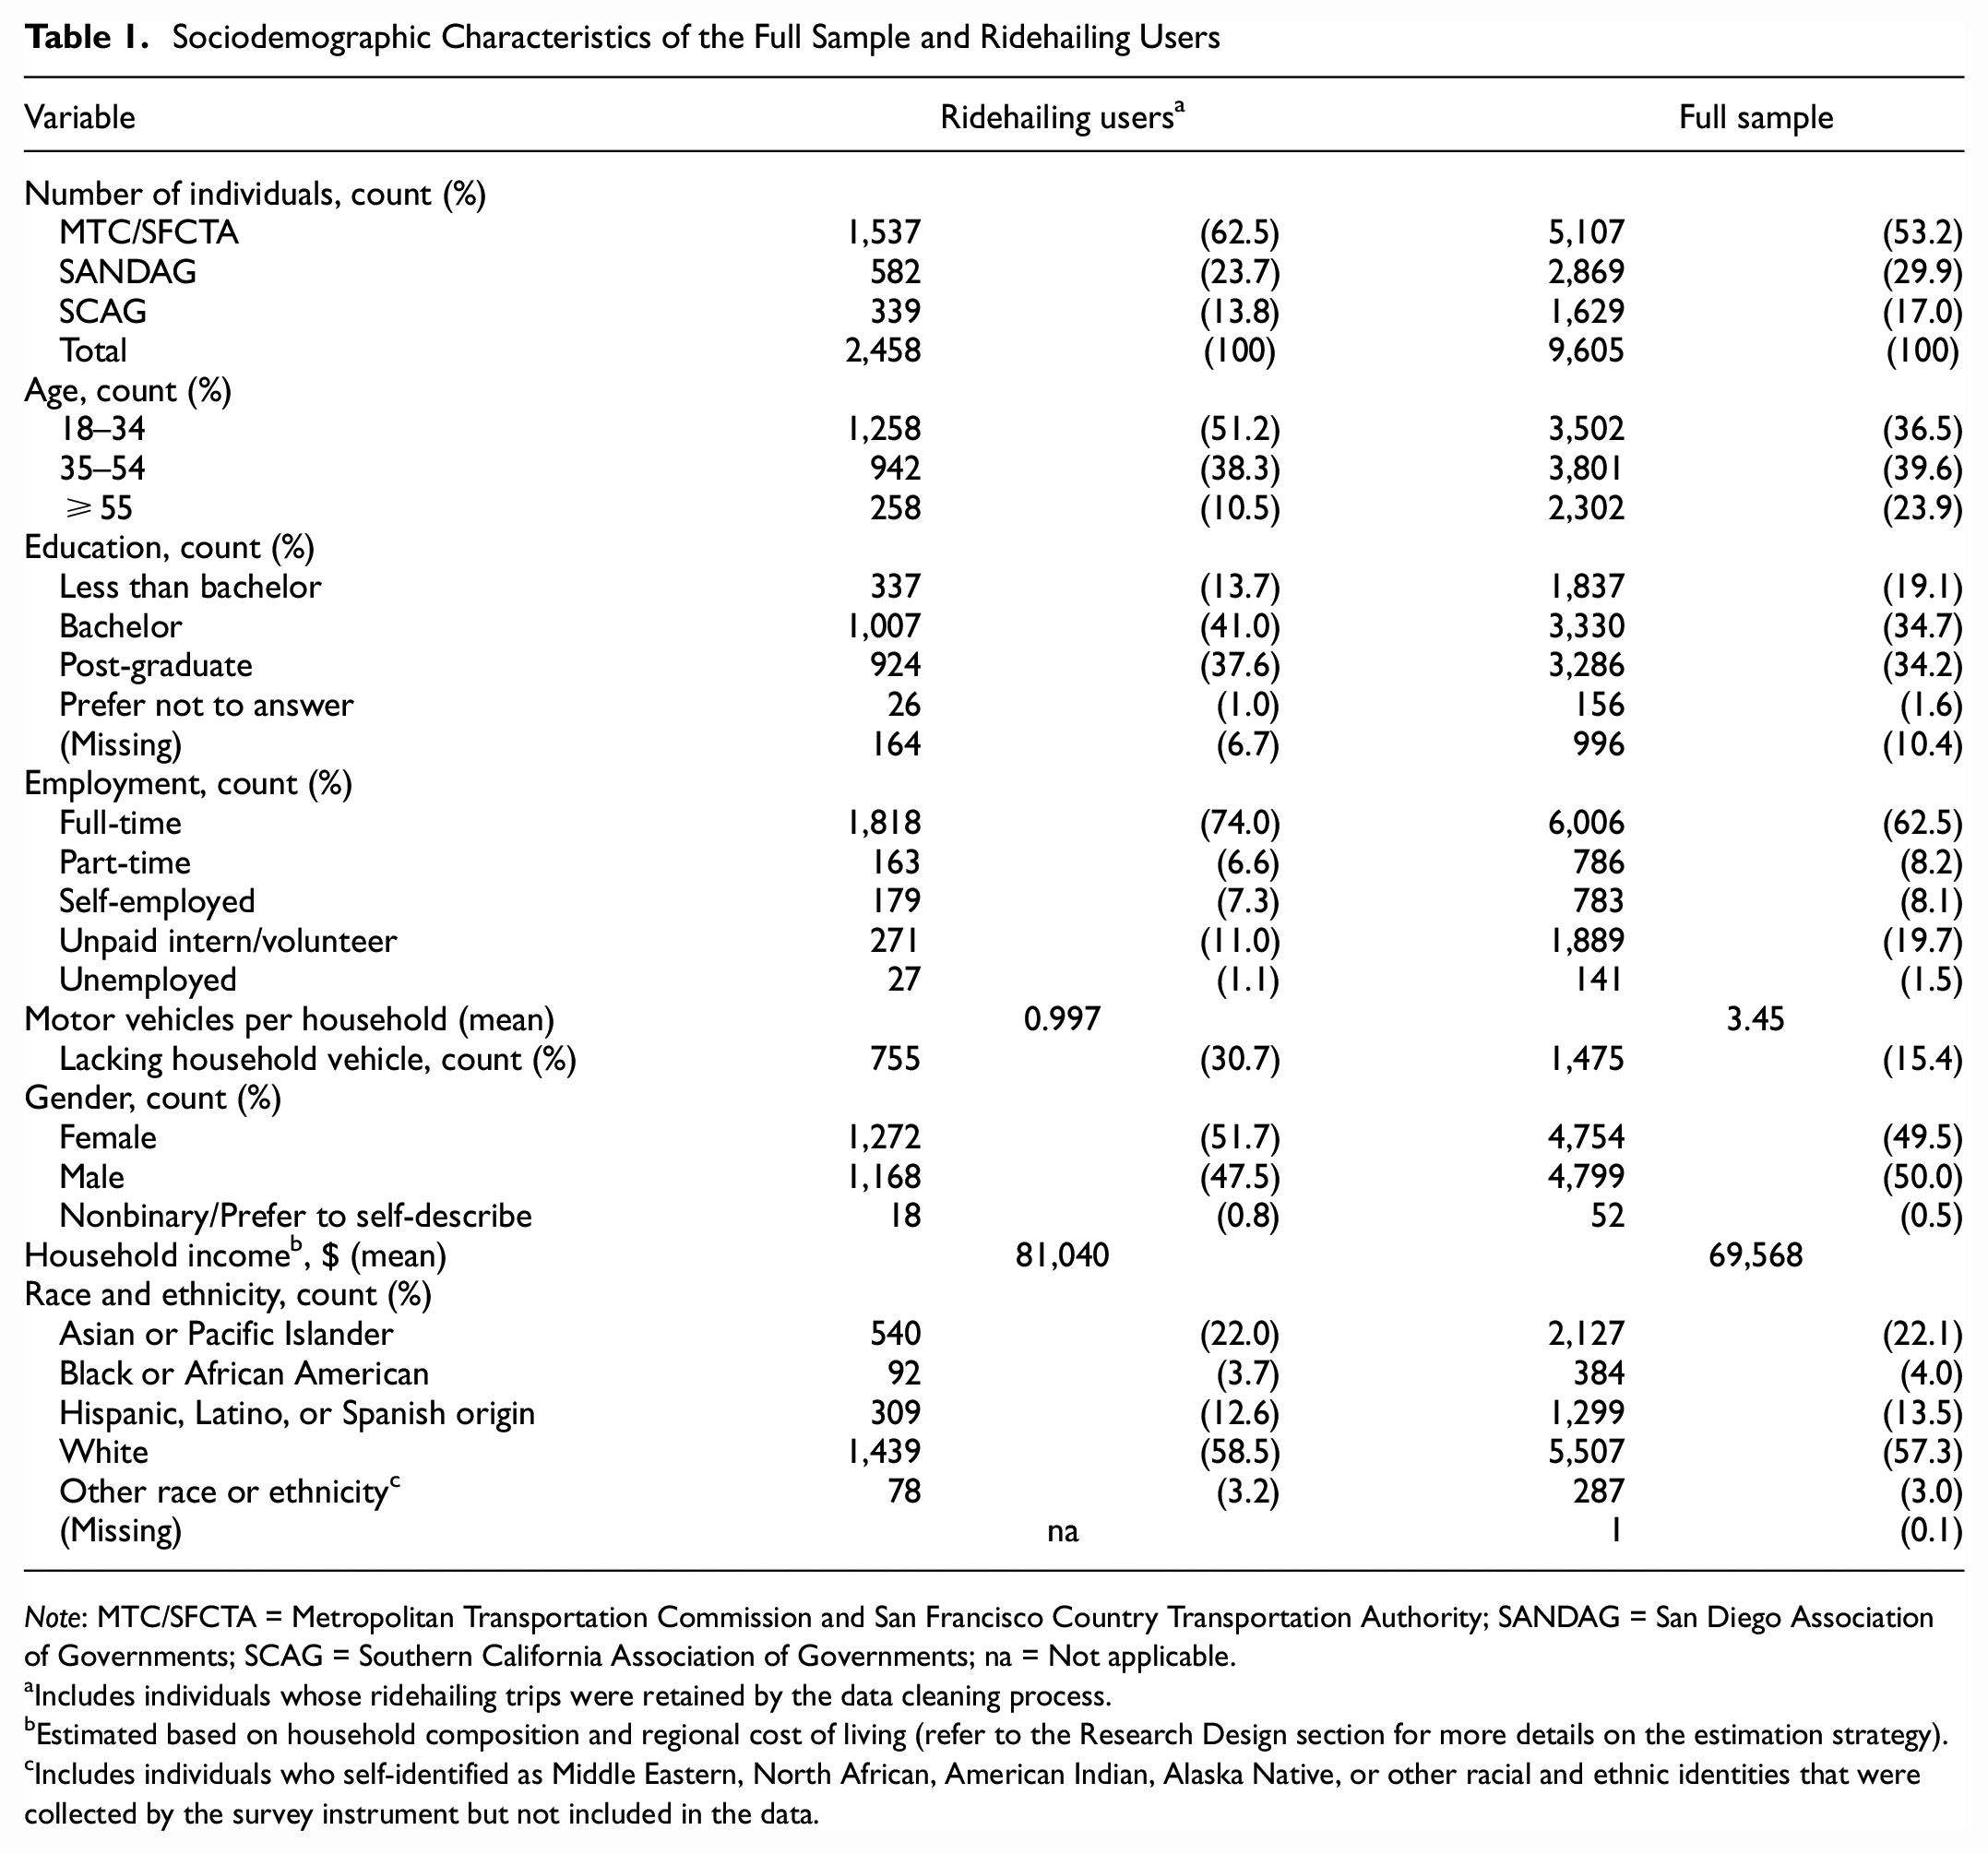
Note: MTC/SFCTA = Metropolitan Transportation Commission and San Francisco Country Transportation Authority; SANDAG = San Diego Association of Governments; SCAG = Southern California Association of Governments; na = Not applicable.
Includes individuals whose ridehailing trips were retained by the data cleaning process.
Estimated based on household composition and regional cost of living (refer to the Research Design section for more details on the estimation strategy).
Includes individuals who self-identified as Middle Eastern, North African, American Indian, Alaska Native, or other racial and ethnic identities that were collected by the survey instrument but not included in the data.
Our subsample of ridehailing users was mostly young and highly educated with a slight majority of women, similar to the sample of California residents studied by Alemi et al. ( 11 ). The mean household income of our subsample of ridehailing users was greater than the mean of the full sample. Alemi et al. also found that a greater proportion of ridehailing users in California had a high household income ( 11 ). The mean number of household vehicles was much lower among our subsample of ridehailing users than the full sample, and the percentage of ridehailing users lacking a household vehicle was much larger than the corresponding percentage in the full sample. Full-time employees and residents of the MTC/SFCTA region had even greater representation in our subsample of ridehailing users than in the full sample. The distributions of race and ethnicity were very similar between our subsample of ridehailing users and the full sample.
Research Design
The objective of this study was to understand the factors that influence the substitution of ridehailing for other travel options. To this end, we defined a model of the choice among various alternative transport modes, including no longer conducting the trip if ridehailing was unavailable. The choice of an alternative travel option depends on multiple characteristics of the decision maker and the trip. The following paragraphs describe our choice set and explanatory variables and specify the discrete choice model. We estimated an error components logit model to capture the correlation across choices for the same respondent in our panel data set.
Choice Set
Our data set contained ridehailing users’ responses to the question: “If Uber, Lyft, or similar services did not exist at all, how would you have made this trip?” From the categorical response variable, we created an initial choice set of eight alternatives: private car, carpool, taxi, active travel (biking/walking), transit, no travel, different destination, and a general category for options that were not enumerated in the survey. However, owing to small group sizes, we grouped the latter two alternatives together to create a choice set of seven items.
Explanatory Variables
Equation 1 shows the specification of the observed utility of alternative j for individual i and trip t.
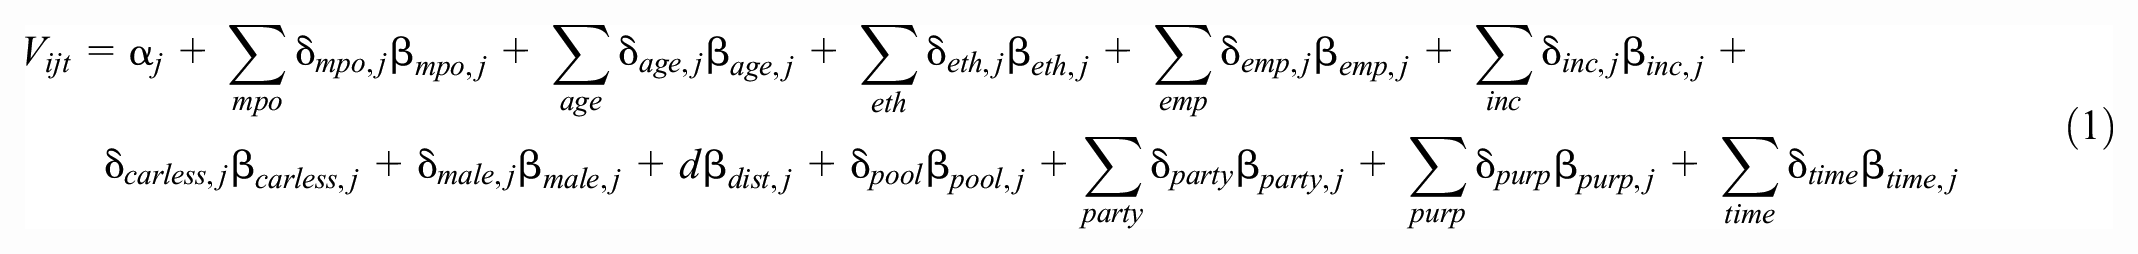
Table 2 describes the explanatory variables and, for categorical variables with dummy encoding, provides the reference case specification. We included multiple personal characteristics of the ridehailing users as well as trip characteristics in our model. Some variables require additional discussion. With regard to age, individuals under 18 are not allowed to order a ridehailing service and were therefore excluded from our study. We calculated the adjusted household income based on household composition, according to the U.S. Census Bureau equivalence scale ( 22 ), and regional cost of living based on the Bureau of Economic Analysis Price Parity Index ( 23 ). Our data set consisted of people who identify as female, male, and nonbinary (or prefer to self-describe), the latter of which accounted for less than 1% of respondents. We did not include education because of the prevalence of missing data, which RSG did not impute values for, as shown in Table 1.
Descriptions of the Explanatory Variables and Reference Case Specifications
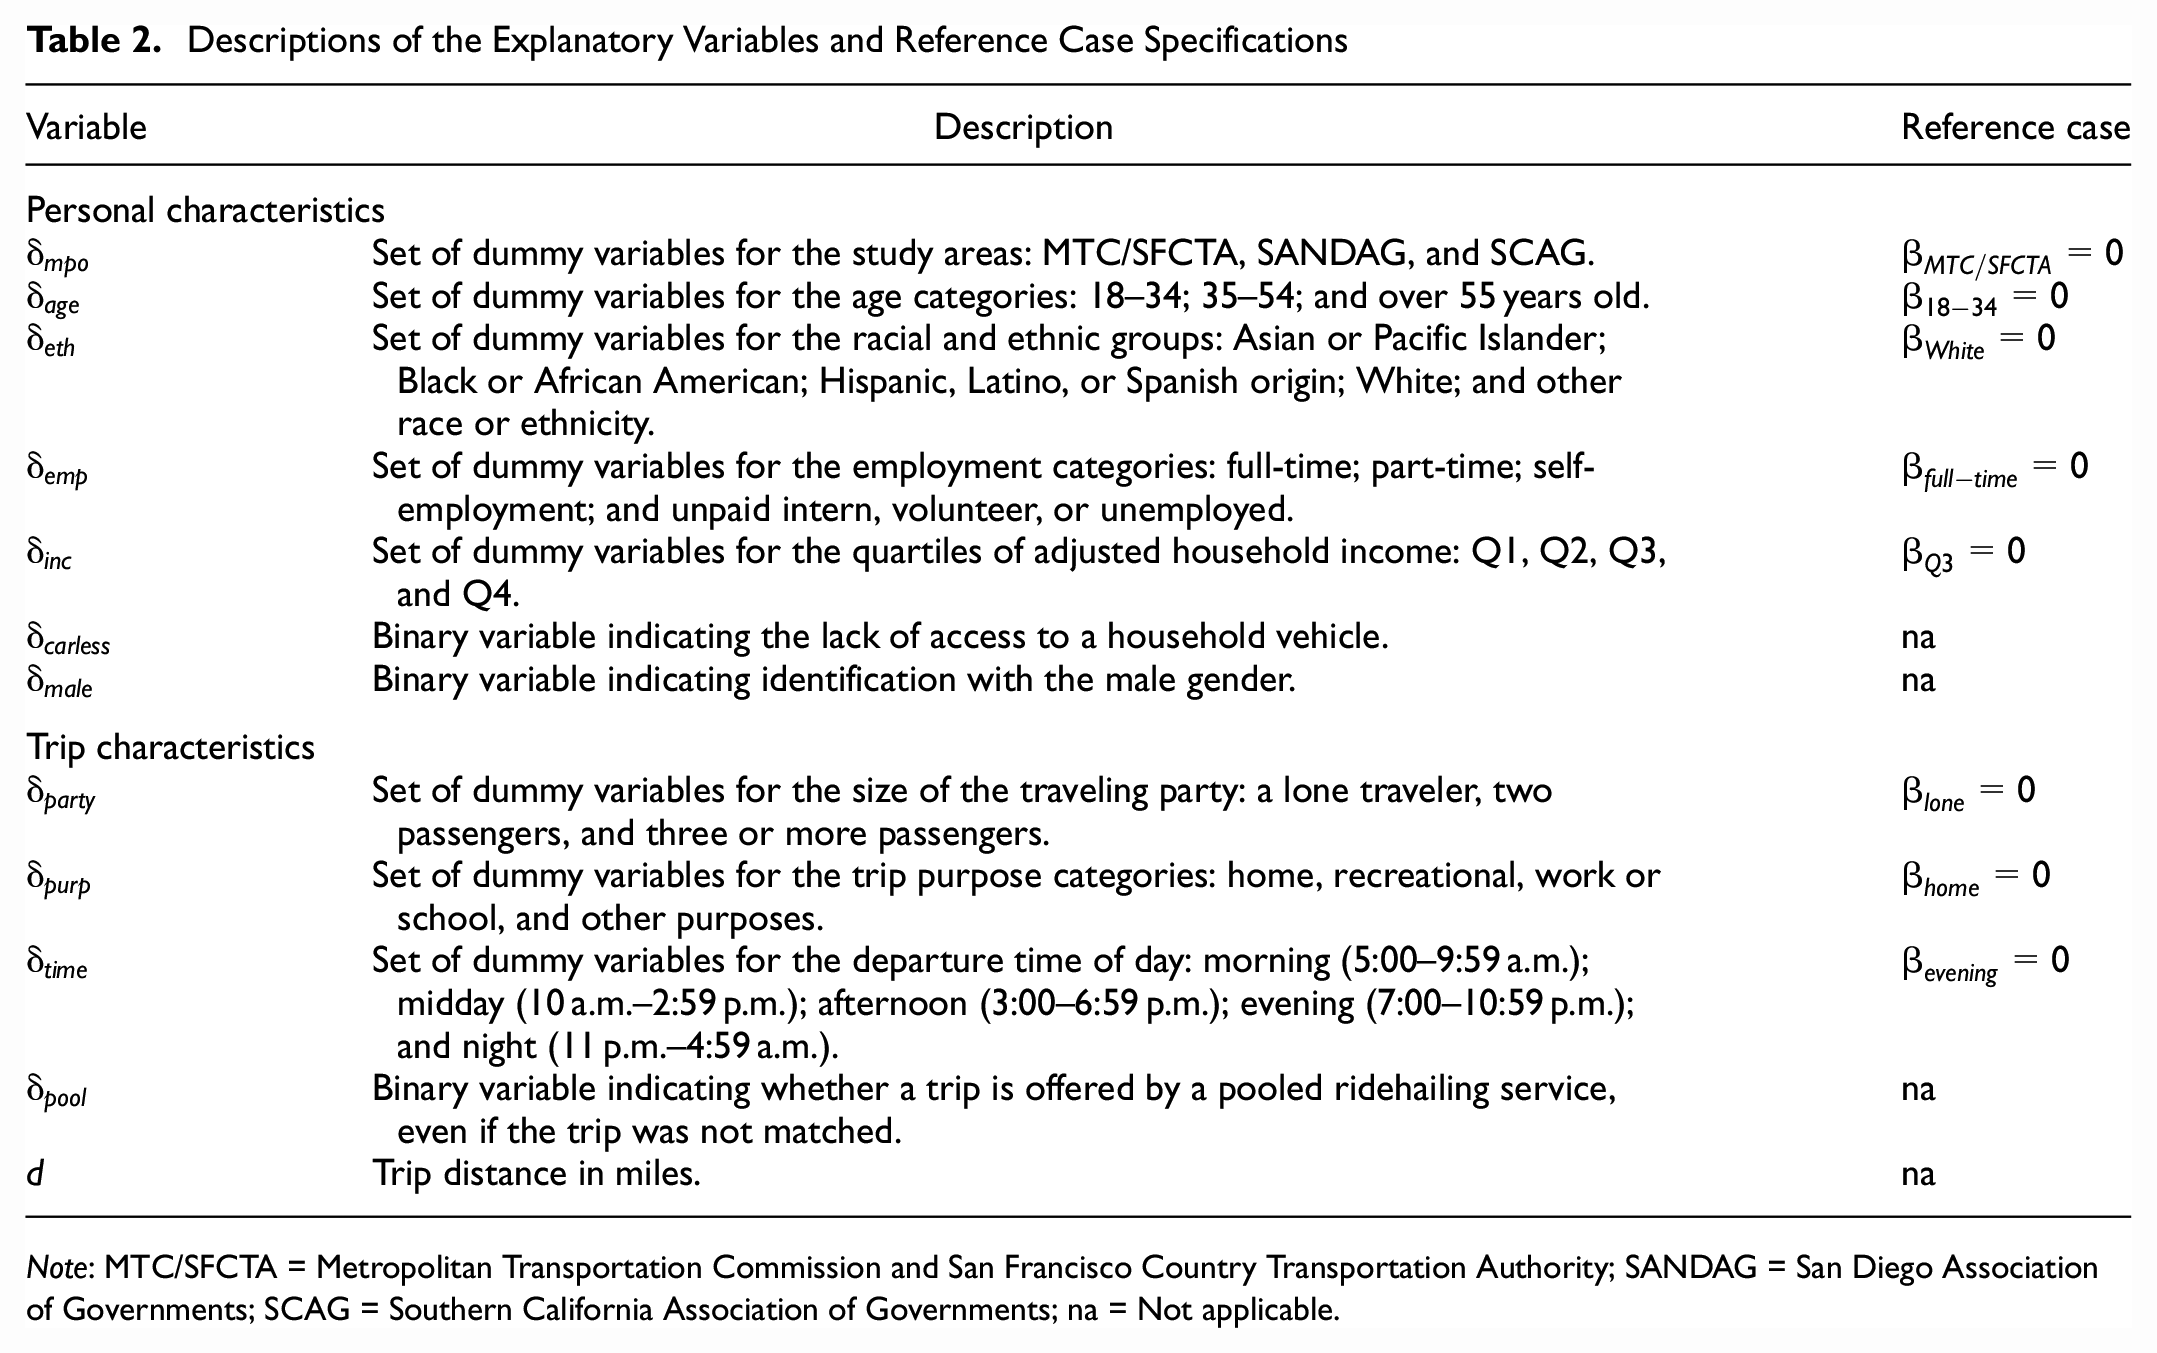
Note: MTC/SFCTA = Metropolitan Transportation Commission and San Francisco Country Transportation Authority; SANDAG = San Diego Association of Governments; SCAG = Southern California Association of Governments; na = Not applicable.
In relation to trip purpose, recreational trips, home trips, and trips to work or school comprised the majority of ridehailing trips in our data set. Therefore, we grouped trips for changing mode, errands, escorting others, and shopping into a single “other” category. Finally, we created alternative-specific constants (ASCs),
Discrete Choice Model
We specified an error components logit model of the choice between alternative travel options for a ridehailing trip, were the ridehailing service not available, following the approach of Hess et al. ( 24 ). The utility of alternative j for trip t of individual i is specified as follows:

where
Let

where
To account for repeated choice observations of the same individuals, we performed the integration over the error components at the individual level, which in turn facilitated correlation across observations.
We estimated the error components logit model specified above using a simulated maximum likelihood estimation with 100 MLHS (modified Latin hypercube sampling) draws, as suggested by Hess et al. for the error components ( 25 ). We did not systematically test the results of using different numbers of draws. The model estimation was carried out using the R Apollo package ( 26 , 27 ).
Results
Figure 1 shows the choice frequencies of the alternative travel options in our choice set, were ridehailing unavailable. Out of the 7,333 ridehailing trips in our sample, we observed a 5.8% rate of induced travel. Among trips that would have occurred regardless of whether ridehailing was available, the most substituted modes were transit, taxi, and private car, respectively. These results matched the general trend in the literature on modal substitution and induced travel of ridehailing ( 10 ). Active travel was the next most substituted mode, followed by carpooling, whereas other modes/different destination comprised the smallest percentage of responses. When considered conjointly, we found that over 50% of ridehailing trips were replacing more sustainable modes (i.e., transit, active mode, and carpooling) or creating new VMT, which strongly suggests that this new form of travel may be responsible for an increase in transportation-related GHG emissions.
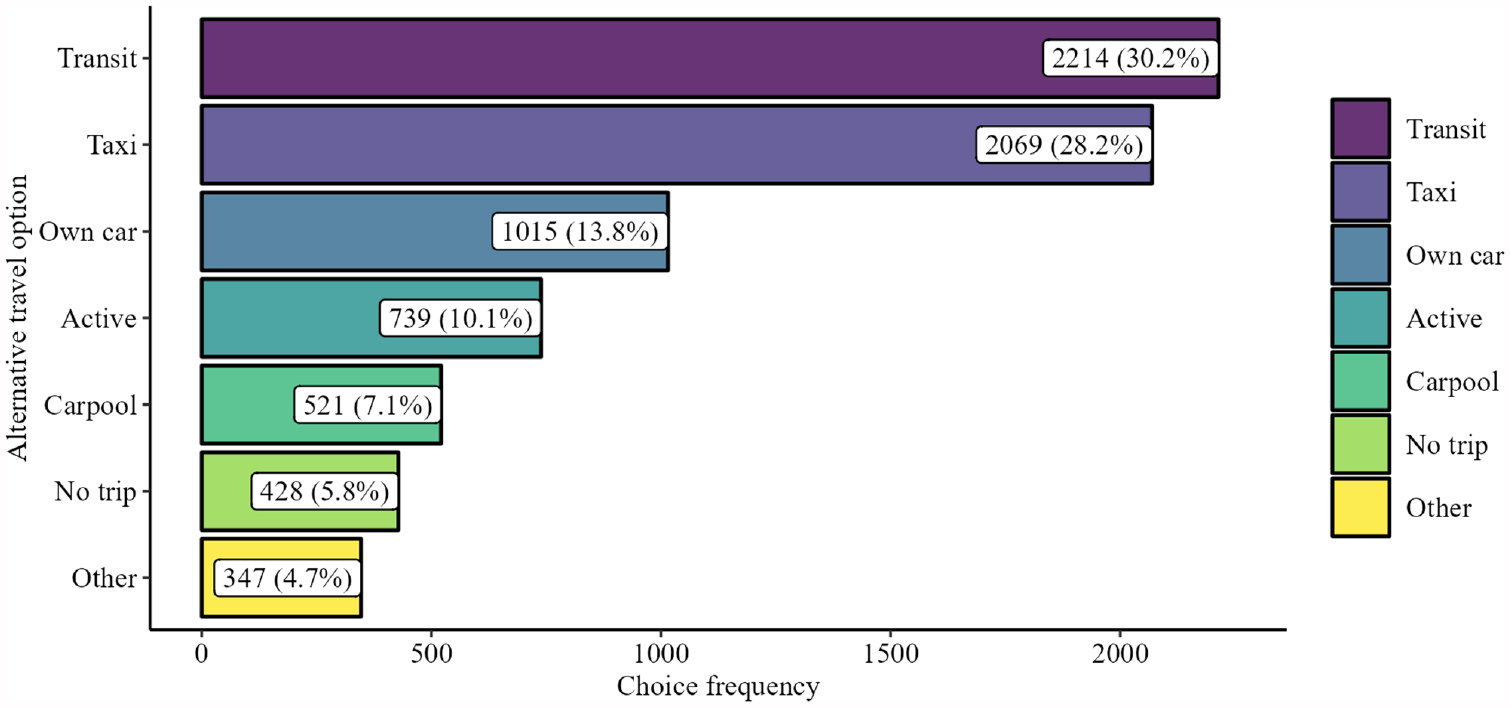
Choice frequencies of alternative travel options were ridehailing unavailable.
Table 3 presents the parameter estimates of the error components logit model and the model fit results. Our model has an adjusted McFadden’s ρ 2 value relative to a null model of 0.3387. In the remainder of this section, we review the effects of personal and trip characteristics on mode substitution and induced travel of ridehailing, respectively.
Parameter Estimates (β) and Results of Error Components Logit Model, Using Robust Standard Errors (SE) and P-Values
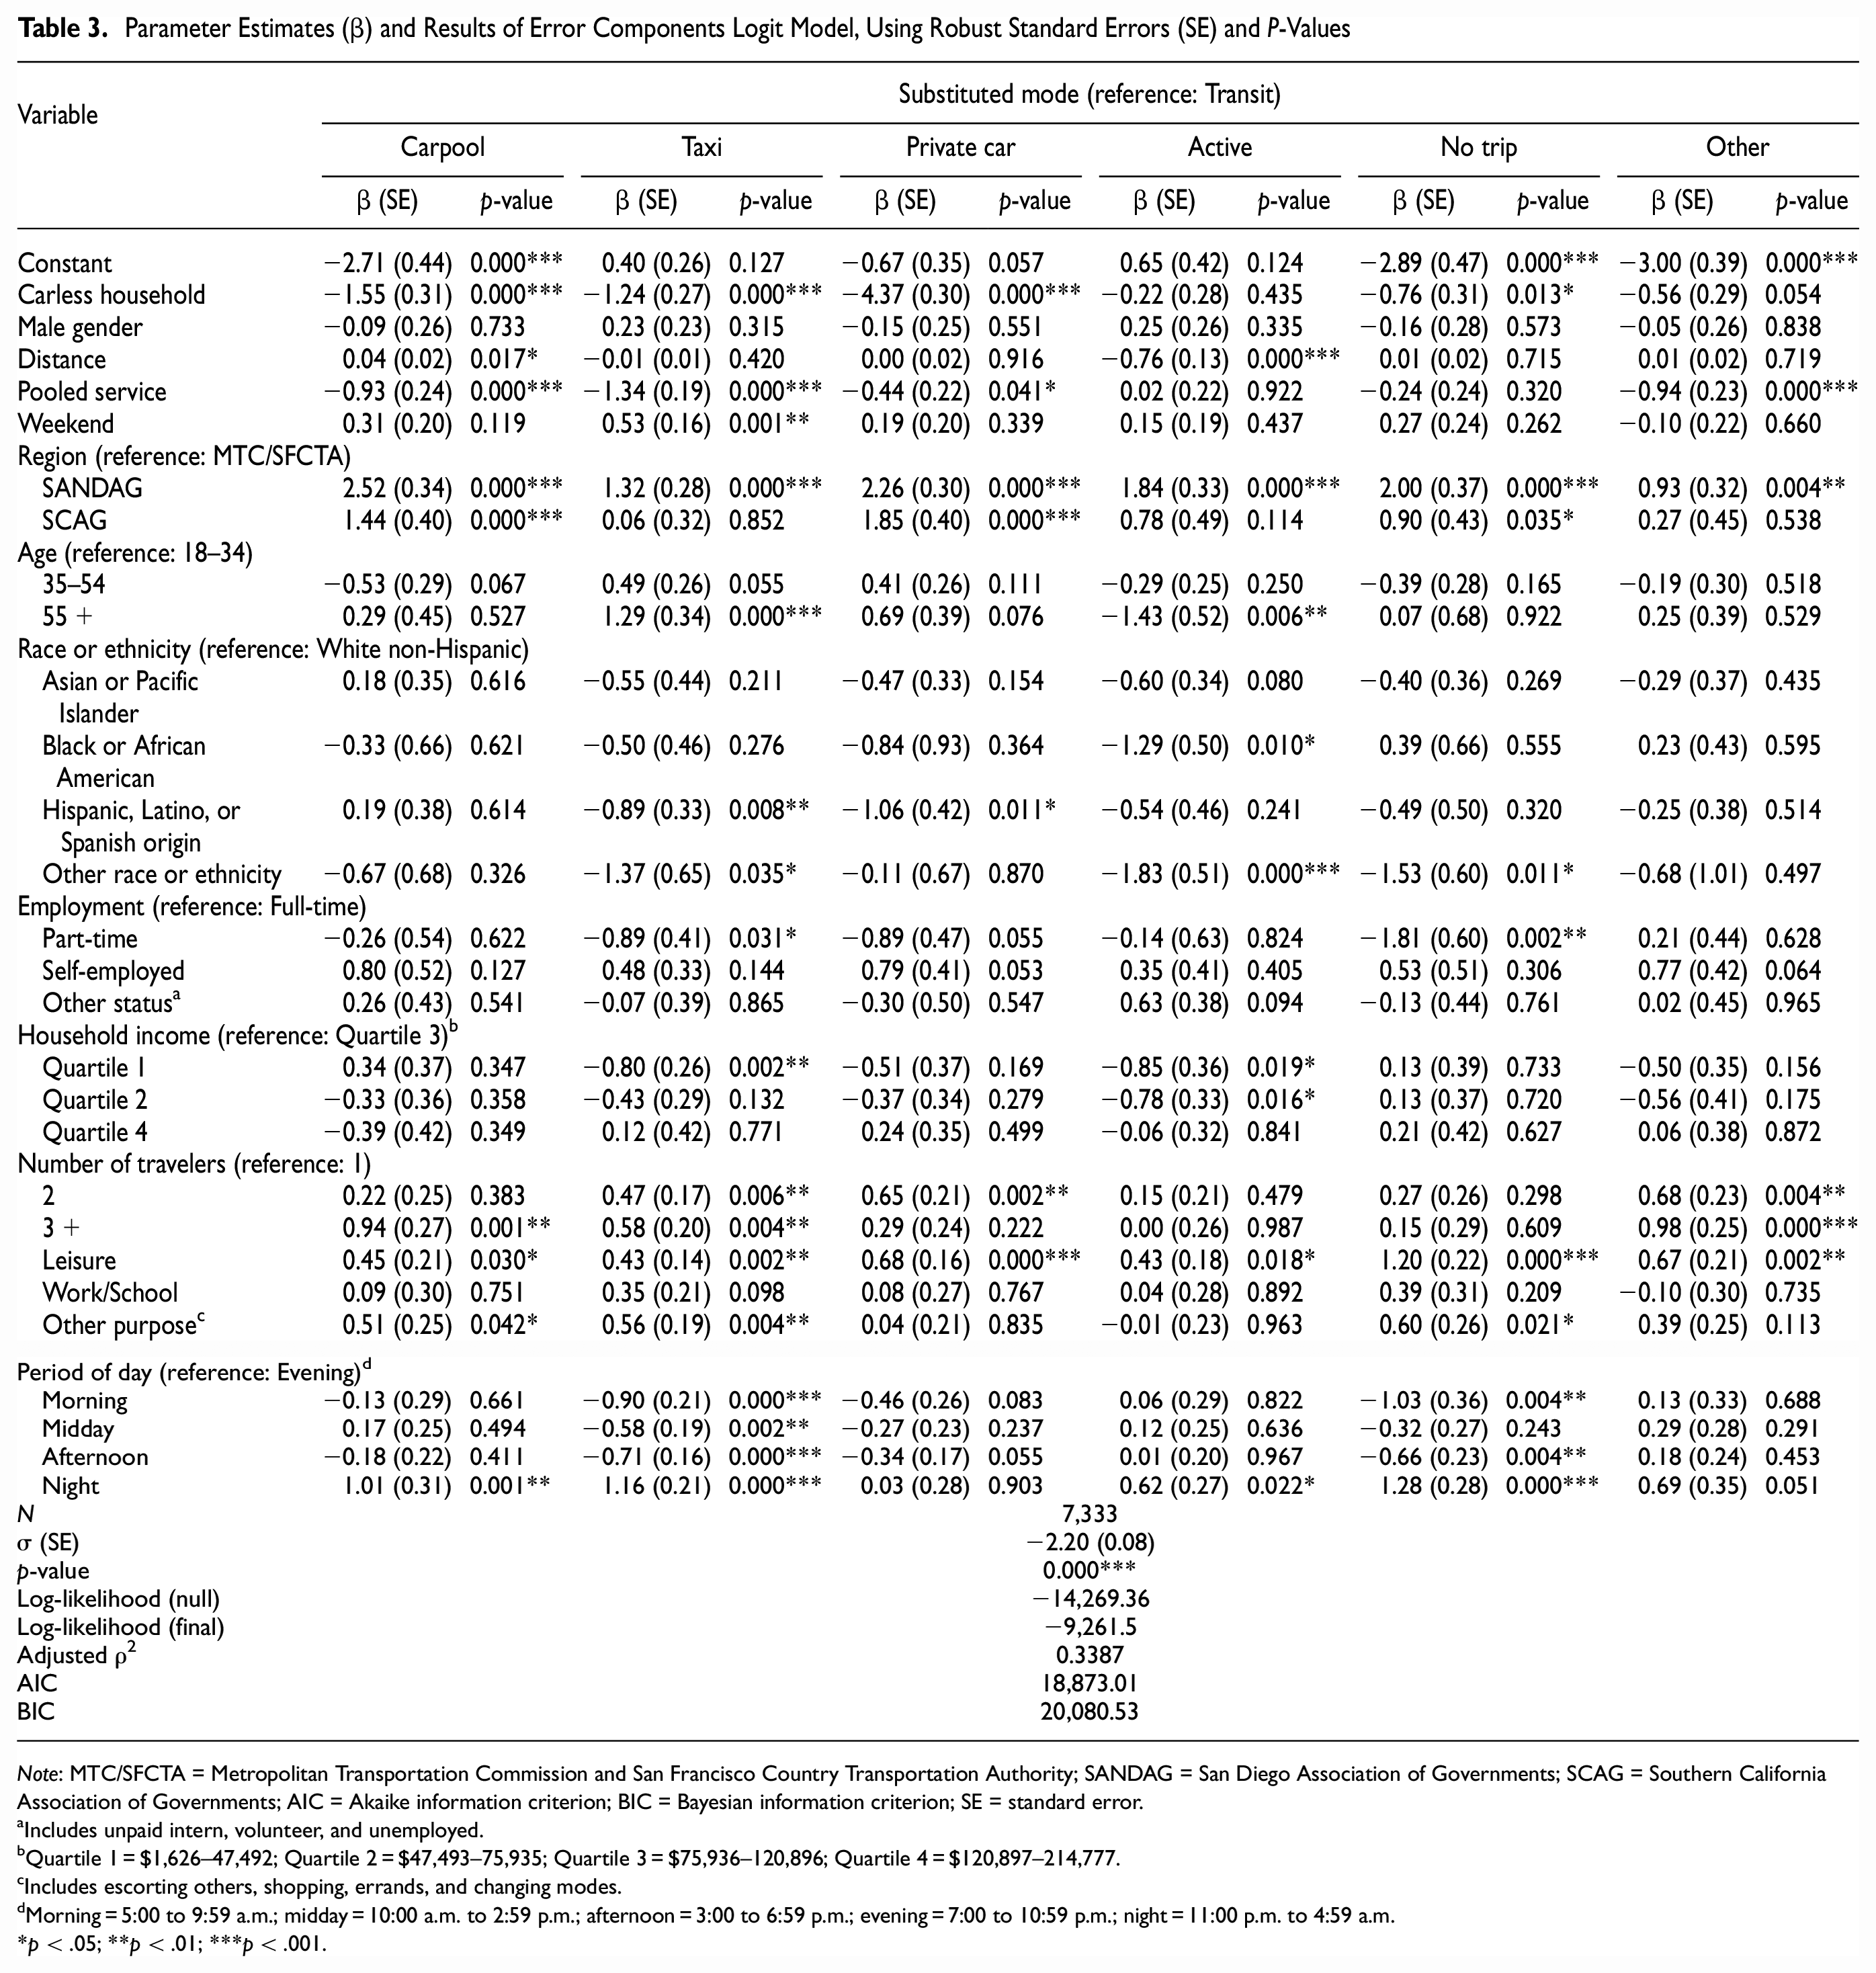
Note: MTC/SFCTA = Metropolitan Transportation Commission and San Francisco Country Transportation Authority; SANDAG = San Diego Association of Governments; SCAG = Southern California Association of Governments; AIC = Akaike information criterion; BIC = Bayesian information criterion; SE = standard error.
Includes unpaid intern, volunteer, and unemployed.
Quartile 1 = $1,626–47,492; Quartile 2 = $47,493–75,935; Quartile 3 = $75,936–120,896; Quartile 4 = $120,897–214,777.
Includes escorting others, shopping, errands, and changing modes.
Morning = 5:00 to 9:59 a.m.; midday = 10:00 a.m. to 2:59 p.m.; afternoon = 3:00 to 6:59 p.m.; evening = 7:00 to 10:59 p.m.; night = 11:00 p.m. to 4:59 a.m.
*p < .05; **p < .01; ***p < .001.
Mode Substitution
As shown in Table 3, being from a carless household was negatively associated with other substituted modes relative to the reference mode, transit. Accordingly, we found that people from carless households were more likely to substitute ridehailing for public transit than car owners, which is consistent with the findings of Gehrke et al. ( 12 ). Based on the regional parameter estimates in Table 3, we found that residents of the MTC/SFCTA region were the most likely to substitute ridehailing for public transit, which makes sense because of the extensive transit network in the San Francisco Bay Area. The SANDAG region appeared to have the greatest association with private car, carpool, and taxi travel in the absence of ridehailing, which suggests that ridehailing may be more competitive with other car-based modes in this region than the others. Compared with those aged 18 to 34, people aged 55 and above were less likely to substitute ridehailing for active trips than public transit. They were also more likely to take a taxi than use transit in the absence of ridehailing. The differences between those aged 18 to 34 and 35 to 54 were similar, but less statistically significant. In the absence of ridehailing, respondents of Hispanic, Latino, or Spanish origin were less likely to drive their own car or take a taxi than their White, non-Hispanic counterparts, whereas those identifying as Asian or Pacific Islander, Black, African American, or other small racial and ethnic minority groups were less likely to pursue active travel than White respondents. Part-time employees were less likely to substitute ridehailing for private car or taxi travel than full-time employees. People at or below the sample’s median household income were less likely to substitute ridehailing for active travel and taxi trips than public transit, compared with higher-income people. The results from Mahmoudifard et al. also indicate that ridehailing users with higher income are more likely to drive or take a taxi trip in the absence of ridehailing ( 17 ).
With regard to trip characteristics, trip distance was positively associated with the replacement of carpooling and negatively associated with the replacement of active travel. Gehrke et al. also found that longer trips predicted the replacement of vehicle-based modes in Boston, and shorter distance trips were more likely to replace active travel ( 12 ). To provide additional context for this finding, Table A1 in the Appendix shows the proportions of alternative travel options that were chosen at various distance intervals. The proportion of trips that would have been made by active travel declined significantly beyond 1 mile and further dropped at the 5-mile mark to around 1% of the responses or less. In contrast, the proportion of trips that would have been made by carpooling doubled at the 5-mile mark to almost 12%. From a quarter to a third of trips would have been made by taxi in the absence of ridehailing across all distance intervals, whereas slightly more would have been made by transit in all but the shortest and longest distance intervals. For trips under 1 mile, the waiting time for transit is likely to dominate the travel time and makes this option less attractive. For trips between 20 and 50 mile, over 50% would have been made by either taxi or driving one’s own car if ridehailing services were not available. Pooled ridehailing services substituted transit more than carpooling, taxi, and private car trips; these results further matched those from Gehrke et al. ( 12 ). Trips made at the weekend rather than on a weekday were more likely to be made by taxi or carpool in the absence of ridehailing. Respondents traveling alone were less likely to replace a taxi trip than those traveling with others. Compared with lone travelers, parties of three or more were likely to carpool in the absence of ridehailing. Individuals traveling with one other person (i.e., total of two travelers) were the most likely to drive their own car were ridehailing unavailable, whereas those traveling with two or more other people were the most likely to carpool with someone else. These results showed that ridehailing services were effectively competing with other modes for group travel. We also found that the trip purpose and start time had significant effects on modal substitution. Ridehailing trips conducted for leisure purposes were most likely to replace private car and active trips. Compared with trips returning home, leisure trips and those for errands or changing mode were more likely to be made by carpooling or taking a taxi than transit. Ridehailing was more likely to substitute taxi trips in the evening than during earlier parts of the day and was most likely to replace both carpool and taxi trips at night. This can partially be explained by prior work by Tirachini who found that many people prefer to use a ridehailing service to return home at night instead of asking a relative to pick them up ( 10 ). Ridehailing also appeared to substitute active travel at night. The substitution of ridehailing for private car trips was positively associated with morning and afternoon travel, which may be to commute to and from work at those times of day.
Induced Travel by Ridehailing
Based on the model results in the “No trip” column of Table 3, we found that lacking a household car predicted less induced travel by ridehailing relative to substituting transit. Compared with the MTC/SFCTA region, residence in SANDAG or SCAG was associated with more induced travel by ridehailing. Underrepresented racial and ethnic minorities were less likely than White non-Hispanic respondents to have induced travel by ridehailing, as were part-time employees compared with full-time employees. Individuals in these segments of the population may use ridehailing for essential purposes rather than for discretionary trips. Neither gender nor income level seemed to influence induced travel by ridehailing.
Trip distance, the use of a pooled ridehailing service, and the size of the travel party did not have a significant effect on induced travel in our model. As expected, trips for leisure purposes were most frequently associated with induced travel by ridehailing. Trips to work or school were less likely to be discretionary and were therefore not associated with much induced travel. We note here that some of the induced trips for various purposes had an associated return trip home that would also not have occurred in the absence of ridehailing, which in turn may explain why we expected to see some induced travel for home-based trips. Induced travel of ridehailing was less likely to occur in the morning or afternoon periods compared with other parts of the day and was most likely to occur at night. Tirachini highlights the utility of ridehailing for nighttime activity engagement owing to its perceived safety and convenience ( 10 ).
Discussion
As of 2023 in California, ridehailing service providers are regulated under the Clean Miles Standard (CMS) program to decrease their fleets’ GHG emissions. To achieve the objectives put forth by the CMS, it is vital to understand how the current provision of ridehailing services affects the travel behavior of users, particularly as the resulting modal substitution and induced travel may both have significant environmental and equity ramifications.
Ridehailing is shown to contribute to congestion and GHG emissions by replacing more sustainable modes ( 28 ). Some 47.4% of the ridehailing trips in our sample replaced a transit, active, or carpooling trip, with transit being the most substituted mode overall (30.2%). The high transit substitution rate may be partially explained by the concentration of both ridehailing and transit trips in core urban areas in California ( 29 ). Furthermore, there may be confounding variables pertaining to the competitiveness of alternative modes, such as travel time, which influenced our observed sociodemographic effects. For example, Young et al. found that transit trips are substituted by ridehailing more often when they are of a comparable duration ( 9 ). On the other hand, Barajas and Brown found that origins and destinations of ridehailing trips were most strongly associated with high household income rather than transit supply ( 8 ). Although this suggests the importance of socioeconomic variables, the authors also found differing patterns for bus and rail, and that higher transit density predicted more ridehailing trips on weekend nights, which indicate a complex picture. We recommend that future studies with access to data on the price, LOS, and spatiotemporal attributes of alternative travel modes incorporate these variables into their models to control for their effects.
Although there is potential to mitigate ridehailing’s contribution to congestion by increasing vehicle occupancy rates with pooled services ( 30 ), our results indicate that pooled trips are more likely to draw riders away from transit than other travel modes. Therefore, beyond the existing incentive system within the CMS program to award credits for TNC trips that connect to transit, we recommend the creation of additional incentives for pooled ridehailing trips that connect to public transit and the improvement of transit services to be more competitive with pooled ridehailing services. For example, Schwieterman and Smith suggest that reducing the number of transfers and the distances people must travel to access transit can improve travel times relative to pooled ridehailing ( 31 ). The finding that respondents without a household vehicle are more likely to replace transit with ridehailing further supports the need for enhanced transit provision in mobility-disadvantaged communities. Using ridehailing as a supplement to transit in areas with low transit demand, as suggested by Young et al., may be a solution worth trying to improve the mobility of residents while minimizing transit losses, especially if these serve to connect passengers to existing transit stations ( 9 ).
The proposition that ridehailing connects underserved people, including those without a household car, members of low-income households, and individuals belonging to a racial or ethnic minority, to new mobility opportunities was not in fact supported by our analysis of induced travel by ridehailing. Instead, our results suggested that people without a household car, and those identifying as underrepresented racial and ethnic minorities were less likely than car owners and White individuals to make new trips. We postulate that members of underserved communities often use ridehailing for essential purposes rather than for discretionary trips and, therefore, could not avoid making these trips if ridehailing were not available. Further research is needed to determine the specific contexts and extent to which underserved communities make use of ridehailing services.
It is important to understand the impacts of ridehailing on private car use, which accounts for the largest mode share in California according to data from the 2017 NHTS ( 32 ). A preliminary analysis found that ridehailing was more likely to replace private car trips among individuals with higher household incomes, in comparison to those in the lowest income quartile in our sample, though the income effect on private car substitution was not significant in our model. This may partially be explained by the disparity of car ownership in our full sample, with respondents in the highest income quartile having a greater rate of ownership (74%) relative to those in the lowest quartile (56%). Indeed, Brown found that Lyft provides car access to neighborhoods in Los Angeles with low rates of car ownership ( 33 ). An alternative possibility that warrants further investigation is that ridehailing is more compatible with a lower intensity of private car use for wealthier households than poorer ones. Notably, according to our model results, respondents identifying as Hispanic, Latino, or Spanish origin were significantly less likely to drive their own car than their White counterparts in the absence of ridehailing, although both groups had similar rates of car ownership in our full sample (67% versus 72%). If ridehailing services are to contribute to reducing automobile dependency, they must first address the needs of low-income and racial and ethnic minority communities.
Conclusions
The mode substitution and induced travel effects of ridehailing have important sustainability and equity implications for transportation. The availability of ridehailing services could lead to an increase in VMT as a result of more sustainable travel options, such as transit and active travel (i.e., walking or biking), being replaced by ridehailing trips ( 12 , 18 ). Ridehailing can provide car access to noncar owners and other mobility-disadvantaged groups, enabling more travel opportunities ( 10 ). On the other hand, trips that would not have occurred were ridehailing unavailable, that is, induced travel, add to VMT and the associated negative externalities.
To investigate the factors that influence people to replace alternative travel options with ridehailing, we analyzed data from a 2018/2019 travel diary survey of residents in three metropolitan regions of California: the nine-county Bay Area, San Diego, and parts of the Los Angeles and Orange counties. After cleaning, our data set consisted of 7,333 ridehailing trips by 2,458 respondents. We estimated an error components logit model of the choice of an alternative travel option for a trip if ridehailing was not available, including transit, carpooling, using a private car, taxi, active travel (i.e., walking or biking), making no trip, and other modes or a different destination. As explanatory variables, we considered various user and trip characteristics, such as a respondent’s age, employment status, car ownership, gender, income, and race/ethnicity, as well as the trip distance, use of a pooled ridehailing service, the number of travelers, trip purpose, and departure time. The cost and other attributes of the alternative modes in our choice set were not available in the data used for this study leading us to omit them from the model. We acknowledge that incorporating such variables, as well as variables pertaining to the LOS of alternative modes, would probably have enhanced the robustness of the mode choice model. We suggest future research endeavors should consider including questions pertaining to the cost of alternative options when designing similar surveys, and recommend they merge data from the skim matrices of the travel demand models for the study regions based on the origins, destinations, and timing of trips to fully investigate the impact of alternative modes’ LOS variables on modal shift.
Our analysis revealed several significant findings on the factors that influence mode substitution and induced travel by ridehailing. Over 50% of the ridehailing trips in our sample replaced a transit, active, or carpooling trip, or created new VMT (via induced travel) with transit being the most substituted mode overall (30.2%). This indicates that ridehailing tends to replace more sustainable modes of travel and leads to additional VMT. Respondents without a household vehicle and those who used pooled services instead of traditional ridehailing services were more likely to replace transit. Therefore, we recommend the improvement of transit services as suggested by Schweiterman and Smith ( 31 ) and a focus on connecting ridehailing trips—especially those offered by pooled services—to public transit in low-demand areas as suggested by Young et al. ( 9 ). Respondents belonging to a minority or without a household vehicle were least likely to cancel a trip were ridehailing not available, suggesting their use of ridehailing is for essential rather than discretionary purposes. It is vital for policy makers to understand how the current provision of ridehailing services affects the travel behavior of users, particularly as the resulting mode substitution and induced travel may both have significant environmental and equity ramifications. Together, these findings provide valuable insights for policy makers seeking to address the environmental and equity issues associated with ridehailing.
Supplemental Material
sj-docx-1-trr-10.1177_03611981241247047 – Supplemental material for Correlates of Modal Substitution and Induced Travel of Ridehailing in California
Supplemental material, sj-docx-1-trr-10.1177_03611981241247047 for Correlates of Modal Substitution and Induced Travel of Ridehailing in California by James Giller, Mischa Young and Giovanni Circella in Transportation Research Record
Footnotes
Acknowledgements
This study was made possible through a research grant from the California Air Resources Board. The data were provided by Resource Systems Group Inc., Metropolitan Transportation Commission, San Francisco County Transportation Authority, San Diego Association of Governments, Southern California Association of Governments, and Sacramento Area Council of Governments. The authors would like to thank Junia Compostella, Xiatian Iogansen, Alan Jenn and the other colleagues at the Institute of Transportation Studies, University of California, Davis who contributed to the research. The author also would like to thank Krystal Ayala, Danielle Kochman, Wu Sun, Grace Miño, Bhargava Sana, Shimon Israel, Bill Davidson, Yang Wang, Joe Castiglione and Purva Singh and the other colleagues who helped from the partner agencies.
Author Contributions
The authors confirm contribution to the paper as follows: study conception and design: J. Giller, M. Young, G. Circella; data acquisition: G. Circella; analysis and interpretation of results: J. Giller, M. Young, G. Circella; draft manuscript preparation: J. Giller, M. Young, G. Circella. All authors reviewed the results and approved the final version of the manuscript. The authors do not have any conflicts of interest to declare.
Declaration of Conflicting Interests
The authors declared no potential conflicts of interest with respect to the research, authorship, and/or publication of this article.
Funding
The authors disclosed receipt of the following financial support for the research, authorship, and/or publication of this article: This work was supported by the California Air Resources Board (grant no. 19STC006).
Data Accessibility Statement
The data that support the findings of this study are available from the San Diego Association of Governments, Southern California Association of Governments, and Metropolitan Transportation Commission but restrictions apply to the availability of these data, which were used under a confidentiality and nondisclosure agreement for the current study, and so are not publicly available.
Supplemental Material
Supplemental material for this article is available online.
The contents of this paper reflect the views of the authors, who are responsible for the accuracy of the information presented. This document does not necessarily reflect the official views or policies of the State of California, or any of the funding or partner agencies.
References
Supplementary Material
Please find the following supplemental material available below.
For Open Access articles published under a Creative Commons License, all supplemental material carries the same license as the article it is associated with.
For non-Open Access articles published, all supplemental material carries a non-exclusive license, and permission requests for re-use of supplemental material or any part of supplemental material shall be sent directly to the copyright owner as specified in the copyright notice associated with the article.