
Abstract
Crowd management attempts to guide pedestrian crowds effectively and efficiently. Static crowd-management measures, such as fences, are often used to guide the crowd. Another way to steer pedestrian walking behavior is through “nudging,” that is, gently coaxing people into the “preferred” direction, for instance, by lighting conditions. This paper examines the impact of light intensity (brightness) and color on pedestrian route-choice behavior using data from a VR experiment. The study develops two types of discrete-choice models—a panel mixed logit model and a latent class choice model—featuring the route-choice behavior of pedestrians under varying lighting conditions in a virtual maze in a controlled virtual reality experiment. We found that pedestrians avoided red and dark corridors and chose green and blue corridors. On average, the green light most effectively “pulled” people toward a specific route. In addition, this study uncovered three segments in the population: (1) light-sensitive individuals, (2) darkness-avoiding individuals, and (3) individuals with a severe right-handed bias. We found that the impact of color and brightness levels on route-choice behavior differed greatly across segments.
Keywords
Introduction
Crowd management attempts to guide pedestrian crowds effectively and efficiently. Static crowd-management measures, such as fences, gates, and barricades, are often adopted to steer the crowd. The crowd has no choice but to follow these hard-landscaping structures—this lack of freedom can limit visitors’ experience.
Another way to steer pedestrians’ choice behavior is through “nudging,” that is, the gentle coaxing of people into the “preferred” direction. Environmental elements, such as lighting conditions, atmosphere, street design, and soundscape, can be leveraged to nudge pedestrians’ choice behavior. Several researchers have studied the efficacy of nudging measures on choice behavior in general and in pedestrians’ choice behavior in particular. For instance, Rubaltelli et al. ( 1 ) and Basu et al. ( 2 ) found that visual nudges, such as signage and visual cues, can influence cyclists’ and vehicular traffic’s choice behavior. Basu et al. found that several street design elements could be leveraged to proactively steer individuals’ choice behavior ( 2 ). Studies have also shown that light intensity and color can be used to steer the route choice of pedestrians ( 3 – 6 ). Soundscapes can also be used to adjust pedestrians’ gait and walking speed ( 7 – 10 ). These findings suggest that nudging by means of light and sound could potentially be a low-cost, dynamically adaptable crowd-management solution for cases where static crowd-management solutions, such as fences and crowd-management personnel, have proven to be too static or costly to implement.
Although studies have demonstrated that light intensity and color can influence route choice ( 3 – 6 ), these works typically focus on demonstrating the effect of one type of light cue rather than unraveling the underlying mechanism. For example, they rarely compare different types of light-based nudges within the same experimental design, quantify heterogeneity in effects across individuals, or test whether the observed behaviors persist across multiple choices. This limits our understanding of the robustness and generalizability of light-induced nudging effects.
In addition, there are few quantitative insights into the impact of lighting conditions (intensity and color) on pedestrian route-choice behavior. To the best of the authors’ knowledge, only van Beek et al. ( 3 ) and Vilar et al. ( 6 ) have systematically studied the impact of various lighting conditions on pedestrians’ route-choice behavior. Both quantified the effect size using statistical analyses but refrained from developing comprehensive mathematical models. By not accounting for potential panel effects, interaction effects between variables, and respondent strategies, both studies might have overestimated the effectiveness of nudging through lighting conditions.
From a practical perspective, crowd managers require quantitative insights to operationalize light-based nudging for crowd-management purposes. Without models that reliably predict behavioral responses under varying lighting conditions, the implementation of adaptive lighting strategies in real-world environments, such as at festivals, transit hubs, or stadiums, will remain largely experimental.
Addressing these scientific and practical gaps requires a modeling framework that simultaneously quantifies the magnitude of lighting effects, uncovers behavioral heterogeneity, and evaluates the stability of choices across repeated tasks. This study answers the research question: “What is the quantitative impact of lighting conditions on the local route-choice behavior of individual pedestrians?” In this study, we aimed to quantify the impact of the lighting conditions using two types of discrete-choice model: a panel mixed logit (PML) model and a latent class choice model (LCCM). The first model (PML) was adopted to account for the expected panel effects in our dataset. During the experiment, the authors found that participants adopted very different choice strategies. The LCCM can account for these differences while accounting for the panel effects. We used the experimental dataset collected in the virtual reality (VR) experiment conducted by van Beek et al. ( 3 ) to determine the impact of light intensity (brightness) and color on pedestrians’ choice behavior in a maze.
This study contributes to the literature by (i) systematically comparing the effects of light intensity and -color on route choice within a unified experimental setting, (ii) quantifying these effects using behaviorally grounded models that account for heterogeneity, and (iii) providing insights relevant for designing low-cost, adaptive crowd-management systems.
This paper continues as follows. The next section provides an overview of the VR experiment, including the overall research approach, the design of the choice experiment, the VR environment, participant selection, and a description of the dataset. Accordingly, the modeling methodology is presented. Afterward, the modeling results are presented, discussed, and compared with relevant other scientific contributions. This paper finishes with conclusions and some suggestions for future work.
VR Experiment: Setup and Data Description
Our paper primarily provides a mathematical description of choice behavior. The mathematical description is based on a VR choice experiment ( 3 ). The VR choice experiment presented below was part of a more comprehensive study into the impact of lighting on the choice behavior and movement dynamics of pedestrians, which also featured an experiment focusing on the effects of lighting conditions on pedestrian walking speed ( 11 ). The experiment took place over the course of 3 weeks in May 2023. The experiment was approved by the Human Research Ethics Committee of the Delft University of Technology (Reference ID: 2987). During this comprehensive experiment, individuals participated in four short VR and real-life experiments within a 60-min timeslot.
Only the essential highlights of the VR choice experiment are summarized in what follows.
Hypothesized Behavioral Responses to Variations in Light Intensity and Color
To better understand how pedestrians respond to light-based nudges, this study sought to unravel the behavioral mechanisms by which variations in light intensity and color shape local route-choice decisions. Building on existing empirical insights, we formulated four hypotheses to guide the design of our experiment:
H1. Pedestrians avoid DARK illuminated exits
H2. Pedestrians are drawn toward BRIGHTLY illuminated exits
H3. Pedestrians avoid RED illuminated exits
H4. Pedestrians are drawn toward GREEN illuminated exits
H5. Pedestrians respond differently to light-based nudges at exits.
These hypotheses reflect commonly observed perceptual associations in literature.
Experimental Approach to the VR Experiment
The procedure is presented in Figure 1. The experiment comprised five parts:
Welcome: Each participant started with an orientation, during which they were welcomed and asked to sign an informed consent form and undertake a basic color blindness test.
VR choice experiment: Participants were asked to don a cable-based VIVE Pro Eye head-mounted display (HMD; HTC, Singapore) device and take hold of a hand-held controller. They were then located in a digital maze after a short familiarization phase in a learning environment. Here, the instructor asked them to find the way out. They met 20 choice tasks on the route, divided into two similar mazes. During each task, the participants had to choose a rectangular room between a left and a right corridor. See van Beek et al.’s study for a detailed description of this experiment ( 3 ).
VR walking experiment: The participants were directed to a second room in which two additional walking experiments were conducted: a real-life experiment and a VR experiment. Participants used a wireless HMD while walking on a track inside the room. (We refer readers to the research by Duives et al. for a detailed description of the VR walking experiment [ 11 ].)
Survey: After that, participants were asked to complete a survey featuring a simulation sickness questionnaire, a presence questionnaire, a system usability scale questionnaire, and some questions to record personal characteristics.
Goodbye: The participants were thanked for their participation and received a 10 Euro gift card.
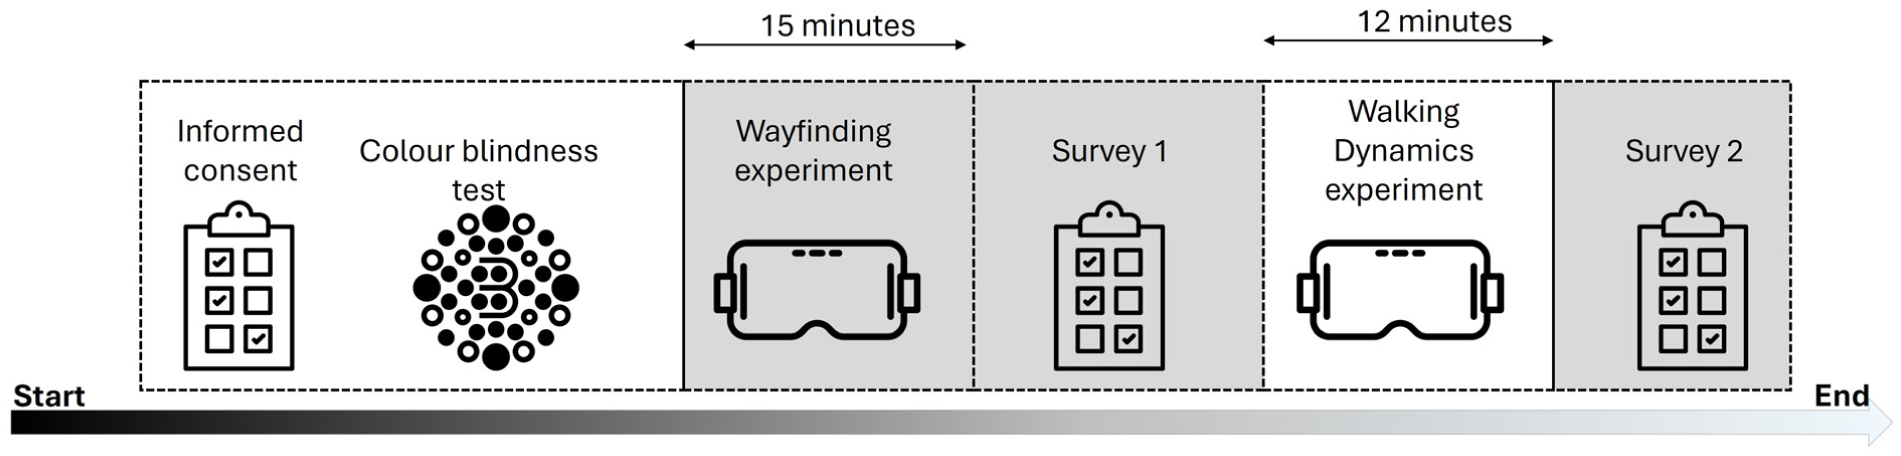
Visualization of the experimental procedure.
Design of the Choice Experiments
All participants were asked to make 2 × 10 subsequent choices within the maze. The maze is depicted in Figure 2. All choice tasks featured a T-intersection with two symmetric corridors, one on the left and one on the right. Varying lighting conditions were shown above the two exits of each T-intersection. Regardless of their choice, participants would always find the maze exit after 10 consecutive choice tasks.
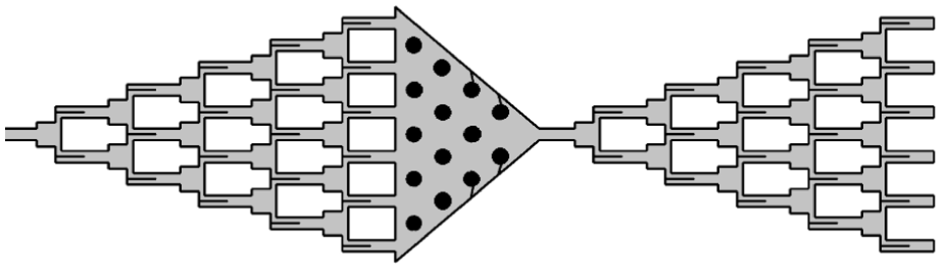
Visualization of the maze ( 3 ).
During the first run through the virtual maze, the light intensity in both corridors varied across five levels (very bright, bright, neutral, dark, very dark). Here, “very bright” resembles the light level at a work desk (approx. 300 lux), “neutral” is the recommended lighting level in a corridor of an office building (approx. 100 lux), and “very dark” is an approximation of emergency lighting conditions (approx. 1 lux). Fifteen distinct choice tasks were designed to feature specific lighting conditions (e.g., left: very dark–right: neutral). Participants were assigned to one of four groups, each with a slightly different sequence of lighting conditions. Each participant encountered 10 of the 15 choice tasks concerning light intensity. The first brightness choice task was the same for all participants and featured neutral brightness conditions in both corridors. This first task was used in this research as a proxy for the participants’ left/right bias when making left/right choices.
In the second run through the virtual maze, the choice tasks featured variations in lighting color. Here, varying combinations of white, blue, red, and green were shown. The latter two colors were adopted because these colors have widely recognized associations in the Netherlands (red: “stop”/”danger” and green: “safe”/“go”). Blue was adopted because it has no explicit cultural meaning in the Netherlands. Similarly, in the first run through the maze, participants encountered 10 choice tasks. The VR experiment included 13 possible color combinations, and participants were divided into two groups. The first task also featured the same neutral white lighting conditions in both corridors.
During the experiment, the authors observed that participants used fairly distinctive strategies to navigate the maze. Participants relatively often chose (1) the corridor on the right, (2) a corridor that would bring them closer to the center line of the experiment, (3) the green corridor, or (4) the lighter corridor. Therefore, in the modeling process, the authors had to account for correlations within responses from the same individual (panel data) and for the presence of clusters of participants displaying similar choice behavior (latent clusters).
Design of a VR Environment
The design of the VR environment was very straightforward. We designed a maze with minimal detail to reduce the number of factors influencing pedestrian route choice: the VR environment lacked any visual cues apart from the variations in lighting conditions (i.e., no greenery, benches, or colored walls). See Figure 3 for four visualizations of the VR environment. Even though simple, the Simulator Sickness Questionnaire (Mean: 14.44, SD: 15.74) and Presence Questionnaire (Mean: 130.68, SD: 18.21) are comparable to other VR studies using environments that comprise a lot more detail (e.g., 12 , 13 ).
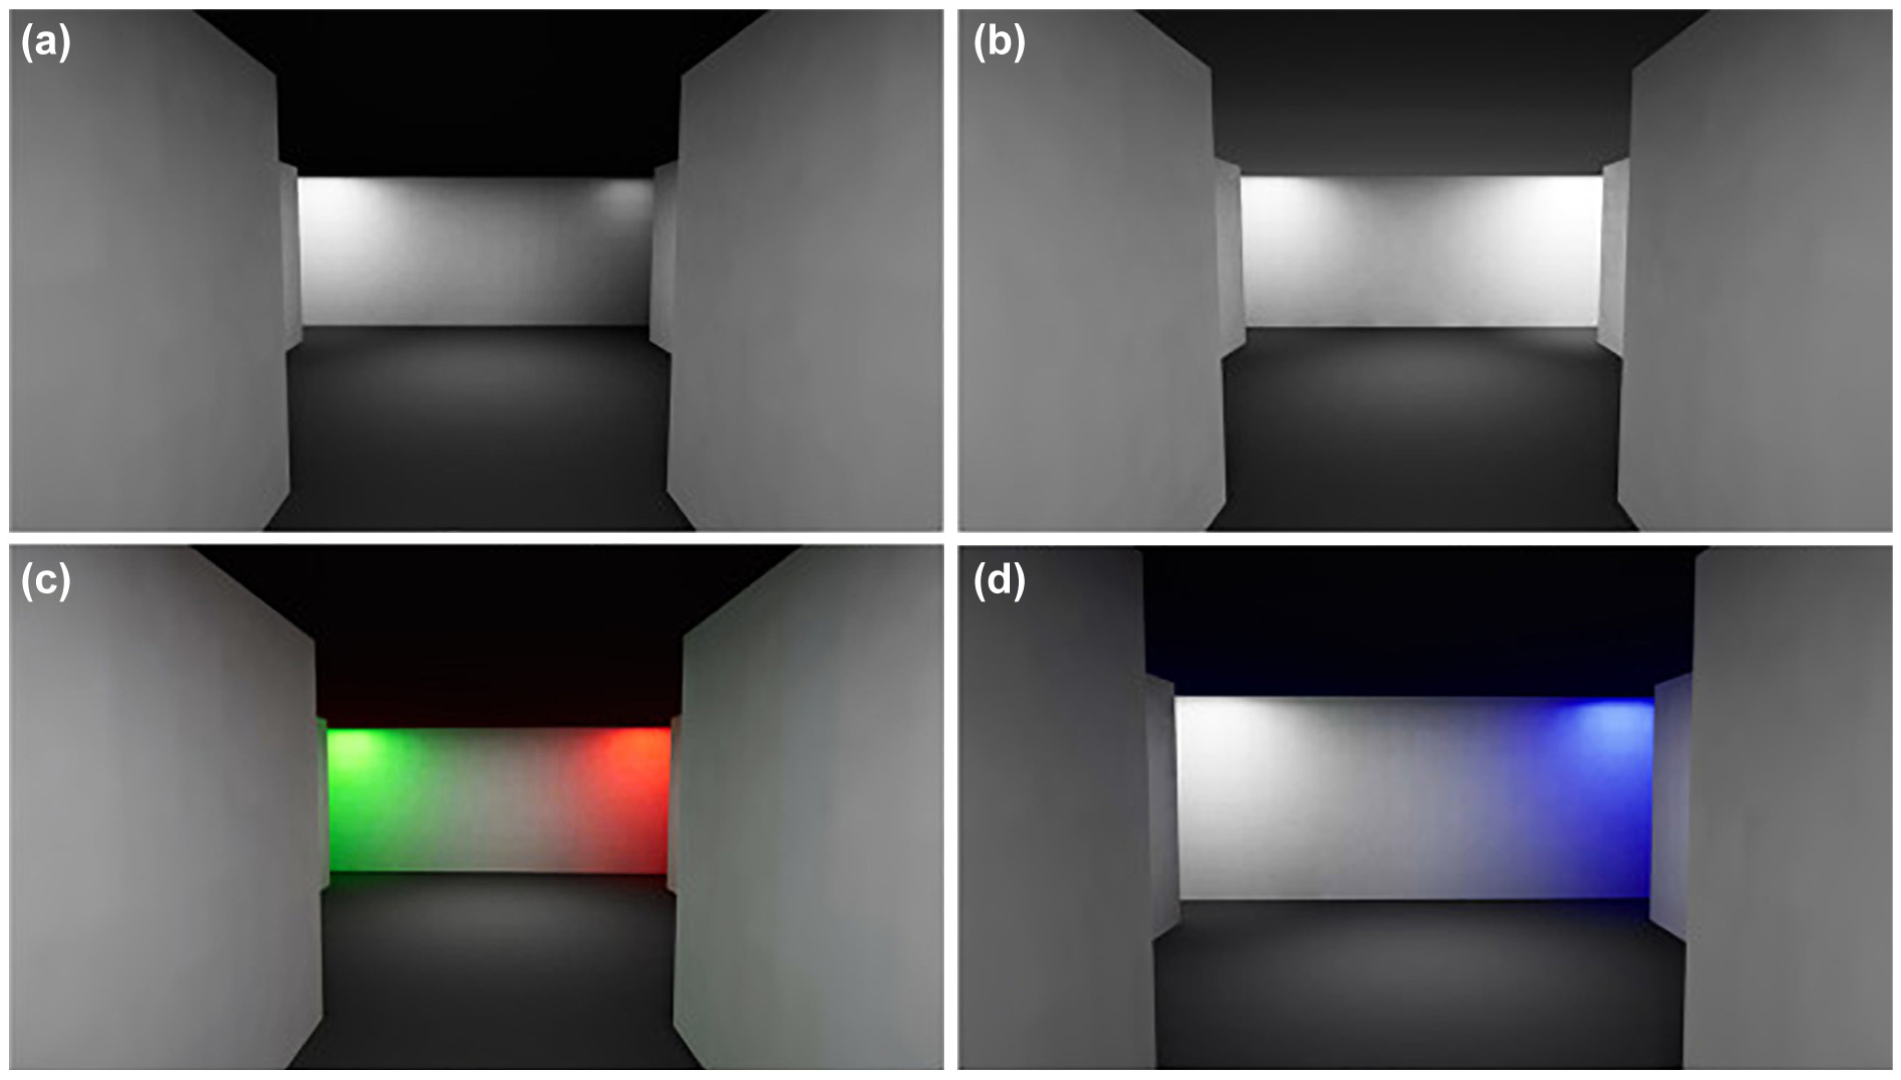
Four visualizations of the choice tasks in the virtual reality (VR) environment: (a) neutral (left) and very dark (right); (b) neutral (left) and very bright (right); (c) green (left) and red (right); and (d) white (left) and blue (right).
Participant Selection and Sample Description
Himann et al. (1988), among others, found that age negatively affects the average walking speed of pedestrians ( 14 ). To ensure this would not limit the VR walking experiment, we explicitly selected young, healthy participants (between 18 and 35 years old) without physical impairments that would hamper their walking abilities. Furthermore, the experiments featured two color-based experiments. Therefore, only individuals who could identify the difference between white, green, red, and blue were allowed to participate in the experiment.
The VR experiments were conducted with a convenience sample of 64 participants (37 males and 27 females). All participants were recruited via flyers distributed at the university and via LinkedIn messages sent through the professional networks of the researchers. Their ages ranged from 19 to 35, with an average of 26.3 years. Most participants were highly educated and experienced with computer gaming, but had little experience of VR gaming.
Determining an appropriate minimum sample size for the present discrete-choice experiment was challenging because no preliminary evidence is currently available on the expected impact of lighting conditions. In particular, the researchers lacked information about the anticipated effect sizes of the color attributes (

where
c is maximum number of choice levels,
t is number of choice tasks, and
a is number of alternatives per choice task, which are respectively 2, 10, and 2.
Consequently, a minimum sample size of (500 × 2)/(10 × 2) = 50 was required.
Modeling Methodology
This study adopted a discrete-choice modeling approach to develop a comprehensive description of choice behavior.
Model Definition
We developed three types of discrete-choice models that would capture the interaction effects, panel effects, and choice strategies. All three model approaches assume that users select the alternative that maximizes their utility ( 17 ). The threemodel types – multinomial logit (MNL) model, Panel Mixed Logit model (PML) and Latent Class Choice model (LCCM) – are introduced below.
Multinomial Logit Model
MNL models the choice probability among a finite set of alternatives.


where
We estimated a generic-parameter model as a benchmark for the more detailed models that followed. This MNL model featured an ASC, light-condition parameters, strategy parameters, and parameters featuring sociodemographic characteristics.
Panel Mixed Logit Model
In most cases, participants will make similar choices in similar choice tasks. The PML model accounts for the repeated choices made by the same participant, thus allowing for random taste variation. In this case,


where
Latent Class Choice Model
In contrast to the PML model, the LCCM hypothesizes that the dataset’s heterogeneity arises from two or more segments with distinct choice strategies. The LCCM estimates separate MNL models for each segment to capture this behavior (see Equations 6 to 8). In this case,


The probability,

where
Parameter Definition
To quantify the choice behavior, a large set of parameters was defined, featuring three elements:
Lighting conditions: Light/brightness levels were recorded utilizing nine binary variables (five brightness levels + four color levels).
Participant characteristics: For each participant, five descriptive variables of interest were incorporated: age, gender (i.e., female = 1), height, computer gaming experience, and VR gaming experience. All five characteristics were coded as Boolean variables. For age, the difference was very minor, so we separated the very young participants who were most likely still in university (≤25 years old) from the rest.
Strategy-related characteristics: During the experiments, several participants deployed strategies to find their way through the maze. To allow a discrete-choice model to capture the different wayfinding strategies, we computed an additional seven characteristics for each participant.
Direction of the first choice (dir_first): A binary variable that recorded the result of the first choice task in which no choice information was available to the participants (1: right, 0: left). Thereby, this characteristic represented the internal bias of each participant.
Directionality of the depicted brightness or color (dir_right): A binary interaction variable identifying whether the depicted brightness level or color was displayed on the right.
Percentage of choices to the left (perc_left): A continuous variable identifying the percentage of the choices a participant decided to go to the left.
Percentage of choices to the right (perc_right): A continuous variable identifying the percentage of the choices a participant decided to go to the right.
Percentage of switches (perc_switch): a continuous variable identifying how often the participant switched from left to right and back. A switch was recorded if the participant chose the opposite side to that chosen in the previous choice task. In total, participants could switch 19 times. A participant with a high switching rate was most likely trying to stay in the middle of the virtual maze.
Brightest (brightest): A binary variable identifying whether the corridor was the brightest. In the case of a color combination or a similar brightness level, the brightness of both corridors was 0.
Darkest (darkest): A binary variable identifying whether the corridor was the brightest. In the case of a color combination or a similar brightness level, the brightness of both corridors was 0.
Color combinations: A binary interaction variable identifying the combination of colors that were depicted in the room. This variable was an interaction variable and would always interact with the first of the two mentioned colors (e.g., U = beta_redgreen * RED_left * REDGREEN).
Tables 1 and 2 depict all defined parameters. Please note that, in the PML, the ASC and light-condition parameters are all defined as random variables. In the LCCM model, only the ASC is defined as a random variable. Any parameters that are not depicted in the final model definition were found to be nonsignificant.
Set of Potential Parameters of the Utility Function of the MNL, PML, and LCCM Models
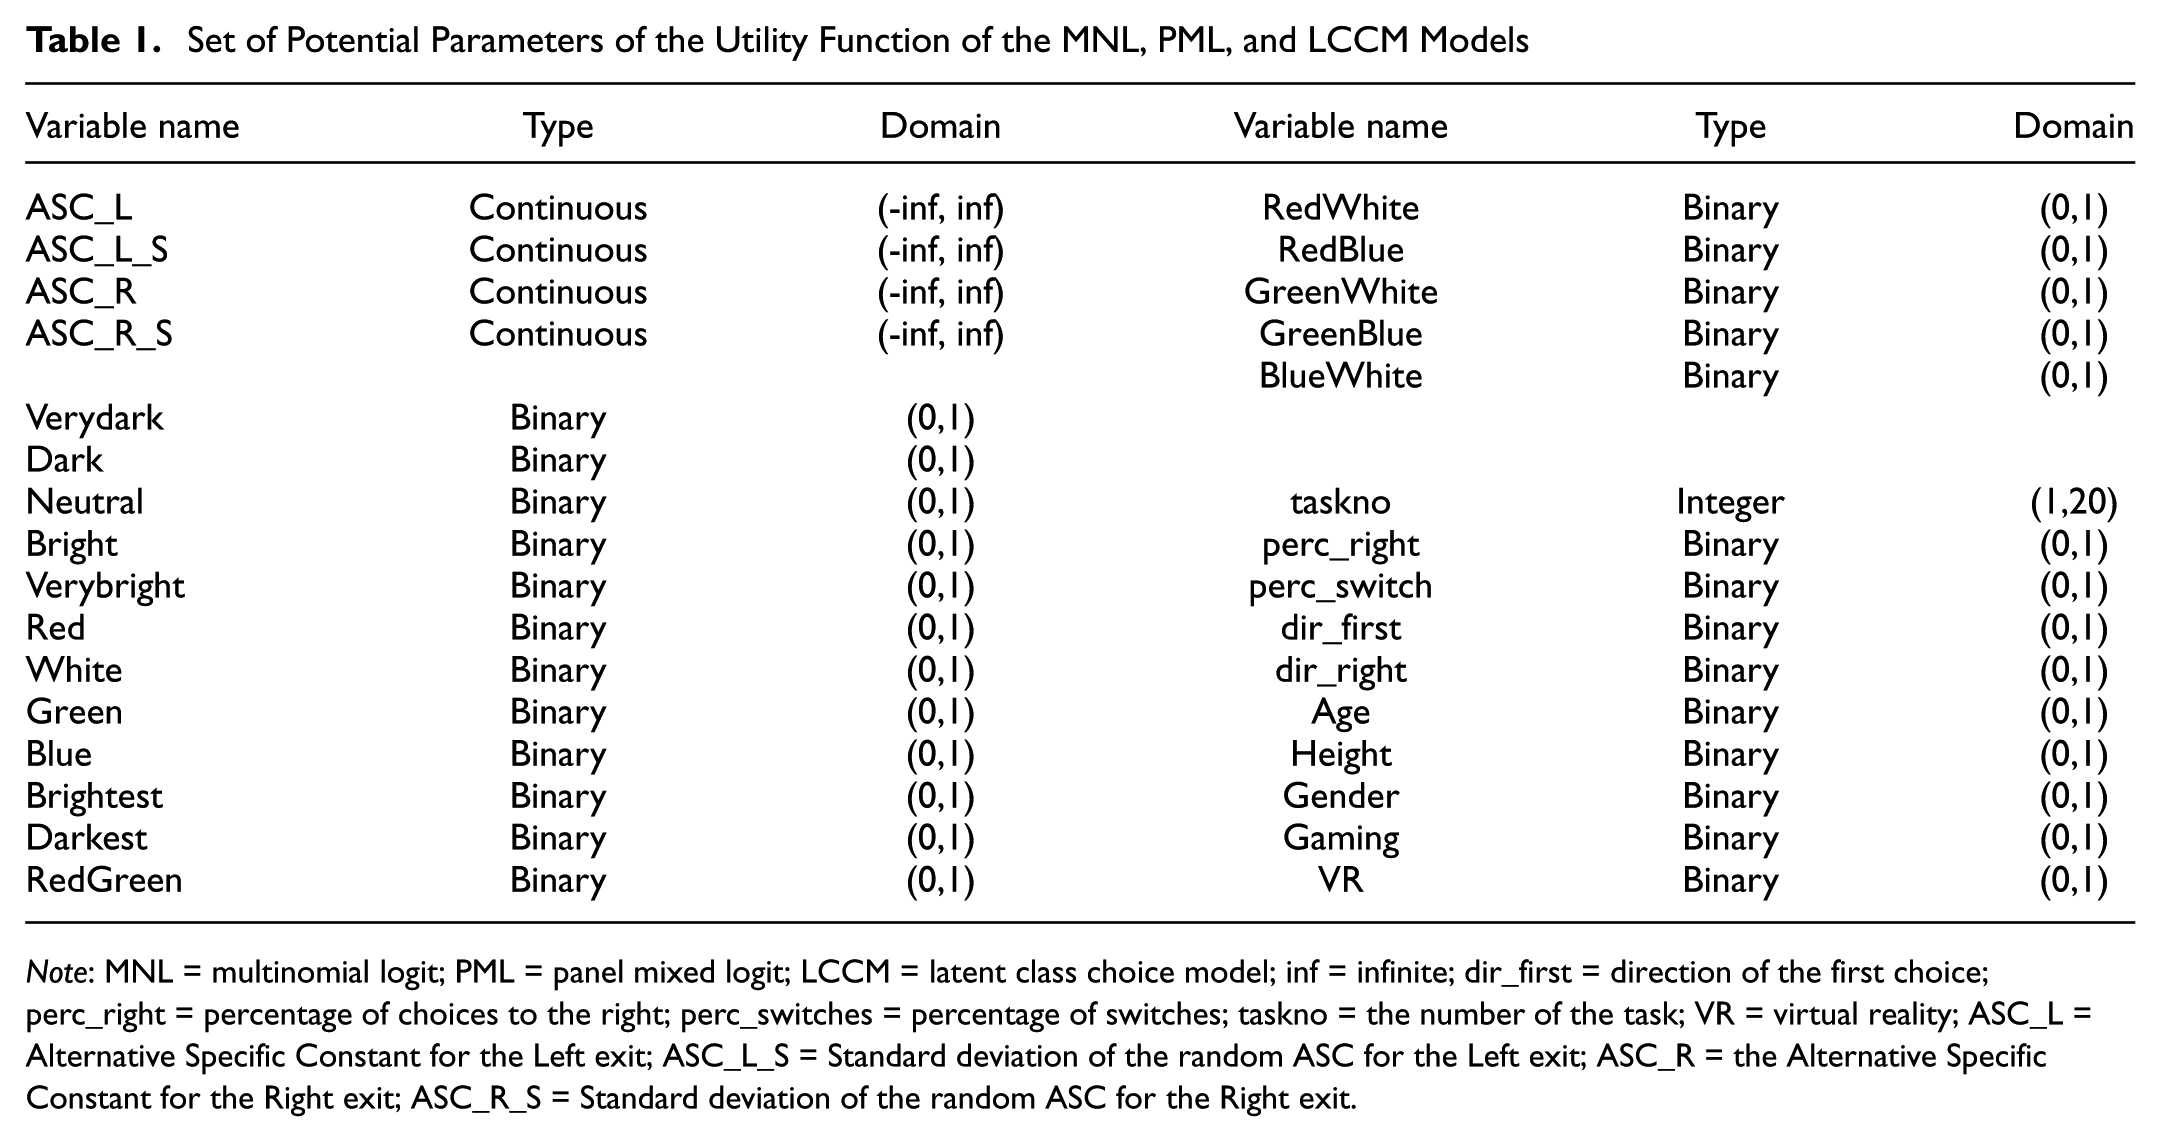
Note: MNL = multinomial logit; PML = panel mixed logit; LCCM = latent class choice model; inf = infinite; dir_first = direction of the first choice; perc_right = percentage of choices to the right; perc_switches = percentage of switches; taskno = the number of the task; VR = virtual reality; ASC_L = Alternative Specific Constant for the Left exit; ASC_L_S = Standard deviation of the random ASC for the Left exit; ASC_R = the Alternative Specific Constant for the Right exit; ASC_R_S = Standard deviation of the random ASC for the Right exit.
Set of Potential Parameters of the Class Membership Function of the LCCM Models
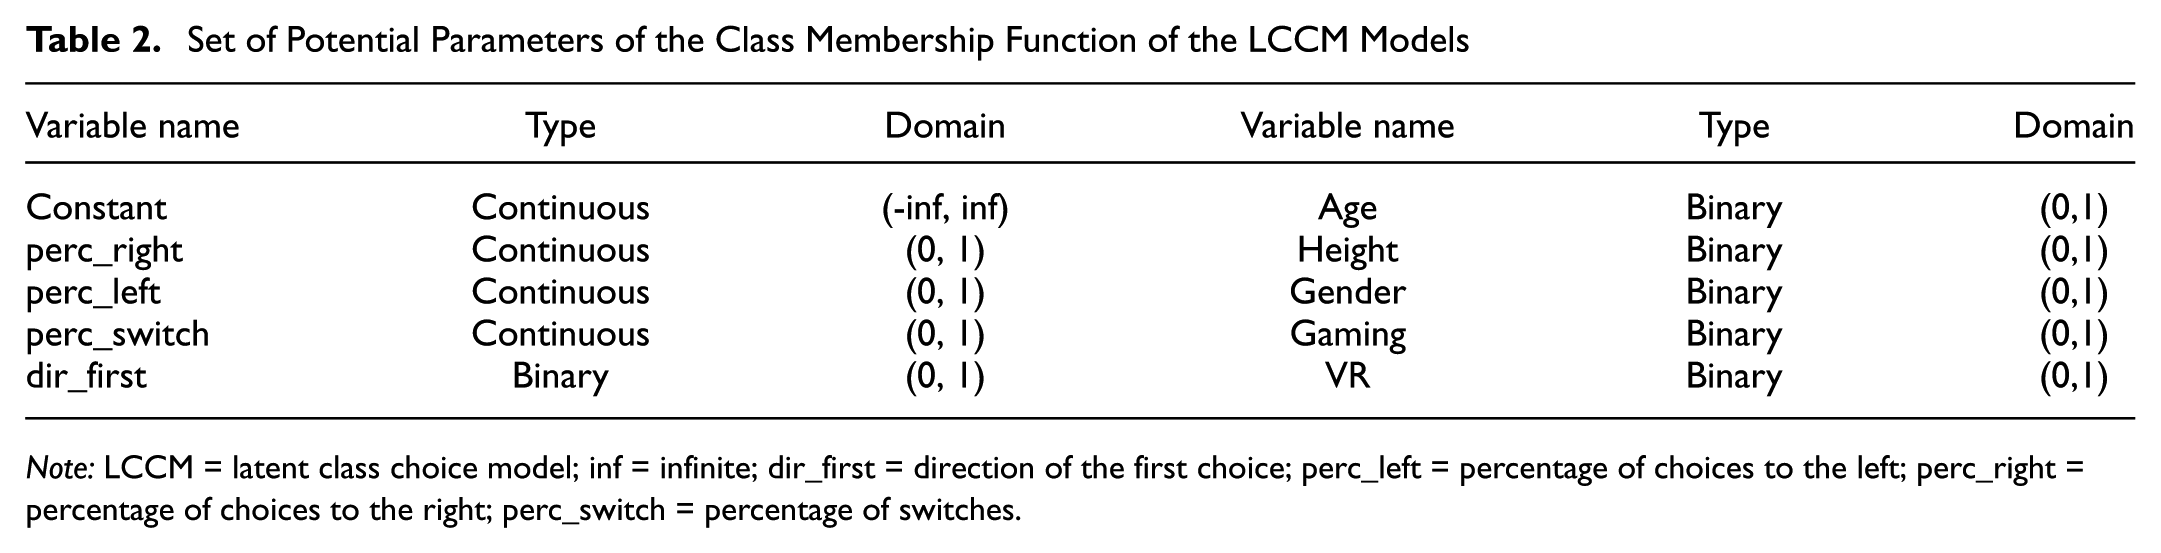
Note: LCCM = latent class choice model; inf = infinite; dir_first = direction of the first choice; perc_left = percentage of choices to the left; perc_right = percentage of choices to the right; perc_switch = percentage of switches.
Model Estimation Approach
The model was estimated using Biogeme, an open-source Python package developed by Bierlaire ( 18 ). For the PML, the impact of each parameter was tested separately in a very naïve model that featured just an ASC (i.e., a random variable) per alternative and a single parameter for lighting conditions, sociodemographic characteristics, or both. Accordingly, all parameters that significantly affected the choice behavior (p-value < 0.1) were combined into a complete model. Parameters that remained nonsignificant (p>0.1) in this combined specification where subsequently removed in a stepwise manner . Finally, the participants’ sociodemographic characteristics were added as interaction variables. Only the significant interaction variables were retained in the final model for each model type. In both model instances, all interaction variables were nonsignificant. In the case of the LCCM model, the number of classes was first determined using a static utility function that only featured an ASC before modeling the utility function.
Modeling Results
This section presents the modeling results. First, we examine the overall scores of the three distinct model types to identify which type(s) of model best fit the participants’ choice behavior. Accordingly, the best model is presented and discussed below.
Comparing the Three Model Types
Table 3 summarizes the modeling results for the best models per model type. The LCCM outperformed the PML, that is, the Bayesian information criterion (BIC) score was lower and the adjusted R-squared was higher. This suggests that the dataset did feature taste heterogeneity. However, to better understand the type of taste heterogeneity, we will present both model types in the remainder of this paper. We will first present the results of the PML, followed by those of the LCCM.
Modeling Results for All Three Model Types
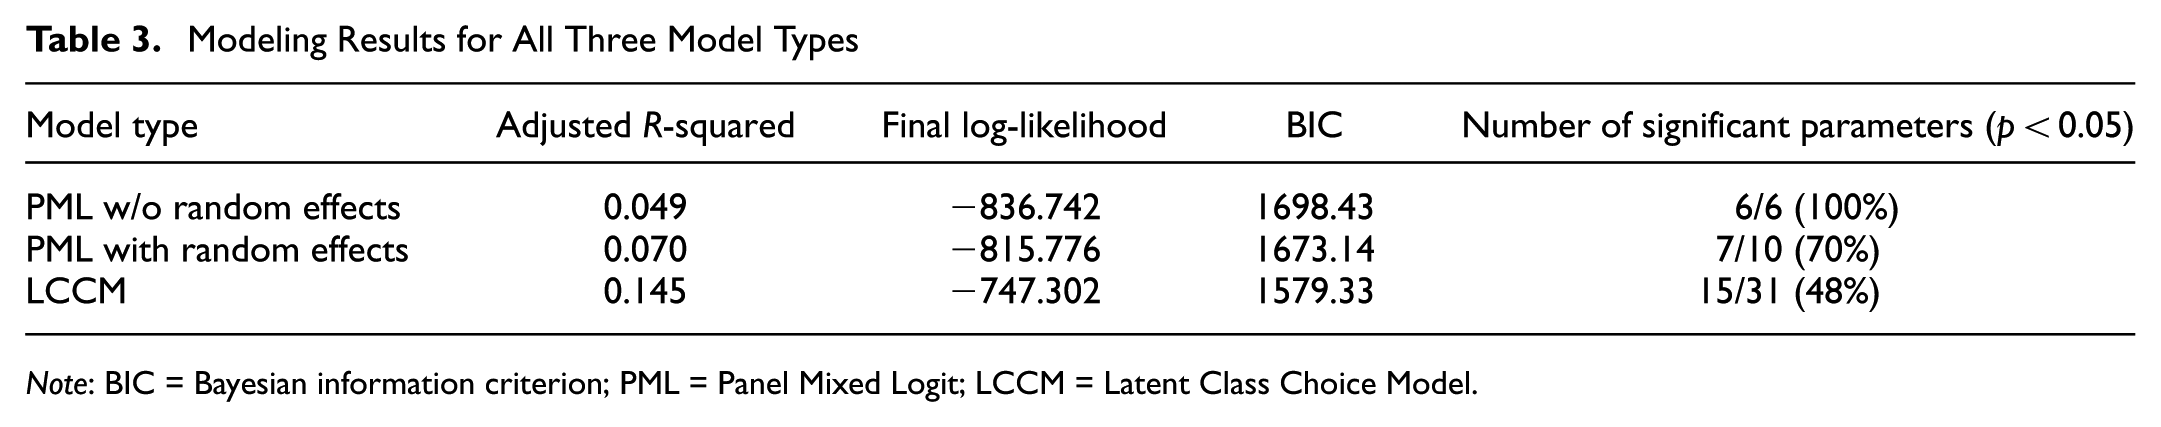
Note: BIC = Bayesian information criterion; PML = Panel Mixed Logit; LCCM = Latent Class Choice Model.
Panel Mixed Logit Model
The best PML models are depicted in Tables 4 and 5. A comparison of the first and second models showed that introducing taste heterogeneity shifted the parameter means toward more extreme values. As a result, the PML with random effects could better capture the choice behavior of the participant sample (see Table 3), therefore, this model is further explored below.
Panel Mixed Logit Model without Random Effects Parameter Estimates
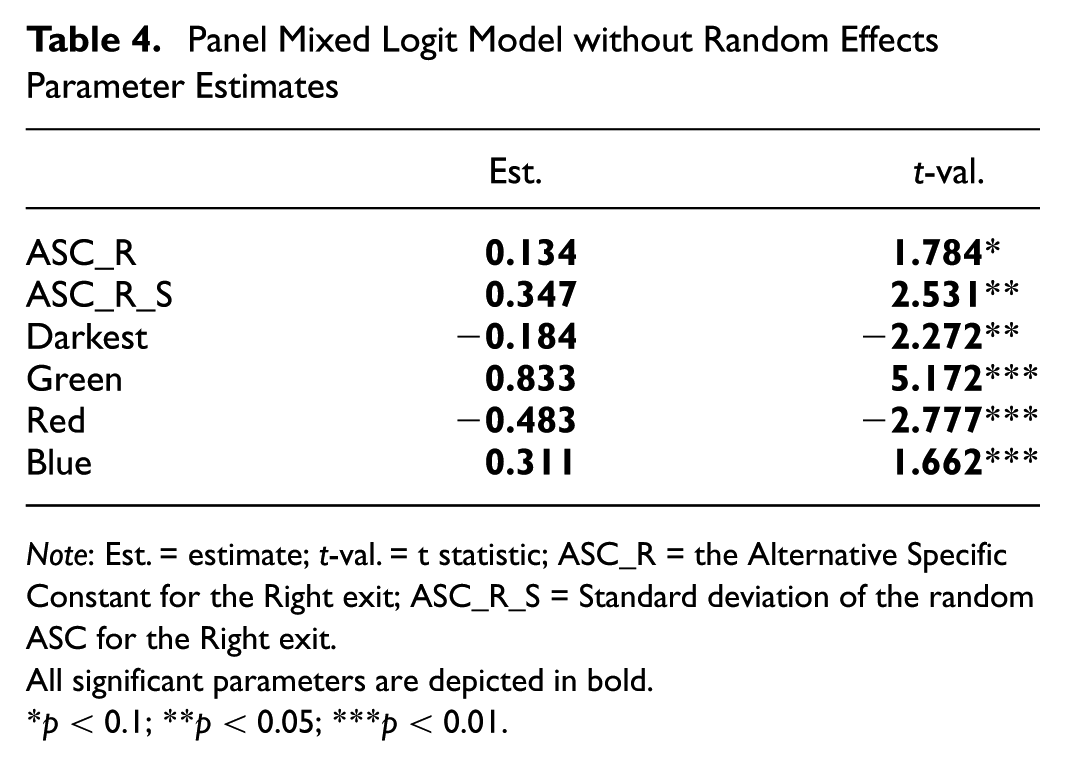
Note: Est. = estimate; t-val. = t statistic; ASC_R = the Alternative Specific Constant for the Right exit; ASC_R_S = Standard deviation of the random ASC for the Right exit.
All significant parameters are depicted in bold.
p < 0.1; **p < 0.05; ***p < 0.01.
Panel Mixed Logit Model with Random Effects Parameter Estimates
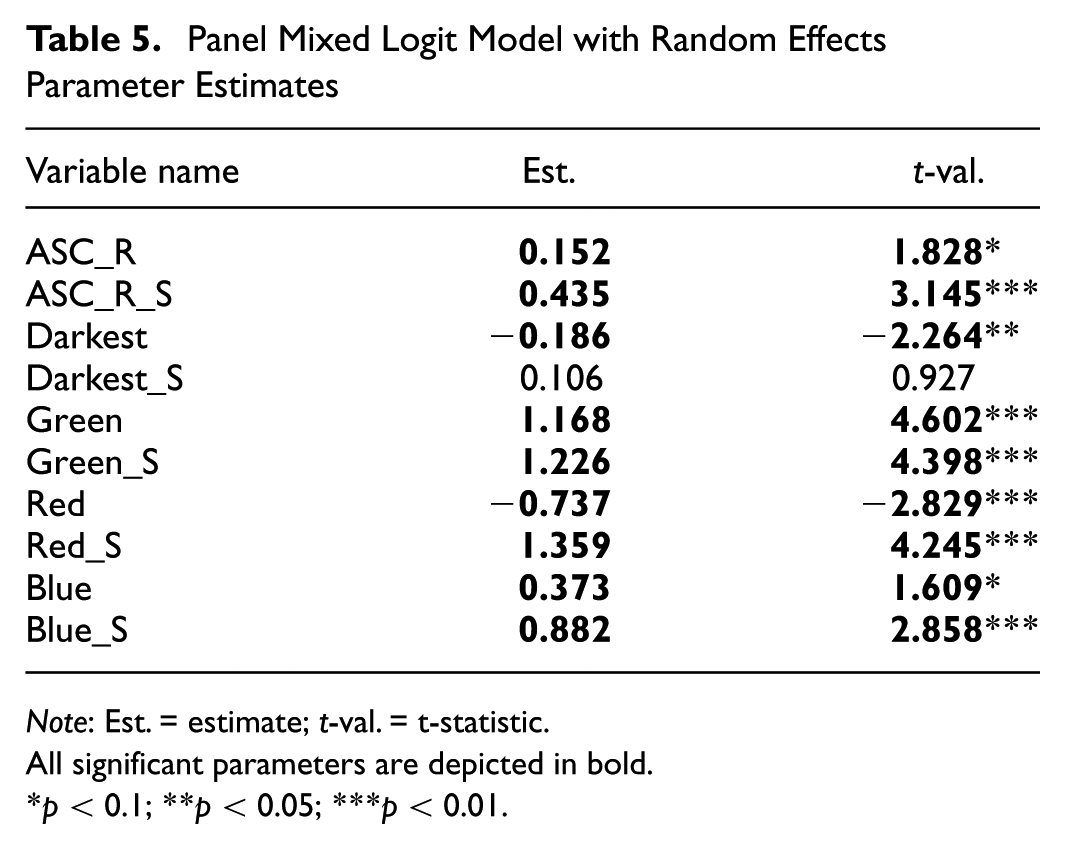
Note: Est. = estimate; t-val. = t-statistic.
All significant parameters are depicted in bold.
p < 0.1; **p < 0.05; ***p < 0.01.
The PML model with random effects showed that the participant sample had a slight average bias toward the right (i.e., ASC_R > 0). Moreover, the participants chose, on average, green and blue corridors and tried to avoid the red and relatively darker corridors. These effects are in line with the statistical analysis of van Beek et al. ( 3 ). Yet, the sample’s PML with random effects also showed considerable taste heterogeneity. For all parameters, the standard deviation of the random variable (“variable”_S) was higher than the average, signaling that a part of the population was inclined to do the opposite (i.e., move toward the red and dark corridors, avoid the green and blue, or both). The question is whether this signals systematically different choice strategies in the population sample, random taste heterogeneity, or learning. The LCCM model could identify whether different choice strategies were adopted.
LCCM Model
For the final LCCM model, we first determined the optimal number of segments using a static class membership function in line with ( 19 ). We adopted three criteria to determine the optimal number of classes: (1) the highest adjusted R-squared, (2) the lowest BIC score, and (3) the smallest segment size to be more than 10%. Based on these three criteria, the two- and three-class models were found to be acceptable (see Table 6). There was little difference between the scores of LCCM with two and three segments. Therefore, we chose to further specify the two- and three-segment LCCMs. After specifying the full LCCMs, the three-segment model yielded the best BIC scores, which is analyzed below.
Number of Segments in the Static LCCM and their Respective Model Fits and Characteristics
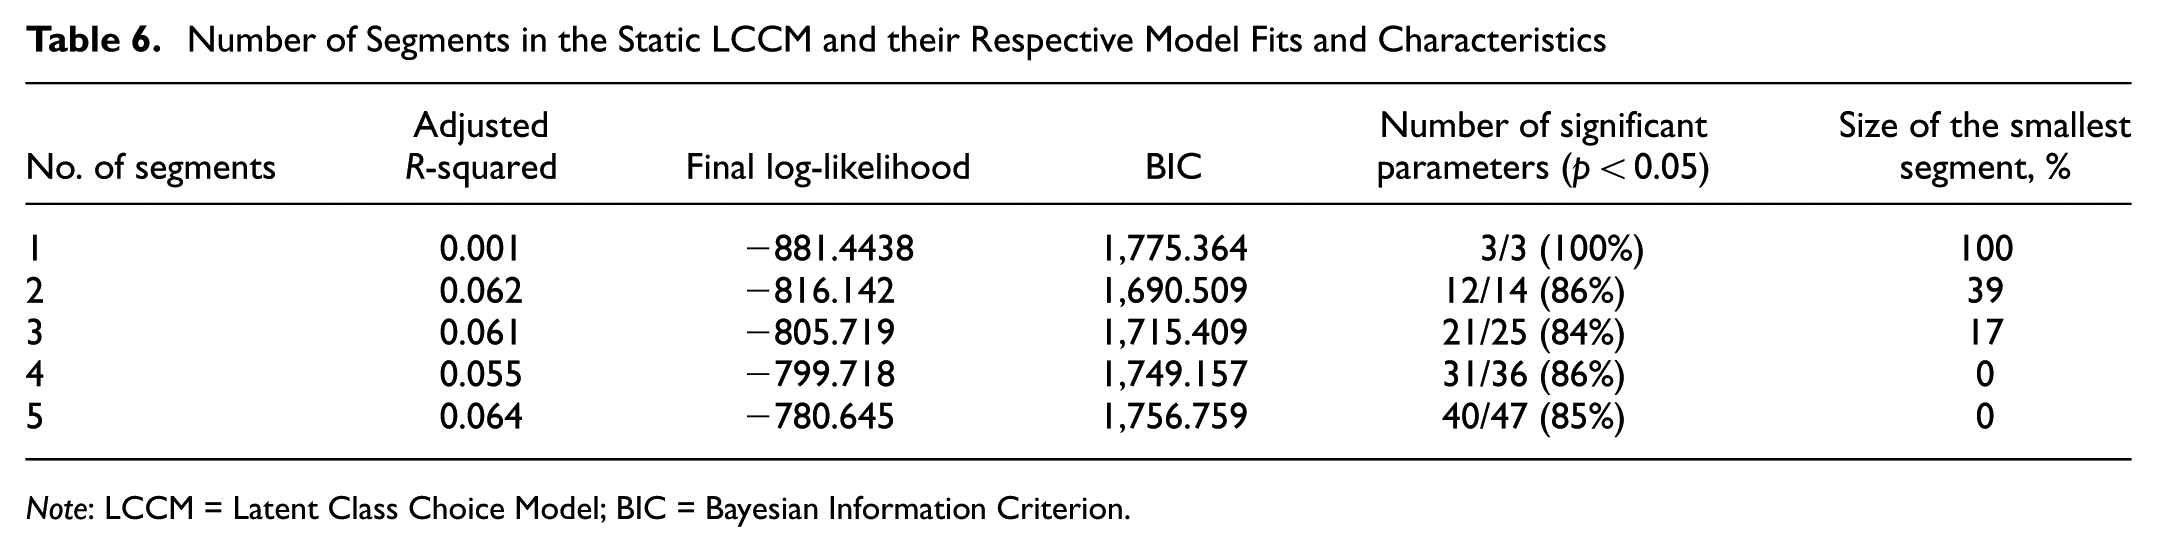
Note: LCCM = Latent Class Choice Model; BIC = Bayesian Information Criterion.
The best LCCM is presented in Table 7. This model features three segments. The segments were named based on their sociodemographic and strategy characteristics:
Segment 1: Light-sensitive individuals,
Segment 3: Darkness-sensitive individuals, and
Segment 2: Right-biased individuals.
Latent Class Choice Model Parameter Estimates and Class Allocation Parameters
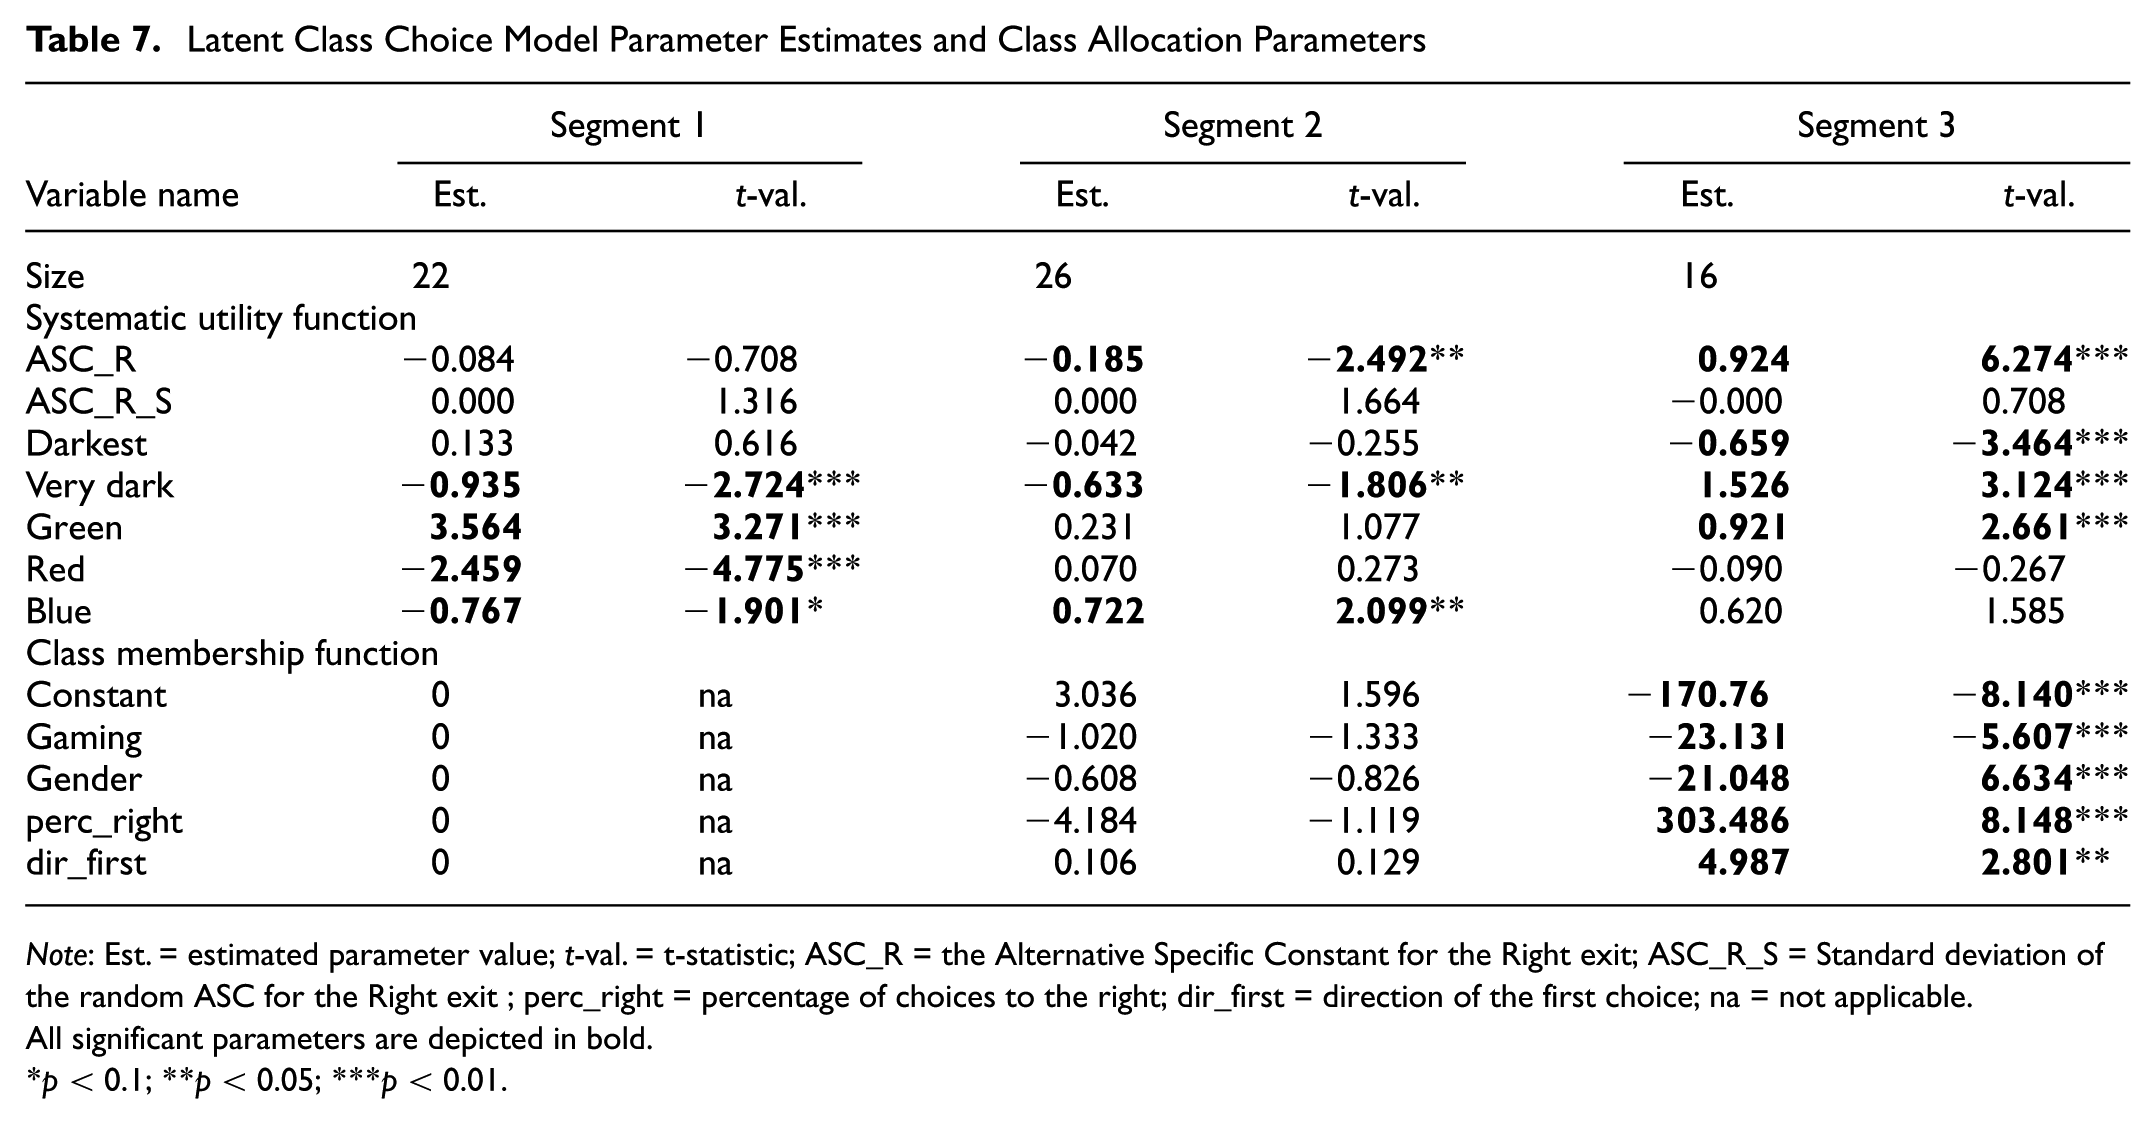
Note: Est. = estimated parameter value; t-val. = t-statistic; ASC_R = the Alternative Specific Constant for the Right exit; ASC_R_S = Standard deviation of the random ASC for the Right exit ; perc_right = percentage of choices to the right; dir_first = direction of the first choice; na = not applicable.
All significant parameters are depicted in bold.
p < 0.1; **p < 0.05; ***p < 0.01.
We further characterize the three segments in the following paragraphs.
Segment 1: Light-Sensitive Individuals
The light-sensitive participants were sensitive to both differences in color and brightness levels. A relatively large number of people in this segment had experience with computer games. Note that the entire population was relatively young, thus, gaming was not a proxy for age. However, the gaming experience might have preconditioned the participants to be more alert to light signals in virtual environments.
The light-sensitive participants generally avoided the “very dark” lighting conditions. Surprisingly, this was the only brightness level specified within this segment’s LCCM model. Other brightness conditions (i.e., dark, neutral, bright, and very bright) did not affect the participants’ probability of choosing a particular corridor.
The light-sensitive participants were inclined to avoid red corridors and move toward green corridors. In addition to that, the exact color combination was found to affect the probability of choosing a corridor. A simulation of choice probabilities (see Figure 4) showed that participants responded most strongly to the red–green (left–right) color combination. Approximately 99.7% of the participants chose to avoid the red corridor on the left, whereas 91.4% and 83.7% of the participants adopted the right-hand corridor in the red–white and red–blue combinations. Light-sensitive individuals were also drawn toward green corridors. In this case, the percentage of participants choosing the green corridor depended on the color combination: green–red was the strongest combination (99.7%), followed by blue–green (98.5%) and green–white (97%).
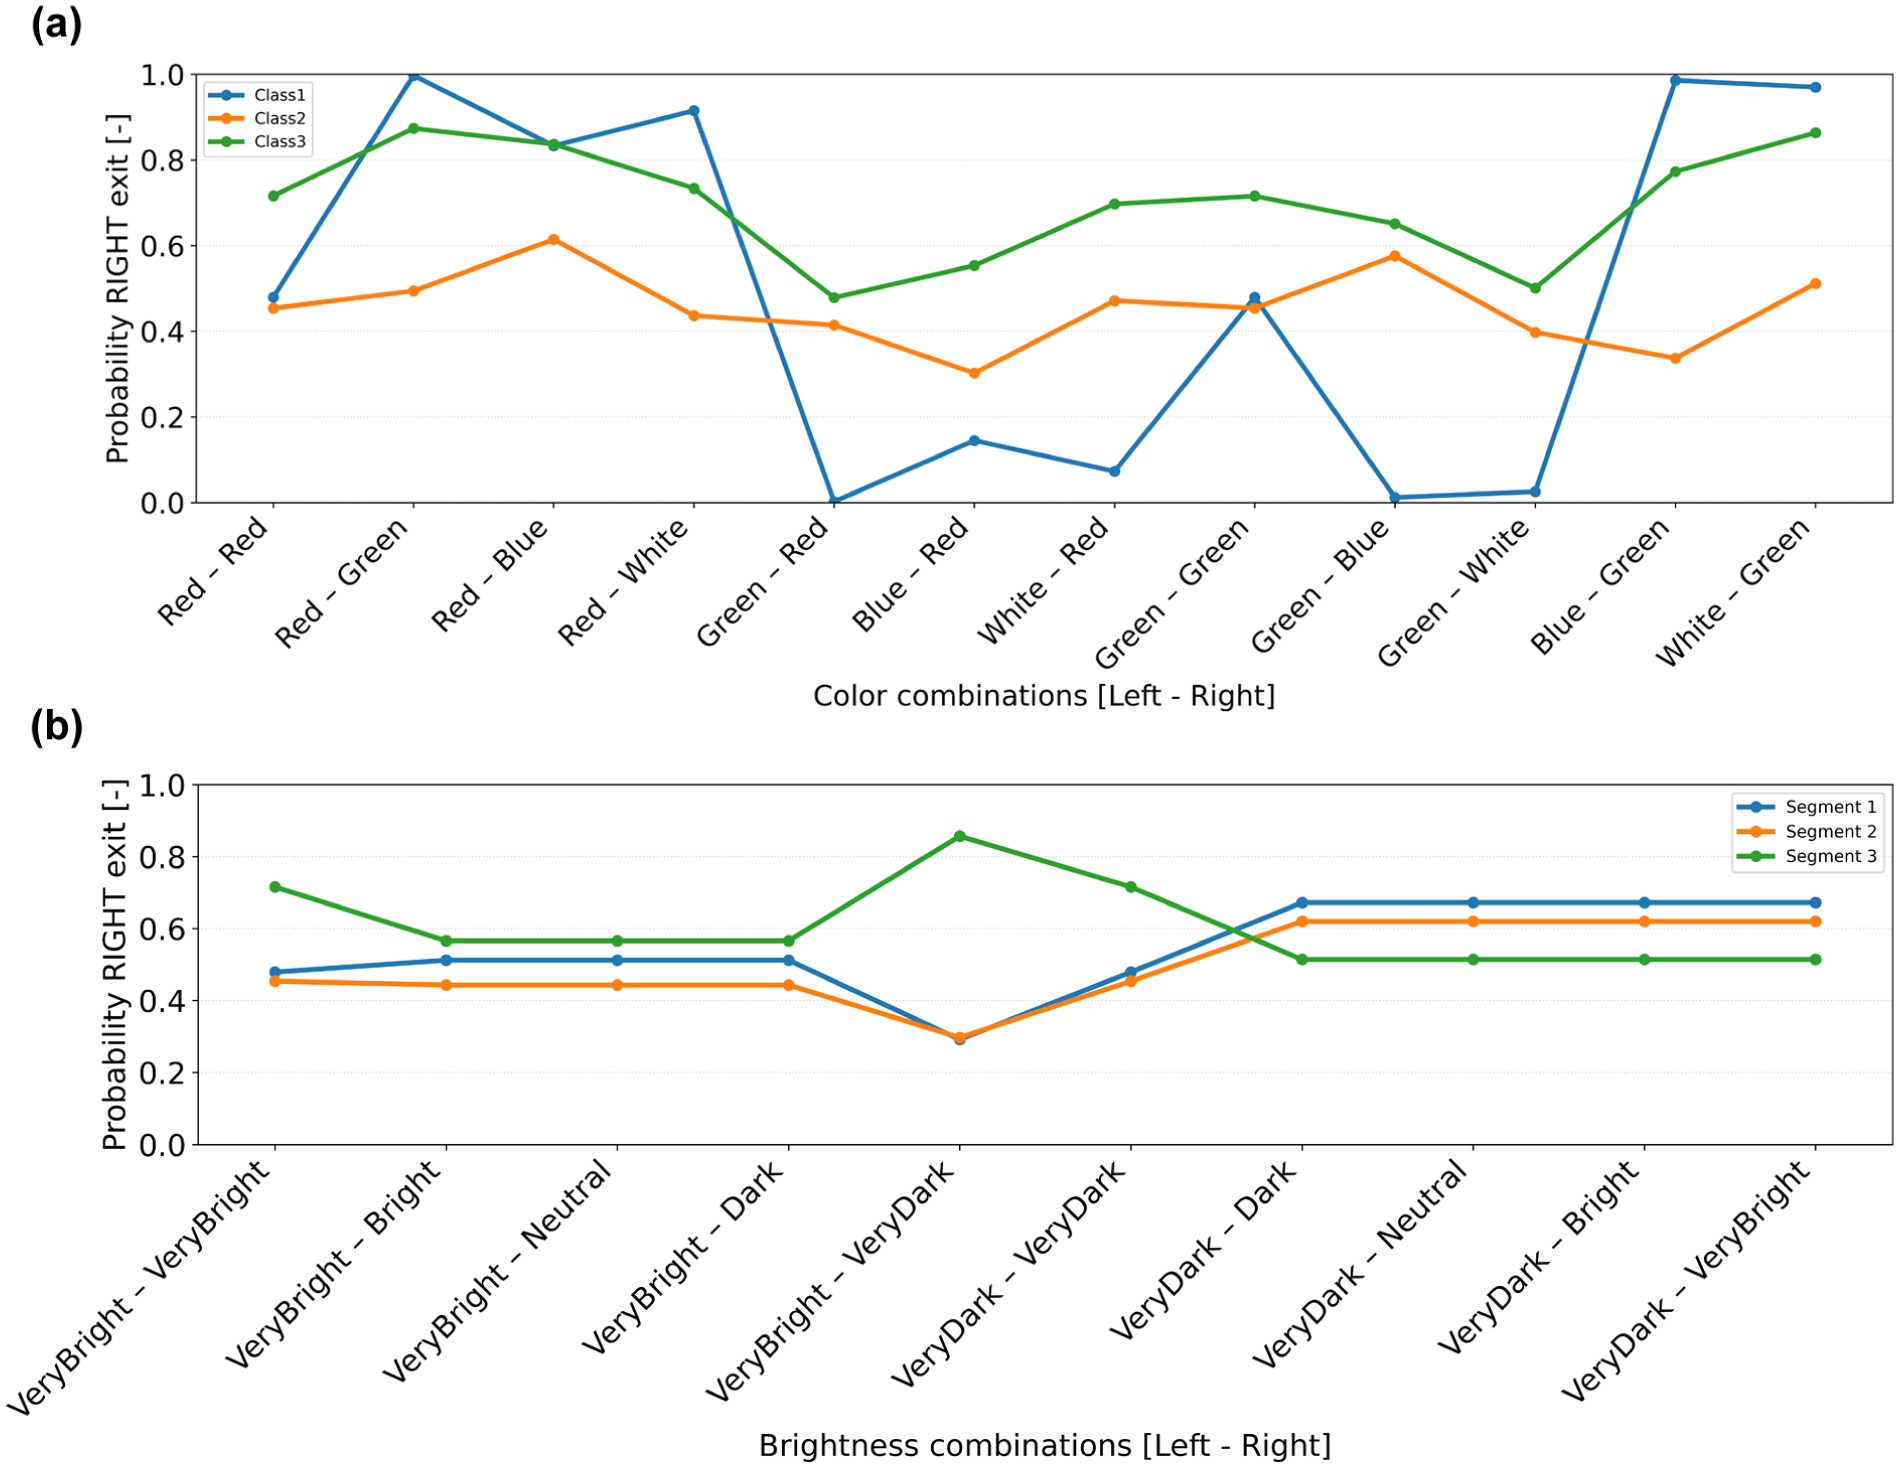
Simulation of the probability of choosing the right corridor for varying (a) color combinations, and (b) brightness combinations.
To our surprise, Segment 1 had no left- or right-handed bias. This was counterintuitive, as van Beek et al. identified an average bias toward the right-hand corridor ( 3 ). This might be because van Beek et al. (2024) did not segment the participant sample, nor did the PML ( 3 ). A right-handed bias was found in the LCCM, but this bias was only allocated to the subset of participants that most clearly displayed this type of bias.
Segment 2: Darkness-Sensitive Individuals
The second segment was less sensitive to the lighting conditions. What set this group apart was their lack of gaming experience and a relatively low percentage of right-hand turns. These participants only reacted to a subset of the brightness and color levels.
Like the light-sensitive individuals, the darkness-sensitive individuals avoided very dark conditions, though to a lesser extent. Furthermore, these individuals were not influenced by the other brightness conditions. This might signal that darkness-sensitive individuals primarily avoid darkness rather than being drawn to brighter lighting conditions. A simulation of the choice probability for the right-hand corridor showed that the choice behavior of the darkness-sensitive participants was relatively stable, fluctuating slightly around 50% (see Figure 4).
In contrast to the light-sensitive individuals, darkness-sensitive individuals were not influenced significantly by the red and green lighting conditions. Moreover, darkness-sensitive individuals were drawn to the blue light rather than avoiding blue corridors. It is unclear to the researchers why this was the case. Potentially, this effect may have been driven by curiosity. More research is required to understand this effect.
Segment 3: Right-Biased Individuals
The third segment of the participant sample had an explicit preference for the right-hand corridor. As a result, participants in this segment tended to choose the right-hand corridor in the neutral–neutral scenario (dir_first = 1) and made a relatively high percentage of choices toward the right.
In addition, these participants were most sensitive to brightness levels in the corridors. The Darkest parameter was negatively significant for this segment, signaling that these participants avoided the relatively darker corridors. Furthermore, this segment had a positive VeryDark parameter, suggesting that the participants preferred the VeryDark corridor. This was very counterintuitive. The VeryDark might function as an offset to the Darkest parameter. More research is required to determine whether this was a modeling artifact or actual behavior.
The third segment had a pronounced preference for green corridors. In most cases, this created a similar trend in the choice pattern to the participants in Segment 1, yet the pattern was far less pronounced and shifted as a result of the right-handed bias. In particular, right-biased individuals often chose the right-hand corridor under all color/lighting conditions. Nonetheless, the probability that they would not do so increased when blue and green lighting conditions were depicted on the left-hand corridor or red lighting appeared on the right-hand corridor.
Discussion
In this section, we reflect on the experimental findings in light of the hypotheses formulated earlier. The discussion is organized into three parts, each addressing a distinct set of expectations about how pedestrians would respond to variations in lighting conditions. First, we examine the results related to H1 and H2, which concern whether pedestrians avoid DARK and walk toward BRIGHTLY illuminated exits. Second, we discuss the findings for H3 and H4, which evaluate the extent to which pedestrians avoid RED and are attracted to GREEN lighting conditions. Finally, we discuss the findings for H5, which evaluate the heterogeneity of pedestrian responses to light-based nudges.
Hypotheses 1 and 2: Avoid the Dark, Walk Toward Bright
When comparing the PML and LCCM results with the findings of other researchers, we noted three things. Firstly, most previous studies on the impact of light brightness on pedestrian choice behavior show that pedestrians prefer to walk toward brighter (natural) lighting conditions ( 5 , 6 , 20 ). Our study did not entirely corroborate these previously reported effects. Specifically, we did not find sufficient evidence to support H1 or H2. We only established that a section of the participant sample had an aversion to very dark lighting conditions. Rather than walking toward the bright conditions, most participants moved away from the darker lighting conditions. When given a choice between neutral and bright lighting conditions, the choice behavior of many participants was random, but signaling that the participants had a slight preference for one over the other.
Hypotheses 3 and 4: Avoid Red, Walk Toward Green
We found that, on average, red and green were more effective at guiding behavior than blue and white. In particular, we found that pedestrians avoided red and were attracted by green lighting conditions, which supports H3 and H4. Both colors have a strong cultural meaning in the Netherlands (i.e., red: stop/wrong and green: go/good)—even more so for gamers, who often encounter red and green as signaling colors in their gaming environments. This suggests that our response to colored lighting is partly a trained response that becomes habitual over the years. This indicates that the impact of colored lighting should always be put into perspective to the context in which one wants to use colored light conditions to manage a crowd. The colored lighting conditions employed should match local expectations and context.
Hypothesis 5: People Respond Differently to Light-Based Nudges
Previous studies on the impact of colored lighting on pedestrians’ choice behavior have yielded mixed results. For instance, the participants in Ronchi et al.’s study preferred walking toward the green and white corridor signs ( 4 ), whereas those in Olander et al.’s research preferred the red corridor signs ( 21 ). Our PML model showed that, in general, our participant sample avoided red and dark lighting conditions and moved toward green and blue light. At the same time, our LCCM identified that the exact average result also depended on the relative size of the segments present within the participant sample. This study showed that some participants were sensitive to red (light-sensitive individuals), whereas others were not (darkness-sensitive and right-biased segments). As a result, participants’ responses to lighting conditions differed depending on the segment they belonged to. Some were drawn toward a color (darkness-sensitive), but others were pushed away by the same color (light-sensitive individuals). To conclude, H5 was supported by the findings of this experiment.
Conclusions and Future Works
In this study, we developed a mathematical model to describe the impact of lighting brightness and color on pedestrian route-choice behavior. Data from an experimental VR study were used to estimate two discrete-choice models: a PML and an LCCM ( 3 ).
We found that, on average, our participants avoided red and dark corridors and chose green and blue corridors. The color green was most effective at drawing people toward a particular corridor. However, differences in light sensitivity were found when the participant sample was divided into three segments (i.e., light-sensitive individuals, darkness-sensitive individuals, and individuals with a right-handed bias). The combination of colors and brightness levels that most effectively steered participants’ choice behavior differed significantly across these segments.
The results imply that pedestrians’ choice behavior could be nudged in the right direction using relative changes in the lighting conditions. Both brightness and color were shown to be effective. In a practical setting, this means that one could potentially steer a proportion of a crowd toward an intersection in two ways: (1) by decreasing the light intensity of the corridors that one does not want the crowd to choose, or (2) by coloring the overhead lighting green at the beginning of the corridor that one wants the crowd to choose, and coloring the beginning of all other corridors leading up to the intersection red. Regardless of how one steers, the findings also suggest that light-based nudges can only steer a small portion of the crowd, and that one is more likely to sort effect with light-based nudging when the preferred corridor is on the right.
However, the results also indicated that one should be careful when applying color schemes to guide pedestrians, as the interpretation of the colors was population (and potentially context) dependent. Within the Dutch context, the combination of red–green (avoid–move toward) was found to be most effective. However, color preferences are expected to differ in other parts of the world where red and green may have different meanings. Therefore, we recommend first testing any practical application of light nudging in a safe (controlled) setting (e.g., a train station or a shopping center) before using it during a potentially tense crowd-management scenario featuring large-scale crowd dynamics.
Some future work is required to put our findings into perspective. First, we used a convenience sample of young participants and identified three distinct segments. More research is necessary to understand the extent to which these segments represent the general population. Secondly, this experiment only studied the choice behavior of individual participants. It is currently unclear whether light nudging remains effective when other behavioral effects, such as herding and goal orientation, are present. Thirdly, we studied large apparent differences in lighting conditions. It would be interesting to see the minimum relative difference in light brightness and color that could effectively steer pedestrians’ choice behavior. Fourthly, in this study we applied the basic PML and LCCM models. Future work incorporating sign-constrained coefficient distributions or advanced specifications such as the Latent Class Mixed Logit models (LCML) may provide more in-depth insights into exit-choice behavior. Finally, we adopted a dataset from a VR experiment to estimate our discrete-choice models. Even though the immersion scores for the VR environment and the experimental design were good, validation through field experiments is still required to corroborate our modeling results. Currently, two large-scale field experiments are being developed and conducted. We hope to present the experiment’s validation results soon.
Footnotes
Acknowledgements
We thank Nejc Geržinic for his constructive feedback during the modeling process.
Author’s Note
While preparing this work, the authors used ChatGPT and Grammarly to improve readability and language. These tools were not involved in the conceptual, methodological, analytical, or interpretative aspects of the research. All scientific content and conclusions remain entirely the work of the authors.
Author Contributions
The authors confirm contribution to the paper as follows: study conception and design: D. C. Duives, A. H. N. van Beek; data collection: A. H. N. van Beek; analysis and interpretation of results: D. C. Duives; draft manuscript preparation: D. C. Duives. All authors reviewed the results and approved the final version of the manuscript.
Declaration of Conflicting Interests
The authors declared no potential conflicts of interest with respect to the research, authorship, and/or publication of this article.
Funding
The authors disclosed receipt of the following financial support for the research, authorship, and/or publication of this article: This research is part of the CrowdIT Space, funded by the Dutch Research Council (NWO, the Netherlands; grant no. 18183).