
Abstract
“Accessibility” refers to people’s ability to reach a location, influenced by factors such as geography, available destinations, and the quality of the transport system. While socio-demographic factors are important determinants of accessibility, often resulting in inequalities, limited research has examined accessibility specifically for women. This is particularly true for mothers, who can have unique travel patterns and needs because of responsibilities in caring for and transporting children, often requiring adjustments to their travel to accommodate others. This study aims to understand the extent to which there is a focus on accessibility for women, and to what extent women experience lower accessibility than men. A systematic literature review revealed that, of the 98 studies that examined accessibility by socio-demographic group, only 18 studies specifically considered gender. Very few studies have examined women’s accessibility to destinations with regard to their roles in the household and caring responsibilities. Most studies used catchment-based methods to analyze women’s accessibility. Of the studies that focused on women, we found that women tended to have lower levels of accessibility to destinations than men. Women are more likely than men to have a significant role in caring for households and children, resulting in complex travel patterns. Several studies have shown that public transportation systems in some cities still do not meet these travel needs. Several research gaps need to be addressed, such as understanding the differences in women’s accessibility based on their roles, modes of transportation used, and travel purposes.
Keywords
Introduction
“Accessibility” refers to the capability of reaching destinations, constituting a crucial metric within the transport system as it jointly evaluates the performance of the transport and land use systems ( 1 ). The presence of varying accessibility contributes to societal inequality, exemplified by some places that can only be reached easily with a private car, and this condition creates inequality for public transport users. Furthermore, even with comparable transport services and land use configurations, diverse socio-demographic groups may encounter disparate accessibility levels because of capability constraints (e.g., disability), coupling constraints (e.g., school pick-up/drop-off), and authority constraints (e.g., operational hour restrictions) ( 2 ). Because of everyone having different conditions and constraints, it becomes imperative to scrutinize accessibility at the individual level.
Numerous recent studies have tried to elucidate the variations in accessibility among diverse socio-demographic cohorts. Some research has sought to delineate accessibility disparities based on income and differences between age groups, such as older adults and youth ( 3 – 5 ). Many literature review papers about accessibility have been published, and some try to compare one method with another ( 2 , 6–8). To the authors’ knowledge, none have itemized and compared accessibility between different socio-demographic groups, even though each group has different accessibility needs from the others.
One of the crucial groups that still receives less attention in accessibility literature is women. Based on travel behavior studies, on average, women within heterosexual family units shoulder more household responsibilities than their male counterparts ( 9 ). Additionally, women are more prone to have shorter commute distances, engage in a higher number of non-work-related trips, and are more inclined to “trip chain”—making multiple stops for various purposes ( 10 ). Additionally, women are more likely to travel during off-peak hours and opt for flexible modes of transportation ( 10 ). However, the precise implications of these patterns on the accessibility of a destination for women, distinct from men, remain unclear.
This lack of information about accessibility has potential repercussions for women and the broader economy. Based on a study conducted by the Australia-Indonesia Partnership for Economic Governance in 2019, 31% of women have refused a job because of transportation problems ( 11 ). In addition, this study also shows that 14.4% of women with children under 5 years old have stopped working because of transportation problems ( 11 ). Considering that women make up half the population, their active participation in economic activities holds significant potential to contribute to the overall development of a nation’s economy.
Given the different travel behaviors women show, it is important to investigate potential gaps in transportation accessibility between women and men. This study aims to understand the extent to which the academic literature attempts to consider women’s accessibility by first explaining how gender is discussed in accessibility studies compared with other socio-demographic groups. In addition, the findings focused on gender/women will be discussed, and research gaps will be identified by building on these findings. We acknowledge that “gender” is more than a binary distinction, and that non-binary individuals experience distinct accessibility challenges ( 12 ). However, in this study, we adopt the most common practice in the transport literature, which is to focus on the two genders of men and women.
Methods
This section is structured into three components. The initial subsection outlines the methodology and screening criteria employed for the systematic literature search. The second part presents the results from the systematic literature search. The final subsection explains the classification process applied to the identified papers, facilitating a more streamlined comparison and discussion of their content.
Systematic Literature Search Method
The systematic literature search method is a well-established approach to systematically seek, evaluate, and synthesize research evidence (
13
). To comprehensively identify accessibility literature on specific socio-demographic groups, the following search terms were applied to search papers through Scopus and Web of Science: TITLE-ABS-KEY (transport*) AND TITLE-ABS-KEY (accessibility) AND TITLE-ABS-KEY (demographics OR gender OR women OR men OR mother* OR age OR youth OR young OR elder OR children OR *income OR *employed OR race)
Subject field codes were instrumental in refining the search results. For Scopus, the selection was limited to social sciences, psychology, engineering, and multidisciplinary papers. Subject fields included in the Web of Science are transportation, engineering, geography, urban studies, social science other topics, sociology, behavioral science, women’s studies, and psychology. Additionally, to maintain uniformity, only papers published in English underwent review.
Two inclusion criteria were used to identify relevant papers:
Focused on spatial accessibility
Measuring the accessibility of a group or differences between socio-demographic groups
In addition, the following criteria were used to exclude papers we considered out of scope:
Literature review papers
Papers considering physical disability
Papers focusing on walkability
Papers focusing on rural areas
Research about extremely specific conditions such as accessibility during emergency evacuations
Scenario modeling
The first author led the systematic search. If there was any uncertainty about inclusion/exclusion, the authors met to discuss whether the paper would be included or excluded in the review process.
Search Outcomes
Table 1 shows that 10,211 papers were initially identified. However, after applying the criteria of being written in English and having relevant subject fields, the count was narrowed to 5,157. Subsequently, all identified papers were imported into Covidence, an online systematic review management program, where 1,229 duplicate papers were identified and subsequently removed. Consequently, a total of 5,157 unique papers underwent review in Covidence.
Methodological Database Search for Relevant Studies
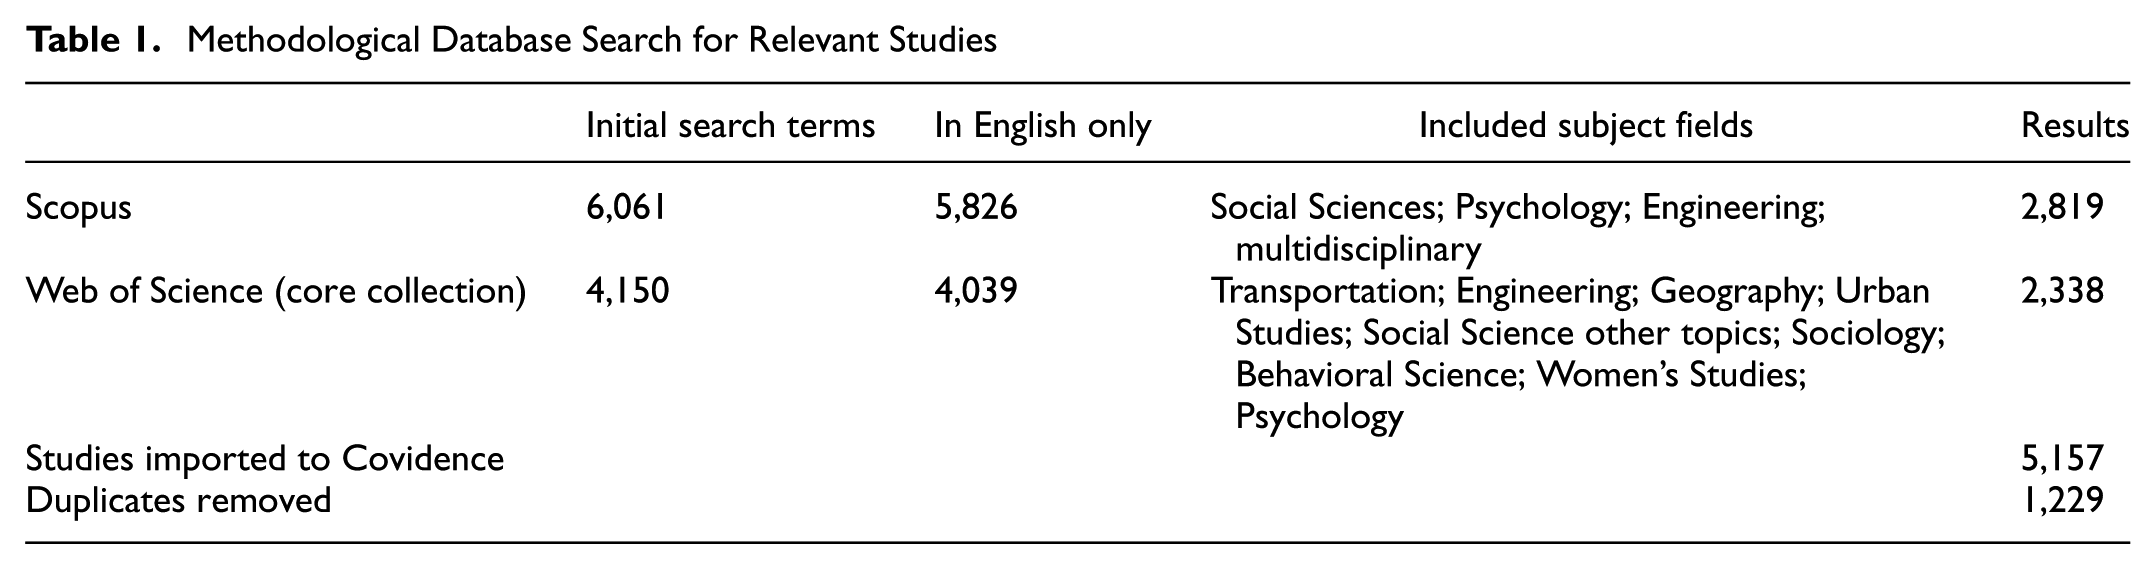
Figure 1 shows 3,928 papers were reviewed based on their titles and abstracts, adhering to the inclusion/exclusion criteria outlined in the previous section. From this initial review, 328 papers advanced to the full-text review stage. Six of these papers could not be retrieved. Only 96 of the remaining 328 papers and two from reviewer’s recommendation met the inclusion criteria for discussing spatial accessibility and socio-demographic groups. Among the excluded papers, around 50% did not discuss or distinguish socio-demographic groups, around 28.8% did not specifically address spatial accessibility, and around 7.9% focused on scenario modeling. For the rest of the excluded studies, 16 discussed broad theories such as social exclusion (nine papers), accessibility (five papers), and transportation justice (three papers). Three papers did not measure accessibility and two others discussed walkability instead of spatial accessibility. At the same time, three other studies were excluded because they discussed physical disability, non-transport accessibility, and analysis under specific conditions.
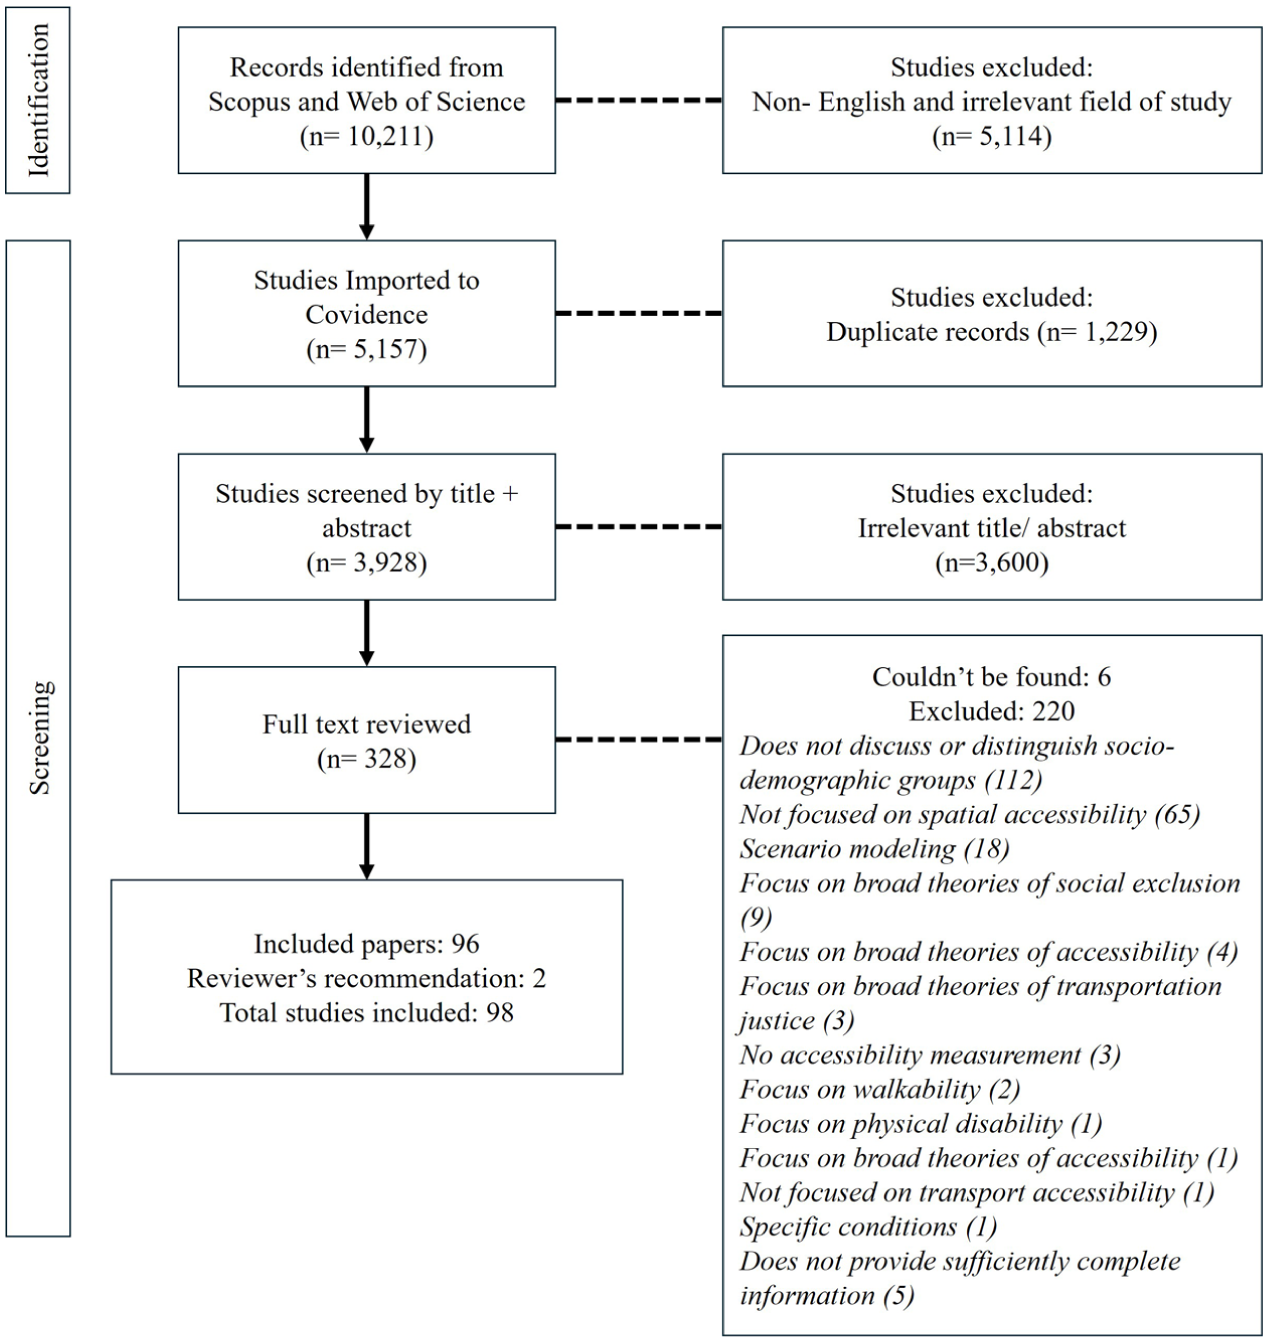
Systematic search (based on PRISMA flow diagram template).
Paper Classification
The 98 papers identified in the search underwent classification based on several categories commonly employed in accessibility research. These categories included the socio-demographic(s) discussed in the paper, such as gender, age, race, income, and/or employment. In addition, the geographical location may affect the result because of the cultural context, so papers were classified based on the continents of Europe, Asia, Africa, North America, South America, and Australasia.
The studies were also categorized based on the accessibility approach (objective accessibility versus perceived accessibility [PAC]) and the measurement methodology that was used. Papers measuring PAC used either a questionnaire or a focus group to quantify accessibility. With regard to objective accessibility, there are seven measurement approaches widely used in accessibility research: cumulative opportunity, gravity, log sum measures, time-space, activity space, two-step floating catchment area (2SFCA), and catchment-based area.
Both cumulative opportunity and gravity methods try to calculate accessibility by considering opportunities in a region as a destination. Consideration of opportunities in cumulative opportunity is related to time or distance from origin to destination so that it is calculated within a particular travel time or distance from a specific location ( 14 ). Meanwhile, the gravity model tries to calculate accessibility by estimating the attractiveness of destinations based on their size (population, employment) and the distance between origin and destination ( 15 ). Log sum measures aggregate individual travel choices into a single measure of utility or accessibility ( 16 ).
Time-space measurement and activity space are disaggregated or person-based approaches.Time-space measurement provides a comprehensive view of mobility patterns by describing an individual s movements in both spatial and temporal dimensions ( 17 ). One study tried to integrate time-space with log sum measurement into what they referred to as log sum-type “space-time accessibility measures” ( 18 ). Meanwhile, “activity space” tries to describe accessibility by considering travel patterns and the location of the activities carried out ( 19 ). The final method is the catchment area, which delineates service areas around facilities based on travel time or distance. Some studies use travel time indicators as indicators of accessibility ( 20 , 21 ). Meanwhile, for the 2SFCA, this method provides a more sophisticated approach by considering both supply and demand factors simultaneously ( 22 , 23 ).
Further Classification of Gender-Based Papers
Concerning the studies incorporating gender, we further classified them based on the analysis approach employed and the travel mode and destinations used to define accessibility. On reviewing papers focusing on gender, two distinct approaches to analyzing the relationship between gender and accessibility were identified (refer to Figure 2). The first approach adopts a comparative method to discuss accessibility, treating gender as a socio-demographic variable. For instance, Guo et al. initially calculated subway accessibility using the 2SFCA method ( 24 ). Subsequently, they analyzed the data to discern accessibility for various groups based on gender, age, and income. In contrast, the second approach utilizes a predictive method, positioning gender as one of the independent variables to forecast accessibility. For example, in the study conducted by Rojas et al., gender was used as one of the characteristics which was then examined to see how it related to forming patterns of potential accessibility to open spaces ( 14 ). The first approach uses descriptive or comparative statistics, while the second approach leans more toward a structural approach, also known as “multivariate analysis,” where gender is analyzed together with other independent variables.
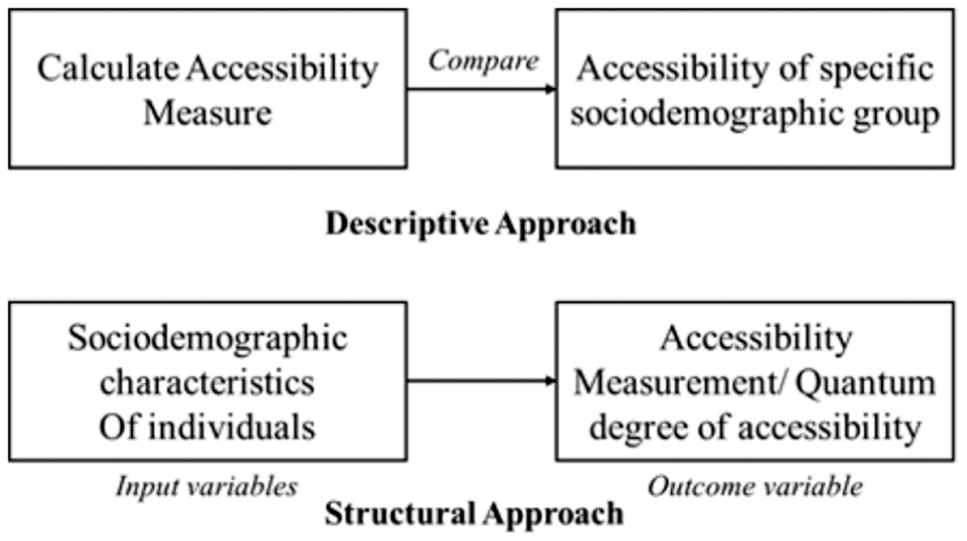
Categorization of the study approaches used in objective accessibility research that considers gender.
Consideration of Socio-Demographic Groups in Accessibility Studies
Table 2 summarizes the 98 papers investigating accessibility across various socio-demographic groups. Of the 98 papers that discuss spatial accessibility, around 87% were published within the last 10 years, with only one paper predating 2000. Out of the 98 papers, 35 studies were conducted in North America, 31 were from Asia, 16 were from Europe, 11 were from South America, 5 were from Australasia, and 1 was from Africa.
Summary of 98 Papers Discussing Accessibility and Socio-Demographics
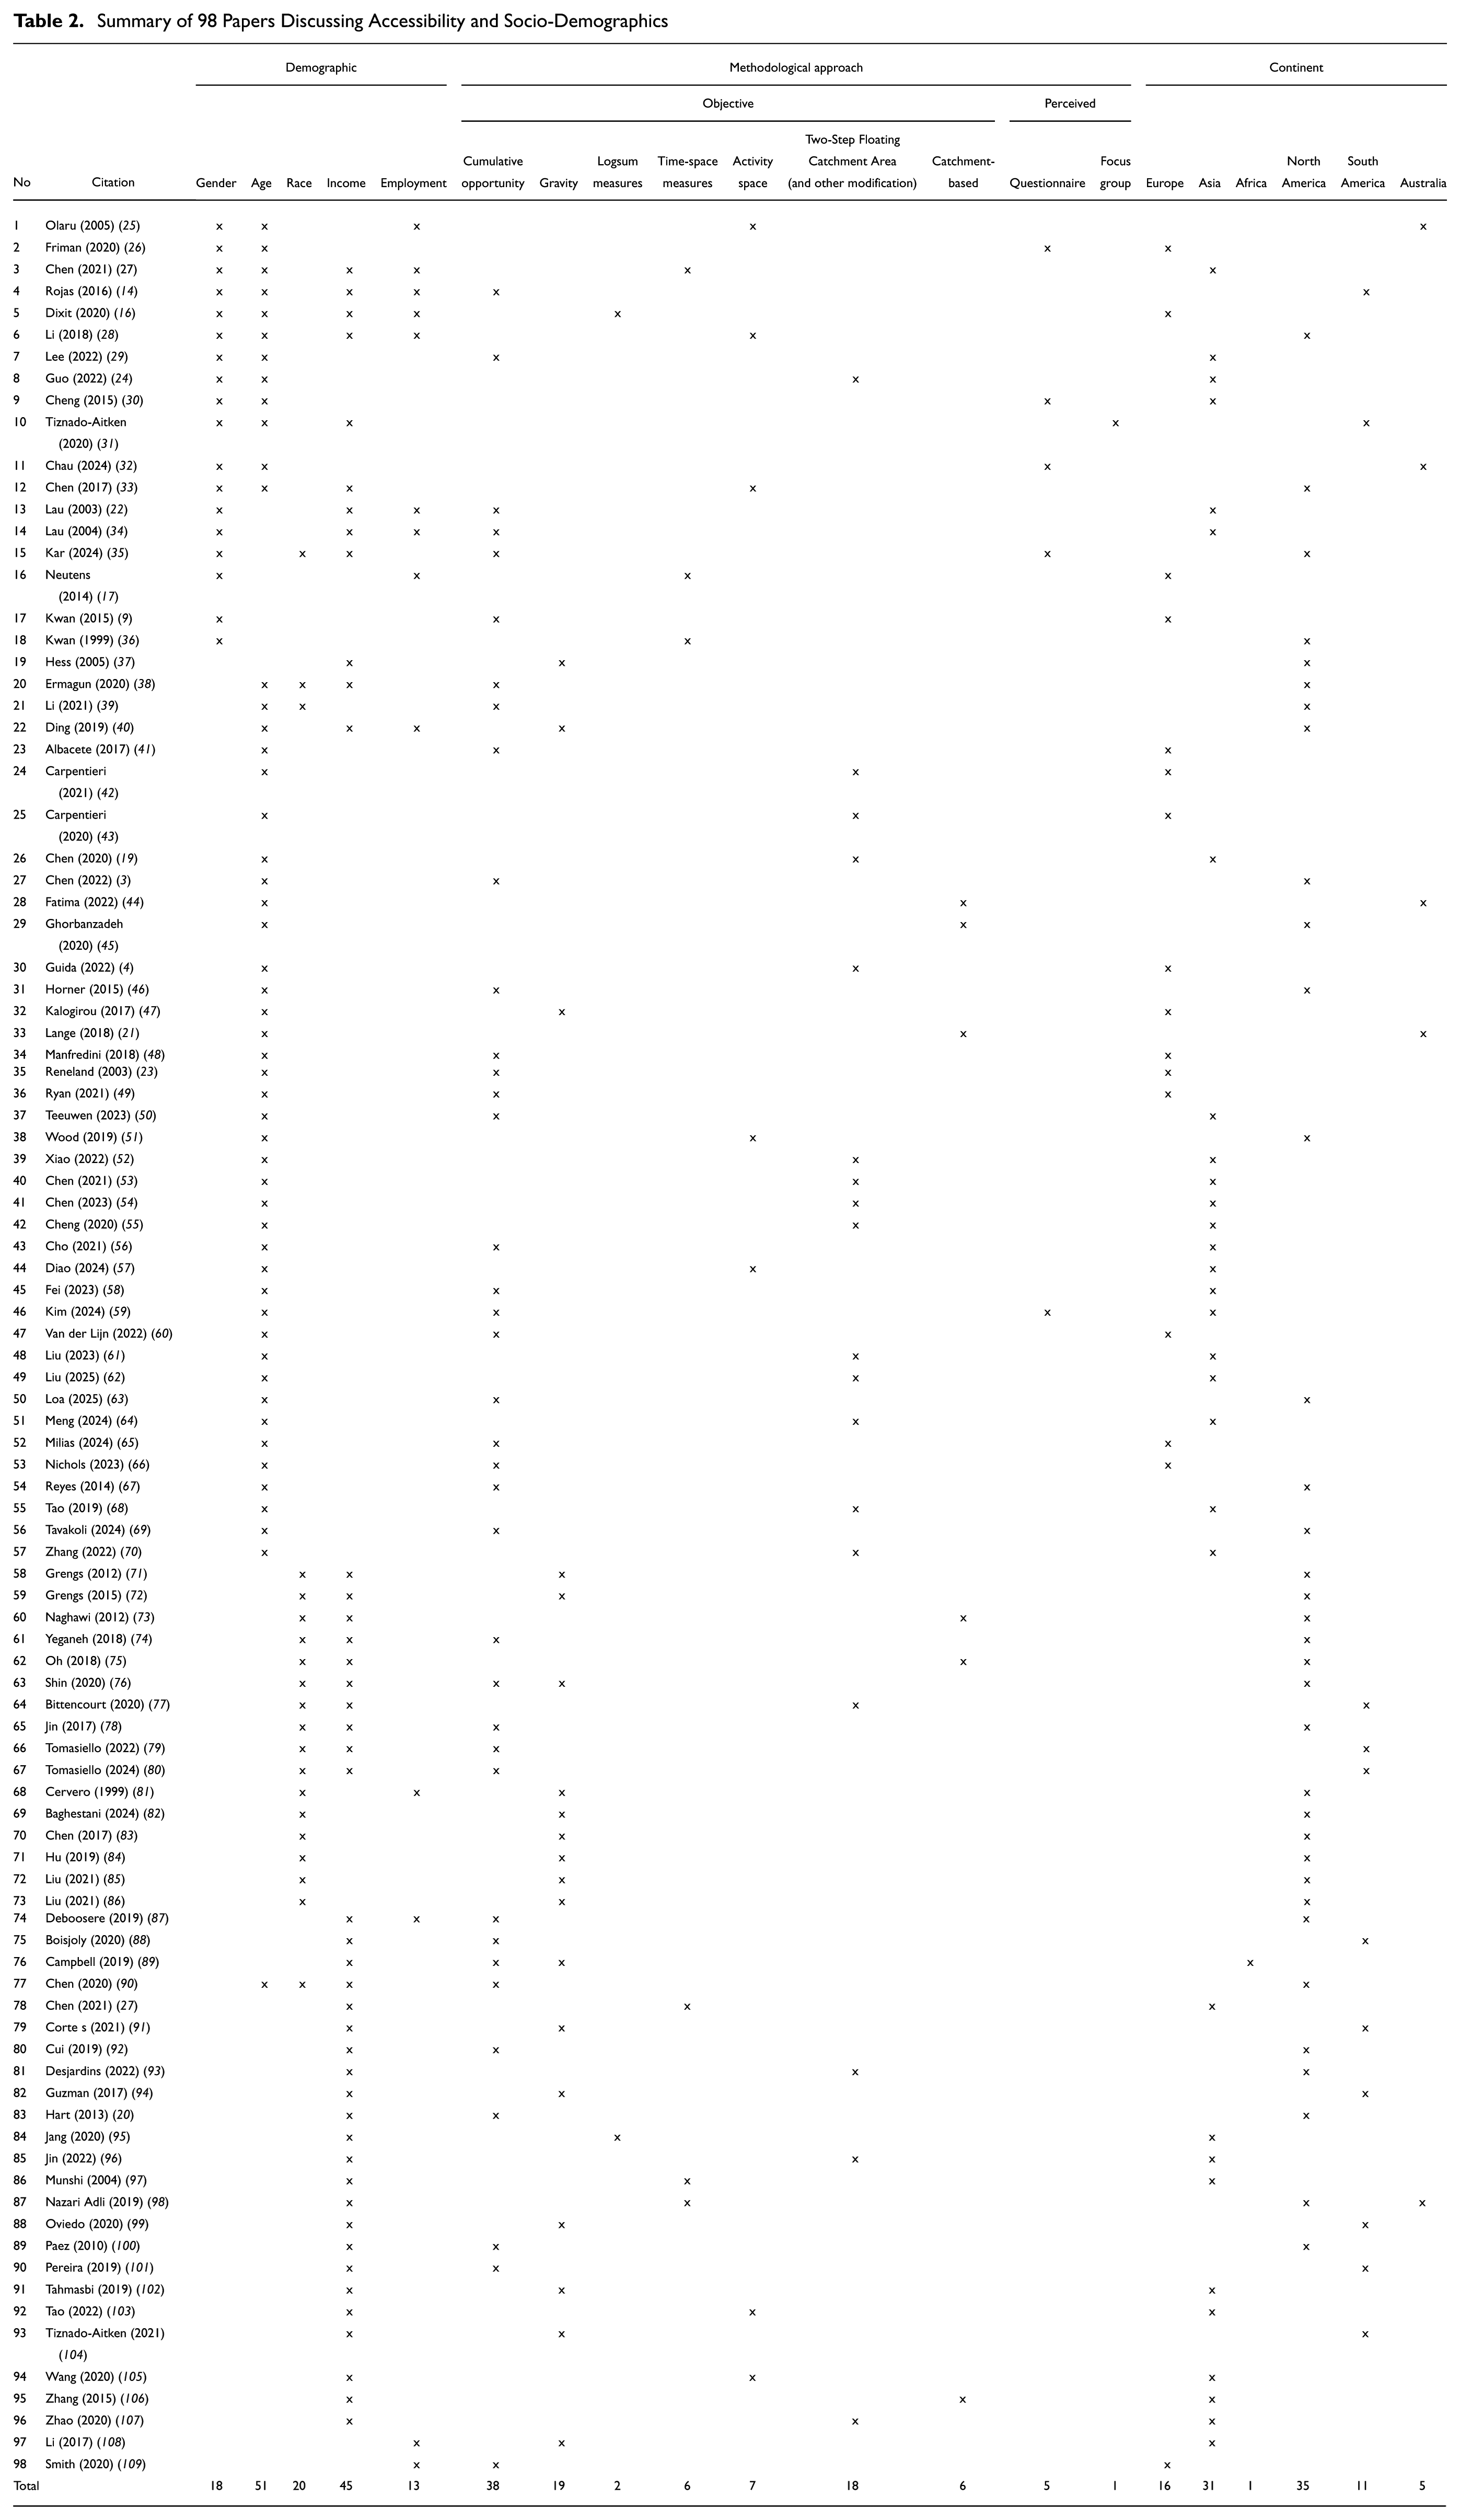
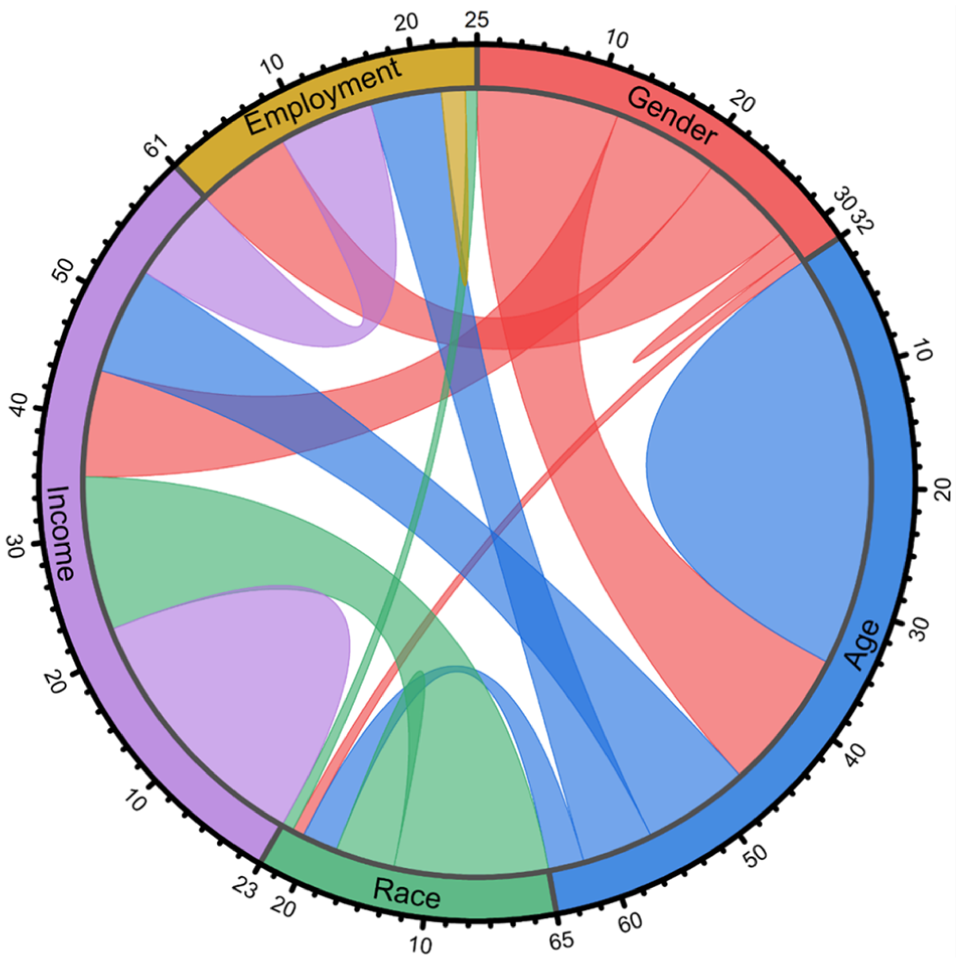
According to Table 2, age and income emerged as the most frequently studied socio-demographics in 51 and 46, respectively, of 99 papers (51.5% and 46.5%, respectively). The subsequent socio-demographics in order of prevalence were race (21 papers), and gender (18 papers), followed by employment status (13 papers). Notably, 66.6% of the papers focused solely on one socio-demographic group, while the remaining papers delved into two, three, or even four socio-demographics within the same study.
Figure 3 A chord diagram illustrating relationships among socio-demographic dimensions discussed in the reviewed papers (n = 98). The outer arcs represent each socio- demographic dimension, and arc length indicates its frequency of occurence. Ribbons connecting arcs indicate dimensions examined together within the same papers; thicker ribbons indicate stronger co-occurrence. Age and income were the most likely socio-demographics to be considered independently. Some studies specifically tailor accessibility measures for older age groups, such as a transit accessibility measure designed for older individuals as proposed by Fatima et al. ( 44 ). Others, such as Wood and Horner, compare accessibility across different age groups ( 51 ). Similarly, in the case of income, some studies concentrate solely on low-income groups ( 20 , 110 ). In contrast, others undertake comparisons across various income brackets.
Relationship between socio-demographics studied across the 98 accessibility papers.
In contrast, papers involving gender, race, or employment status often considered these as additional socio-demographic factors. Notably, race and income were remarkably interconnected, with 65% of studies examining race also including income considerations. Examples of research that explores the intersection of race and income include studies conducted by Aman et al., Shin, and Hess ( 37 , 76 , 111 ). Studies focusing on gender were associated with almost every socio-demographic, frequently examining three or even four socio-demographics in the same study. It is noteworthy that gender and employment are the two demographic characteristics that are least likely to be the sole focus of a study.
Methods Used to Analyze Accessibility
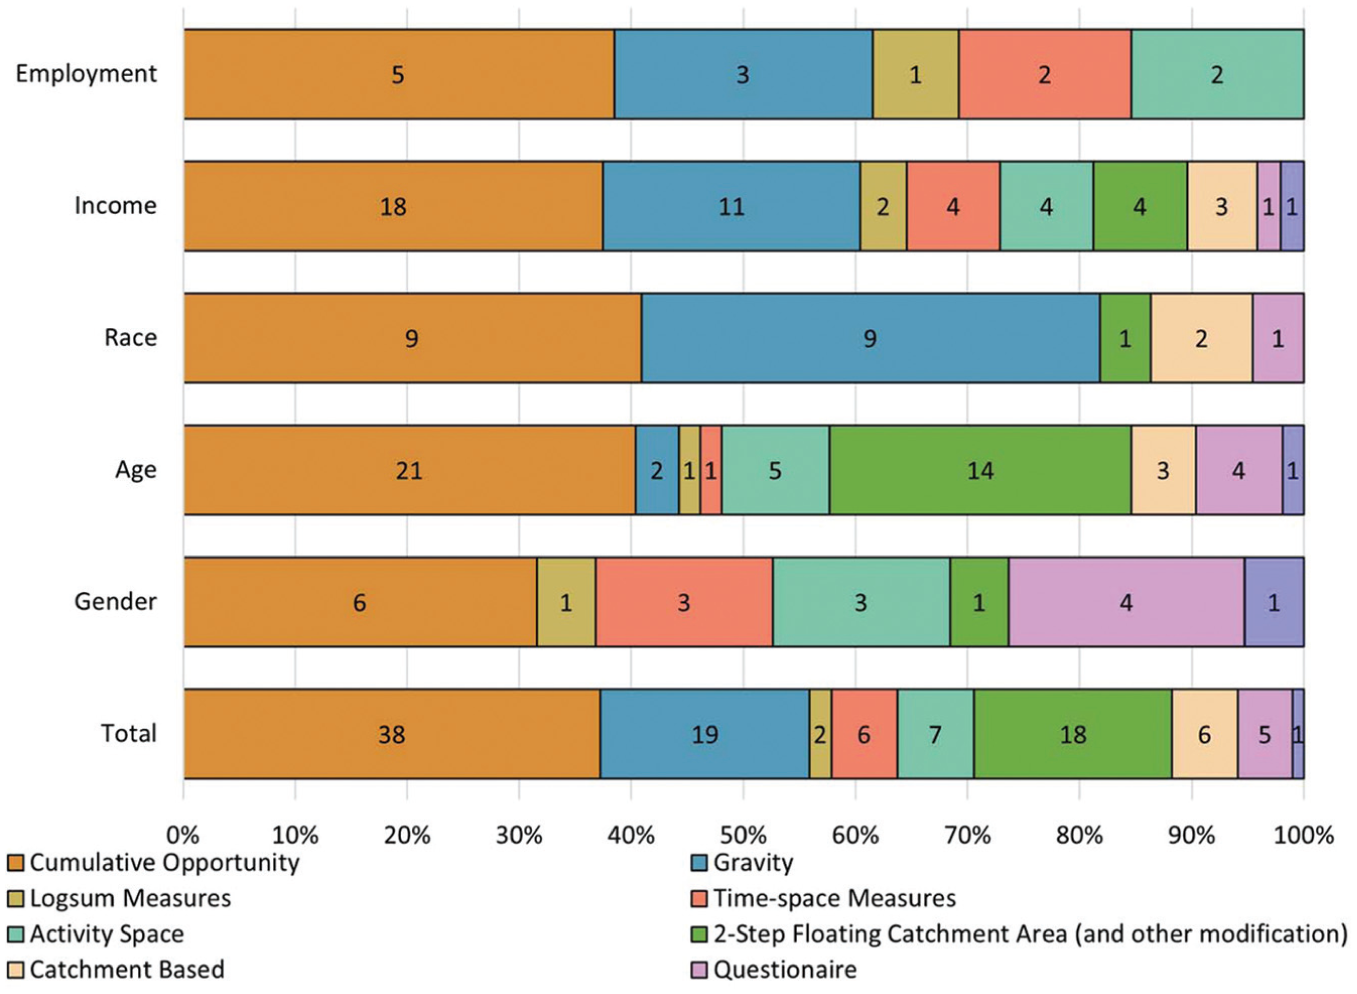
According to Figure 4, the most common accessibility calculation method employed across these studies is the cumulative opportunity method (38.7%), followed by gravity (19.4%), two-step floating catchment (18.4%), and catchment-based methods (6.1%). The methods employed vary depending on which demographic group is examined. Papers that include gender have the most varied methods, almost equally distributed across cumulative opportunity, time-based, activity space, and catchment-based methods. In contrast, all other accessibility studies are heavily skewed toward using cumulative opportunity or gravity-based measures.
Comparison between socio-demographic groups based on the methodological approach used.
The predominance of person-based and PAC measures in the studies that include gender may be because gender is likely to be more evenly spread across a geographic area than income, employment, age, or race. In theory, location-based measures, such as cumulative opportunity and gravity models, would show equal access for women and men living in the same area, somewhat undermining the need to consider gender in these models. We will return to this discussion later in this paper.
Overview of Papers that Include Gender
In the preceding section, it is evident that gender is a focal point in only a minority of studies examining accessibility across different socio-demographic groups. Some 16.2% of papers in the systematic search incorporated gender; among those, the majority examined gender as merely one of many socio-demographic characteristics. Table 3 furnishes additional details on the 18 studies that integrated gender into their analysis. In addition to the analysis perspectives highlighted in Table 2, this table delves into the analysis approach employed, the mode of transport considered, and the destinations factored into the accessibility calculation.
Summary of Accessibility Research that Considers Gender
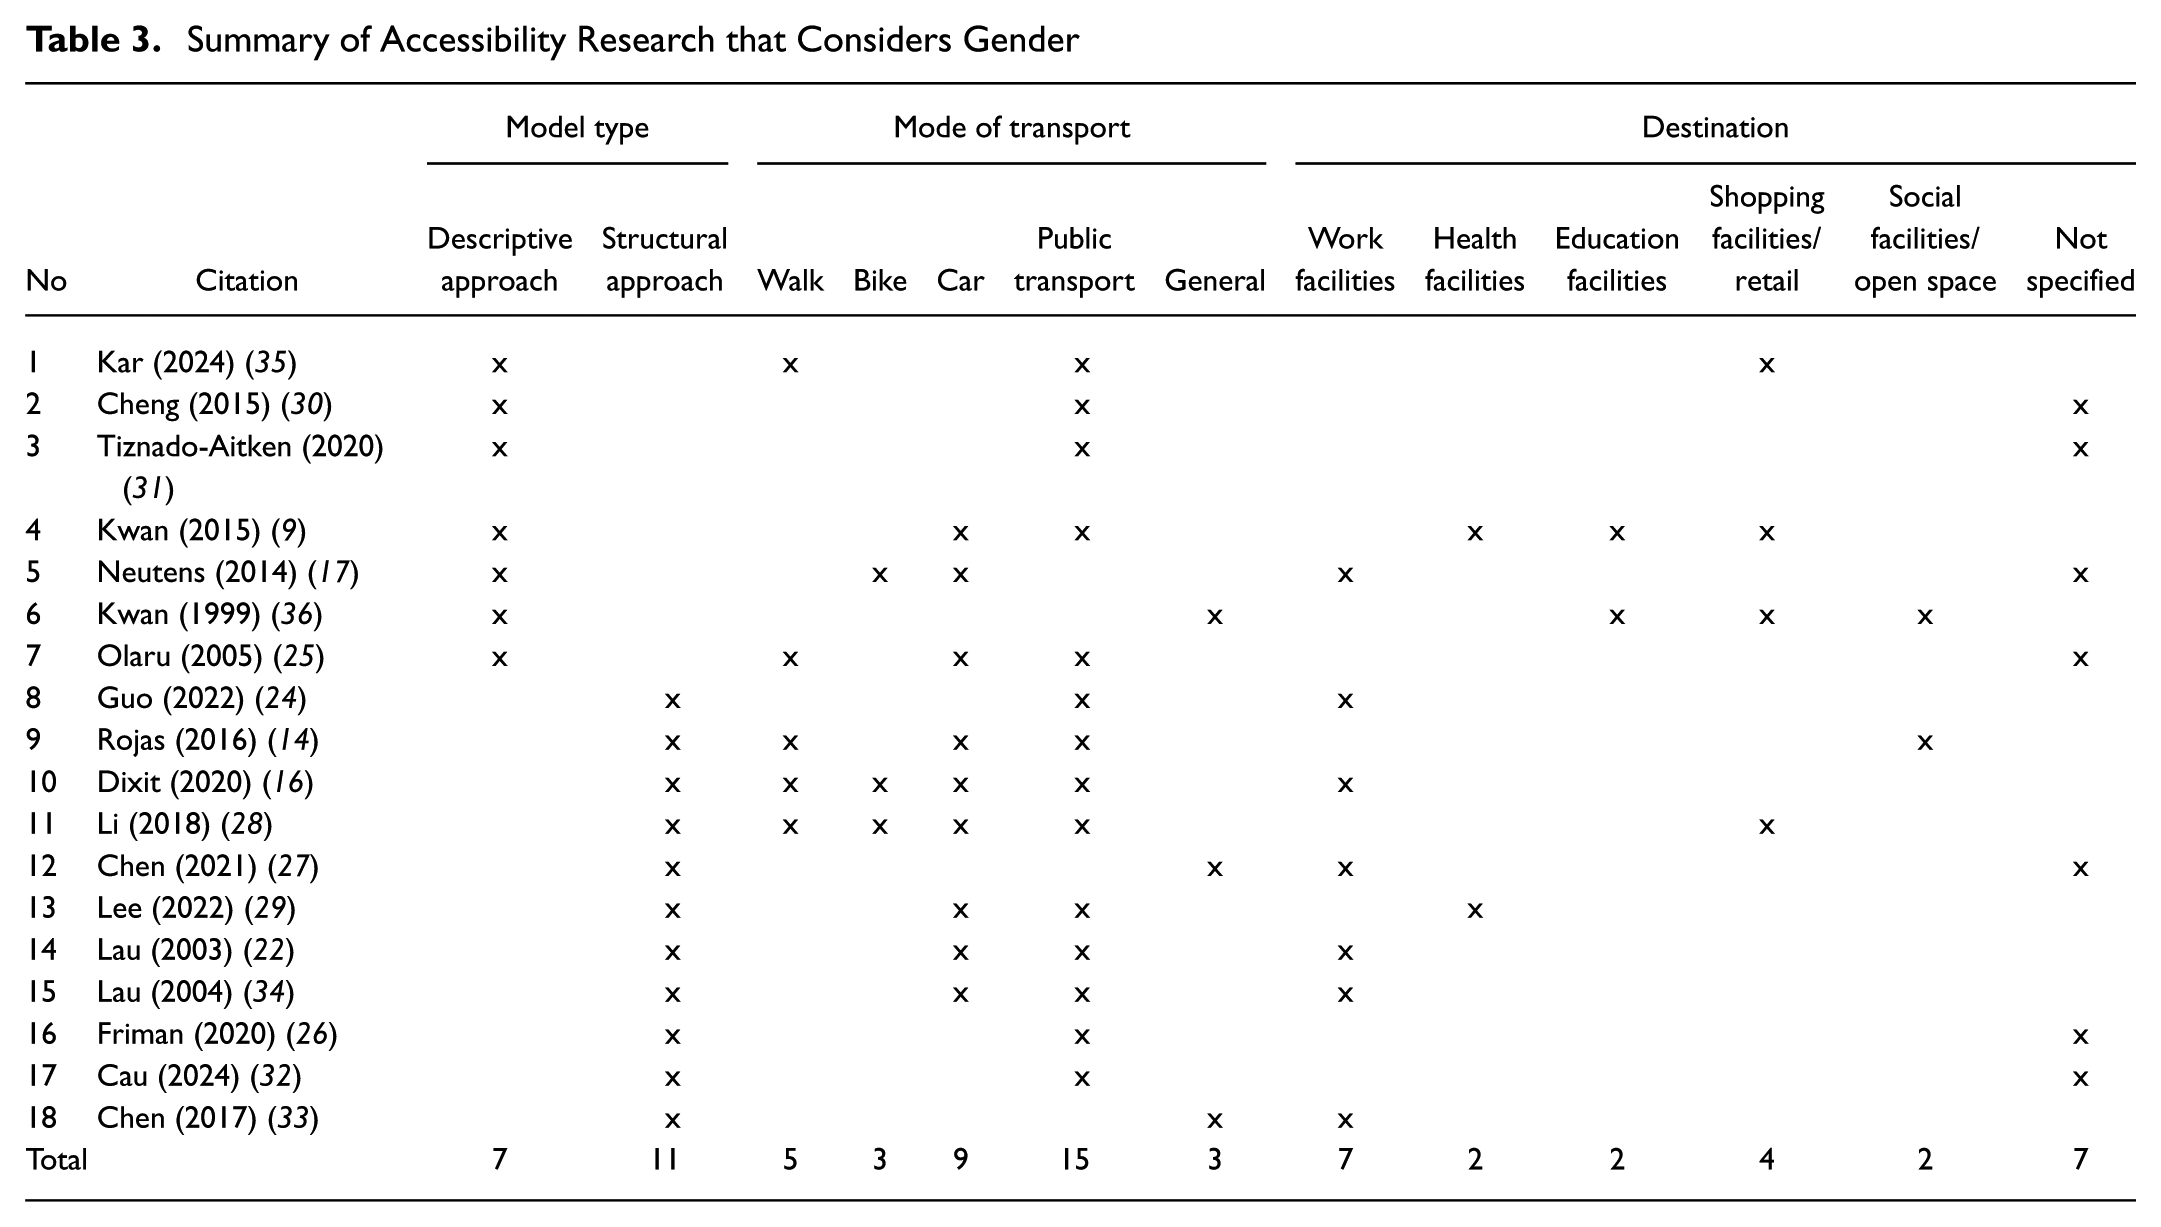
As shown in Table 3, of the 18 accessibility studies that discuss gender, only 7 studies use a descriptive approach. The rest only use gender as an independent variable (usually one of several demographic variables) used to predict accessibility. The most common transport mode examined is access via public transport, with 15 studies. Accessibility by walking or by car is less common, with 5 and 9 papers each, followed by bicycle with only 3 papers.
Even though women are less likely to work full-time than men, the journey to work is the trip purpose that is most often the focus of research (7 papers). Little research discusses accessibility to educational facilities or shopping, even though those destinations are more likely to be related to household-serving responsibilities.
What Do We Know about Gender and Accessibility?
First, we must note that, although we intended to search for papers on gender and accessibility, many of the resulting papers discuss both accessibility and travel behavior. Accessibility and travel behavior are related but distinct concepts. Travel behavior research generally focusses on how and why people travel. In contrast, “accessibility” generally refers to how easily people could travel to a particular facility ( 112 ). Most studies measure potential accessibility, which is the projection of the number of facilities that could be reached based on certain transportation or spatial conditions ( 60 , 68 , 88 ). However, there is also the concept of “realized accessibility” (or “revealed accessibility”), which measures actual access based on individual travel behavior ( 113 – 115 ). The concept of realized accessibility sometimes makes accessibility and travel behavior seem to be interchangeable.
Among the 18 papers that include gender, for many papers it was only a control variable and not a variable of focus. Other studies discussed the travel behavior of women without a strong emphasis on accessibility per se. To address the potential confusion between travel behavior and accessibility, the 18 accessibility studies will be explained in two sections: first travel behavior and then accessibility.
Gender Differences in Travel Behavior
Women have different travel patterns than men ( 9 ). While many men make a daily trip from home to work and back, women tend to have a wider variety of travel destinations. They often visit multiple places to fulfill responsibilities, such as childcare and the supermarket ( 15 , 116 ).
Whether they have children or not, women living in families often have a greater role in caring for household needs ( 9 , 116 ). This makes them more likely to adjust their travel schedules to the needs of other family members, especially children ( 116 ). Several studies have shown that the larger the family, the more household tasks women have to do, which is not always the case for men ( 27 ).
In addition, women often face economic constraints which affect their travel behavior. Several studies have shown that women generally have lower economic capacity than men, which results in more limited access to private vehicles ( 9 ). This is reflected in the high frequency of women walking and using public transportation compared with men ( 9 , 28 ).
Women often face challenges in meeting their travel needs. Their travel needs are complex and they may have many responsibilities with relatively low economic resources compared with men. Several studies have shown the consequences of these conditions, such as women are more likely than men to choose jobs close to where they live ( 9 ). In addition, many women’s travel destinations are not well served by public transportation, especially outside the hours and locations generally served by public transportation ( 10 ). This condition indicates that many women’s travel needs are not being met by the current transport system.
Accessibility by Gender
Various studies have shown that gender is a crucial dimension in accessibility studies. One of the earliest studies to reveal gender differences was a space-time-based study. Kwan, for example, combined the space-time prism with the daily potential path area using travel diary data and a digital road network in Ohio ( 36 ). He found that full-time working women had more limited activity space than men, primarily because of space-time constraints stemming from domestic responsibilities ( 36 ). Chen and Yeh used a similar approach in Guangzhou using potential activity space combined with structural equation modeling ( 27 ). The result shows that women’s household workload directly affects limited access to daily destinations such as shopping facilities ( 27 ). The findings were reinforced by another study conducted by Neutens et al., who highlighted temporal fluctuations using the space-time prism and found that women in Belgium face greater accessibility limitations using cars and motorcycles after work hours because of their domestic roles ( 17 ). Thus, these three studies consistently demonstrate that the space-time approach can uncover gender disparities often overlooked when relying solely on distance-based measures.
Differences between men and women are also apparent in the types of transportation they use. Kwan and Kotsev extended the analysis by utilizing 3D geospatial visualization to compare travel access by private car and public transportation in Sofia ( 9 ). The results showed that women who rely more on public transportation have relatively limited access compared with men who use cars ( 9 ). A similar finding was seen in Lau and Chiu’s study in Hong Kong ( 22 , 34 ). By regressing the travel time of low-income workers, they found that women tended to choose shorter trips via public transportation or walking, while men more often took longer trips or drove if they could afford it ( 22 , 34 ). Another study by Rojas et al. in Chile used a cumulative opportunities measure with spatial regression to assess access to green space ( 14 ). The results were consistent: women had lower access because of their reliance on non-private modes of transport ( 14 ). Similarly, Olaru et al., in Sydney, applied an activity space measure based on the covariance ellipse of household activity locations ( 25 ). Their analysis again showed that women’s activity space was smaller and more influenced by public transportation than men’s ( 25 ). In line with these findings, Chen et al., in Greater Cleveland, also applied an activity-space-based cumulative opportunity approach and found that women had significantly shorter trip distances and lower accessibility to industrial opportunities than men ( 33 ).
Olaru et al. found that gender disparities also emerge when access to specific facilities is focused on ( 25 ). Li and Kim used a GPS-based activity space approach with time-weighted and mode-weighted standard deviation ellipses to assess access to healthy food in Ohio ( 28 ). The results showed that women’s activity spaces were narrower, resulting in lower chances of reaching supermarkets stocking healthy food ( 28 ). Guo et al., in Beijing, used 2SFCA to measure subway access on the way to work ( 24 ). Although women more often lived near stations, their median accessibility was lower because of the spatial distribution of stations and the level of passenger competition ( 24 ). Another study by Lee, in South Korea, used travel time as an accessibility indicator and then combined Gaussian mixture models with ordinary least squares regression to assess access to healthcare ( 29 ). The findings confirmed that women experience greater inequality, particularly in accessing public health centers via public transportation ( 29 ).
Perception-based approaches provide a slightly different picture. For example, Friman et al. developed a measure of PAC using a Likert-based survey in five Northern European cities ( 26 ). Interestingly, women reported higher PAC scores than men—a finding likely influenced by the area’s quality of service and safety ( 26 ). Different results were seen in a study by Cheng and Chen, in Taiwan, which used a Rasch model to assess three dimensions of user perception in bus and metro systems ( 30 ). Women reported greater difficulty accessing stops and stations ( 30 ). Tiznado-Aitken et al. also confirmed this perceptual aspect by combining focus groups and a quantitative model based on generalized travel time in Santiago ( 31 ). They found that women were more sensitive to crowds and waiting times, while men were more concerned with trip duration ( 31 ). A similar finding was seen in a study by Chau et al. in West Melbourne, which used a PAC scale and non-parametric tests ( 32 ). Although gender differences in PAC were not statistically significant, women reported feeling unsafe more often, particularly when traveling at night ( 32 ).
Several recent studies have attempted to integrate the physical and perceptual dimensions into a single framework. Kar et al. attempted to unify physical and perceptual factors, introducing the concept of “inclusive accessibility,” which combines hard constraints (distance, travel time, infrastructure) and soft constraints (perceived safety, convenience) ( 35 ). Using ensemble machine learning to predict walking perception scores in Columbus, they found that low-income women and women of color face the most significant barriers to accessing supermarkets through transit and walking ( 35 ). That study demonstrates that, when gender is combined with other socioeconomic variables, accessibility vulnerabilities become even more pronounced ( 35 ).
Overall, the various methods used—from the space-time prism, cumulative opportunities, activity space, 2SFCA, and PAC, to inclusive accessibility—consistently confirm gender differences in accessibility. Women generally face greater limitations, whether because of domestic roles, more limited mode options, or lower perceived safety.
Moving Forward: How to Measure Accessibility for Women?
This literature review yields several knowledge gaps that can be used as a guide for future research. Firstly, researchers often neglect to consider specific destinations in accessibility studies, opting for a more generalized approach. However, gender significantly influences individual responsibilities. Women are less likely to work full-time and more likely to be responsible for childcare and shopping than men ( 15 ). Analyzing accessibility to specific destinations, such as schools and childcare, can help reveal hidden disparities in accessibility.
In addition, there is a lack of accessibility studies specifically examining women’s roles as mothers or caregivers. This gap hinders our understanding of the relationship between familial roles, accessibility determinants, and the appropriate measurement methodologies. We know, for example, that having children in the household has a greater impact on the travel behavior of mothers than fathers ( 15 , 16 , 116 ). Given the crucial societal roles women play, both economically and in their contributions to families, there is a pressing need for research focusing on accessibility for women in these caregiving roles.
Finally, accessibility measurements do not always consider the unique travel patterns of women. For example, women are more likely than men to travel at off-peak times ( 10 ). They are also more likely than men to trip chain to meet the various needs of a household ( 10 ). Current accessibility approaches almost exclusively assume that people are making direct trips to destinations.
In summary, we know that several interrelated factors contribute to women having poorer accessibility, on average, than men:
A greater need to trip chain, especially for household-serving and child-serving trips
Greater need to travel to non-work destinations
Greater need to travel outside of peak hours
In many cities, a greater reliance on public transport than men
If researchers want to continue to expand research on women’s accessibility, the choice of modeling framework is important. To capture the accessibility needs of women, the method used should be capable of modeling different destination types, time windows, and travel modes. Comparing different scenarios (such as accessibility to disproportionately “male” jobs versus “female” jobs) can help reveal accessibility gaps more likely to be experienced by women.
Modeling trip-chaining behavior has long been seen as a challenge, but interest in this topic has renewed as data sources, such as GPS and mobile phone data, have expanded ( 117 , 118 ). Capturing the complexity of trip chaining presents a significant challenge for accessibility models, as most methods model a single destination type or general “bundle of destinations.” However, this assumption may greatly overestimate destination accessibility for women, who are more likely than men to trip chain. For example, a simple gravity model of job access will overestimate job availability for people who must drop one or more children at school before continuing to work. Simply narrowing the time window cannot accurately reflect this difference, as it still estimates accessibility from the home origin rather than from a school, which is the last destination before a work trip leg. The suitability of common modeling frameworks for capturing trip chaining is discussed below. Ideally, the method should be able to model both chained and simple trips and compare the two results geographically to quantify the difference in accessibility.
Accessibility models can generally be classified into two main approaches: person-based and location-based ( 119 ). As far as accessibility types are concerned, actual and potential accessibility have distinct characteristics. Potential accessibility can be calculated using various methods, both person-based and location-based. In contrast, only one method is used to measure actual accessibility: the space-time prism concept. This method only allows for individual-based measurements and requires highly detailed individual-level data.
We first discuss how person-based models could be applied to understanding accessibility for women. This approach tries to measure a person’s ability to participate in activities within a certain time and space. The second approach we discuss is location-based, which models how easily a given origin or destination can be accessed by anyone within that location.
Person-Based Accessibility
The measurement methods commonly used in the person-based perspective are activity-based modeling (ABM) and time-space measurement. These models can provide a detailed picture of an individual’s accessibility because they generally draw from travel diary data. The level of data detail required in person-based modeling makes it quite easy to distinguish individuals’ movements from one another ( 119 – 122 ). Both models have the potential to better understand the needs of women’s movements because they can easily distinguish movements based on gender. However, their fundamental approach is quite different.
ABM is generally used to calculate travel demand projections, while time-space measurement is more often used to describe accessibility conditions. Although ABM uses very detailed movement data, accessibility is not the ultimate goal of ABM. It is usually used to predict travel patterns and answer questions about when, where, for how long, and which travel choices someone makes. Activity-based models are tools that are used to estimate logsums. Logsum is a utility-based accessibility measure that interprets accessibility as the outcome of a set of transportation alternatives, which indicates the attractiveness of the entire choice set ( 2 , 123 ). This makes measuring accessibility using this method quite difficult. Instead, accessibility could be calculated using other methods, which can then be associated with the demand for travel using activity-based models. Therefore, this method is better used as an additional method to model the impacts of changes in accessibility.
In contrast to ABM, space-time measurement has several advantages. First, activity spaces generated by space-time methods illustrate people’s travel behavior whether they trip chain or not. Second, mapping an activity space can show whether someone’s activity space allows them to reach household-serving activities (such as schools or shops). The space-time prism approach is also more practical and flexible than activity-based models in illustrating various scenarios, especially when data are limited. This is because it can integrate various factors into a single analysis—such as travel time, distance, and individual activities—within a unified spatial and temporal framework. Furthermore, this approach allows us to customize the analysis according to the desired parameters (e.g., travel time, distance, or type of activity being analyzed). A study from Ohio using a space-time approach illustrated the accessibility differences between genders to several types of destination (urban opportunities) ( 36 ). Another study proposed a framework using a multi-state supernetwork to illustrate activity space conditions for each state ( 120 ). In addition, although the space-time prism is very individualistic, there is research that explains how to aggregate the results by using analytical time geography and elliptic Fourier shape analysis ( 121 ). This makes the space-time prism worth considering because it can potentially explore all four factors mentioned previously—trip chaining, non-work destinations, non-peak times, and different travel modes—simultaneously, while other methods, such as logsum and place-based measurement, tend to consider each variable separately rather than simultaneously.
There are several challenges in using a person-based perspective to compare accessibility by gender. The first challenge is data availability; both methods require many resources to collect individual-level data. They both generally need travel diary data, which can be challenging to use on a large scale ( 95 ). Currently, we can get the data through third-party vendors that collect data using GPS. However, these datasets usually lack gender information because of privacy concerns. Additionally, we can gather data from surveys with travel diaries, but this method is much more labor-intensive, and the data are infrequently collected in many regions. The second challenge faced is the complexity of task analysis because of the very detailed data conditions. Furthermore, the methods available to perform this data-merging are still limited. Currently, only one multi-state supernetwork framework can merge such data ( 120 ).
Location-Based Accessibility
In contrast with person-based accessibility measurements, location-based measurements calculate the accessibility of a given destination with only indirect consideration of the individuals living in the location. For example, a location-based measure can highlight whether locations with a concentration of low-income individuals have better or worse accessibility, but they do not calculate an accessibility measure for each person in that neighborhood. Given that gender is more evenly distributed than income and race, one might initially dismiss location-based measures as unsuitable for comparing accessibility between men and women. Indeed, this is likely why location-based methods are much less often applied to studies including gender than studies comparing race or employment status (see Figure 4). However, this method still has the potential to describe differences in accessibility based on gender, not by making gender the group studied but by considering the travel behavior of each gender as a parameter in the calculation.
Two of the most common location-based approaches are gravity models and cumulative opportunity models ( 94 , 95 ). These two approaches usually calculate accessibility to one destination type, such as workplaces ( 21 ). On average, women tend to go to more different destinations than men, with fewer work-based trips and more household-serving trips. Both gravity models and cumulative opportunity models could be used to more explicitly compare the accessibility from a given location to specific destinations, such as work versus household-serving destinations. For example, they can be used to compare the accessibility related to destinations that women tend to visit more often than men (such as schools and childcare providers). They could also be used to model access to specific job types that are more likely to be held by men than women, or accessibility by modes that are more likely to be used by men than women. It is also relatively simple to compare accessibility during peak travel times (when men are more likely to travel) compared with off-peak times (when women are more likely to travel).
Gravity models have an additional element that could be explored to compare accessibility by gender. Unlike cumulative opportunity models, gravity models can also be used to test different distance decay functions ( 7 ). Considering that women have distinctive characteristics with regard to travel time, walking distance, and activity time, these calculations can be done by adjusting these variables when determining the decay function. The difference in decay function could illustrate differences between accessibility for women and men.
A greater challenge lies in how to demonstrate the impact of trip chaining on accessibility for women compared with men. Generating multi-destination calculations is not as easy as adding two or more accessibility calculations, which would double-count or overestimate accessibility. However, it is still possible to do by considering that, when trip chaining occurs, travel to the first destination in the chain changes the origin of the second leg of the trip chain and reduces the travel time window of the second leg. The cumulative opportunity approach is one method to consider. With this method, accessibility could be relatively simple to quantify and compare. For example, one could compare the number of opportunities that can be reached from a given location if the trip is direct (e.g., simple home-to-work opportunity) with a complex trip (e.g., a chain that begins with home-to-school opportunities, then from school opportunities to work opportunities). This approach has the benefit of providing outputs that are easy to interpret, such as quantifying the percent reduction in job opportunities for people who stop at a school before work. This same method could be applied to a gravity model, but it will be more challenging to operationalize the trip chaining and to interpret the resulting accessibility scores.
One final method included in the location-based approach is 2SFCA, a method that considers competition and the capacity of facilities ( 101 ). Considering the competition in utilizing facilities, this catchment-based model tends to be more precise in calculating accessibility than gravity and cumulative opportunity models. The level of detail of the results of the 2SFCA calculation is a challenge when we want to use it in a specific context for women. It is quite challenging to differentiate genders using this method. This calculation considers competition in the context of facility capacity, where most facilities have equal capacity for both women and men. One possibility is to add other considerations, such as women’s preferences in choosing the facilities they will visit, as Liu et al. did when measuring spatial accessibility to elderly care facilities ( 124 ). Although there is an opportunity to calculate women’s accessibility with 2SFCA, the magnitude of the challenges and the details of the data needed make the calculation difficult.
Among the methods commonly used for measuring location-based accessibility, the cumulative probability method is often considered the most appropriate because of its flexibility and ease of interpretation ( 125 ). The cumulative probability model allows different time or distance thresholds to represent different activity patterns among groups, for example, men and women. However, the result of this measurement will be binary. A destination is considered accessible only if under a certain threshold, and interpreted as inaccessibility if it exceeds it. Meanwhile, the gravity method allows different distance decay functions, thus representing a gradual decrease in access probability based on distance or travel time. Thus, while the gravity method is more computationally complex, it offers more sophisticated flexibility in weighting destinations than the more explicit but more straightforward cumulative probability method.
Conclusion
In accessibility studies, gender still receives less attention than other socio-demographic factors, such as income and age. When discussing gender in accessibility studies, the focus tends to shift from just accessibility to also include travel behavior. The discussion is especially limited when the studies use the structural approach, where gender is treated as just one of many independent variables. Of all the studies that were found, most of the studies discussed work trips, which women are less likely to make than men. Public transportation is the most discussed mode, highlighting its significant role in gender-related accessibility issues.
In this study, we discuss the potential for using existing accessibility measurements to analyze women’s needs. Location-based methods are the easiest to implement, but, in doing so, gender must be examined indirectly by considering the differences in travel needs and behaviors between women and men. Translating women’s travel behavior into specific parameters—such as destination types, travel times or trip chaining—can allow us to adapt existing measure to better reflect accessibility for women.
This study has several limitations. First, this paper focused on spatial accessibility within the urban context and excluded highly specific situations such as natural disasters. Also, rural accessibility and specialized situations deserve their own dedicated study. Additionally, this study did not focus specifically on travel behavior, which may result in some relevant studies not being captured in the search results. For future research, researchers could further explore the complex relationship between travel behavior and accessibility. Finally, this study assumes gender is a binary category and does not focus on specific roles such as mothers or working women. Discussion of the diversity of genders and gender roles in future studies is expected to broaden insights into how these roles affect accessibility.
Footnotes
Acknowledgements
The authors would like to acknowledge scholarship support provided to Ulfah Aliifah Rahmah by the Indonesian Education Scholarship, the Center for Higher Education Funding and Assessment, the Ministry of Higher Education, Science, and Technology of the Republic of Indonesia, and the Endowment Fund for Education Agency, Ministry of Finance of the Republic of Indonesia.
Author Contributions
The authors confirm contribution to the paper as follows: study conception and design: U. A. Rahmah, A. Delbosc, L. Kamruzzaman; data collection: U. A. Rahmah; analysis and interpretation of results: U. A. Rahmah, A. Delbosc, L. Kamruzzaman; draft manuscript preparation: U. A. Rahmah, A. Delbosc, L. Kamruzzaman. All authors reviewed the results and approved the final version of the manuscript.
Declaration of Conflicting Interests
The authors declared no potential conflicts of interest with respect to the research, authorship, and/or publication of this article.
Funding
The author(s) disclosed receipt of the following financial support for the research, authorship, and/or publication of this article: ?Ulfah Aliifah Rahmah was supported by the Indonesian Education Scholarship, administered by the Endowment Fund for Education Agency, Ministry of Finance of the Republic of Indonesia.