
Abstract
Auto-centric streets and zoning regulations that have segregated land use in the U.S.A. has created an inequitable and less accessible transportation system, particularly for vulnerable communities. We examined whether the existence or absence of zoning regulations influenced transportation equity outcomes, by focusing on case studies of Dallas, a city with zoning regulations, and Houston, a city without zoning regulations. While many studies use single-modal measures to examine modal accessibility gaps (MAGs), we adopted a multi-modal accessibility measure. This approach allowed us to calculate white- and blue-collar job accessibilities for both transit and automobiles, providing a nuanced estimate of MAGs. Our maps show considerable variations in MAGs, with Dallas being more equitable than Houston. Results from the spatial regression models show that (a) white- and blue-collar job seekers face similar levels of MAG inequalities, (b) MAGs decreases when transitioning from Dallas to Houston, suggesting that Dallas offers higher transit accessibility equity than Houston, (c) commercial land uses have considerably higher spillover impacts (than direct impacts) on MAGs, (d) unlike Houston, where there are negative associations between commercial land use and MAGs, Dallas shows more robust positive associations, suggesting the potential for greater equity among its residents, (e) the spillover impact of single-family housing units on MAGs in Houston is higher than its direct impact, and (f) transit proximity has a larger direct impact but smaller spillover effects on transportation equity. Planners should implement comprehensive long- and short-term strategies favoring communities of concern by considering land use and transportation decisions together to address socio-economic inequalities.
Keywords
In the U.S.A., conflicting planning objectives, political incentives ( 1 ), and disregarding the needs of marginalized groups ( 2 ) have made it challenging to put social equity into practice ( 3 ), especially in transportation planning. Marginalized communities experiencing transportation disadvantage can be referred to as communities of concern (COCs) ( 4 ). Some researchers use the term environmental justice (EJ) communities to refer to these communities, while others use terms such as vulnerable/underserved/underprivileged/disadvantaged communities. These definitions overlap ( 4 ). Since there is no universally used terminology, we use “COC” in the remainder of this manuscript (5).
Locally implemented growth limitations and discriminatory zoning policies have contributed to the emergence of patterns that have pushed developments toward peripheral cities, generated urban sprawl, favored rich suburban neighborhoods, and led to spatial patterns with significant socio-economic consequences. Likewise, zoning experts agree that current zoning regulations are discriminatory against low-income and racial/ethnic minority communities ( 6 ). This is because zoning restrictions have a dual impact that exacerbates inequalities. Firstly, they hinder the development and maintenance of affordable housing in areas with the most significant demand, thereby constraining the housing supply. Secondly, they fail to support or permit affordable housing options near transit routes, replacing them with high-end commercial properties, thereby worsening transportation and housing challenges for low-income and racial/ethnic minority communities ( 7 ).
Long-range transportation plans (LRTPs) developed by metropolitan planning organizations (MPOs) include alternative land use strategies that may help improve accessibility for COCs without necessitating additional infrastructure expenditures ( 8 ). Policy and planning reforms have the potential to establish highly accessible, multi-modal neighborhoods that better serve COCs. However, we need a greater awareness of how transportation and land use decisions affect accessibility before implementing them. Therefore, it becomes essential to explore the relationship among accessibility, land use, and transportation equity outcomes for different population groups.
Access is an important transportation performance measure that helps scrutinize planning issues such as segregation, disparities, or inequalities for different locations ( 9 ). Inequitable employment access can exacerbate economic gaps, making it more difficult for COCs to transcend poverty and attain financial stability ( 10 ). This, in turn, affects their potential disposable income, thus directly affecting their quality of life. Given the importance of employment accessibility for COCs, it is critical to focus on job accessibility in transportation equity studies.
Various socio-economic and built environmental factors influence the spatial distribution of employment opportunities accessible through various transportation modes (11–15). Consequently, planners should enhance their comprehension of the spatial relationships between employment opportunities accessible via transportation and diverse urban elements ( 16 , 17 ). Spatial statistics are increasingly employed in transportation planning to investigate spatial autocorrelation (SA) ( 18 , 19 ). Because of comparable physical and socio-economic characteristics, transport-accessible employment in one area physically interacts with the surrounding area ( 20 ). Likewise, the degree and scope of SA also change across various modes of transportation-based employment accessibility. Consequently, transportation policy aimed at improving employment accessibility should consider not only the direct benefits of infrastructure improvements but also the spillover effects in areas where SA is high ( 15 ). Therefore, we must account for SA while evaluating transportation equity issues.
Scholars have performed many studies evaluating transportation equity across U.S. cities (21–25). However, only a few studies have examined transportation equity using adaptive accessibility measures that consider job types and transportation modes simultaneously ( 26 , 27 ). This is a significant gap because land use patterns in cities with and without zoning can be considerably different. Non-zoning cities are more diverse and have lower employment density ( 28 ). The opposite can be valid for cities having stringent zoning regulations. Such variations in land use patterns may affect the location decisions of businesses and employment differently ( 29 ), leading to different transportation equity outcomes for the residents in cities. In this regard, it is a relevant and timely question to investigate the impact of zoning and land use control on the equitability of transportation systems and the distribution of opportunities.
Further, no study has explored whether the presence or absence of zoning regulations influences the transportation equity outcomes of COCs across different metro areas using employment accessibility measures disaggregated by job and mode type. Comparing the associations among various employment accessibility types and socio-economic and land use elements in zoning and non-zoning cities can yield rich information about the impacts of different zoning policies on transportation equity in the areas when modeled together.
For this purpose, we address these gaps by using Dallas and Houston as case studies. Dallas is a large zoning city with an extensive transit network, while Houston is the largest U.S. non-zoning city with limited transit access. In Houston, in the absence of zoning ordinances, homeowner associations take charge of the land use regulations using voluntary arrangements, often exhibiting more stringent control over land use compared to zoning ordinances, especially in certain neighborhoods. However, as our literature review shows, no study has compared the effects of these land use controls on multi-modal transportation equity outcomes ( 28 ). We examine the factors influencing the distribution of employment accessibility. The results from this assessment will help uncover how the presence of zoning regulations, socio-economic factors, and SA amongst these factors uniquely affect equity outcomes for various population groups in the two study sites. We aim to answer the following three research questions:
Is there any difference in the spatial equity of job accessibility between the two cities because of the presence/absence of zoning regulations?
To what extent do spatially autocorrelated variables, including the built environment, transportation-related, and socio-economic factors, influence the disparities of multi-modal job accessibility with respect to both transportation mode and job type?
What are the implications of these findings for multi-modal transportation planning and the fairness of job distribution?
We begin our analysis with a brief literature review, followed by our hypothesis and variables. Then, we describe our study areas and data and present the study results and findings. Finally, we summarize from our observations and discuss implications for practice in the future.
Literature Review
Accessibility Definitions and Measurements
Accessibility has been considered as an important metric for benchmarking and comparing alterations in land use, and transportation systems across different places and over time ( 30 ). While the literature has studied accessibility to various opportunities, job accessibility has been a focus in transportation planning ever since Kain’s ( 31 ) spatial mismatch hypothesis. Hansen’s ( 32 ) gravity-based employment accessibility measure is a popular method of measuring potential job accessibility. This measure considers the total employment opportunities together with commuting costs to measure transportation accessibility.
In calculating job accessibility two challenges arise, especially when the emphasis is on spatial mismatch and transport mode disparity in commuting. The first challenge involves the integration of both the supply and demand sides of the labor market. Typically, job accessibility is calculated by integrating only the supply side (jobs), leaving out the demand side (individuals competing for those positions). However, given that labor and employment opportunities are not distributed equally in a city, previous measurements of job accessibility, which overlooked the geographical distribution of job and labor types, were somewhat inaccurate (33–36). Secondly, previous researchers calculated job accessibility for automobiles, neglecting the consideration of other modes of transportation ( 26 ). To fill this gap, Pan et al. ( 10 ) developed a multi-modal job accessibility measure by incorporating job matching, job competition, and job proximity by different transportation modes in one measure for large metropolitan areas. These measures are valuable for understanding the variation in transportation infrastructure availability among different COCs.
Transportation Equity and Zoning
Historically, COCs have had lower mobility across transportation modes than the general population. Thus, assessing the transportation equity of COCs becomes essential ( 9 ). A comprehensive evaluation of transportation equity requires a thorough assessment of the mobility needs and activities of various COCs, an evaluation of the distributional impacts of transportation infrastructure, an estimation of the levels of provision of transportation facilities for non-drivers, and an assessment of how land use regulations affect transport costs and accessibility ( 14 ).
Some researchers have evaluated transportation equity following Karner and Niemeier’s ( 27 , 37 ) equity assessment framework, which entails defining target populations, calculating equity metrics, and conducting an assessment of equity. These scholars have successfully evaluated the distributional impacts of transportation infrastructure in urban areas. Their approach involves quantifying equity variables, such as job accessibility, and visually presenting and comparing them across diverse population groups distinguished by demographic and socio-economic factors (27, 38–40). However, this strand of equity studies, that is, distributional analysis, only helps discover inequality levels with respect to benefits and burdens, but may not necessarily delve into the explanations for different inequality levels ( 15 ).
Other researchers have evaluated transportation equity using statistical modeling techniques. Scholars have utilized agglomeration economies ( 41 ) to explain variations in urban size and form. Park and Von Rabenau ( 42 ) and Roback ( 43 ) both examined agglomeration to understand the interconnected effects of regional characteristics on local economies, productivity, and amenities. The underlying idea is that the physical environment, socio-economic status, and proximity to other zones all influence a city's ability to provide residents with better job accessibility. Improved local transportation connectivity has a multiplicative impact, meaning that investments in transport infrastructure in one area can not only benefit that specific area but also the neighboring ones by increasing jobs opportunities ( 15 ).
While most studies evaluated transportation equity for a single study area (15, 26, 27, 44–46), a comparative assessment of car/transit commuting inequity across different urban areas with different urban forms and transportation provisions is necessary ( 26 ). Zoning regulations determine the permissible land uses and the maximum allowed building density in a given area ( 47 ). Single-use zoning and highway construction to maximize the automobile’s level of service are examples of present U.S. regulations ( 48 ) that may impede transportation equity for COC residents who lack the privilege of either owning a car or commuting to work daily. Liu et al. ( 28 ) compared how employment, land use, and transportation factors affected the emergence and growth of employment centers in Houston and Dallas. While many studies mentioned above employed spatial statistical models, they often did not evaluate how diverse land use and zoning regulations in different cities could affect transportation equity outcomes of COCs differently.
Applications of Spatial Regression Modeling in Transportation Equity Analysis
Studying agglomeration economies, Sung et al. ( 46 ) showed how land use patterns and the transport system fundamentally shape the urban form and affect transit accessibility. Fan et al. ( 44 ) demonstrated that constructing light-rail systems in areas dominated by COCs improves employment accessibility significantly. Similarly, Foth et al. ( 45 ) found that Toronto had an equitable public transportation system, as residents of COCs experienced better employment accessibility because of reduced transit commute times. Knap et al. ( 49 ) conducted spatial regression using accessibility ratings for nine destination categories to analyze spatial and socio-economic disparities in Utrecht. They concluded that Utrecht was equitable, as everyone there had access to at least one destination type within a 15-min cycling distance.
Similarly, Pereira et al. ( 50 ) employed spatial regression models to evaluate how transit expenditures may reframe socio-spatial disparities in accessibility. They found that service level cutbacks have outweighed the accessibility benefits of transit expenditures in such a way that penalizes the poor while favoring higher-income groups. Likewise, Oh and Chen ( 51 ) examined the effects of agglomeration associated with transportation’s positive externalities on gravity-based employment accessibility by transit in Portland. They observed that job accessibility improves with the agglomeration of the transportation network and service. Further, they found that the impact of agglomeration on the accessibility of low-skilled jobs was less than that on the total job accessibility.
Lunke ( 52 ) analyzed the distributional disparities in accessibility using spatial Durbin models (SDMs), revealing that low-income neighborhoods have limited public transit accessibility. Wang and Mu ( 53 ) employed spatial lag models to assess Uber’s accessibility inequities and found no statistically significant correlations between inequities and income/racial background. Increased availability of Uber services is associated with an increase in road network density, population density, and reduced commute times. Likewise, Maharjan et al. ( 54 ) evaluated the spatial equity of modal accessibility gaps (MAGs) and found that automobile riders had greater access to opportunity types than public transit riders.
In summary, scholars have evaluated transportation equity by measuring the distributional impacts of transportation benefits and burdens. They have also employed statistical modeling to examine accessibility, socio-economic, land use, and transportation factors. However, no scholar has conducted a comparative analysis of transportation equity outcomes for employment accessibility, disaggregated by job and mode types, across different areas. Moreover, no study has explored how the presence/absence of zoning regulations could influence the transportation equity outcomes for different population groups. These gaps in the literature are significant, as scholars have yet to have a comprehensive understanding of the factors simultaneously contributing to transportation equity issues in different cities with various land use and zoning ordinances, diverse transportation facilities, and different socio-economic statuses.
Modeling Methodology
To address the aforesaid gaps, we first quantify transportation performance metrics, such as accessibility by mode and job type, and calculate the MAGs. Then, we employ spatial regression models to assess the relationship among MAGs, built environment factors, socio-economic indicators, and transportation-related variables to unravel and compare the associated inequalities in the Dallas–Fort Worth (DFW) and Houston metropolitan areas. The unit of analysis of this study is the traffic analysis zone (TAZ), a unit of geography most commonly used in transportation planning modeling. Our analysis framework is discussed in detail below.
Accessibility and MAGs
Accessibility is a crucial factor for evaluating land use and transportation system performance. It corresponds to the prospect of an opportunity for interactions ( 32 ), the estimated maximum benefit derived from a given situation ( 55 ), or the ease with which destinations can be reached ( 56 ). Equation 1 presents Hansen’s ( 32 ) accessibility formula:

where
Assuming that accessibility is inversely proportional to commuting cost, impedance functions are computed as, for example, an inverse power function
Shen (
34
) incorporated a demand component
where
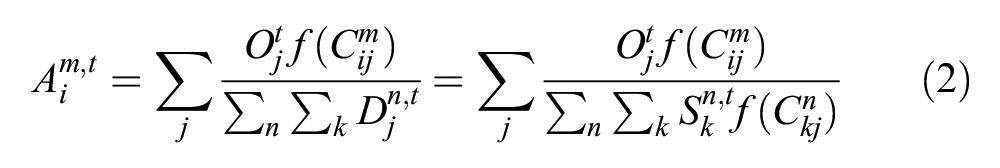
We adopt the formula of Pan et al. (
10
) for our equity assessment and use Wilson’s negative exponential formula
We followed the classification scheme adopted by Guthrie and Fan ( 59 ) and Sharifiasl et al. ( 27 ) to break down job opportunities into white-collar (WC) and blue-collar (BC) categories. Table 1 presents the job sector classification based on North American Industry Classification System (NAICS) codes, which we employed to classify WC and BC jobs in our analysis.
Blue- and White-Collar Employment Sectors by North American Industry Classification System (NAICS) Classification
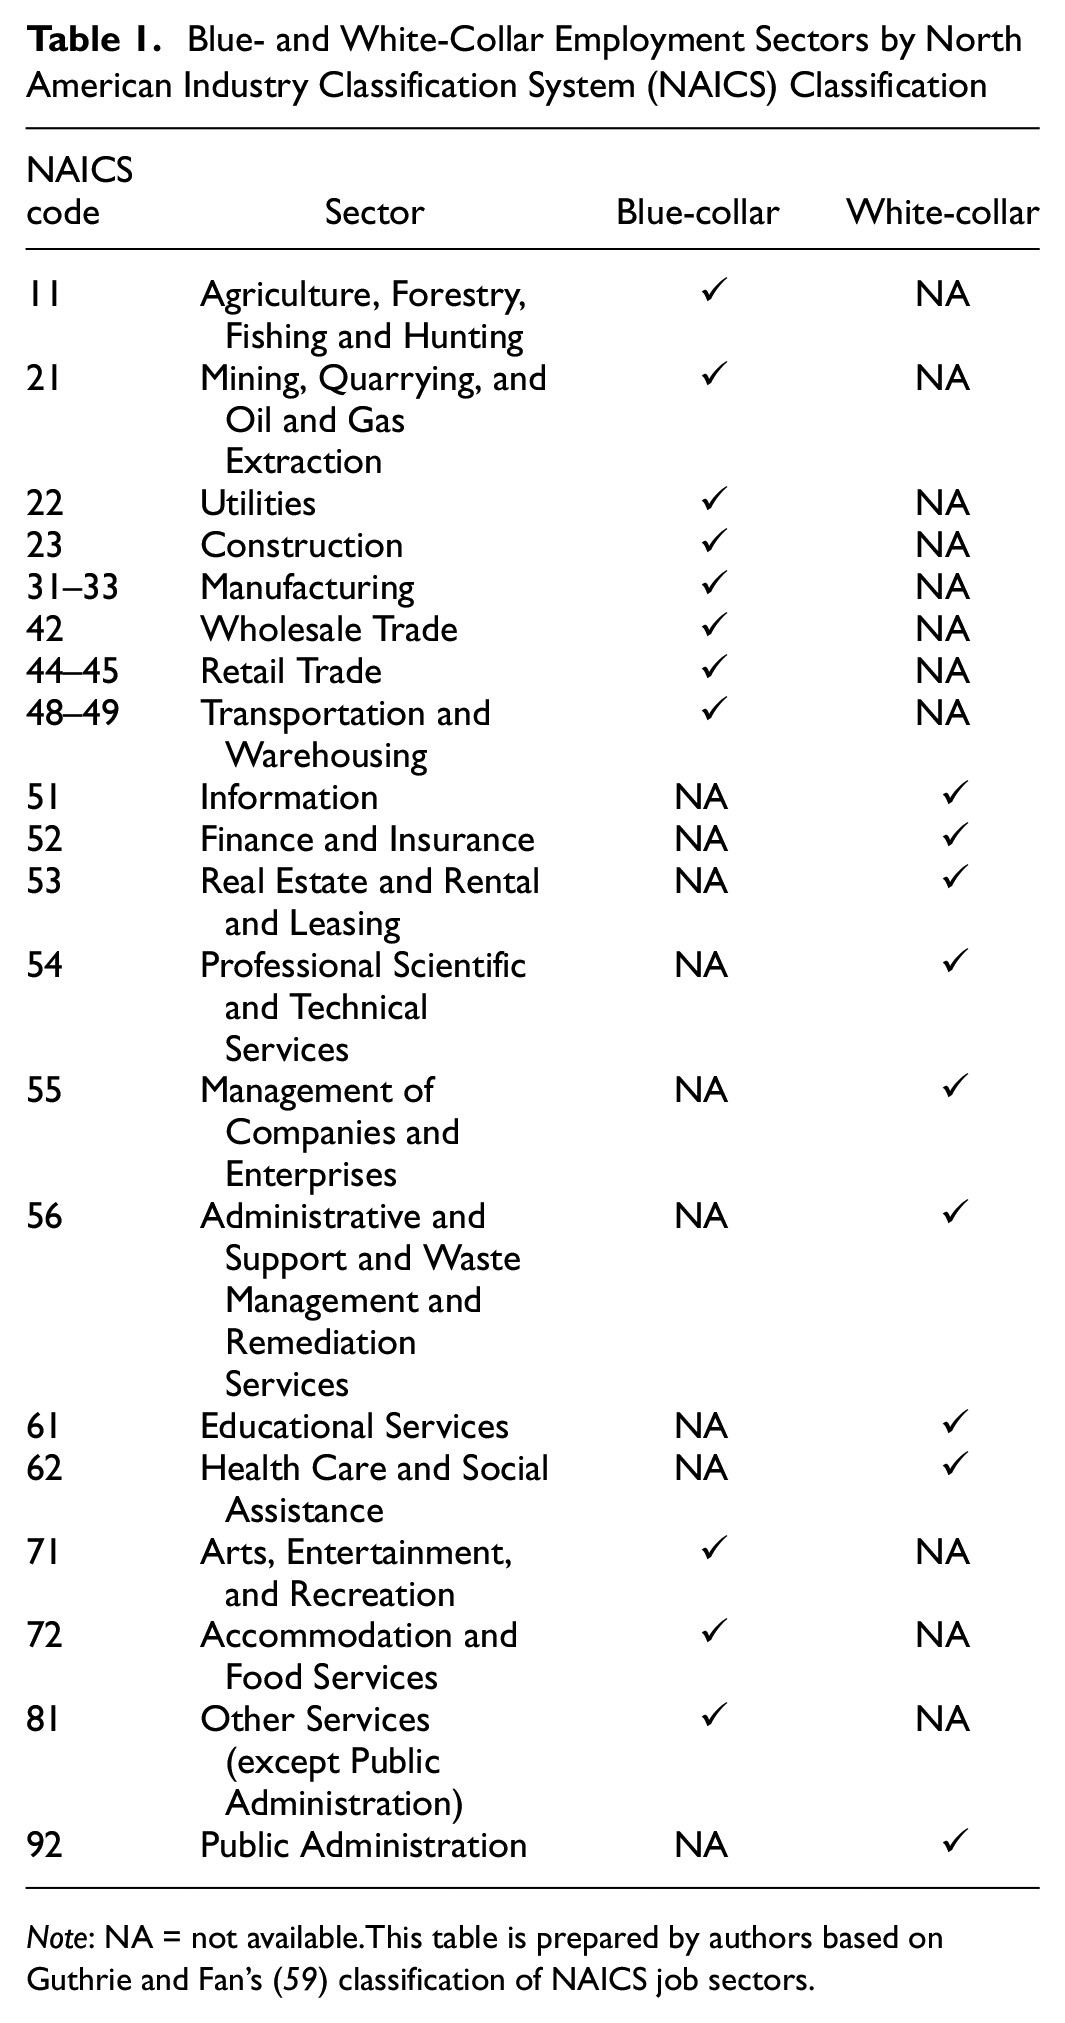
Note: NA = not available.This table is prepared by authors based on Guthrie and Fan’s ( 59 ) classification of NAICS job sectors.
We adopted the MAG index (Equation 3) developed by Kwok and Yeh ( 60 ) as our dependent variable. The MAG measures the standardized gap between transit and car accessibility and ranges from −1 to 1. As the MAG approaches −1, the area tends to exhibit an auto-access orientation and vice versa. As the MAG approaches a positive value, it suggests more equitable transit access in the area:

where
Spatial Durbin Model
When Moran’s I value is statistically significant, it indicates the existence of SA and endogeneity issues in the data, which makes ordinary least squares (OLS) regression estimates unreliable. In such instances, Anselin ( 61 ) advises using spatial regression to eliminate this endogeneity. Spatial models help correct SA in our data to avoid breaching the presumption of uncorrelated variables. Simply, spatial models account for variables in nearby TAZs. We followed a four-step process to determine the best spatial models for our analysis. Firstly, we perform backward stepwise OLS regressions for all models to identify the optimal subset of variables that maximizes the model’s fit to the data while penalizing the model complexity ( 28 , 62 ). Following this process, certain coefficients from both the combined model and the individual models of the two areas were excluded. Secondly, we evaluate the spatial dependency of the OLS model to find the most suitable model. Thirdly, we examine the residuals for SA to check if spatial models are more appropriate. Finally, we perform a Lagrange multiplier test. The analyses indicate that SDMs are the most fitting for the data ( 63 ).
We adopted a SDM because of the anticipated existence of SA in both the dependent and several independent variables ( 52 ). In simple terms, we account for the idea that the accessibility, built environment, and sociodemographic factors of TAZs may be influenced by similar characteristics in the surrounding TAZs. Also, the spatial lag of the independent variables can be interpreted as a factor representing additional variables with spatial characteristics that are not explicitly included in the model. Equation 4 presents a simplified form of the SDM used in this study:

where
LeSage and Pace (
78
) recommend reporting summary indicators for the direct, indirect, and total effects to identify the impacts caused by different variables accurately. The direct effect, which includes the effect spreading to neighboring observations and back to the observation itself, or the feedback effect, can be measured by calculating the average of diagonal elements of matrix W. The total effect, which represents the total impacts on each observation “x” resulting from changing a particular explanatory variable across all “n” observations, can be computed by taking the average of the row sums of matrix W across all observations. The difference between the total and direct effects is known as the indirect effect (spillover effect). To test if the indirect and direct effects are statistically significant, one can simulate their distributions using the variance-covariance matrix suggested by the maximum likelihood estimates. Thus, we transform the coefficients to translate them into interpretable values (
64
). These impacts are calculated for each explanatory variable, k, using the
Equations 5 and 6 present the formulas for calculating the direct and the indirect impacts:


We used the Stata 17.0 software package for performing the OLS model and SDM.
Socio-Economic and Built Environment Factors
The spatial distribution of employment accessed through various commuting modes results from several built environment and sociodemographic factors (11–15, 65). Thus, it is essential to spatially model the associations between these factors and MAGs to highlight transportation equity issues.
To address this, Wang and Chen ( 15 ) incorporate socio-economic variables such as race, education, and living arrangements into their model. Specifically, they utilize the share of the white population as a benchmark and include the share of black, Asian, and other populations in their model. Additional factors considered include the shares of single-family households and carless households, the share of owner-occupied housing units, and the proportion of the population having at least a bachelor’s degree. These variables have been widely accepted and utilized by other scholars in their transportation equity analyses (15, 26, 51, 54, 64, 66–69). These variables are included in transportation equity analyses as scholars found unevenly distributed MAGs, which was associated with the demographic, built environment, and socio-economic characteristics of surrounding neighborhoods (26, 49, 50, 52–54, 64, 66–69). Thus, we include almost all these variables to account for socio-economic factors in our analysis.
Likewise, previous studies show that certain aspects of the built environment play a role in influencing transportation accessibility and MAGs ( 15 , 49 , 54 , 70 ). Therefore, not controlling for built environment factors might proxy the effects of sociodemographic factors on accessibility and vice versa ( 49 ). To account for the impact of built environment factors and zoning regulations in their study on employment centers in Dallas and Houston, Liu et al. ( 28 ) incorporated the three-dimensional (3D) factors suggested by Ewing and Cervero (70) into their analysis. Specifically, they use job density, proximity to central business districts (CBDs), highway systems, and rail stations, and land use diversity. Land use diversity is measured using an entropy index ( 71 ), presented in Equation 8:

where LanduseENT represents land use diversity,
Other transportation equity studies have also used these variables to control for built environment factors in their models (15, 26, 51, 53, 66, 68, 72). However, these scholars typically omitted the consideration of distance to the nearest subcenters in their model. In contrast, Boarnet and Wang ( 73 ) found that job accessibility in peripheral subcenters showed more significant associations with vehicle miles traveled than employment accessibility in employment subcenters. Only considering a CBD as a proxy for the main subcenter would mask the effects of the distance and type of subcenters from the model. Thus, we adopt these factors suggested by the literature in our study along with a novel variable, namely, distance to the nearest subcenter, to control for zoning regulations and built environment factors. To this end, we adopt Giuliano and Small’s ( 74 ) minimum cut-off method to identify subcenters, which uses gross employment density in the calculation of subcenters and defined a job center as a TAZ with density above a cut-off point (D = 10 jobs/acre) and total of more than certain number of jobs (J = 10,000 jobs).
Empirical Study
Study Area and Data Collection
Both the DFW and Houston regions experienced significant developments during the suburbanization and auto-highway dominant era. The U.S. Census reports the population density of the DFW and Houston metro areas as 894.5 and 871.6 people per square mile, respectively. Likewise, the percentage of individuals driving alone to work is 68% for Dallas and 71% for Houston, while the percentage of individuals riding transit is about 1% in both areas, 1% lower than the national average.
In 1934, the Texas Supreme Court upheld Dallas’ zoning ordinance and the Texas Zoning Enabling Act, creating zones that delineated Dallas’s geographic areas into different land uses. Unlike Dallas, traditional zoning has been proposed and turned down multiple times in Houston. Instead, homeowners’ associations regulate land use through stringent covenants and property limitations, which are sometimes more stringent than traditional zoning standards ( 28 , 75 ). As many current zoning regulations are perceived as discriminatory toward COCs ( 6 ), we would intuitively expect a non-zoning approach to perform better with respect to transportation equity than that in a zoning city. Although Dallas and Houston have similar population growth rates and commuting trends, we expect that variations in land use policies may affect the spatial distribution of residential and employment sectors differently ( 28 ), thereby generating different implications for transportation equity.
The North Central Texas Council of Governments (NCTCOG) and the Houston-Galveston Area Council (HGAC), serving as the local MPOs for Dallas and Houston, respectively, provided the 2020 TAZ and the land use datasets. In addition, NCTGOG and Houston METRO provided the 2020 origin–destination (O-D) peak travel time matrices for transit and automobile HBW trip purposes in these two areas. We collected information on mean travel time to work from the CTPP. Similarly, 2020 employment data was collected at the census block level from the Longitudinal Employer-Household Dynamics (LEHD) dataset.
The 2016–2020 socio-economic data on race, poverty, age, family arrangements, car ownership, and housing value were collected at the census tract levels from the American Community Survey (ACS) database. We also collected the data on ramps and transit stop locations from the 2020 MAF/TIGER geographic database. Although many datasets were initially available at different spatial aggregations, we converted them into TAZs through an area-based conversion where overlapping units were averaged or weighted based on the share of the area of the TAZs. For performing this operation, we used intersection tools in the geographic information system (GIS) environment.
Preliminary Results
We employ Equation 2 to calculate employment accessibility for individual job seekers commuting by transit and automobile to work. Then, we apply Equation 3 to compute the MAG for commuters seeking different job opportunities. Figure 1 presents the spatial distribution of MAGs in the Dallas and Houston areas.
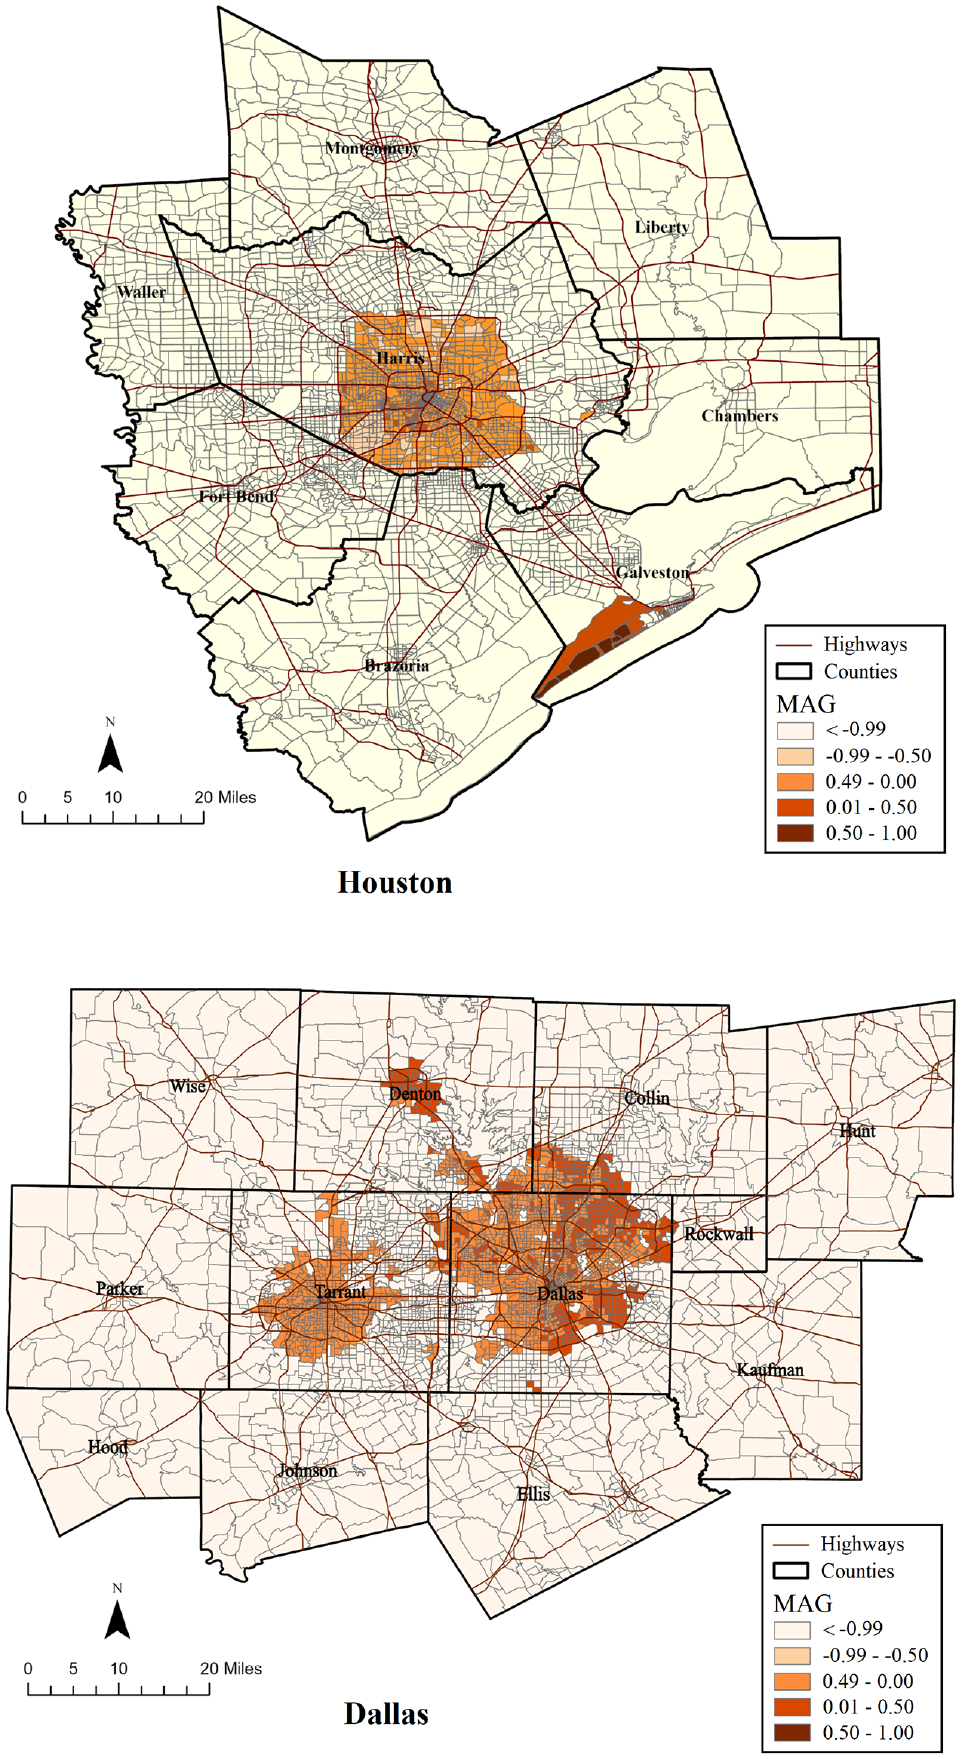
Modal accessibility gap (MAG) in the Dallas and Houston metro areas.
As revealed in Figure 1, there are high MAG values in the downtown area of Harris County and certain parts of Galveston County in the Houston area. Conversely, considerably higher MAG values are evident, spanning across Dallas, Tarrant, Denton, Collin Counties, and certain areas of Rockwall County in the DFW region. This pattern is attributed to the presence of well-established public transit infrastructure in these counties, accommodating major employment centers. The MAG values in both metropolitan areas decrease outside these counties, reflecting the limited extent of major transit services. The notable prevalence of high MAG values in the DFW area, when compared to Houston, especially in areas served by public transit, suggests that public transit equity is considerably higher in the DFW area compared to that in the Houston region.
Table 2 shows that the Houston and Dallas areas are similar with respect to racial/ethnic composition, socio-economics, and automobile accessibility. However, when it comes to transit, both WC and BC jobs have higher levels of accessibility in the DFW region than in Houston, indicating a disparity in transit accessibility between the two areas. We include region as a proxy for zoning in this study. When comparing the means of most variables between the two areas, a considerable and statistically significant difference emerges in transit accessibility variables, as well as land use and built environment variables. The share of commercial and industrial land use, along with the value of land use entropy (indicative of land use diversity), is much higher in Dallas than in Houston. This indicates that a significantly higher number of TAZs in Dallas offer convenient access to diverse land uses than in Houston.
Definitions, Data Sources, Descriptive Statistics, and T-Test Results
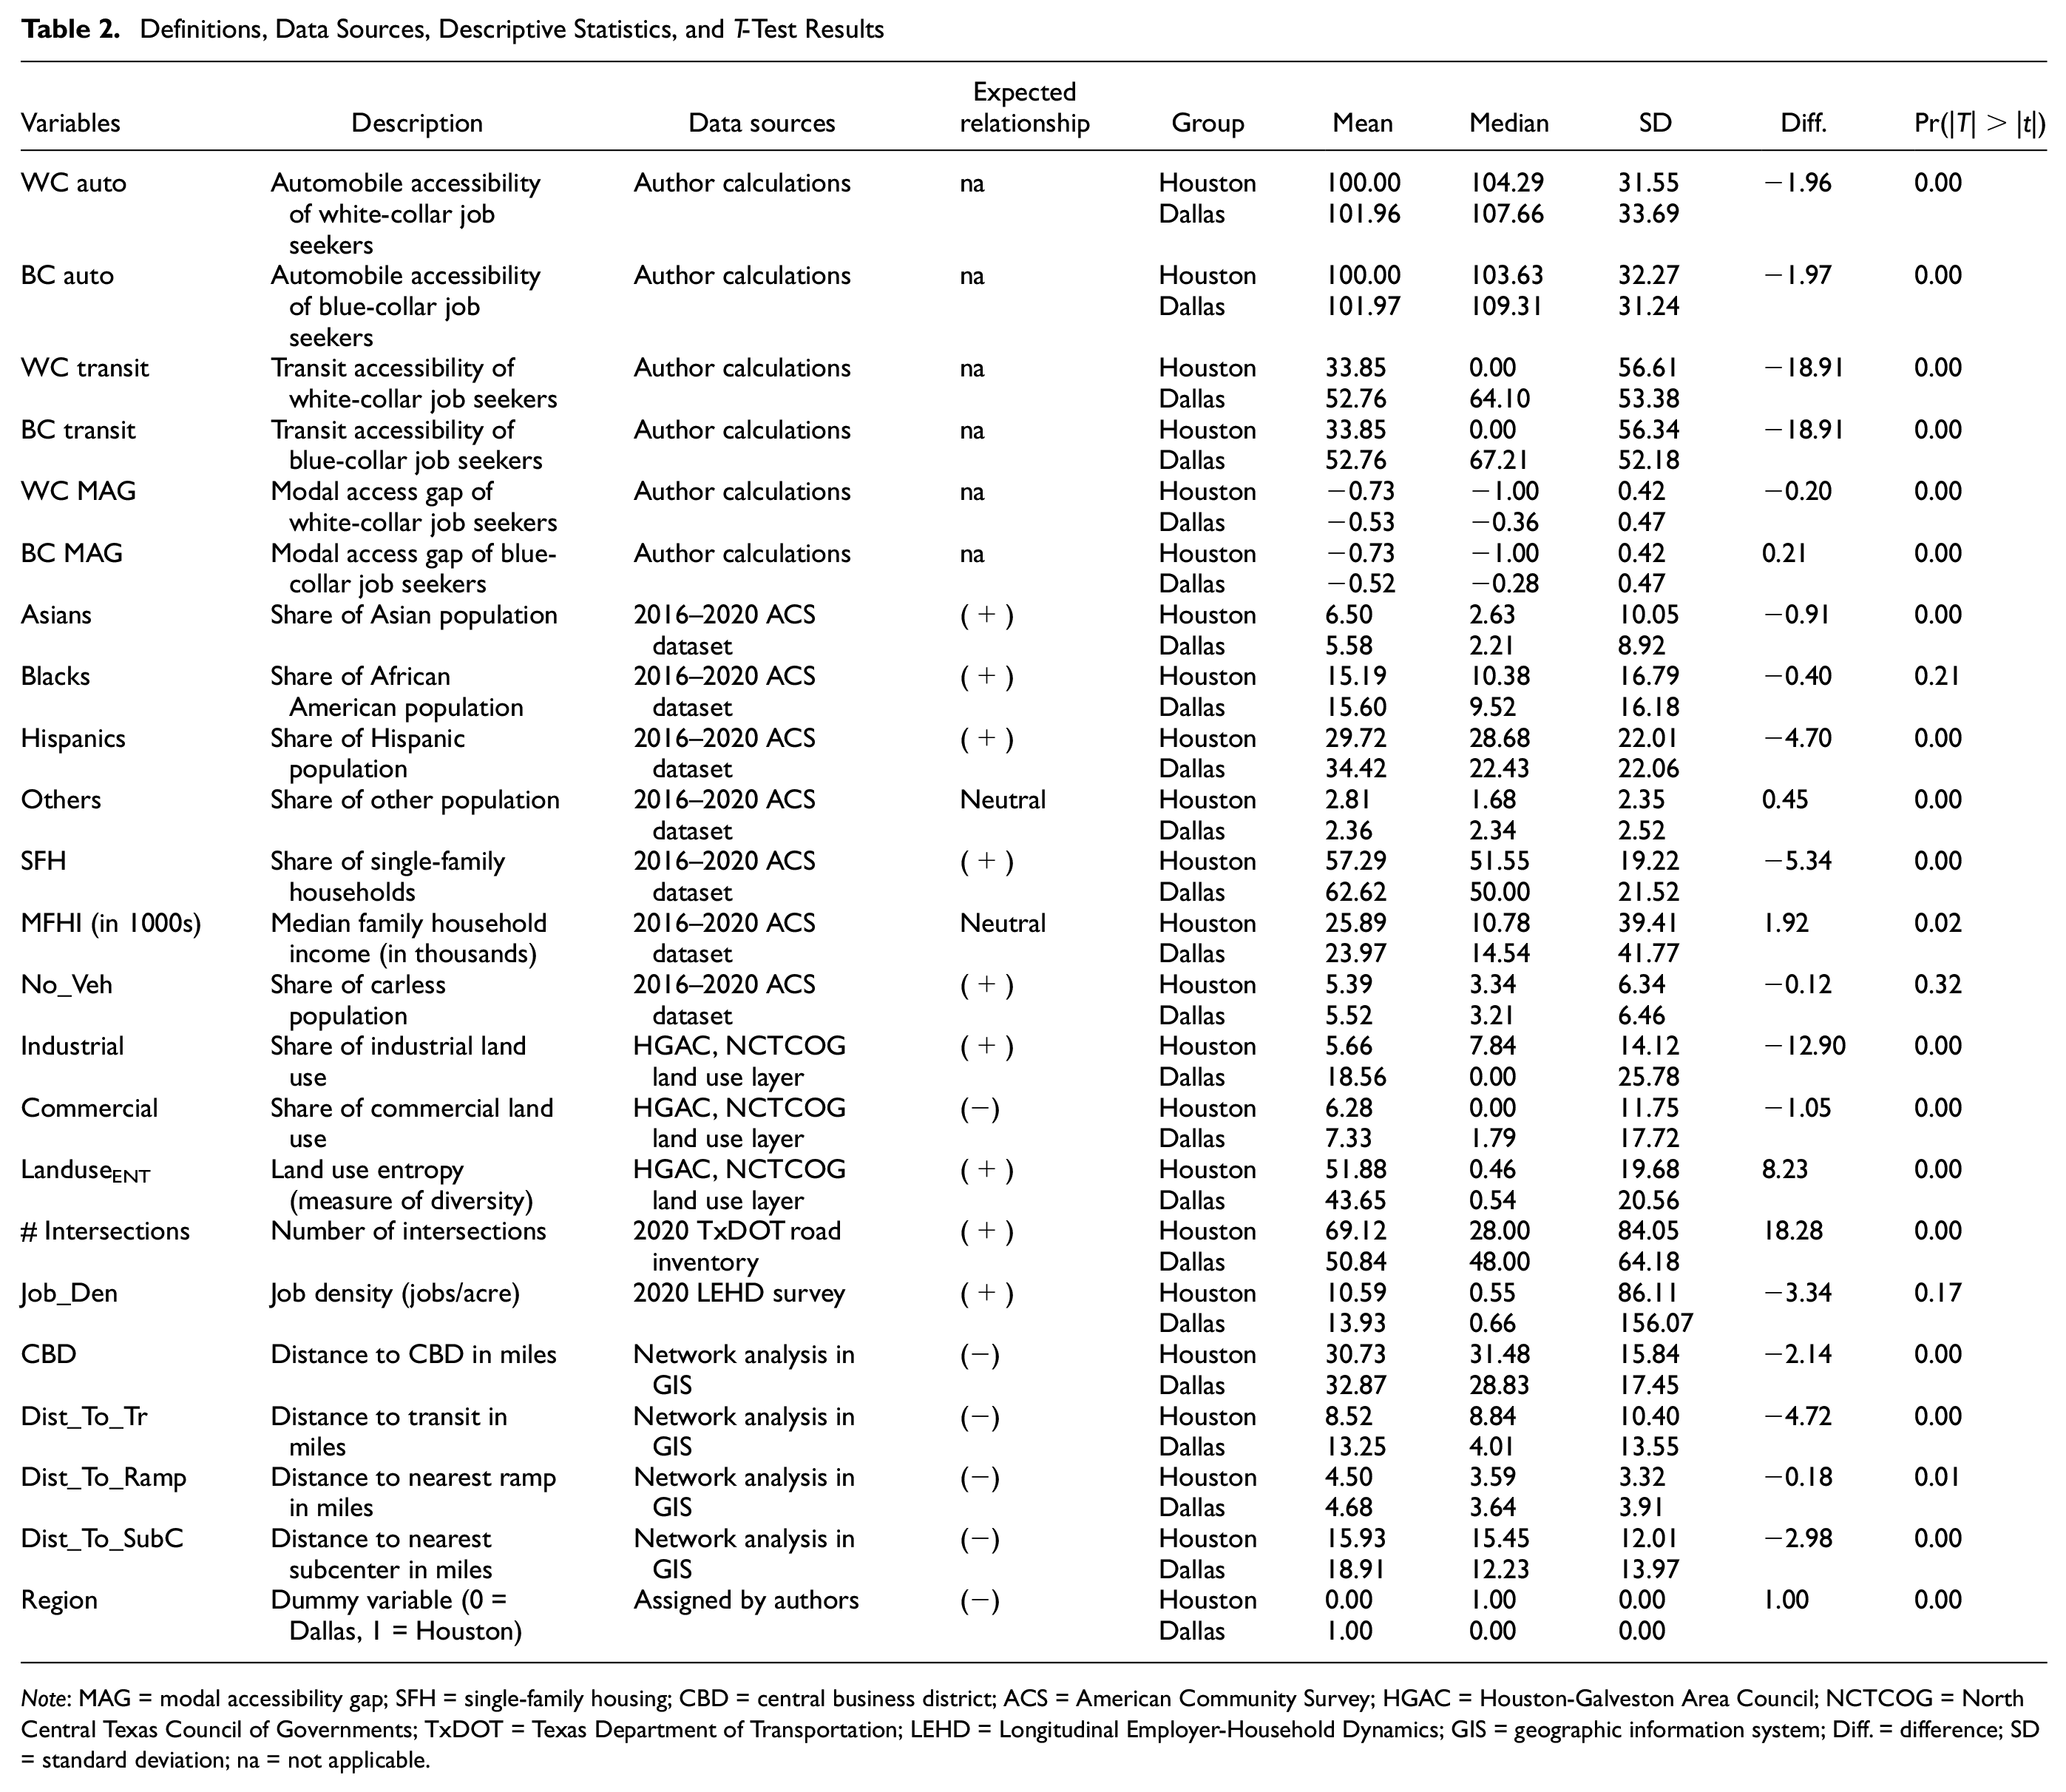
Note: MAG = modal accessibility gap; SFH = single-family housing; CBD = central business district; ACS = American Community Survey; HGAC = Houston-Galveston Area Council; NCTCOG = North Central Texas Council of Governments; TxDOT = Texas Department of Transportation; LEHD = Longitudinal Employer-Household Dynamics; GIS = geographic information system; Diff. = difference; SD = standard deviation; na = not applicable.
Modeling Results
Table 3 reports the SDM results for transportation equity related to BC and WC jobs in the Houston, Dallas, and combined models, respectively. Column one in Table 3 lists all the independent variables used in the models. Here, W*MAG and e.MAG represent the spatial lags of the dependent variable and its associated error term. Note that the variable “Region” is a proxy and only used in the combined model to measure the impact of “zoning” on transportation equity. The model results indicate that the stepwise regression selects only distance-related variables for the DFW region, which speaks to the close relationship of equity outcomes to distance variables in the region. However, several sociodemographic and land use variables play a part in explaining transportation equity outcomes in Houston. The results of the combined model, reported in the last two columns, show that several variables in the sociodemographic, built environment, and the spatial effect categories are significant in transportation equity. A zoning effect is observed.
Spatial Durbin Model Results for Modal Accessibility Gaps (MAGs) of Houston and Dallas
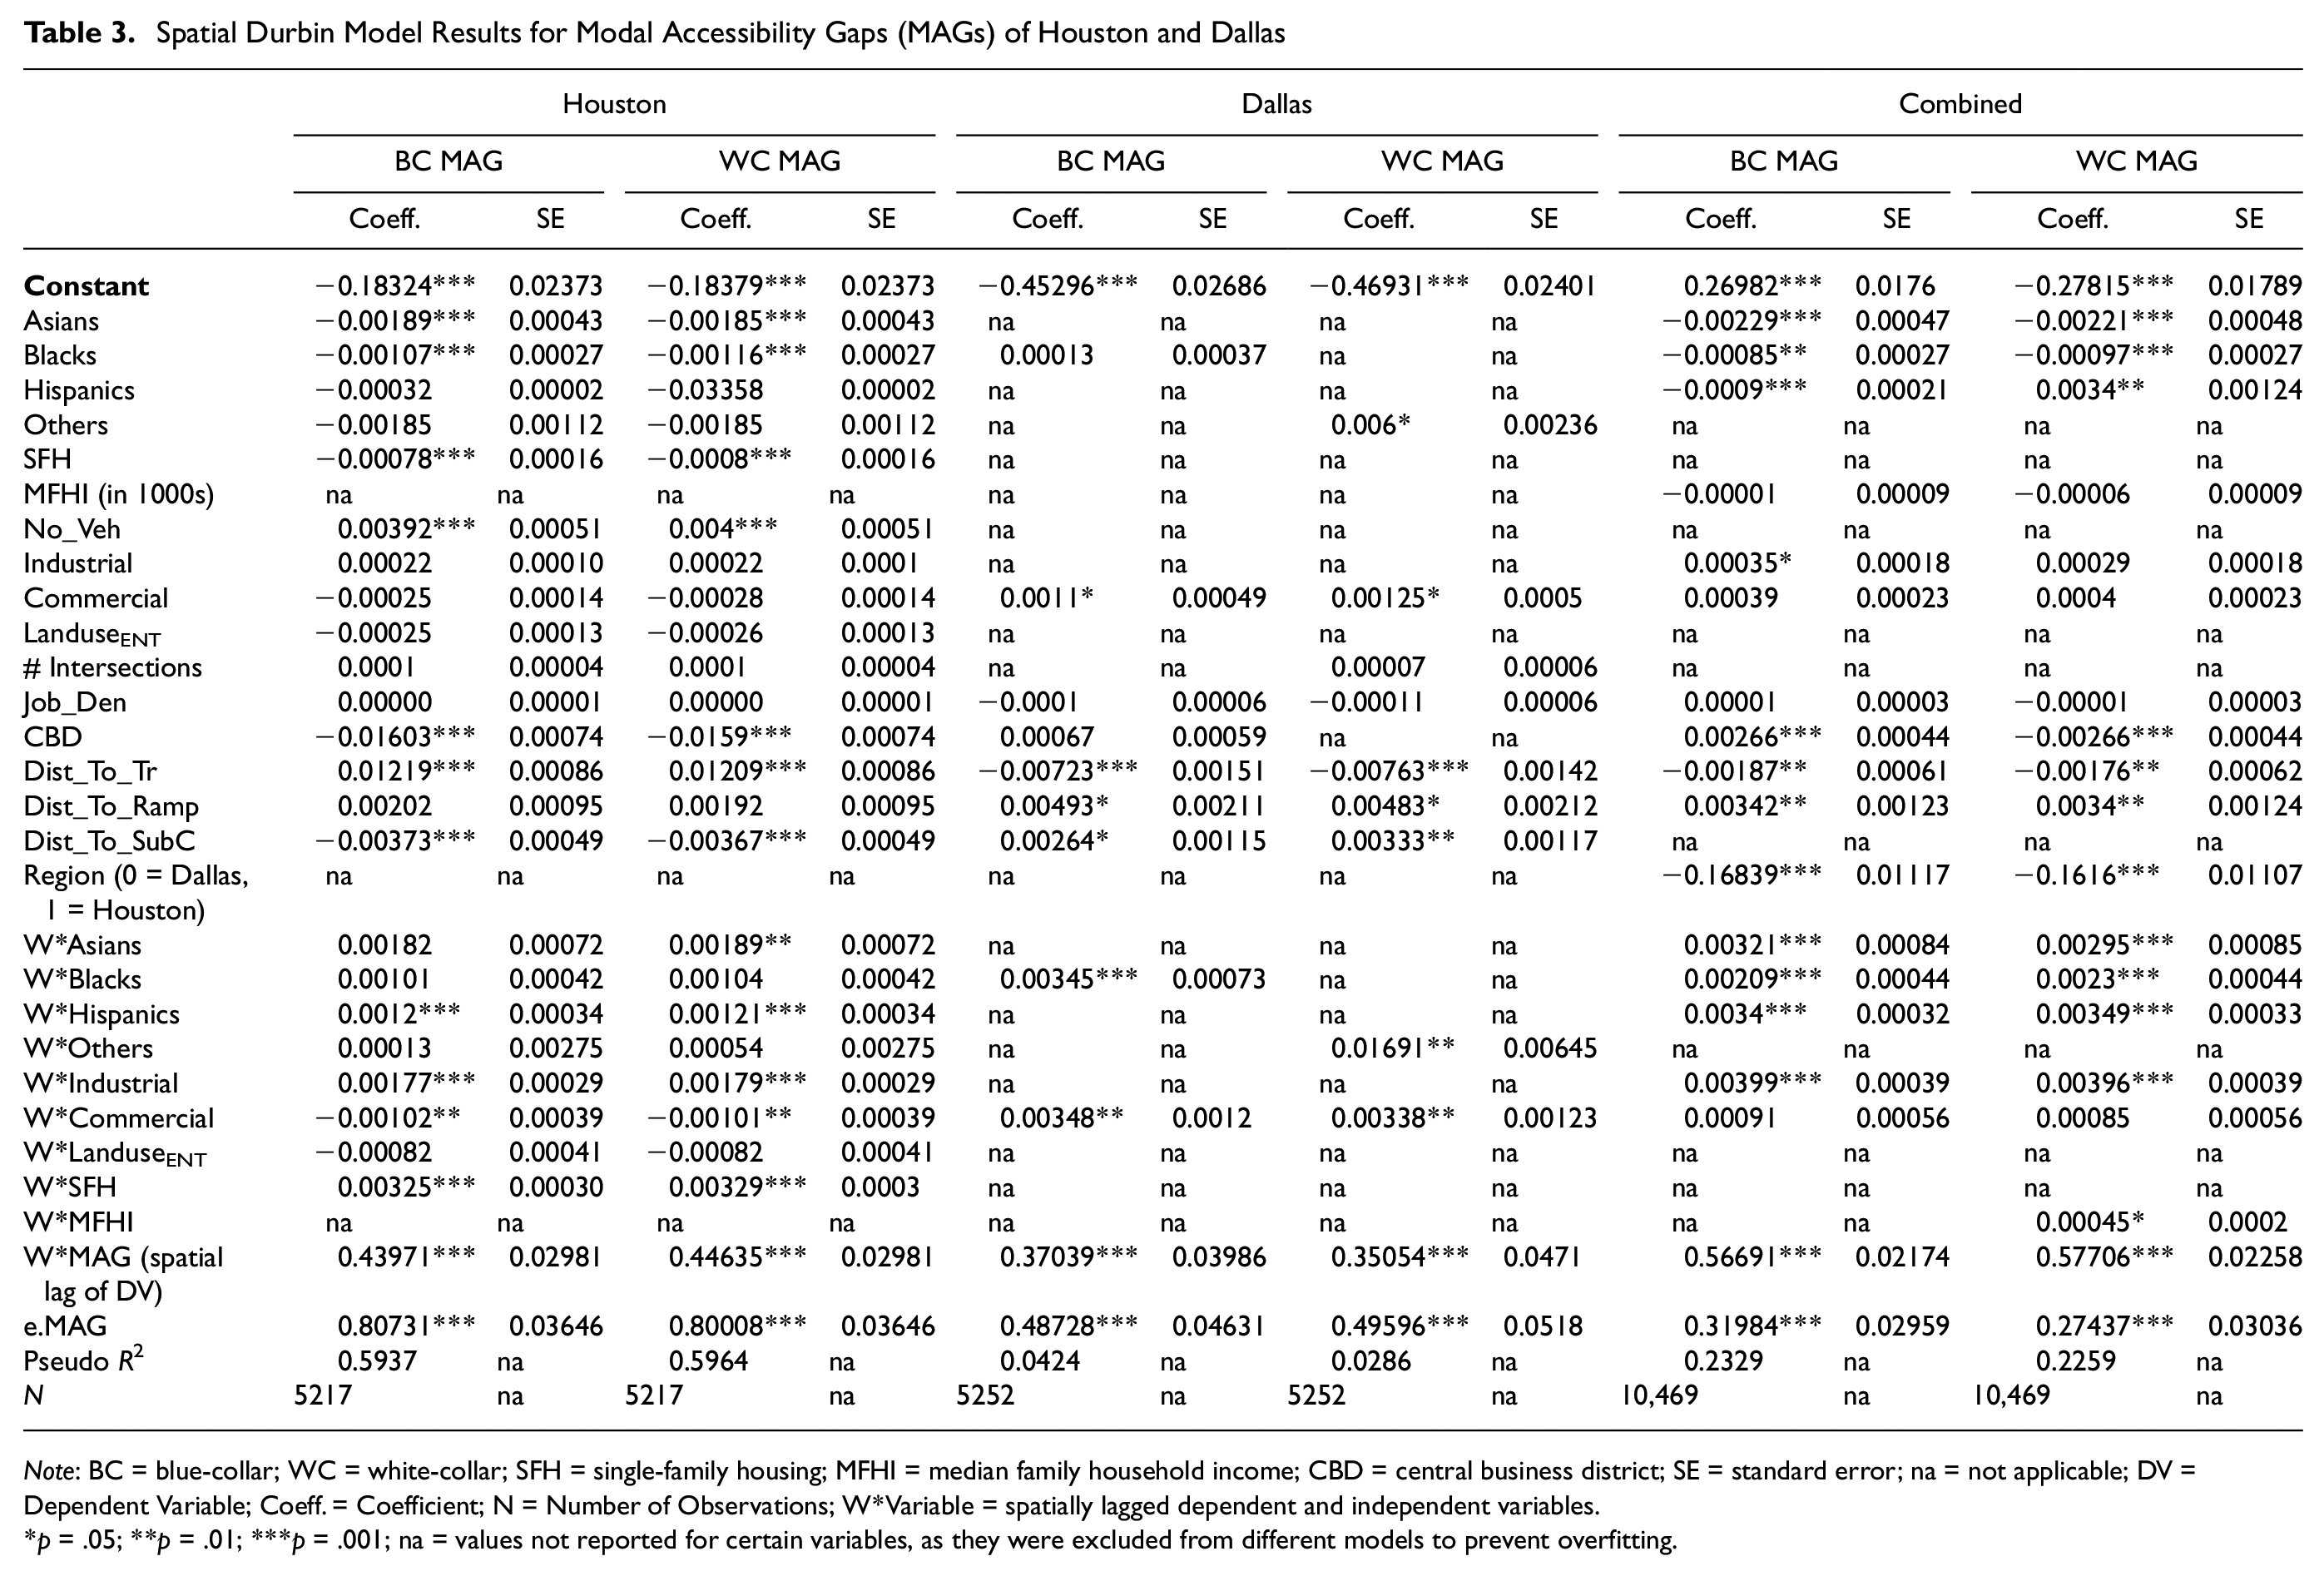
Note: BC = blue-collar; WC = white-collar; SFH = single-family housing; MFHI = median family household income; CBD = central business district; SE = standard error; na = not applicable; DV = Dependent Variable; Coeff. = Coefficient; N = Number of Observations; W*Variable = spatially lagged dependent and independent variables.
p = .05; **p = .01; ***p = .001; na = values not reported for certain variables, as they were excluded from different models to prevent overfitting.
The model results in Houston yield high pseudo R-square values, 0.5937 and 0.59640 in BC MAG for BC job seekers and WC MAG for WC job seekers, respectively. Contrastingly, the model performance for Dallas is not as good as for Houston, with the models yielding low pseudo R-square values of 0.0424 and 0.0286 in BC MAG and WC MAG, respectively. These results imply a better fit of the independent variables to explain the MAGs in Houston than that in Dallas. The low R-square values for the Dallas model stem from our deliberate choice of employing backward stepwise OLS regressions and the limited number of explanatory variables as the result of the chosen method. As stated earlier, these regressions were employed to identify the optimal subset of variables ( 62 ) that would maximize the model’s fit to the data while penalizing excessive model complexity. This approach was chosen to calibrate the OLS regression models ( 76 ) by striking a balance between capturing the essential patterns in the data and avoiding overfitting. Similarly, the pseudo R-square values of the combined model are 0.2329 and 0.2259 for BC MAG and WC MAG, respectively. In the following parts, we first report the results of the combined models, followed by the key findings of the models for the two study areas for comparison purposes. Finally, we present the results of the direct and spatial spillover effects.
Findings of the Combined Models
In our combined model, accounting for the impact of various variables, zoning has a significant influence on transportation equity for BC and WC job seekers in these two cities. For example, the coefficients for “Region” are −0.168 for BC job seekers and −0.161 for WC job seekers, and both are statistically significant at the 0.001 level. The results indicate that transit accessibility in Houston, a city without traditional zoning regulation, is less equitable than that in Dallas, a city with zoning.
Our combined model also shows that minority groups, such as African American, Asian, and BC Hispanic groups, are negatively associated with MAGs. For example, the coefficient for Asians is −0.00229 in the BC MAG model and −0.00221 in the WC MAG model. Similarly, the coefficient for Blacks is −0.00085 in the BC MAG model and −0.00097 in the WC MAG model. The coefficient for the Hispanic group is −0.0009 in the BC MAG model and −0.0034 in the WC MAG model. All of these are statistically significant at the 0.001 level. The model results also show a negative relationship between MAG and income, although the results are not statistically significant at the 0.05 level. The spatial lagged variables of the sociodemographic indicators are also significant. These results indicate that COCs in both areas face several issues related to disparities in accessing jobs through transit infrastructure.
The results also indicate that the distance to transit stops is negatively related to MAGs (−0.00187 for BC and −0.00176 for WC), but the distance to a highway ramp is positively related to MAGs (0.00342 for BC and 0.0034 for WC) in both the BC MAG and WC MAG models. These correlations are all statistically significant at the 0.01 or superior levels. The distance to the CBD is positively correlated with BC MAG but negatively correlated with WC MAG, suggesting that transit services in CBDs are more prevalent but WC jobs are more decentralized in non-CBDs, leading to inequal access to WC jobs.
The coefficients of the spatial lag of the dependent variable are 0.5669 for the BC MAG model and 0.5771 for the WC MAG model, both of which are statistically significant at the 0.001 level. The high and positive values observed in our spatially lagged dependent variables indicate a robust influence of the MAG values in neighboring TAZs on its value at a specific TAZ. This outcome stems from the tendency of similar MAG values to cluster together in space proximity.
Difference between Houston and Dallas
Our models suggest notable differences between Houston and Dallas. In Houston, there is an observed increase in MAGs associated with (a) an increase in the distance to transit stops, that is, each additional mile from transit stops leads to a 0.01219 and 0.01209 unit increase in the BC MAG and WC MAG values, respectively, and (b) a decrease in distance to subcenters and the CBD. Contrastingly, in Dallas, an increase in MAGs is associated with (a) a decrease in distance to transit and (b) an increase in distance to ramps and subcenters. These results suggest that employment opportunities in Dallas are more dispersed and easily accessible by transit compared to Houston, indicating potentially higher equity in job accessibility in Dallas. These findings emphasize the combined effects of transportation and employment centers on MAGs.
While the land use mix had no significant associations, the spatial distribution of specific land use types play an important role in explaining MAGs in the DFW region. Specifically, the model results indicate a significant positive association between commercial land use and MAGs in the DFW area. Such association suggests that commercial areas benefit from exceptional public transit integration in the DFW area.
Further, our results show that single-family housing (SFH) units are significantly and negatively associated with equity in Houston. A one-percentage-point increase in SFH leads to a 0.00078 and 0.0008 decrease in the values of the BC MAG and WC MAG indexes, respectively. This finding aligns with expectations, especially in Houston, where zoning regulations are controlled by homeowner associations through restrictive covenants, which can sometimes be more restricted than zoning ordinances. These restrictive controls may lead to a situation where the development of SFH units has a more negative impact on equity, as they might be associated with a lack of housing diversity and affordability, potentially leading to inequitable outcomes for COCs.
Our analysis reveals a clear influence of several sociodemographic, transportation, built environment, and zoning variables on both our combined model and the individual models for the Houston and Dallas areas. Furthermore, when we consider all other variables in our combined model, it becomes evident that Dallas area outperforms Houston significantly with respect to transportation equity.
Direct and Spatial Spillover Effects
To gain a more comprehensive understanding of how independent variables affect the dependent variable in a spatial context, we investigated both direct and spillover effects ( 77 , 78 ). Direct effects show the impacts of an explanatory variable within a particular TAZ on the dependent variable within the same TAZ. Simultaneously, spillover effects shed light on how the same explanatory variable influences the dependent variable in neighboring TAZs. Table 4 reports the direct, spatial spillover (indirect), and total effects of our independent variables on MAGs.
The Direct, Spatial Spillover, and Total Effects of Explanatory Variables
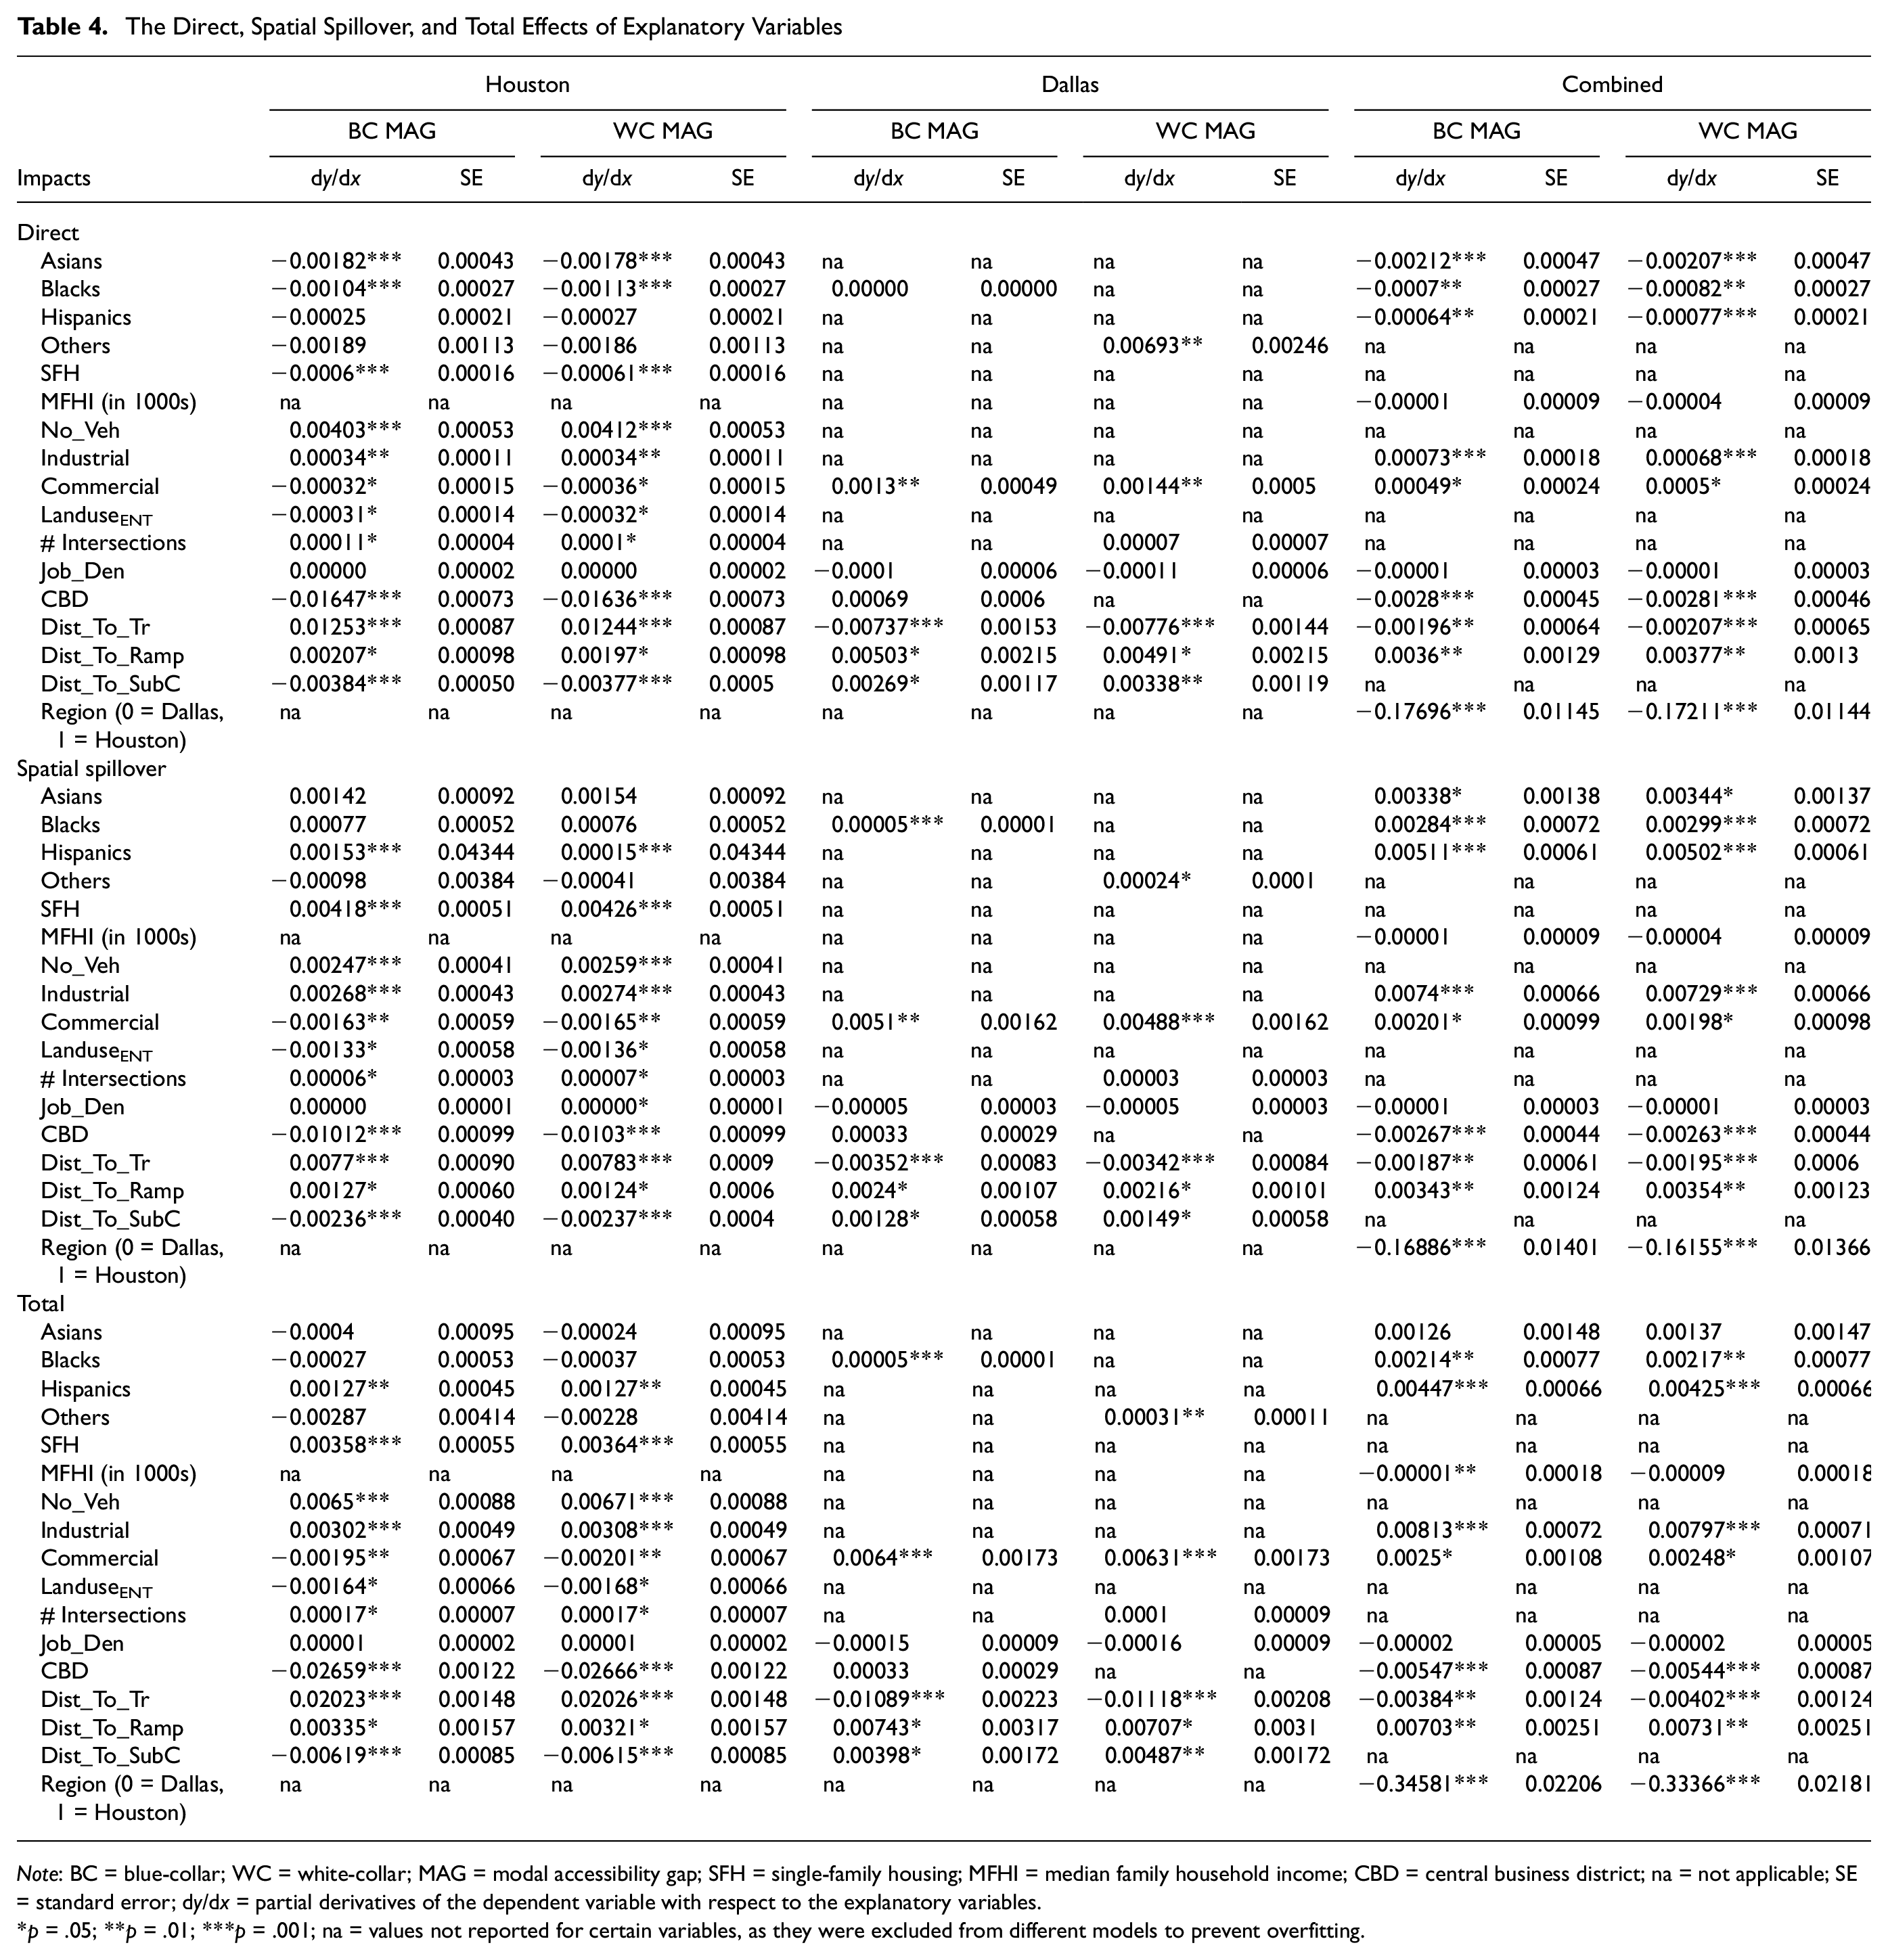
Note: BC = blue-collar; WC = white-collar; MAG = modal accessibility gap; SFH = single-family housing; MFHI = median family household income; CBD = central business district; na = not applicable; SE = standard error; dy/dx = partial derivatives of the dependent variable with respect to the explanatory variables.
p = .05; **p = .01; ***p = .001; na = values not reported for certain variables, as they were excluded from different models to prevent overfitting.
Our analysis reveals that the influence of land use variables on MAGs is predominantly mediated through their spatial spillover, or spillover effects, rather than their direct impacts. For example, in the City of Houston, we find that the spatial spillover effects of land use entropy and industrial land use variables are nearly 10 times more influential than their direct effects. Specifically, in the case of BC MAGs, the spillover impact of a one-percentage-point increase in the industrial land use results in a 0.00268 unit decrease in the BC MAG index. In contrast, the direct impact of a one-percentage-point increase in industrial land use leads to a decrease in BC MAGs by approximately 0.00034 units. Clearly, we see that the spatial spillover effects of industrial land use on BC MAGs are 10 times more impactful than the direct effects.
As the influence of zoning is inherently integrated into land use structure and building density, we investigated the direct and indirect impacts of land use and SFH unit variables on MAGs in both the Dallas and Houston regions. Our findings revealed increased spatial spillover effects when compared to the direct effects for both land use and SFH variables. In our comparison of the spatial spillover impacts and direct impacts of commercial land uses in the two areas, we observed a more pronounced spillover effect (when compared to the direct effects) in Houston than in Dallas. Moreover, in Houston, the spillover effects of SFH unit variables exhibit a significantly greater influence than their direct effects, underscoring the substantial impact of low-density sprawled development housing types on equity outcomes. Based on these results, we expect that Dallas (a city with zoning) has a more equitable transportation system than Houston (a city without zoning).
Notably, the variable “distance to transit” stands out, exhibiting direct impacts that significantly surpass its spatial spillover effects compared to other distance-related variables. This indicates that the impact of transit is more concentrated at a local level than spreading across a broader region. Nevertheless, the spillover effects of “distance to transit” in Dallas exceed those in Houston when compared to their respective direct effects. These findings indicate that the distribution of transit services in Dallas is more extensive, leading to broader-reaching spillover impacts. Moreover, our combined model for the two areas emphasizes the importance of clustering sociodemographic variables. It reveals that, in line with the existing literature, the spatial spillover impact of the presence of COCs in these areas surpasses the direct effects, underscoring their significant influence on transportation equity outcomes within the region.
Conclusion and Policy Recommendations
Single-use zoning and automobile use have significantly affected the mobility of COCs, especially for carless populations. However, there has been limited exploration of the MAG to assess the spatial equity in accessibility for these groups. It is crucial for scholars to explore the associations among land use regulations, transportation infrastructure, and transportation equity because the findings can support transportation and land use policies and decision-making to promote equity. This study contributes to the literature by adopting a nuanced job accessibility measure to calculate MAGs and to investigate the relevance of land use policies, such as zoning regulations, in determining transportation equity, and how these outcomes vary between zoning and non-zoning cities. The nuanced job accessibility measure controls for both job and travel mode types. Scholars and practitioners could use it to investigate the distribution of transportation benefits and burdens and further discover the contributing factors. This study also serves as an example for future researchers to consider the spatial spillover impact of different socio-economic groups on transportation and EJ outcomes.
We found that MAG inequality varied considerably in Dallas and Houston. The high MAG value in Dallas suggests the area has a well-integrated and extended transit system. Houston, on the other hand, had minimal transit accessibility. Our maps showed that the MAG inequality in Dallas was much less than that in Houston.
We did not find much difference in the MAG inequalities between BC and WC job seekers in the two areas. Nevertheless, MAG inequalities are strongly associated with transportation infrastructure factors such as distance to CBDs, transit stops, highway ramps, and subcenters. These findings suggest that employment center proximity and well-connected transportation infrastructure could significantly affect MAGs in the regions. However, distance to transit has positive and negative signs in Dallas and Houston, respectively. The reverse is true for the distance to subcenters variable. Our model also demonstrated two significant findings associated with commercial land uses: (a) commercial land uses have higher spillover impacts on MAGs than direct impacts, and (b) the MAG is negatively associated with commercial land use in Houston but positively associated in Dallas. In addition, we find that SFH units also have higher spillover impacts on MAGs. These results suggest that (a) a higher clustering of commercial land uses and SFH units perpetuates inequalities in access to jobs in Houston and (b) Dallas has a better situation with respect to transportation equity than Houston.
The trend of suburbanization and the development of interstate highways have resulted in a shift of commercial activity toward highway interchanges, causing a significant change in job distribution and equity outcomes (79–81). Given the importance of accessibility for commercial land uses and the predominant car-oriented development patterns in cities such as Houston, it is crucial to address the lack of multi-modal transportation options in commercial areas ( 82 ). One strategy to tackle this issue at the city and regional level is to expand the transit-oriented development (TOD) inventory of the metro area by identifying commercial hubs with the highest potential for TOD implementation.
To ensure the successful implementation of this policy, zoning regulations should be carefully designed. These regulations should prevent the added accessibility, walkability, and other TOD benefits from causing a spike in housing prices nearby. This is particularly important to prevent gentrification and ensure affordability, especially for COCs. Inclusionary zoning, mandates for affordable housing set-asides, provision of density bonuses, establishment of neighborhood-level TOD associations, and implementation of community land trust initiatives are key avenues to achieve equitable TOD planning.
It is worth noting that the direct impact of proximity to transit stops was more significant locally than at the regional level in both areas. In other words, the impact of transit provision is much more limited than other transportation factors, such as distance to ramps and subcenters. While this outcome aligns with expectations, this result warns against the incapability of transit to improve transportation equity beyond its local catchment area. For U.S. cities with high levels of auto-orientation, these results signify the need for an inclusive approach to catering to the mobility needs of the population, especially minority groups. This can be done by a coordinated affordable housing, public transit extension for future developments, and the formulation of short-term programs designated to identify transit captive populations and recommend physical interventions, such as complete street policies prioritized by levels of captivity.
Finally, our combined model highlighted that COCs in both cities face severe equity issues related to accessing jobs through transit infrastructure. However, we find that Dallas is slightly better with respect to transportation equity compared to Houston. In Houston, homeowner associations have enabled middle- and upper-class neighborhoods while adversely affecting COCs for decades. Steering landfills, incinerators, and dump sites close to racial minority neighborhoods have exacerbated the stigmatization of COCs, devalued their land, and finally prevented the neighborhoods attracting sufficient levels of urban services, including transportation. Leaving the destiny of Houston neighborhoods in the hands of homeowner associations has affected lower-income and minority neighborhoods with higher turnover rates and less homeowners more severely, contributing to a myriad of EJ and transportation equity issues, the gist of which was highlighted in this study ( 81 , 83 ).
Our analysis suggests that zoning regulations, sociodemographic factors, and transportation infrastructure are all essential in influencing MAGs. These findings hold important implications for planning. The presence of high MAG inequity gaps in some areas underscores the necessity for targeted investments to improve accessibility for transit and non-motorized commuting modes. In areas heavily reliant on automobiles, it would be beneficial to concentrate on providing more tailored services for individuals without cars and improving the connectivity between existing transportation systems, especially for the first/last mile of their journeys. These requirements could be fulfilled by subsidizing services offered by transportation network companies for COC groups. Likewise, short- and long-term planning could help incorporate equity into transportation planning practice ( 84 ). Short-term plans should focus on increasing the regularity and frequency of transit headways, particularly in areas with high transit demand. Meanwhile, long-term plans could concentrate on planning for an inclusive zoning system seamlessly integrated with affordable and safe transit infrastructure.
Our study comes with certain limitations. The MAG variable we used has it values bounded between −1 and 1, with −1 representing the complete absence of transit, which in our case is extremely important to consider. Because of this, we have not applied any kind of transformation on our dependent variable. However, this could indeed obscure the estimation of model coefficients and lead to biases ( 85 , 86 ) because of the presence of heteroscedastic and non-normal error terms. While some amount of this heteroscedasticity is addressed by our consideration of the spatial spillover effects, it is still important to address this issue. Thus, we propose the following method for future adoption of MAGs: (1) rescale the variable to a scalable range, such as 0–1, to better accommodate the continuous nature of the underlying process; (2) adopt two-part mixture models, which are well-suited for handling semicontinuous data ( 87 ); and (3) explore alternative modeling approaches, such as Tobit regression or censored quantile regression, depending on the specific distribution of the semi continuous dependent variable ( 88 ). By addressing the truncation of the response variable and adopting appropriate modeling techniques, future research can better evaluate the impacts of various factors on the MAG while mitigating potential biases in the coefficient estimates.
We employed job accessibility to measure the MAG. However, it is also necessary to evaluate how populations suffer from MAG inequities while accessing other destinations, such as grocery stores or hospitals. Future studies should explore other commuting alternatives, such as ridesharing and biking. We compared Dallas (a zoning city) with Houston (a non-zoning city). However, in Houston, land uses are controlled by homeowner associations through restrictive covenants, which can sometimes be more restricted than zoning ordinances. Thus, comparing two non-zoning cities, one controlled by similar organizations and one uncontrolled, is also necessary. Moreover, the region dummy variable can be utilized to elucidate the unobserved distinctions between the two cities, stemming from various factors such as history, culture, and political influences. Zoning regulation, being just one facet among numerous contributors to these differences, cannot provide a comprehensive representation of the overall difference between Dallas and Houston. Despite their similar population growth and commuting trends, other influential factors may differentiate the two areas apart. Therefore, relying solely on the dummy variable for examining the impact of zoning is inadequate. Consequently, future scholars could take into consideration all the different factors mentioned above into their analytical framework. Finally, although the spatial models in this study shed light on correlations, it is essential to exercise caution when drawing causal inferences with respect to the relationship between transportation equity and zoning regulations. Addressing this research gap should be an important topic to cover in future research.
Footnotes
Acknowledgements
The authors would like to thank and acknowledge their partners and data sources in this effort, North Central Texas Council of Governments (NCTCOG) and Metropolitan Transit Authority of Harris County (METRO) for providing required data and support. The authors would like to also thank Dr. Tongbin Teresa Qu for her valuable feedback throughout the research.
Author Contributions
The authors confirm contribution to the paper as follows: study conception and design: S. Kharel, S. Sharifiasl, Q. Pan; data collection: S. Kharel, S. Sharifiasl; analysis and interpretation of results: S. Kharel, S. Sharifiasl, J. Li; draft manuscript preparation: S. Kharel, S. Sharifiasl, Q. Pan, J. Li. All authors reviewed the results and approved the final version of the manuscript.
Declaration of Conflicting Interests
The author(s) declared no potential conflicts of interest with respect to the research, authorship, and/or publication of this article.
Funding
The author(s) disclosed receipt of the following financial support for the research, authorship, and/or publication of this article: This research was funded by the Center for Transportation, Equity, Decisions, & Dollars (CTEDD) and the Cooperative Mobility for Competitive Megaregions (CM2) Center.