
Abstract
After 30 years, the German Mobility Panel ceased data collection in the summer of 2023, despite being considered a successful and benchmark-worthy survey about everyday travel. This article gives an overview of the survey’s central ideas, purpose, and design, thoughts about the usefulness and applicability of the data, and explains why the survey has been terminated. It ends up with the experiences made with the MOP. Lastly, a synthesis based on the lessons learned is used to derive recommendations that can help implement future longitudinal surveys.
Starting in 1994, the German Mobility Panel (MOP) was conducted annually as a national household travel survey (NHTS). To the authors’ knowledge, MOP was the longest-lasting panel survey worldwide collecting data on travel behavior. In January 2024, MOP was discontinued, despite its reputation as a successful and exemplary NHTS. With its long duration, the survey provided an exceptional time series based on a nearly unchanged design. Moreover, by collecting data with a 7-day travel diary and a rotating panel approach in which participants report in up to three consecutive years, MOP collected data that allowed for investigating changes and variations in travel behavior within an intraindividual longitudinal perspective.
Over the decades, multiple changes have affected travel behavior and how travel surveys are conducted; for example, stricter privacy guidelines and technological innovations for collecting individual behavioral data (e.g., global positioning system [GPS]-based surveys). While one of the most essential principles of MOP was to keep the time series consistent and to limit methodological effects, the gap between it and the state-of-the-art of travel surveys became more extensive over the years, which resulted in the termination of the survey. The final official and contracted survey analyses were conducted in summer 2023.
In light of this, this paper aims to recapitulate the design of MOP and the applicability of the data collected. For this, we illustrate for which purposes MOP has provided data; that is, which investigations and analyses were only possible by taking special account of longitudinally oriented data. Further, this paper aims to highlight the need to consider travel behavior over the course of 1 week and between years by presenting relevant analyses of travel behavior that contributed significantly to the understanding of travel behavior in the past. However, we also critically reflect on the survey design and discuss the lessons learned from establishing and maintaining a longitudinal travel behavior survey. This paper further discusses what the authors consider relevant aspects of the MOP experience for the international readership for future longitudinal surveys, as information on MOP is mainly available in German.
This paper will begin by briefly explaining the circumstances in which MOP was initially implemented in the early 1990s and the expectations and intentions behind it. Subsequently, we provide a concise overview of the survey’s design, including the relevant adaptations made over time. We then present central analyses that illustrate the power of MOP data. A critical discussion about the limitations of the survey and the data collected follows. The paper concludes with findings that may be useful for future research and the implementation of future longitudinal surveys, that is, lessons learned from the MOP project over 30 years.
Historical Background — Considerations for a Panel Survey
During the 1970s and 1980s, the understanding of travel behavior and demand, particularly in Germany and probably in other Western societies, relied primarily on transport statistics and initial cross-sectional travel surveys. One of these surveys, the Kontinuierliche Erhebung zum Verkehrsverhalten (KONTIV), a large-scale NHTS with a 1-day travel diary design, was implemented in Germany and carried out in 1976, 1982, and 1989 ( 1 ). It provided the first series of cross-sectional data. The results of these surveys confirmed the expected trend of growth in travel demand as, for example, more and more people (the generation of “baby boomers”) became car drivers with subsequent processes, such as suburbanization.
Based on this series of snapshots from the KONTIV surveys, the prevailing belief was that change in travel behavior was predominantly unidirectional. Consequently, infrastructure development was primarily driven by the existing demand or expected demand growth without fully considering the underlying processes. Concurrently, various interventions were introduced to influence behavior, such as building new public transport systems in major cities. However, it remained unclear how effective these interventions were, as the available data did not provide clear insights.
In the mid-1980s, empirical investigations revealed that cross-sectional data alone presented limitations in explaining short- and longer-term behavioral changes concerning travel demand ( 2 ). Therefore, a fundamental expansion of the data basis with longitudinal data was needed for a better understanding of societal as well as individual demand processes. The idea of conducting a panel survey emerged as a potential solution: to comprehend how individuals behave in different situations, collecting data from the same individuals in various contexts is necessary. Indeed, the variability in behavior, adaptability of individuals to react, and identification of constraints and patterns can only be observed through a longitudinal perspective, as opposed to the conventional cross-sectional or snapshot-oriented surveys that capture behavior on a single day. Even if such surveys are repeated, they only offer rough descriptions of potential ongoing changes. Thus, it is challenging to distinguish true behavioral changes from day-to-day variations or week-to-week variations. As the intrapersonal day-to-day variability is high, fundamental changes in behavior cannot be identified and distinguished from more-or-less random variations in behavior, without additional information ( 3 – 5 ). Furthermore, the longitudinal observation over only 1 week cannot capture those behavioral changes. A behavior change can only be detected on an interpersonal level in a 1-week survey ( 6 ).
Inspired by other travel behavior panel surveys, such as the Puget Sound Panel and the Dutch Mobility Panel, and recognizing the need to understand the variability in behavior by continuously observing people over extended periods (as discussed in Hanson and Huff), the idea of establishing a similar survey in Germany emerged ( 4 , 5 , 7–9). The two primary goals were to capture the demographic processes of the basic population (German population) on the one side and to trace as many (travel) behavioral changes as possible on the microscopic level (e.g., moving, getting married, changing jobs) on the other ( 10 ).
Before the implementation of MOP, a preliminary feasibility study was conducted in 1992/93, which formed the basis for the design and research objectives of MOP ( 2 ). This initial study tried to address the problems experienced in earlier longitudinal studies, for example, by not overloading the survey with regard to content, respondent burden, and acceptance.
During the execution of KONTIV in 1989, Germany experienced reunification, which meant another relevant driver for travel demand because of the expected economic and societal catching-up process in the former socialistic German Democratic Republic. Furthermore, the KONTIV of 1989 had design issues, restricting data usability ( 11 ). The implementation of MOP took place immediately after its feasibility study, illustrating the need of the scientific community for a longitudinal NHTS to gather travel behavior data. It was set up as a research and development project by the Federal Ministry and evolved into a continuous survey. Shortly after initiating MOP, a survey concerning the fuel consumption and odometer readings of cars among the same households was introduced as an additional component of MOP ( 12 , 13 ). The additional survey was started against the growing discrepancy between the fuel consumption figures provided by the car manufacturers and those observable in daily operations.
Survey Concept—Design and Adaptations
In this section, we present the study concept. First, we present the two surveys in MOP and their setup. After that, we discuss the survey timeline and introduce the rotating panel approach.
Survey on Everyday Travel Behavior
This survey part focuses on collecting data on everyday travel behavior. Approximately 3,000 individuals from 1,800 households participated annually during the last phase. This sample size was smaller initially and was enlarged to allow for more differentiated analyses. The survey is conducted in the fall and spans 1 week. All household members aged 10 years and above are asked to complete a trip diary, providing information on all trips taken during seven consecutive days. This includes details such as distances traveled, transport modes used, trip purposes, and departure and arrival times. Additionally, the corresponding household completes a questionnaire providing sociodemographic information about the household and its members.
Fuel Consumption and Odometer Reading Survey (FCORS)
In addition to the survey on everyday travel, households with at least one car are asked to provide data on car mileage and refueling events. This part of the survey takes place in the subsequent year’s spring and extends over eight weeks (April–June). Approximately 1,200 households with around 1,600 cars participate in this phase. Participants are required to maintain a fuel/charging logbook, documenting all refueling/charging events, including the date, odometer reading, amount of gasoline dispensed, and refueling costs. Information on car characteristics (e.g., year of construction, engine capacity) and car usage patterns (e.g., number of users, special events during the survey period) is also reported. One of the central advantages is that a lot of information about the travel behavior of the household members is already available from the survey on everyday travel. Further, it should be mentioned that this additional element does not affect attrition. In the first years of the survey, only 50% of the car-owning households were asked to fill out the Fuel Consumption and Odometer Reading Survey (FCORS). We observed that there was no significant difference, as far as attrition was concerned, for those with and those without the additional survey. For the participants, it seems to be meaningful to report in FCORS.
Survey Methodology—Characteristics and Timeline
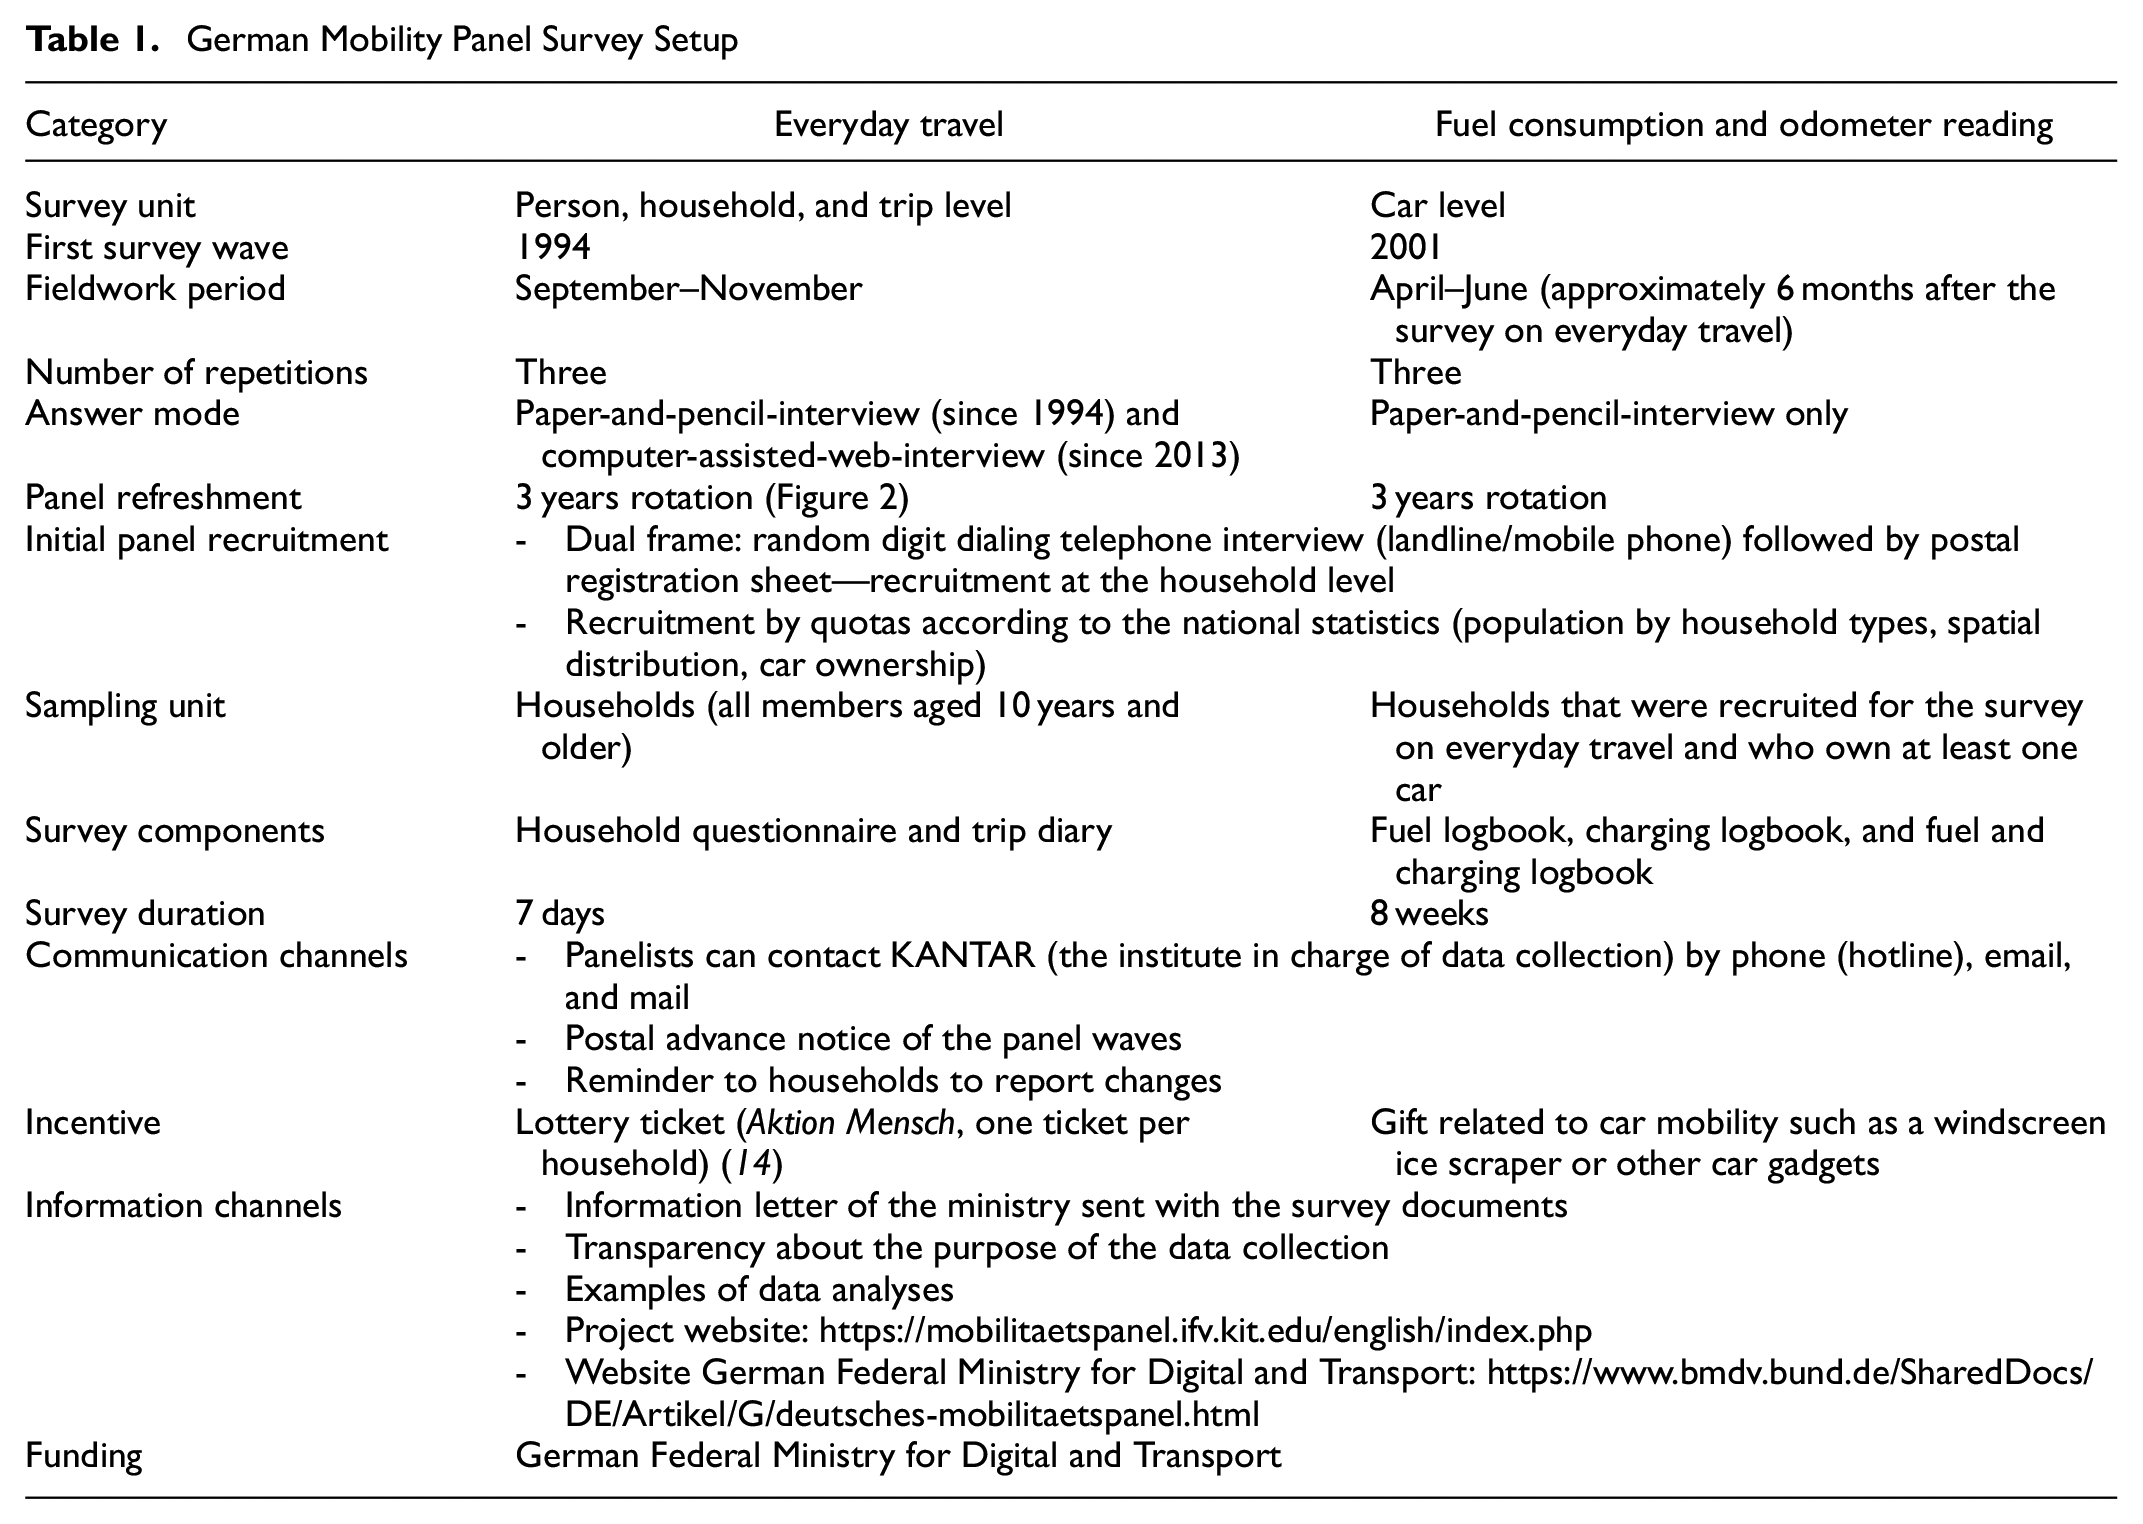
The overall MOP data collection setup is presented in Table 1. MOP consists of three research instruments: one household questionnaire (sociodemographic characteristics), one diary questionnaire for everyday travel, and one diary questionnaire for refueling /charging events, respectively. All documents are sent by mail (see Figure 1).
German Mobility Panel Survey Setup
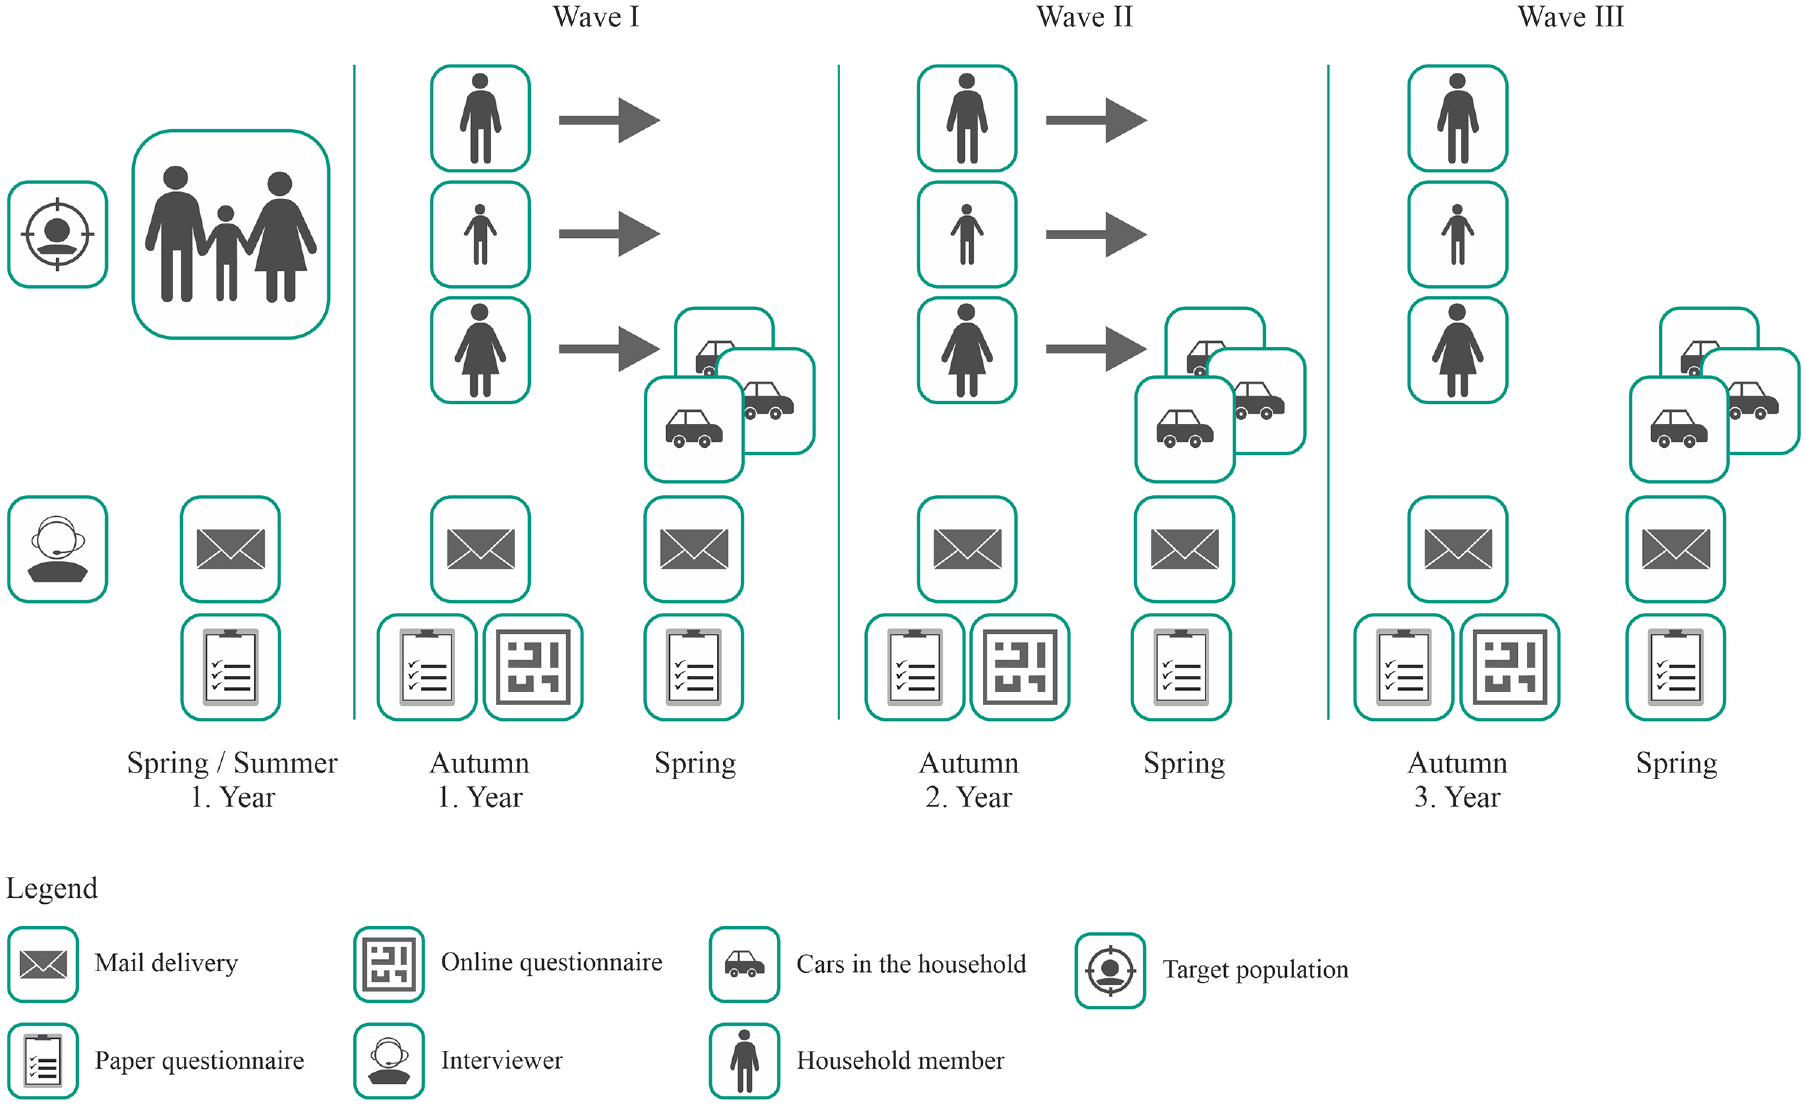
Exemplary survey timeline of one cohort.
From its beginning in 1994, MOP was funded by the German Federal Ministry for Digital and Transport (BMDV). The contractual structure divided the work into two parts: fieldwork, which was carried out by a market research company, and scientific supervision, which was carried out by the Institute for Transport Studies at Karlsruhe Institute of Technology. For each cohort, a new call for tender was carried out to achieve competition between market research companies and thus reduce the cost of the fieldwork. This was only possible because of the high standardization with fixed and well-defined processes, procedures, and schedules. However, this restricted the flexibility for adapting the survey during the ongoing survey, as public procurement laws need an early and detailed definition of the fieldwork.
Figure 1 illustrates the basic timeline for 3 years of each cohort from the initial recruitment until the last survey. After recruiting households in spring/summer in the first year in which people commit to participating, all household members above 10 years old are asked to fill in the trip diary, which can be completed by paper or web. The following spring, FCORS is conducted. It is a paper-based survey, as the questionnaire is usually stored in the car. This procedure is repeated in the second as well as the third year. Participants are also asked to report major changes, especially household moves.
MOP follows a rotating panel design, wherein participants are asked to voluntarily participate for three consecutive years (see Figure 2). Including FCORS means reporting a maximum of six times for car-owning households and three times for car-less households. This results in a contract with the fieldwork companies for more than 3 years for each cohort, which aligns with the federal budget. This aspect is crucial, as it means restricting the idea of more survey waves for the same individuals.
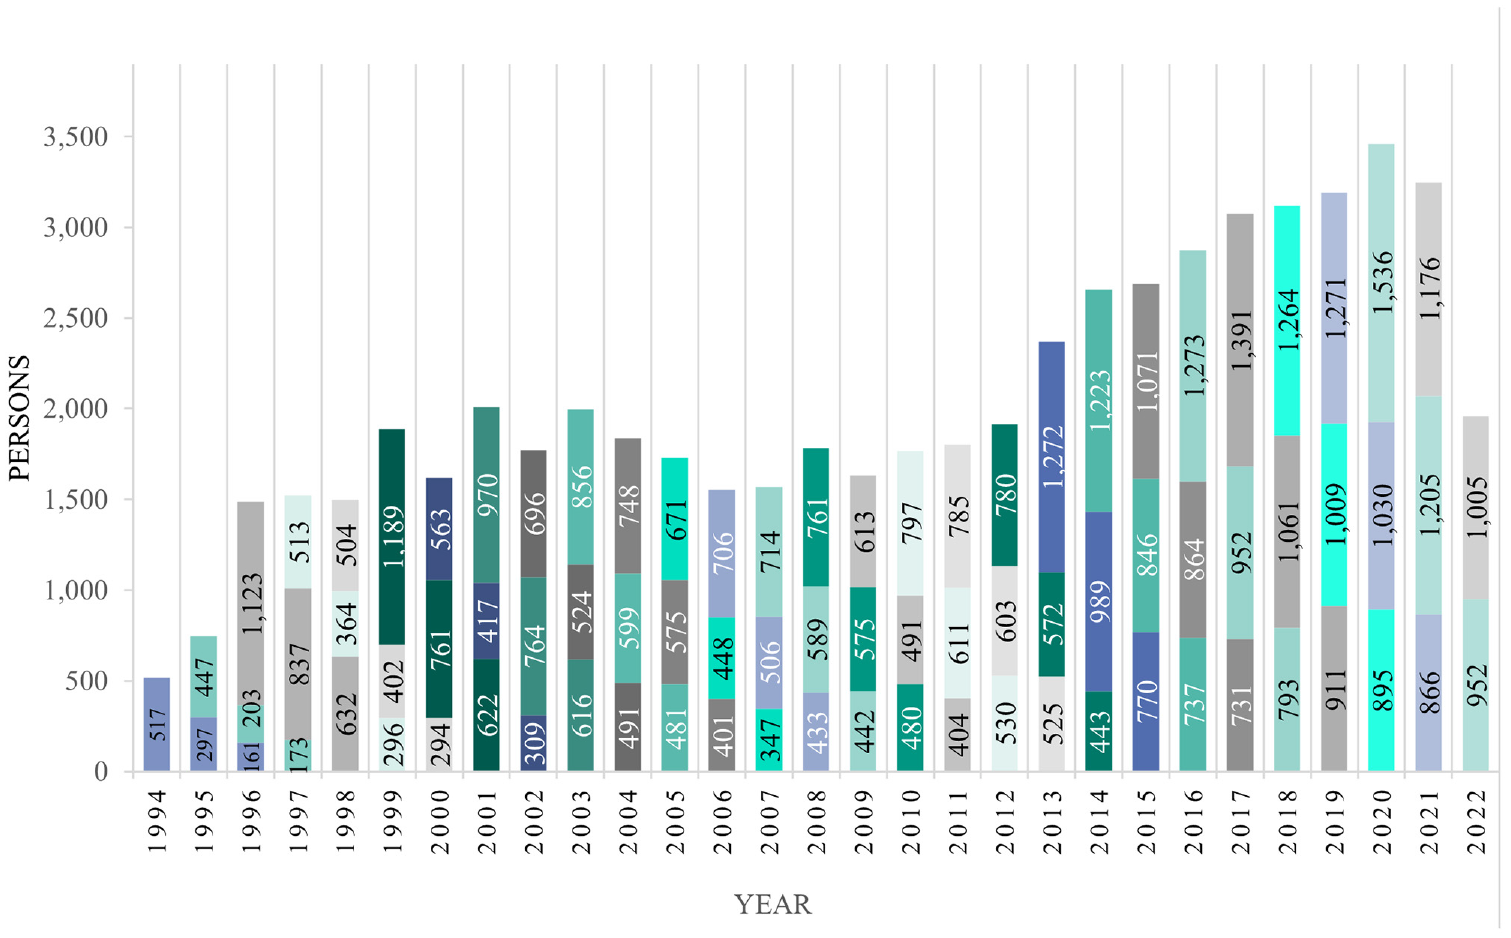
Sample design.
It can be seen that the sample grew over the last 10 years. In each survey year, the survey sample consisted of participants who were new to the survey and of participants who reported for the second and third time. For example, the cohort 2018, consisting of 1,264 participants in 2018, reported for a second time in 2019 (n = 1,099) and a third time in 2020 (n = 895). From this, it can be seen that some participants left prematurely and unplanned. This phenomenon is called “attrition” and has been studied in Chlond et al. ( 15 ). It was found that the reporting behaviors differed depending on the number of repetitions. Furthermore, it was found that individuals who repeated the survey in a consecutive wave tended to report with greater motivation, endurance, and accuracy, while participants who did not report completely and accurately were more likely to drop out.
Figure 2 further illustrates that the attrition rates were low. Furthermore, attrition considerably decreased after the beginning (1994–2000), from 33 % between the 1st and 2nd wave, to 25% between the 2nd and 3rd wave, to 16%–20% in the final 7 years. To better understand the response burden and its effect on attrition, experiments have been carried out in the past. In 2001, the additional FCORS was given to 50% of car-owning households. In 2008, all car-owning households were asked to participate in FCORS. In contrast to what we expected, the additional survey positively affected the attrition between waves as people were motivated to report on this topic and were less likely to drop out.
As mentioned, and tested in the selectivity study of MOP in 2003/4, the willingness to participate was triggered by an interest in transport and travel in general ( 16 ). Furthermore, frequent contact between the fieldwork companies by reason of the survey itself (announcing the next wave, questionnaire dispatch, reminders, Christmas greetings, sending out incentives) was regarded as central to illustrating the relevance and need for repeated participation.
It must be mentioned that the propensity for participation changed during the final three decades of MOP, following the changing demographic structure in Germany. Older people in the 1990s, when MOP was launched, were much more difficult to recruit than middle-aged people. Cohort effects now lead to the middle-aged people of the past becoming the older people of today. However, they retained their recruitment characteristics. In contrast, we observe opposite effects for the young population. Today’s young population is more challenging to recruit than the young population of the past. It underlines that the propensity to participate in surveys is also a matter of broader trends in society. As a general trend observed in MOP over the years, recruiting motivated participants became increasingly challenging. To address this negative trend, methodological adjustments, such as a web-based questionnaire, were implemented in 2013 (Figure 3), as explained in the following section.
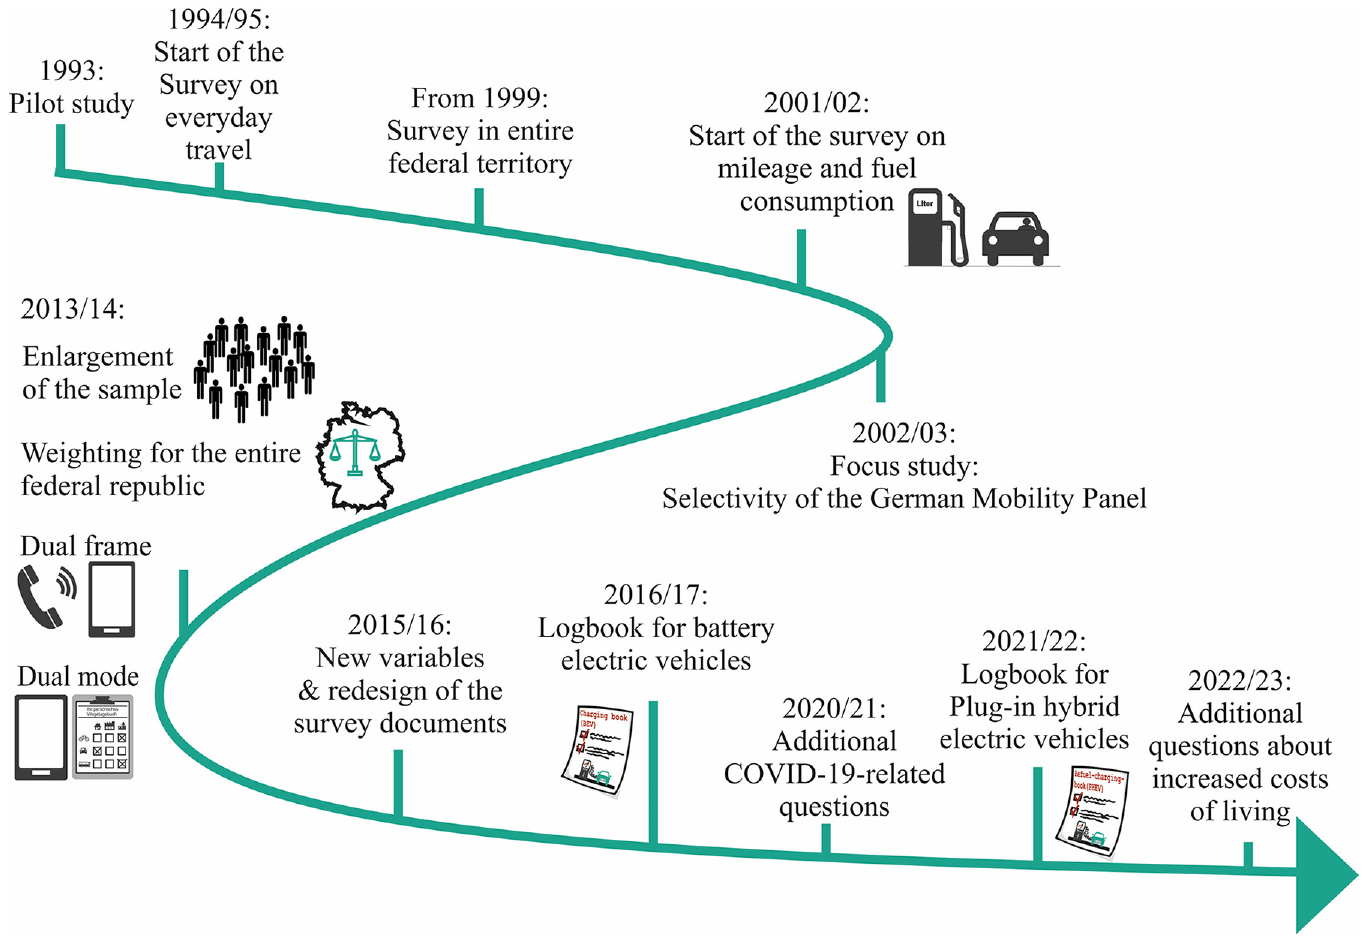
Timing of changes in the German Mobility Panel Survey.
Tension between Adaptations and Continuity
Design Adaptations
Maintaining consistency in survey design when measuring behavioral change data is imperative. Even minor alterations in the methodological design can potentially influence the data and travel quantities captured, obscuring true behavioral changes or inducing false perceptions of behavioral change. Nonetheless, given the necessity of adapting designs to evolving technological, societal, and attitudinal conditions, it becomes crucial to monitor these adaptations by gradually introducing them and comparing them with the original design ( 6 ).
At the time of initial implementation, the design of MOP was state-of-the-art. However, a minimum of methodological adjustments was made to ensure unbiased comparisons between the survey years. The essential changes are displayed in Figure 3. For example, in 2012/13, the recruitment was switched to a combined random digit dialing sampling approach (dual frame) by landline and mobile phone. This resulted in a different recruited population and made additional weighting necessary. A major problem before the introduction of dual-frame recruitment was that younger people could only be found and persuaded to participate with a disproportionate amount of effort through landline recruitment. Young people are mainly found in larger households (e.g., families). In MOP, quotas for the sample composition are specified for recruitment, which is why there were not necessarily more large households in the panel. Still, the household composition of the new (by mobile phone) recruited ones was made up of more young people willing to provide information. To account for this, selection probabilities of household configurations with landline and mobile phones (application of a design weight) according to the sampling design were installed, as was done in other studies (e.g., Elkasabi, and Baffour et al.) ( 17 , 18 ).
The change to the dual frame approach meant that more younger people were reached again, making the sample more representative. Furthermore, the recruitment variables and the weighting procedures were kept the same for all those years to prevent methodological artifacts in the results. Moreover, the possibility of online reporting was also established in the same year. All these adaptations were scientifically monitored and analyzed ( 19 – 22 ). For example, Eisenmann et al. found that survey mode and dropout propensity are unrelated ( 21 ). Furthermore, Eisenmann et al. found that, while MOP’s mixed-mode design improved representativeness, it also introduced trip-rate biases ( 20 ).
Representativeness and Methodological Effects
The respondent burden in MOP must be regarded as high because household members kept a travel diary for 1 week and participate in FCORS for 8 weeks. According to the experiences of other surveys, a certain amount of attrition between waves and fatigue effects has to be expected, affecting both reporting completeness and quality.
It must be emphasized that recruiting motivated households who report reliably for three waves was challenging. A selectivity study in 2005 investigated the representativeness of MOP ( 23 ). The study showed that participants were typically higher educated than the average population. The motivation to participate came from a feeling of high responsibility toward society on the one hand and an interest in transport themes on the other. It must be admitted that MOP recruiting did not reach certain parts of the population (e.g., poor, very rich, low-educated, or immigrants). The complexity of MOP and the high degree of commitment required from the participants for the survey, enlarged this effect. Mainly, it was young households which were difficult to recruit and keep in the sample, because of, for example, more residential moves. The data collection process also included procedures to follow households in the case of a residential move. However, this required the cooperation of households (e.g., notification by the household).
The rotation approach was sensible to compensate for both the effects of the respondent burden and attrition. Figure 2 also illustrates the attrition between waves. It should be noted that the monitoring of dropouts between waves was particularly relevant for households with young families and people with changes in their life cycle, and less so for households with older people.
Fatigue effects are illustrated in Figure 4, with the example of daily trip rates per person in each year of participation and depending on the reporting day. The starting days were allocated to households at random but equally distributed for all days of the week. It became obvious that there was a drop in the number of trips reported during the first and second waves. Participants learned to report more efficiently (e.g., conflating some short trips to a longer one). However, this was of minor relevance because analyses showed that the reported total kilometers traveled were unaffected ( 15 , 24 ). The effect disappeared between the second and third waves.
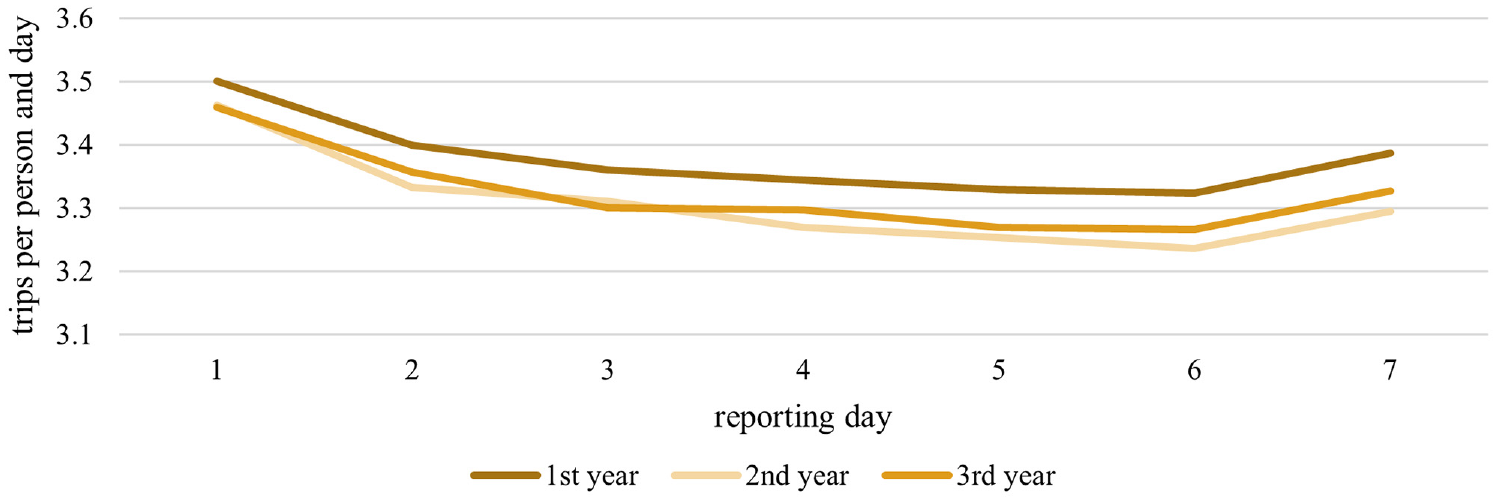
Daily trips during the 7 days of the report in the first, second, and third year of the report (1994–2022, n = 27,078).
Beyond this, the fatigue within a wave also affected data quality (e.g., recall gaps when filling in the diaries at the end of the period). This was illustrated by the drop for days three, four, and five and the rise at the end, when participants had potentially fewer recall deficits. It must be emphasized that this effect primarily affected short trips (by foot and car) rather than public transit and bicycle trips. The mileage per day was affected only slightly ( 24 ). We explained the drop between days one and two, with a high willingness to report on the first day. This culminated in even (very short) trips being undertaken, which otherwise would not have been initiated. In general, the fatigue within the waves was checked for different travel indicators (trips per day, mileage per day, travel time per day), which was possible based on the rotation of starting days to exclude the weekday effects ( 25 ).
Altogether, we conclude that the decline of quality became smaller in further survey waves, which gave optimism for recruiting for more repetitions of the same individuals. This underlines the need for carefully maintaining a panel, which mainly means frequently staying in touch with the participants to show them their relevance and importance.
Experiences and Central Outcomes within 30 Years of MOP
As described above, MOP was intended and designed as a multipurpose instrument. The design should serve for transport statistics to provide yearly demand figures and allow for analyses of the variability and change in behavior with different temporal dimensions. Here, and according to the longitudinal ideas, we have to distinguish the weekly perspective and the day-to-day variability (e.g., in modal choice) on the one hand, and the year-to-year perspective to improve our understanding of how demand processes and behavioral changes occur on the other.
In the following, we present relevant and valuable analyses of MOP data that contribute to understanding travel behavior.
The Weekly Perspective—an Example of Transport Mode Variation
Surveying several days made it possible to capture the variation in people’s behavior better than if based on a one-day survey. Observing 7 days (1 week), the MOP approach captured the variation in travel behavior and activities of individuals on a microscopic level. It included the repetitions of daily life during the work week as well as the activity and travel behavior at the weekend, which is typically different from the working days. This design allowed for identifying mode users, such as cyclists, car drivers, and transit riders, who had used the respective mode at least once during one week. Furthermore, it distinguished between monomodal (persons who have solely used one mode) and multimodal persons (persons who have used multiple modes during 1 week). With each additional day of observation, the probability that people use other transport modes was higher (as displayed in Figure 5). The more specialized a transport mode, such as a long-distance train, the longer the observation period had to be to capture such trips. This was also illustrated by the study of Kuhnimhof et al. ( 26 ). Other studies that used MOP data for analyzing the use of transport modes over one week are the studies by Nobis, and Kuhnimhof et al., which were able to gain insights into multimodal behavior ( 27 , 28 ).
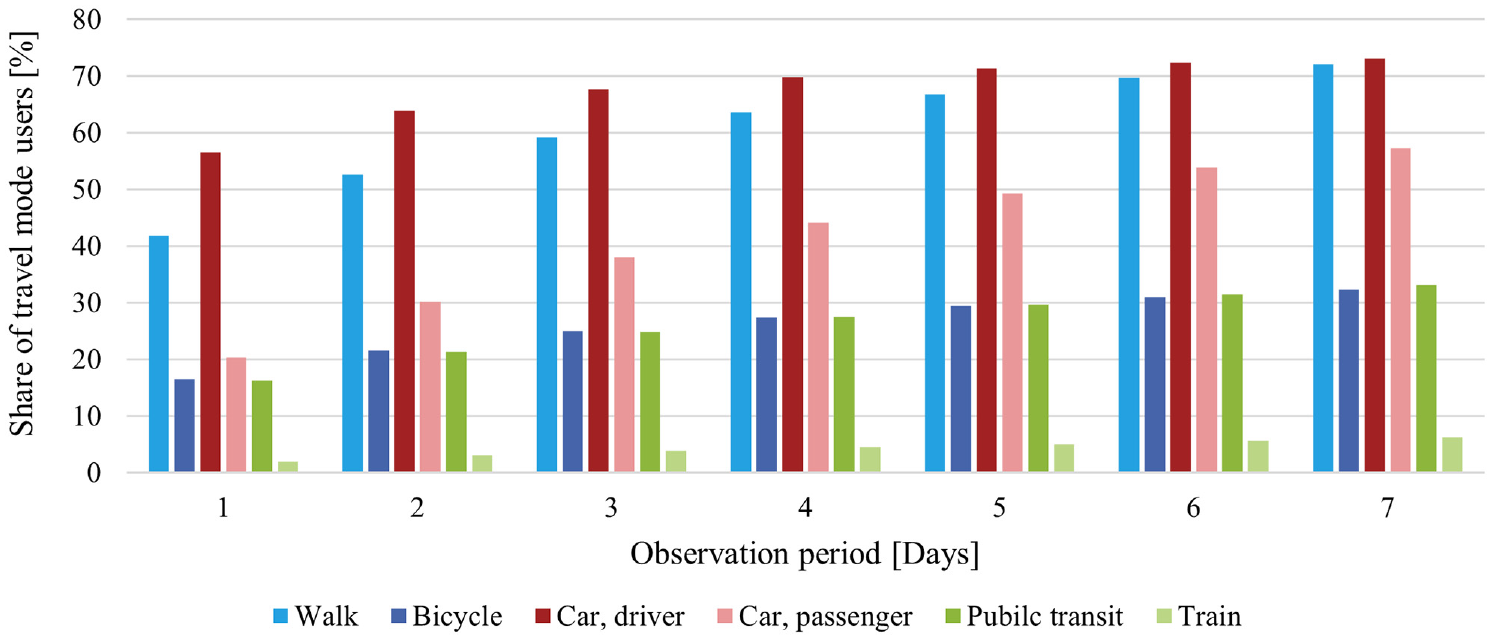
Share of travel mode users by observation period (2014–2018).
However, even a 1-week trip diary does not allow the collection of the overall variation in travel behavior, as shown in the next section. A more extended observation period, such as 6 weeks or even longer, provides more data to analyze the stability and variability in behavior ( 3 ). Thus, the 1-week observation period compromised the amount of longitudinal information needed and the efforts of data collection, including the response burden and the costs for data collection.
The Intrapersonal Perspective on Travel Behavior—Different Year, Same Behavior?
Table 2 shows the transitions of modal behavior in two consecutive years. Participants were assigned to different mode use groups based on the analysis of mode use during the week. For example, “bicycle + car” means that participants assigned to this group used both the car and the bicycle at least once during the reported week. The rows display the share of people using the listed mode combinations in 1 year, while the columns show the mode combinations in the following year. People with the same mode combinations in two consecutive years are listed on the main diagonal (grey boxes). They make up 63% of the sample. The remaining 37% of our sample used different modes or mode combinations in the survey weeks in two consecutive years. This can be for two reasons. First, changes in a person’s behavior and life situations (e.g., relocation or the birth of a child) may have caused that person to use other modes of transport; this change must be regarded as a systematic change. Second, random changes occurred; these random changes resulted from non-weekly activities and travel patterns reported in the first year, for example, but not in the second year. This different pattern can result in, for example, a different total number of activities and, therefore, in different mode usage. However, this is not necessarily a change in behavior over the years. We can assume that most of the reported changes in mode usage were not behavioral changes but more typical variations of travel patterns. However, it is challenging to determine this clearly. In addition, different weather conditions affect mode use. People are distributed symmetrically to the main diagonal in Table 2. This shows that most of the changes in the matrix are random changes, as they balance each other out. If there were many systematic changes, an imbalance would be recognizable. Literature highlights the challenge to distinguish between a variation of behavior and a systematic behavior: information on attitudes and habits must be available to explain variation in travel behavior ( 29 , 30 ). As no psychographic and attitudinal questions or questions about habits were included in MOP, there was no information about changes in attitudes that may have resulted in changes in behavior.
Transition of Transport Mode Use: Aggregated Results of the German Mobility Panel between Any 2 years (1994–2018, n = 25,735)
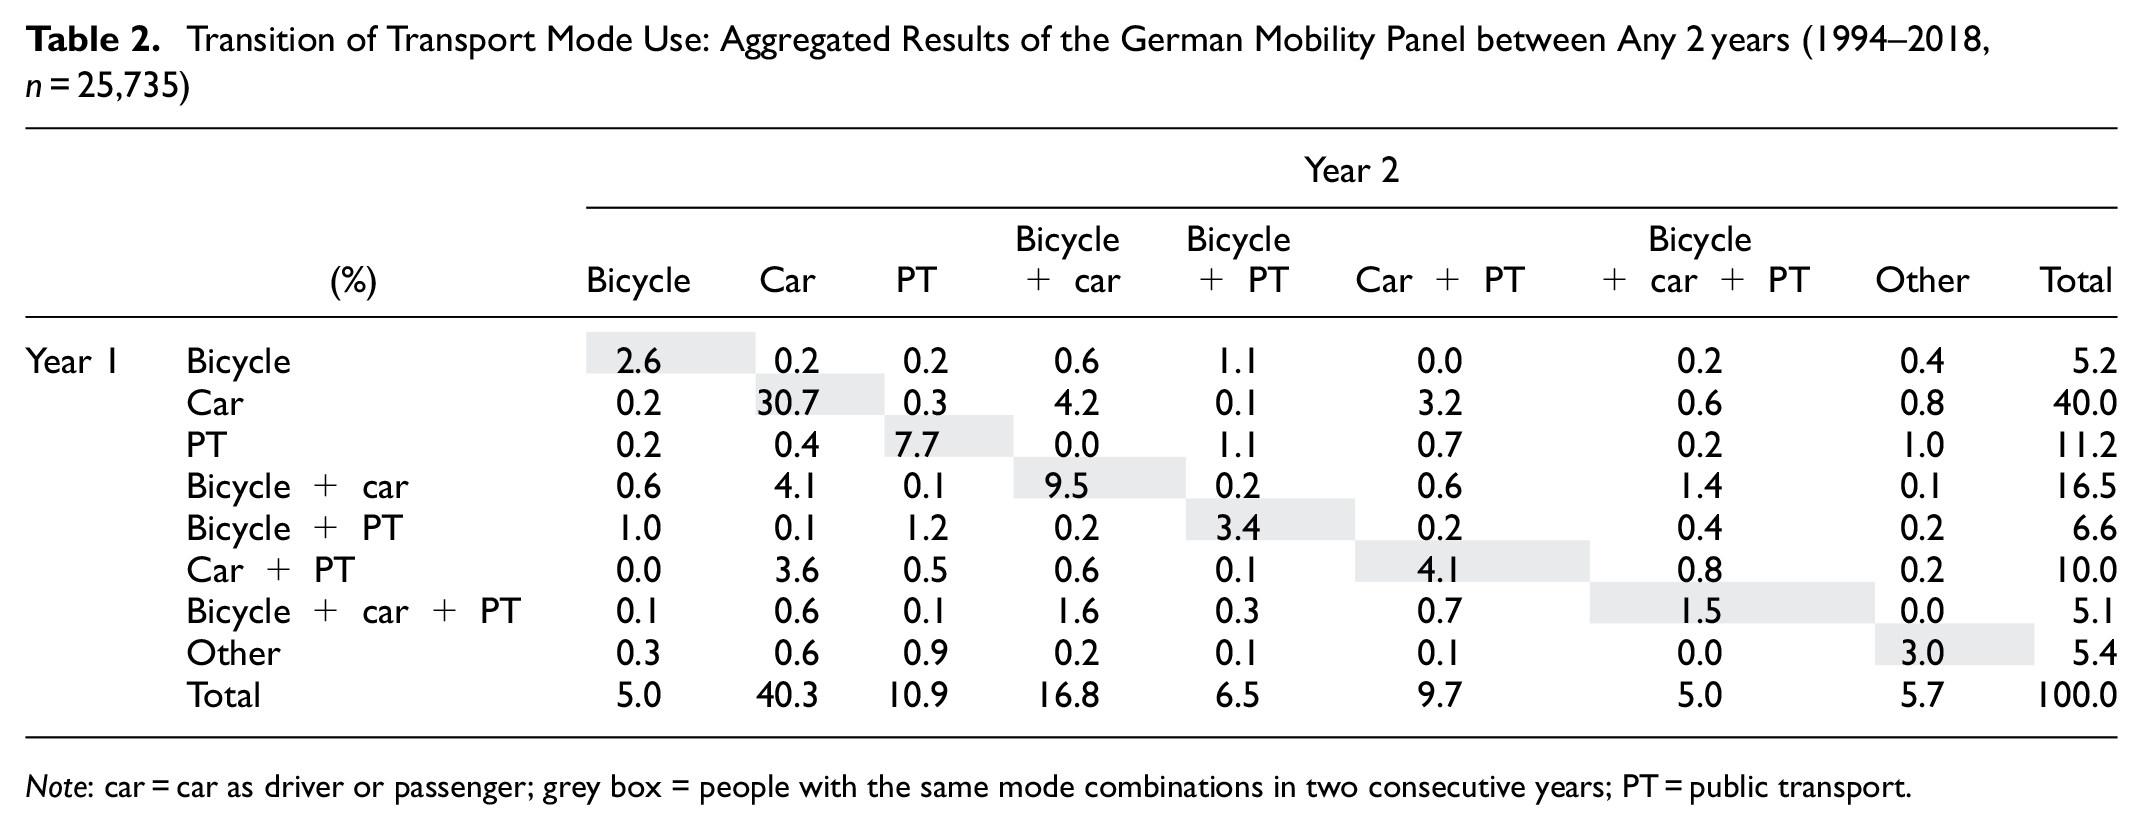
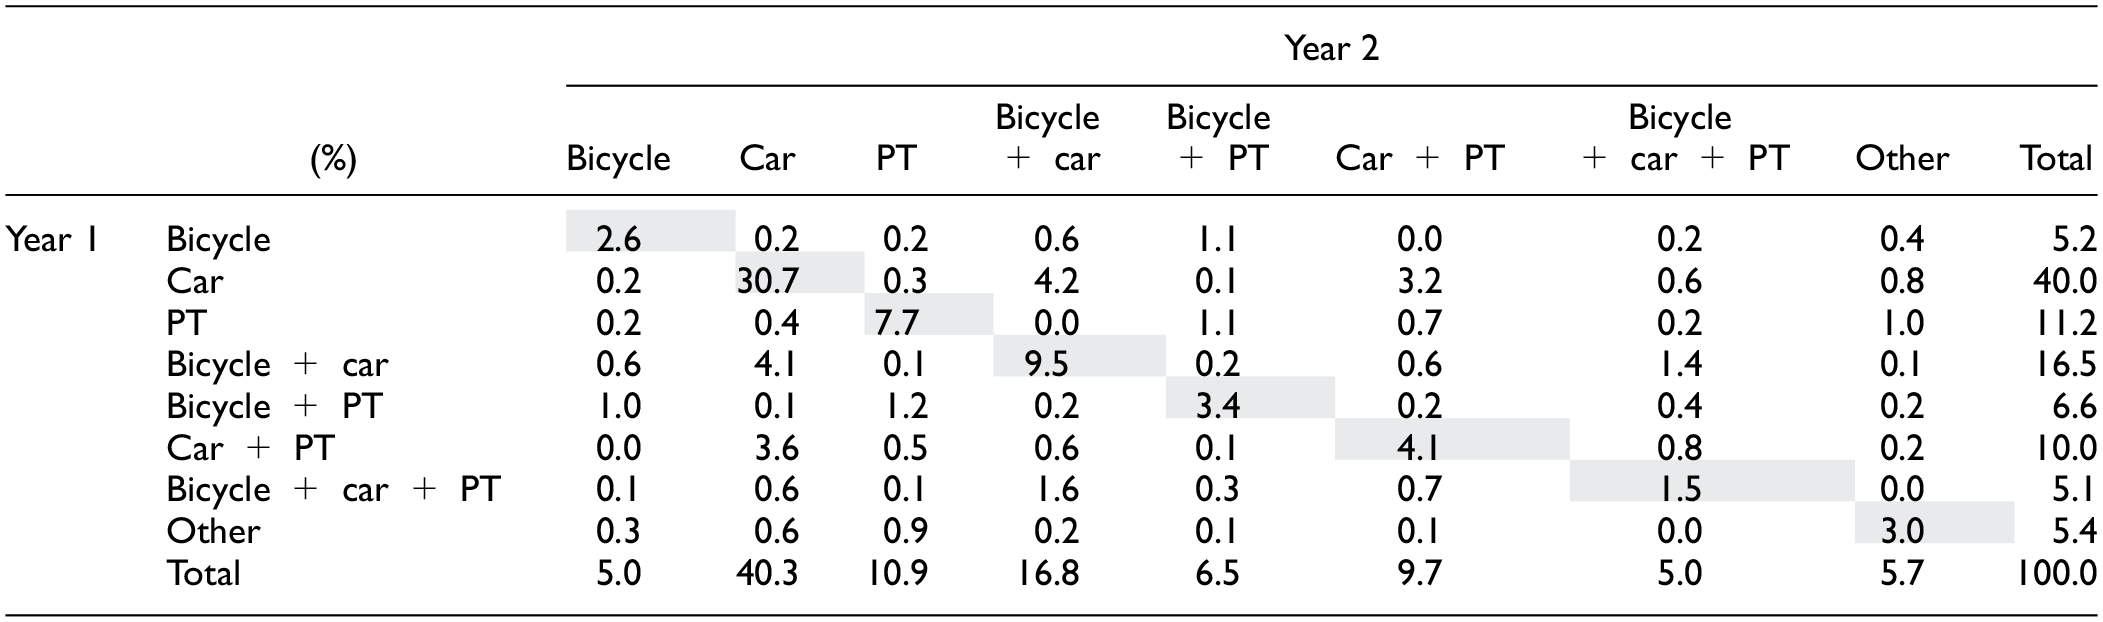
Note: car = car as driver or passenger; grey box = people with the same mode combinations in two consecutive years; PT = public transport.
Figure 6 displays the same individual’s reported activity and travel in three consecutive years to better illustrate this challenge. It exemplarily visualizes the travel behavior for each year and reporting week. Each picture displays 7 days of report (y-axis) and time of day (x-axis). Each color indicates different activities (e.g., red represents being at work, grey represents being at home) and the slightly raised boxes in each row indicate travel activities. Different colors of these raised boxes indicate the use of different transport modes; for example, bright blue indicates a motorcycle and bright orange indicates car as a driver. We can observe that the fundamental behavior appears to remain unaltered; for example, the presented person travels to work five times a week in all 3 years (except in the first year). However, it can be seen that the mode of commuting is different in the first year (motorcycle instead of car). Moreover, there are activities, for example, at the weekend, that differ between the years.
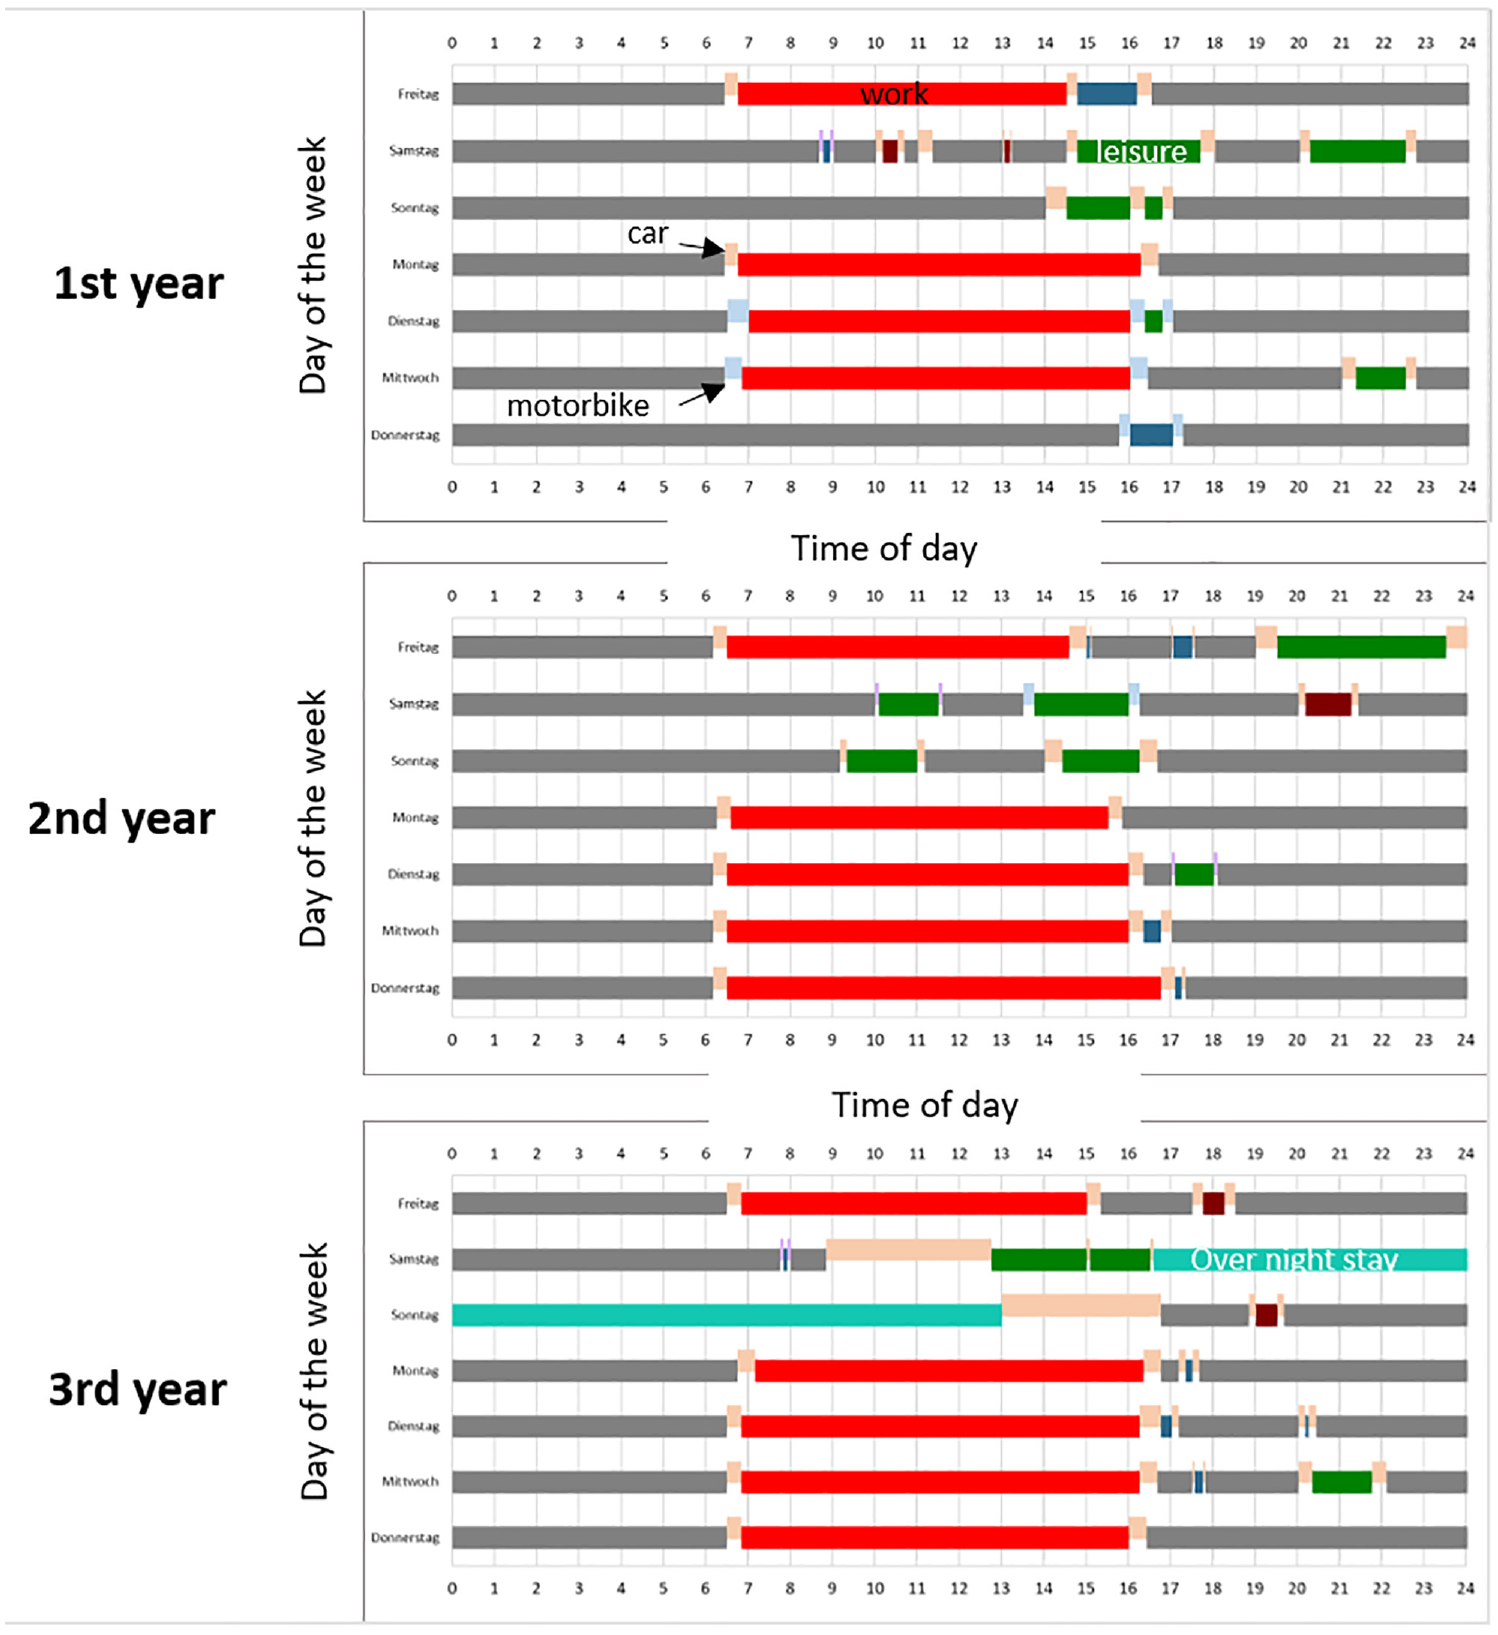
Graphical display of 3 years of an exemplary travel diary report of a full-time worker with varying commuting modes (this participant had to start reporting always on Friday according to the random assignment of start-days).
An analytical examination involving the comparison of daily travel metrics at the individual level (such as distance traveled, frequency of trips, and modes of transportation utilized) indicates the presence of notable variations where relevant. However, discernment through graphical representation primarily reveals a shift in fundamental commuting behavioral patterns in the exemplary case presented in Figure 6. Analyzing aggregated data over entire weeks presents the challenge of distinguishing between behavioral changes and typical week-to-week variation. However, it may obfuscate intra-individual fluctuations. Week-to-week variations include occasional activities and associated trips that are not consistently performed weekly. Therefore, they may be included in one reporting period and omitted in the next. The identification and characterization of behavioral changes depend on access to supplementary information revealing potential catalysts for such alterations (e.g., illness, relocation, job transition, or vehicle maintenance). Only such contextual information can allow us to distinctly determine alterations in travel behavior as habitual change or random change. The challenge with the weekly data from different years consists in the definition of a change: what are the fundamental changes (maybe the transition from car only to public transport only and vice versa), and what are the reasons behind it? These questions cannot be answered by MOP data so far but are discussed in the literature (e.g., Chlond and Eisenmann) ( 6 ).
The Relevance of Continuous Measurement—Disruptions during the COVID-19 Pandemic
The COVID-19 pandemic meant a major disruption in the everyday mobility of many people. MOP was a special data source to document this disruption as it allowed for analyzing intrapersonal comparisons. A study by Reiffer et al., for example, revealed that new telecommuters experienced more drastic changes induced by the pandemic than experienced telecommuters ( 31 ). This is an example of the essential benefits of the panel design. While many other studies needed to be quickly implemented during the pandemic and needed to ask for the pre-pandemic behavior with retrospective questioning, MOP was able to continue the survey in the usual cycle. Another example of an analysis considering the changes in behavior during the pandemic is presented in Figure 7. It shows the change in the number of leisure trips per week for the 2019 cohort, which reported in 2019, 2020, and 2021, allowing a comparison of 2019, which was unaffected by COVID-19, with 2020 and 2021, which were heavily influenced by COVID-19. Because the participants were the same in all 3 years, we were able to perform paired t-tests to test for significance.
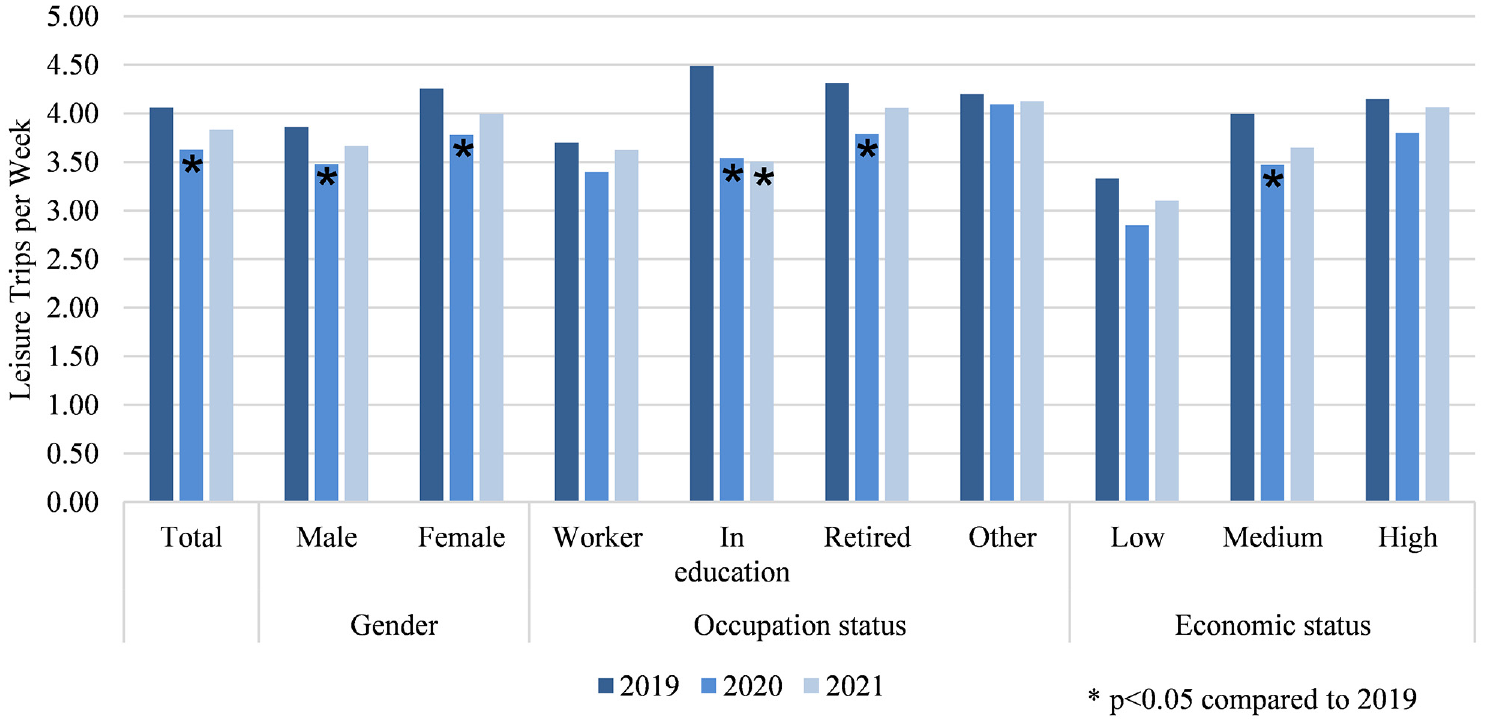
Leisure trips before and during the COVID-19 pandemic (2019–2021).
The evaluation shows that the number of recreational trips was significantly reduced in 2020. In the following year, the number increased slightly again. The deviations of 2021 compared with 2019 were no longer significant, yet the absolute value of 2019 was not reached. The figure also shows that the restrictions particularly affected people in education, that is, children and young adults. While the reduction in leisure trips among workers changed slightly, the number of leisure trips among persons in education declined significantly by about one trip per week in the 2 years hit by the pandemic.
Tracing Cohorts Over Decades—Do They All Behave the Same Way?
MOP has been able to map transport demand in Germany for the last 30 years. As shown in Figure 8, the values aligned with those of the large German NHTS called Mobility in Germany (MiD). Except for the drop during the COVID-19 pandemic, MOP is almost stable with regard to distances traveled. The MiD values are comparable for 2008 and 2017, while 2002 is significantly lower. The differences between MOP and MiD in 2002 are because of a retroactive reweighting of the MiD results 2017.
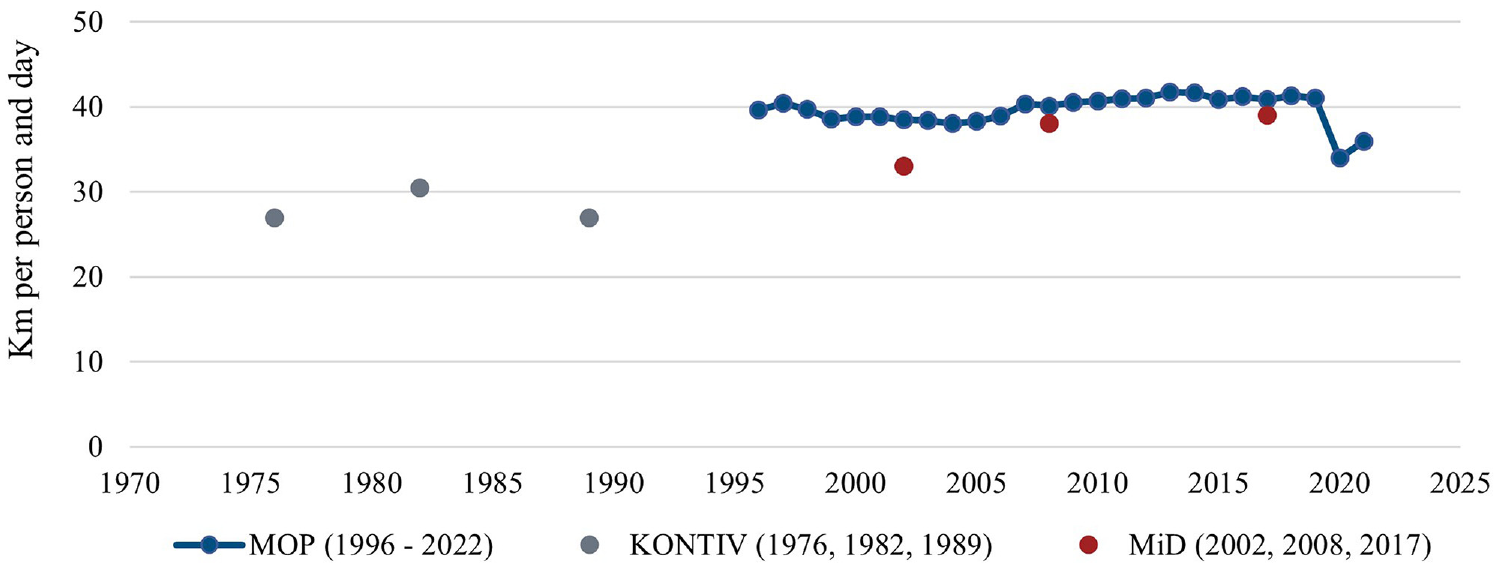
Daily kilometers traveled based on different surveys in Germany.
The unchanged design and the yearly repetition of MOP allowed for analysis and explanation of the structural processes “below the surface” and provided an improved understanding of the structural developments that compensated for the stagnation. Figure 9 illustrates the modal trends observed during the last decades (car drivers, cyclists, and public transport riders within 1 week as shares of the total adult population). For this purpose, persons of the same age were grouped by 5-year time-slices. Darker colors show earlier years, while lighter colors show the results of the latest years.
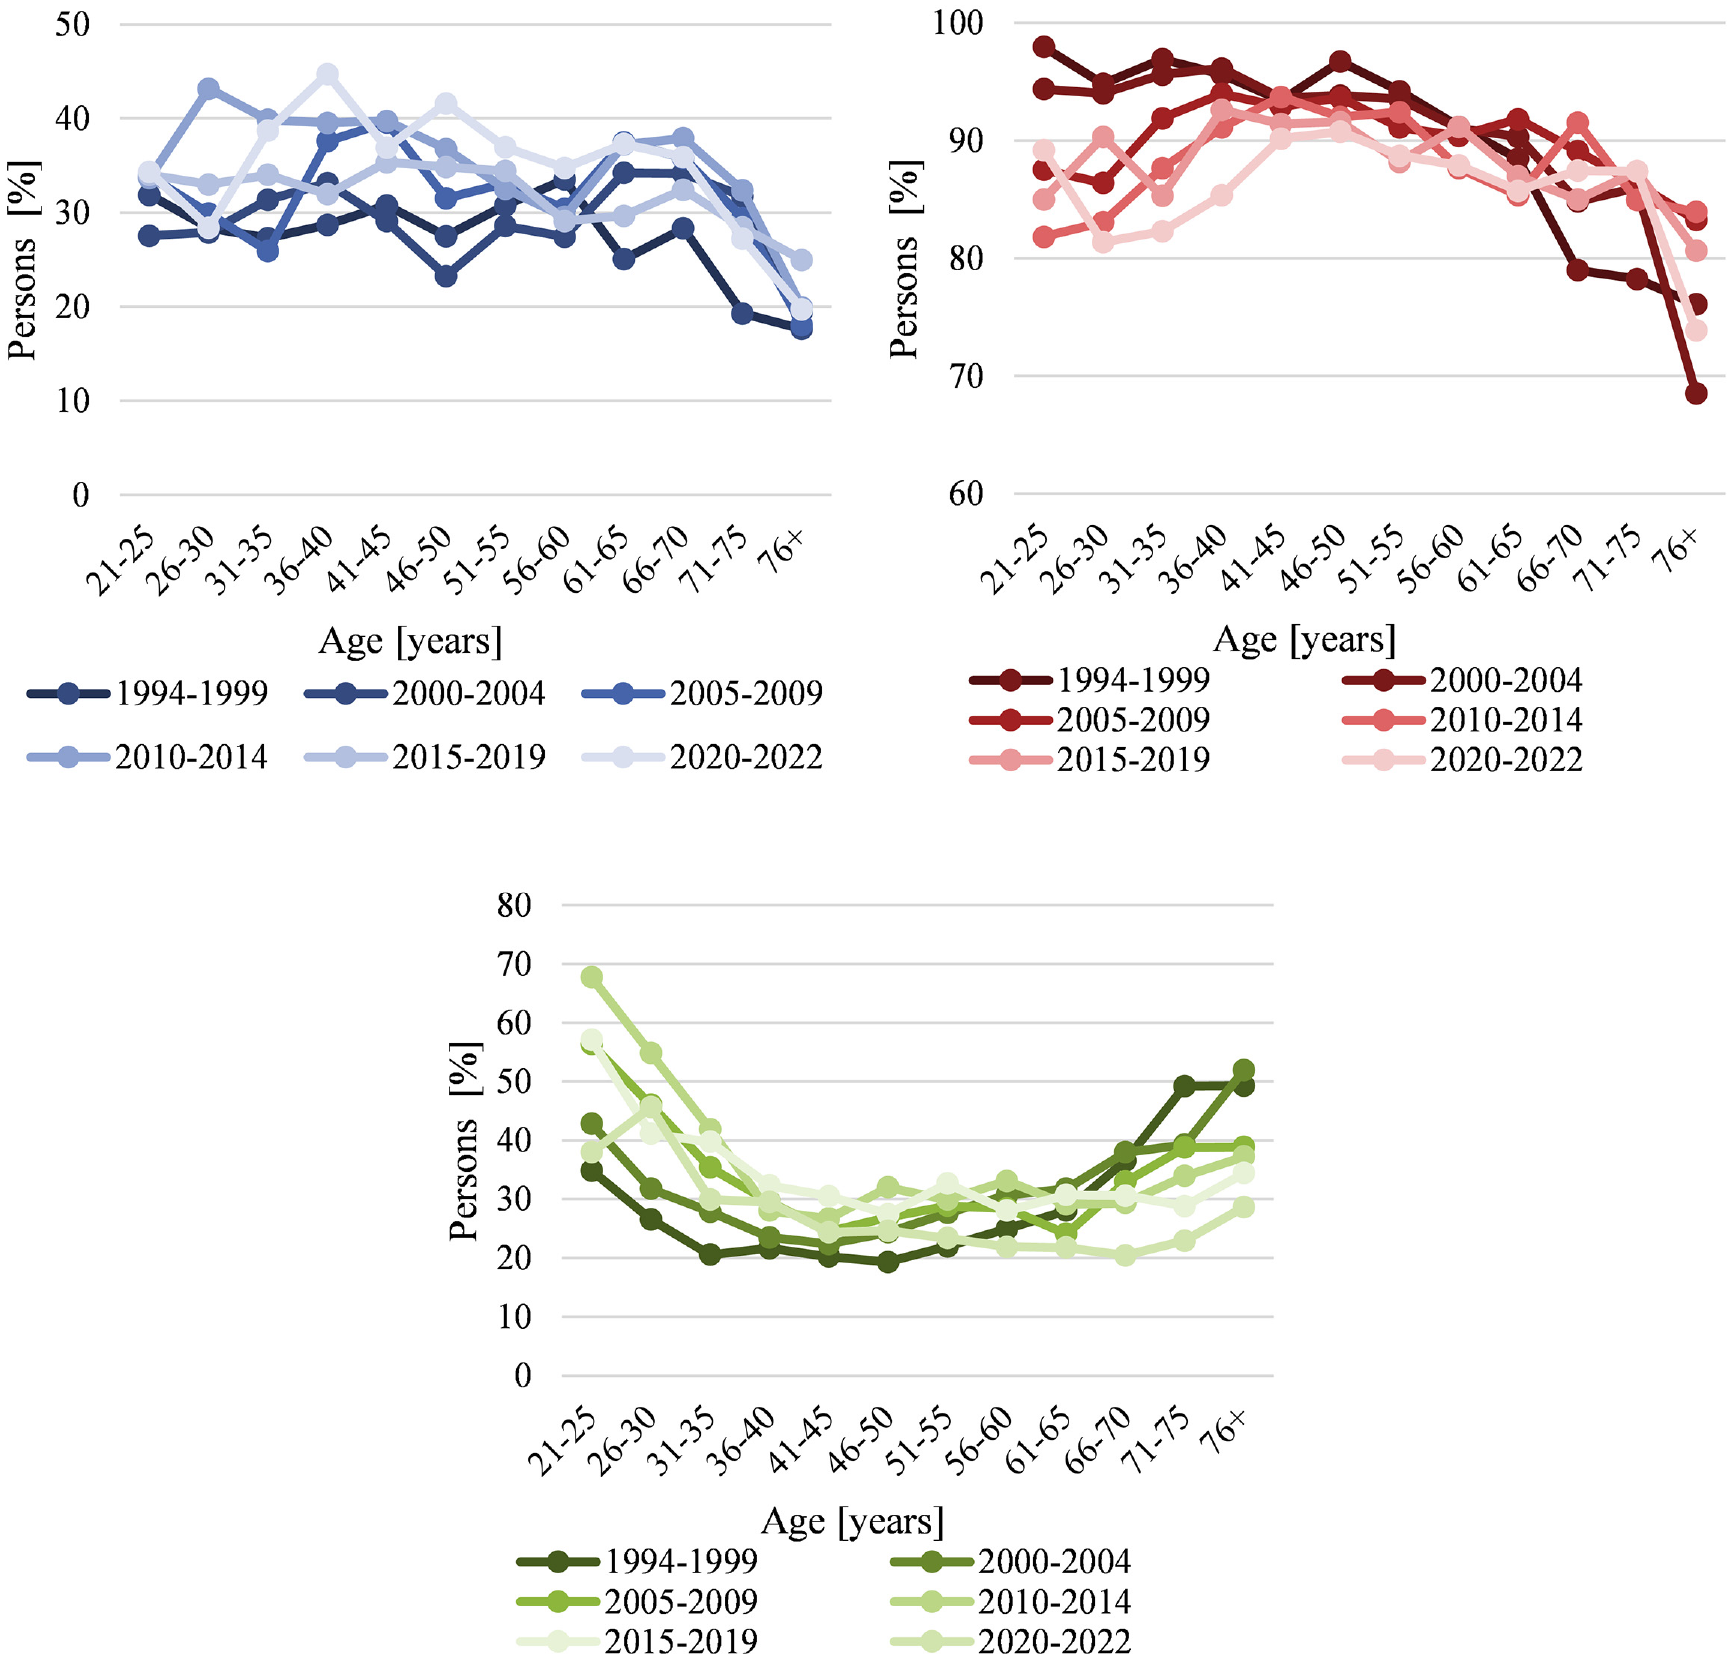
Share of people who use bicycles (top left), cars (top right), or public transport (bottom) in a week, differentiated by age and period (1994–2022, until 1999 western Germany only).
Random effects superimpose the structural effects in modal behavior during any survey period (e.g., by reason of the weather or sampling effects). For example, public transport use increased for young adults during the last 3 decades, as found by the Institute for Mobility Research ( 32 ). However, a decline was seen for seniors as they increasingly socialized with cars during their lives, replacing the previous senior generation with less car socialization. The trend toward bicycle use was relevant for all age classes. Compensation occurred between young and old with regard to modal behavior within the last 3 decades.
Limitations of the Survey Approach
The concept of MOP was as a panel survey designed to identify and analyze travel behavioral changes at an individual level. The decision to use a weekly timeframe was initially regarded as satisfactory in capturing and integrating the behavioral variations, such as those occurring between workdays and weekends, and facilitating intraindividual comparisons across years to distinguish between behaviors.
A relevant finding of 30 years of MOP is that distinguishing “changed behaviors” from “unchanged behaviors” through the data for a specific individual remains challenging. However, it is possible to measure the consequence of retirement or the birth of a child. The panel data allows for determining in which situations a change in car ownership takes place and what this means for travel indicators ( 30 ).
Individually, it is not directly possible to identify a behavioral change between any 2 years. The reasons must be seen in the high intraindividual variability of behavior. This means that travel demand (e.g., trips per week, mileage per week, trip patterns, and mode use) will likely differ between years, reflecting the normal variation. Even 1 week is insufficient to capture the variation in behavior, as many activities are not performed weekly (e.g., weekend excursions, holiday trips, shopping tours apart from daily demand). For this purpose, other approaches are required: the “travel skeleton survey” was developed to ask for typical behavior, to fade out these effects ( 33 ). However, it did not allow for other applications (e.g., deriving statistical figures about travel).
Another limitation of MOP design was the relatively small sample size and the repetition for only three consecutive years, which limited the number of transitions. Furthermore, the survey design was costly, and maintaining the participants, that is, keeping them motivated, was challenging. MOP was meaningful for analyzing the variation in behavior during the week and between years. However, the sample sizes were limited to generalize the results from small and specific groups. The German statistics thus rely on two national household surveys to draw a comprehensive picture of travel behavior in Germany. The large-scale cross-sectional NHTS MiD conducted irregularly provides a broad overview of the overall travel demand. In contrast, MOP provided annual monitoring and a longitudinal perspective. Combining different types of surveys to obtain a comprehensive overview of travel behavior has been regarded as a role model ( 34 ).
Furthermore, it should be mentioned that the survey on everyday travel of MOP only took place during the fall. This time of the year is typical for surveying everyday travel and is common in other surveys (e.g., The Netherlands Mobility Panel) ( 35 ). However, this restriction did not allow for continuous monitoring of travel behavior. This became extremely meaningful during the COVID-19 pandemic (2020–2023), in which phases of normality and shutdowns of public life emerged. The limitation of the survey to be performed only in the fall meant it was not able to provide statistical figures for total demand volumes valid for a complete year. That is, the expectation of MOP as a statistical instrument could only be met for years without disruptions and only on an aggregate level.
With the climate policy challenges in Germany, and because of climate change, the need for comprehensive data for transport policymakers and planners increased. MOP could not adequately meet these changing requirements, especially for ad hoc analysis.
The relevant characteristics to explain the dynamics of travel demand can be illustrated through Figures 8 and 9. The observable dynamics in travel in the time series are much more the result of the changing composition of the population by age groups with different socializations and biographical experiences. From the transition matrices (e.g., Table 2), we can conclude that the change in aggregate demand figures is the outcome of changes in one direction overcompensating the changes in the other. Thus, the idea of the unidirectional demand processes can be rejected. Thus, MOP helped to improve the understanding of travel demand processes.
Last, another drawback of MOP data is its complexity. MOP data, as well as data from other panel surveys, are challenging to analyze because they have additional dimensions compared with simple cross-sections of conventional NHTS. Panel methods, considering, for example, fixed and random effects, are needed to study the travel behavior of the same individuals in different years.
Reasons for the Termination of the Survey
From a scientific perspective, continuing the 30-year time series would have been valuable for research. The timing of the termination is viewed as poorly chosen. Panel survey data are crucial for monitoring changes in travel behavior caused by current circumstances, such as the COVID-19 pandemic and high inflation. However, because of the drawbacks and limitations, the administrational considerations by the BMDV resulted in the decision to abandon the funding of MOP. The reasons for ending the survey are diverse and highlighted below:
1) Methodology: Recruitment by phone (random digit dialing for landline and mobile phones) and sending paper documents by post became too costly.
2) Surveying in highly dynamic times: MOP was considered an instrument to provide regular statistical figures for the BMDV yearly in autumn. Consequently, the variation between phases with and without lockdowns could not be captured in MOP during the pandemic. Furthermore, the time lag between upcoming policy questions and the availability of data and results is considered too long today. This is because of the restricted survey period (autumn), the digitalization of survey data, and the successive data cleaning. Furthermore, the contractual provisions did not provide any scope for speeding up the processes.
3) Demand: The sample sizes did not allow for a breakdown in disaggregation levels. Upcoming requirements for statistical figures ruled by the European Commission cannot be derived from MOP ( 36 ).
4) Contracts: Each year, a new contract was set for a new cohort for a fieldwork institute. As a result, each survey consisted of three separate contracts (one contract for each cohort) for the survey. Furthermore, another contract for 2–3 years was enclosed for the scientific supervision of the project. These contracts meant a lot of organizational efforts for BMDV because of budget legislation.
5) Data complexity: The (multidimensional) MOP required much effort to familiarize itself with the data for its usage. Despite the well-documented data, the data’s complexity meant a hurdle for many users ( 37 ). It can be concluded that the data’s use fell short of expectations in some areas and that greater use of the data would have been desirable.
Synthesis of Lessons Learned and Recommendation for Future Panel Surveys
Based on the 30 years of experience, several conclusions can be drawn from MOP. In the following, we give recommendations for when a new panel survey is planned, based on our lessons learned from MOP. However, this chapter does not aim to provide universal guidance for a new study, as each survey needs to be adapted to its specific context (e.g., administration, survey objective). The recommendations should serve as practical hints and ideas.
1) We recommend a long-term orientation of panel surveys. Such a setup allows for planning and meaningful investments. As a benefit, the initial setup investments can be distributed for many years. Continuous survey design, content, and structure of the data organization, combined with regular repetitions, allows for trustful analyses free of methodological artefacts because of design changes. The possibility of slowly looping in design changes allows for evaluating their impact. Funding a panel must be understood as a long-term task (e.g., by funding, which should also be institutionalized and included in long-term budget planning). It must be emphasized that this was one of the most critical determinants of success for MOP for 30 years.
2) We recommend a rotation approach, as it was shown in MOP that participants are willing to engage and provide data of good quality over the years. Those who actively participated repeatedly were motivated participants with high commitment and dedication ( 16 ). Furthermore, a notable advantage of a rotation approach is its ability to effectively drop out the remaining bad risks concerning data quality and completeness, either during or after the initial wave of participation, contributing to high data quality. In light of this, a rotation emerged as a crucial element for ensuring long-term comparability of outcomes. Stability and reliability in the data can be maintained by keeping the rotation approach consistent. The rotation approach incorporated in future studies could be a relevant and effective methodology for producing reliable and insightful results.
3) We further highlight the importance of always being aware of the survey objective and not linking too many objectives to one survey. Looking back, MOP was applied as a multipurpose instrument for statistics and explaining demand dynamics. However, cross-sectional data can also provide statistics, whereas the explanation of demand dynamics is more fruitful when using longitudinal data. From our point of view, future panel surveys should not be misapplied for statistical purposes. For the complex recruitment in combination with the respondent burden, a certain amount of selectivity must be expected anyway for the case of panels ( 16 ). Here, the Dutch approach with two separate surveys (Netherlands Mobility Panel [MPN] and Onderweg in Nederland [ODiN]) could serve as a role model: a permanent cross-sectionally oriented survey for statistical purposes aiming at representativeness with large sample sizes (ODiN) is complemented by an explanation-oriented longitudinal survey (MPN) ( 35 ).
4) We emphasize the importance of only burdening the respondents as much as necessary but as little as possible with the survey. Based on the experiences in MOP, participants initially recruited for multiple waves can, indeed, be regarded as very motivated. They were also willing to answer additional topics (more than the standard annual program), for example, psychographic questions. Of course, additional topics and questionnaires mean an additional burden and should not necessarily be introduced yearly. However, a cohort approach allows a rotation of questions as a flexible solution and should be considered for future panels.
5) We recommend a (contractual) split between fieldwork and scientific supervision as far as the organizational structures are concerned. An organizational structure that allows for continuity and flexibility is required to handle a long-term-oriented panel. Learning from the experiences in MOP, it can be concluded that a formal and organizational construction must be installed to allow for maximum continuity (e.g., responsibility for the design and the use of the data). Further, know-how transferability is necessary to reduce the setup for newly involved institutions or staff members. Here, the separation between the contractor for the scientific supervision and the contractors for the fieldwork can be helpful. The definition of processes for the fieldwork allows for a comparably flexible exchange of competencies and fieldwork contractors. Furthermore, it results in competition between fieldwork contractors and thus reduces costs. However, this can contrast with survey flexibility, as the procurement law sets many limits. Consequently, this means effort for the tendering processes but depends on the legal and formal framework. As a practical solution to not being too bonded by procurement law, the funding authorities can include “options” in the tendering that will not necessarily be drawn. This means, for example, the flexibility for sudden adaptations of the survey design or the inclusion of additional questionnaires, if necessary, without formal barriers. A reasonable legal and organizational structure to achieve maximum continuity and know-how transfer exists in the Netherlands, which can be regarded as a role model ( 35 ).
6) As far as the survey duration is concerned, we recommend a survey period of at least 1 week. The data collection over a complete week must be regarded as a central asset, which is possible even with a conventional approach of paper diaries. With data about the weekly context, enormous potential for analyzing travel behavior and its dynamics arises. However, the intra-individual variability in behavior is not capturable even through 1 week. As mentioned above, comparing 2 weeks of the same individual between 2 years will likely differ. Detailed surveys over an extended period are impossible, and no statistically reliable evaluations are necessary. In that case, a frequency-based capturing of typical behavior seems to be a promising survey methodology; for example, an approach like the travel skeleton described in von Behren ( 38 ). The availability of new tools to generate longitudinal data for more extended periods (e.g., passive smartphone tracking) allows for the collection of intra-individually, usually more seldom, long-distance travel events, thus going beyond daily travel.
7) We recommend using up-to-date survey methodologies and technologies. A lesson learned from MOP and, conclusively, one central reason for its termination, is that its survey technology and methodology became outdated. Design innovations and methodological adaptations must be updated regularly. An approach of having different cohorts, as in MOP, allows for looping in changes within one cohort. By only treating a subsample of a new cohort with a new methodological approach and analyzing the outcomes, it is possible to even out the separation of the effects of the new approach and the effects of different cohorts. However, this will depend on the sample size available for such experiments.
Conclusion and Further Research
Longitudinal surveys play a crucial role in understanding trends and changes in travel behavior. For this, MOP provided unique insights into the complexity of travel behavior. Capturing data over 1 week in three consecutive years enabled the detection of causal relationships and the identification and explanation of long-term processes that cross-sectional surveys such as MiD cannot reveal. Furthermore, the deep understanding of MOP and the rhythms of travel over the week opened the door for the development of, for example, the agent-based model mobiTopp, which went hand-in-hand with the scientific supervision of MOP in the last decades ( 39 ).
The MOP survey was restricted to fall as a typical season to describe trends and reduce seasonal artifacts. However, in-time and continuous data are needed to understand the nuances of changed behavior in general, but especially in disruptive times, for example, pandemics. The sample should be spread to other seasons for future projects to overcome the risk of different periods with different frameworks.
Until the end, MOP faced a conflict of interest between maintaining continuity on the one hand and the need for technological adjustments on the other. Particularly in recent years, declining willingness to participate in surveys has been observed in the social sciences, and this trend is expected to intensify. Therefore, we recommend further research on, for example, smartphone surveys. Such surveys present an innovative approach to data collection, leveraging the widespread ownership of mobile devices to reach a diverse and extensive participant pool. Furthermore, these surveys offer real-time data collection and potentially reduce recall bias by capturing in-time information, thus reducing the respondent burden.
Moreover, incorporating GPS technologies and georeferencing into longitudinal surveys could enhance our understanding of spatial patterns and location-based behavior influences. Indeed, the paper-based diary was preferred by participants compared with more innovative approaches as it was much easier to handle and, for example, allowed for adding a forgotten trip later. However, this was cost-intensive and kept the respondent burden high. A GPS- or smartphone-based survey can help to record trips automatically and reduce respondent burden. However, the acceptance and the question about data protection and privacy must be kept in mind. Here, further research is required to develop procedures to compromise between efficient data processing techniques to handle the vast amounts of information generated by GPS-enabled surveys and comply with data privacy regulations.
Finding reliable and motivated participants is a fundamental requirement for a longitudinal survey. New sampling formats must be evaluated against more conventional forms of recruitment. For example, online access panels are efficient for recruitment. However, less-motivated participants will also be included. Recruitment via social networks does not make it possible to control for representativeness. Therefore, data quality and trustworthiness must be balanced against the quest for statistical representativeness. Here, much research and the definition of standards are required. This will, again, lead to the central question of for what research purposes should a panel survey be installed and what statistical representativeness is required.
Additionally, in MOP, it was not possible to clearly distinguish between non-trip-making and non-reported travel. Therefore, in multiday surveys, the reasons for non-trip-making should be asked. This has positive side effects: first, it identifies the substitution of physical travel. Second, it gives participants with a positive attitude toward the survey a task to have something to report even when not active. Third, it identifies individuals who stopped reporting at all. Here, research is required to develop an appropriate format.
Further, we must develop international standards for longitudinal travel surveys to ensure comparability and collaboration across countries. Standardization facilitates the pooling of data from multiple sources, enabling large-scale analyses and global insights. Further research could also focus on data fusion as it allows the integration of information from various sources to enhance the comprehensiveness and accuracy of longitudinal survey data.
Besides this, longitudinal travel surveys offer a unique opportunity to track changes in psychological factors over time and understand their impact at individual and societal levels. While this has not been part of MOP in the past, we see high potential for future projects. Linking travel behavior with travel-related attitudes and norms on the individual level is essential to better understand the mechanisms of everyday travel.
In the future, longitudinal surveys will play a significant role in assessing the impact of actions to address climate change, such as adopting clean technologies. Monitoring the long-term effects of such actions requires time to penetrate the market. Further research faces the challenge of accurately measuring the impact of these actions and understanding their influence on climate change, considering other concurrent environmental factors.
In conclusion, longitudinal travel surveys are indispensable in travel research because they can track changes, reveal causal relationships, and provide deeper insights into various aspects of travel behavior and its societal dynamics. Integrating emerging methodologies such as smartphone surveys, geospatial data, and data fusion techniques, and establishing international standards, enhances the potential of longitudinal studies to drive meaningful and influential research. Moreover, their application in tackling complex issues such as climate change contributes to understanding the effectiveness of actions that influence behavior.
Footnotes
Author Contributions
The authors confirm contribution to the paper as follows: study conception and design: B. Chlond, L. Ecke, M. Magdolen, P. Vortisch; data collection: B. Chlond, L. Ecke, M. Magdolen, P. Vortisch; analysis and interpretation of results: B. Chlond, L. Ecke, M. Magdolen, J. Vallée; draft manuscript preparation: B. Chlond, L. Ecke, M. Magdolen, J. Vallée. All authors reviewed the results and approved the final version of the manuscript.
Declaration of Conflicting Interests
The author(s) declared no potential conflicts of interest with respect to the research, authorship, and/or publication of this article.
Funding
The author(s) disclosed receipt of the following financial support for the research, authorship, and/or publication of this article: This paper presents analyses of the German Mobility Panel funded by the German Federal Ministry for Digital and Transport.