
Abstract
The steady growth in light truck use and ownership in Canada is a cause for concern because it poses significant negative externalities in the form of higher fatalities, increased congestion, impacts on the environment, and infrastructure wear and tear. Understanding why drivers choose to use these vehicles is important for policymakers interested in decreasing their use. Using data from 2,203 vehicle owners in the Montreal metropolitan area, this study uses a factor-cluster analysis approach to generate five distinct groups of drivers: auto-dependent families, pragmatic drivers, established drivers, physically active workers, and urban drivers. Identifying these unique groups can be a useful step for policymakers interested in reducing light truck ownership by influencing vehicle choice changes, mode shifts, and land use changes. Findings from this study can help transport policymakers better understand the nuanced factors that influence the choice of a light truck on Montreal’s roads.
Keywords
Since 2010, the number of light trucks purchased in Canada has steadily increased. This class of vehicles, which includes sport-utility vehicles (SUVs), light pickup trucks, vans, and minivans, has grown from 53% of all new motor vehicle sales in 2010 to 77% in 2021 ( 1 ). Globally, the SUV fleet has risen from below 50 million in 2010 to 320 million in 2021 ( 2 ). Improved light truck fuel efficiency, low interest rates, new features, the view of a truck as a status symbol, better driving dynamics, and lower gas prices have all been cited as reasons for this increase ( 3 – 5 ). For automakers, SUVs and trucks now dominate production because of their larger profit margins ( 5 , 6 ).
The proliferation of light trucks on roads has important policy implications because of the significant negative externalities that these types of vehicles impose relative to smaller and more efficient vehicles ( 7 ). Beginning with safety, a 2008 analysis of traffic fatalities in the U.S. found that a one-percentage point increase in the light truck share of the vehicle fleet increases annual traffic fatalities by approximately 0.34% ( 8 ). White found that for every driver whose life was saved by being in a larger vehicle, 4.3 fatalities were generated on other road users ( 9 ). Increasing the weight of the striking vehicle in a collision by 1,000 lb has been found to increase the probability of a fatality in the struck vehicle by up to 50% ( 10 ).
While fuel efficiency has improved in recent years, the environmental impact of light trucks remains higher than non-light trucks. In Canadian vehicle models since 2010, average CO2 emissions are 42.4 g/km (18%) higher in light trucks compared with other passenger vehicles ( 11 ). A 10% reduction in vehicle weight has been found to correspond with a fuel consumption reduction of 7% ( 12 ). The larger and heavier nature of light trucks also creates externalities in the form of congestion and heavier impacts on infrastructure ( 3 , 13 ).
Using data collected from an online bilingual survey conducted in Montreal, Canada, this study seeks to better understand the underlying characteristics, attitudes, values, motivations, and perspectives toward car use and ownership in general, and light trucks specifically. This study differs from previous analyses as it uses a factor-cluster analysis technique to generate drivers’ typologies using sociodemographic, neighborhood, and attitudes data. The result is five distinct cluster groups with their own attitudes, preferences, and behaviors toward their vehicle choice and travel behavior. This typology can help urban planners and policymakers understand the different segments of drivers that choose to own and drive vehicles that pose such significant negative externalities.
Literature Review
The literature on light truck ownership is rich and goes back decades. Lave and Train found that frequent drivers, older drivers, and high-income drivers are more likely to buy larger vehicles, and that households owning more than two vehicles tend to choose smaller cars when they buy additional vehicles ( 14 ). In a study of Israeli car owners, Hocherman et al. found that older people care less about purchase price and operating cost than younger drivers ( 15 ). Research on automobile choice in single-vehicle households found that there are fewer large purchases by urban dwellers ( 16 ). Younger individuals are also more likely to own a sports car, SUV, and pickup truck; high-income earners are more likely to drive an SUV; and larger households are more likely to own a van or station wagon ( 17 ).
Choo and Mokhtarian emphasize the power of including travel attitudes, personality, lifestyle, and the built environment in vehicle choice models ( 18 ). Cao et al. combined neighborhood characteristics and preferences with travel attitudes, behavior, and sociodemographic characteristics in a nested logit model to determine that suburban neighborhoods are associated with the choice of a light truck as a vehicle ( 19 ). Other research shows that a lower density of 1,000 housing units per square mile implies a positive difference of almost 1,200 more miles driven per year and 65 more gallons of fuel per household. In these lower density areas, there is a greater number of light trucks ( 20 ). After controlling for sociodemographics and travel attitudes, vehicle choices were found to be marginally influenced by the diversity of land use near home locations ( 21 ).
A comprehensive literature review of vehicle choice modeling found that household demographics, individual attributes, employment attributes, life-cycle changes, built environment factors, public transport attributes, and policy were the most common variables analyzed in previous studies of vehicle type choice ( 22 ). Previous research segmenting the public transit market has identified two types of car user: potential riders and car captives. The approach of segmenting the market has been promising in introducing policy interventions that can be effective if certain groups of the population are targeted. Anable used respondents’ attitudes and behaviors to create six different clusters ranging from non-car owning “reluctant riders” to car owning “malcontented motorists” before providing policy recommendations for target each group ( 23 ). A similar method was employed by Krizek and El-Geneidy to segment commuters into types of public transport rider to generate policies that increase the satisfaction of existing users and help in attracting new ones, and by Damant-Sirois et al. to divide cyclists into four distinct groups to recommend policies that can increase the frequency of cycling ( 24 , 25 ). Most recently, a K-means clustering analysis was used by Chen et al. to segment six built environment types, finding that large vehicles are more likely to be chosen by larger households, higher-income households, and those who live in more transit-accessible areas ( 26 ). Their recommendations supported the design of mixed-use, higher-density neighborhoods to reduce vehicle sizes and use.
Following the conclusions of Choo and Mokhtarian, this study includes attitudes, lifestyle factors, and behaviors in a vehicle choice model ( 18 ). A typology of drivers is generated using a factor-cluster analysis that can help in understanding the rationale behind light-truck ownership which can help generate policies that can help in reducing light truck use and ownership in Montreal. While previous studies have dealt with the automobile market as a coherent group, this study segments the population allowing for a more nuanced understanding of vehicle owners.
Methods
Survey Tool
This study uses data collected in October–November 2019 through Wave 1 of the Montreal Mobility Survey (MMS). The MMS is a multi-year survey conducted by Transportation Research at McGill (TRAM). MMS collects data on travel behaviors and transport perceptions in addition to sociodemographic, economic, and physical characteristics. Following Dillman et al., multiple recruitment methods were applied to ensure a large and representative sample ( 27 ). Half of the survey participants were first recruited through a marketing company, while the other half was recruited through a social-media advertising campaign, with fliers distributed randomly to houses in the areas near the projects and through invitation emails sent to various mailing lists in the region. The first wave had 3,533 valid respondents after the data had been filtered to remove responses that were incomplete and those that were filled in too quickly. Other unreliable responses, such as being older than 99 years or having commutes longer than 200 min were also removed. Finally, those who did not own an automobile, those who did not provide reasons for their choice of automobile, and respondents who did not supply reasons for selecting their home location were removed from the data, leaving a sample of 2,203. Vehicle model responses were cleaned and classified as a light truck or SUV in accordance with Natural Resource Canada’s Fuel Consumption Guides dating back to 1995 ( 11 ). Respondents ranked nine reasons for their car choice from “not important at all” to “absolutely essential.” Similarly, 15 factors for home choice were ranked from “very unimportant” to “very important.” Both ranking methods were then converted into an ordinal scale from 1 to 5. Respondents were also asked about their reasons for choosing their main mode to work, attitudes toward different modes, and weekly travel behavior. Land use and location variables including population densities, walk scores, and accessibility measures were calculated based on census tract and postal-code-level data.
Factor-Cluster Analysis
Variables from the survey, as well as accessibility measures, and census variables which could influence automobile choice including socioeconomic data, neighborhood characteristics, travel behavior, life satisfaction, and upbringing were identified from the literature (Choo and Mokhtarian) and input into a factor analysis in SPSS software ( 18 ). After analyzing the breaks in a scree plot, it was determined that 13 factors, containing 45 variables and explaining 58.7% of the total variance, were ideal for this analysis. Table 1 shows the breakdown of each factor along with loading scores.
Factors with Loading Scores
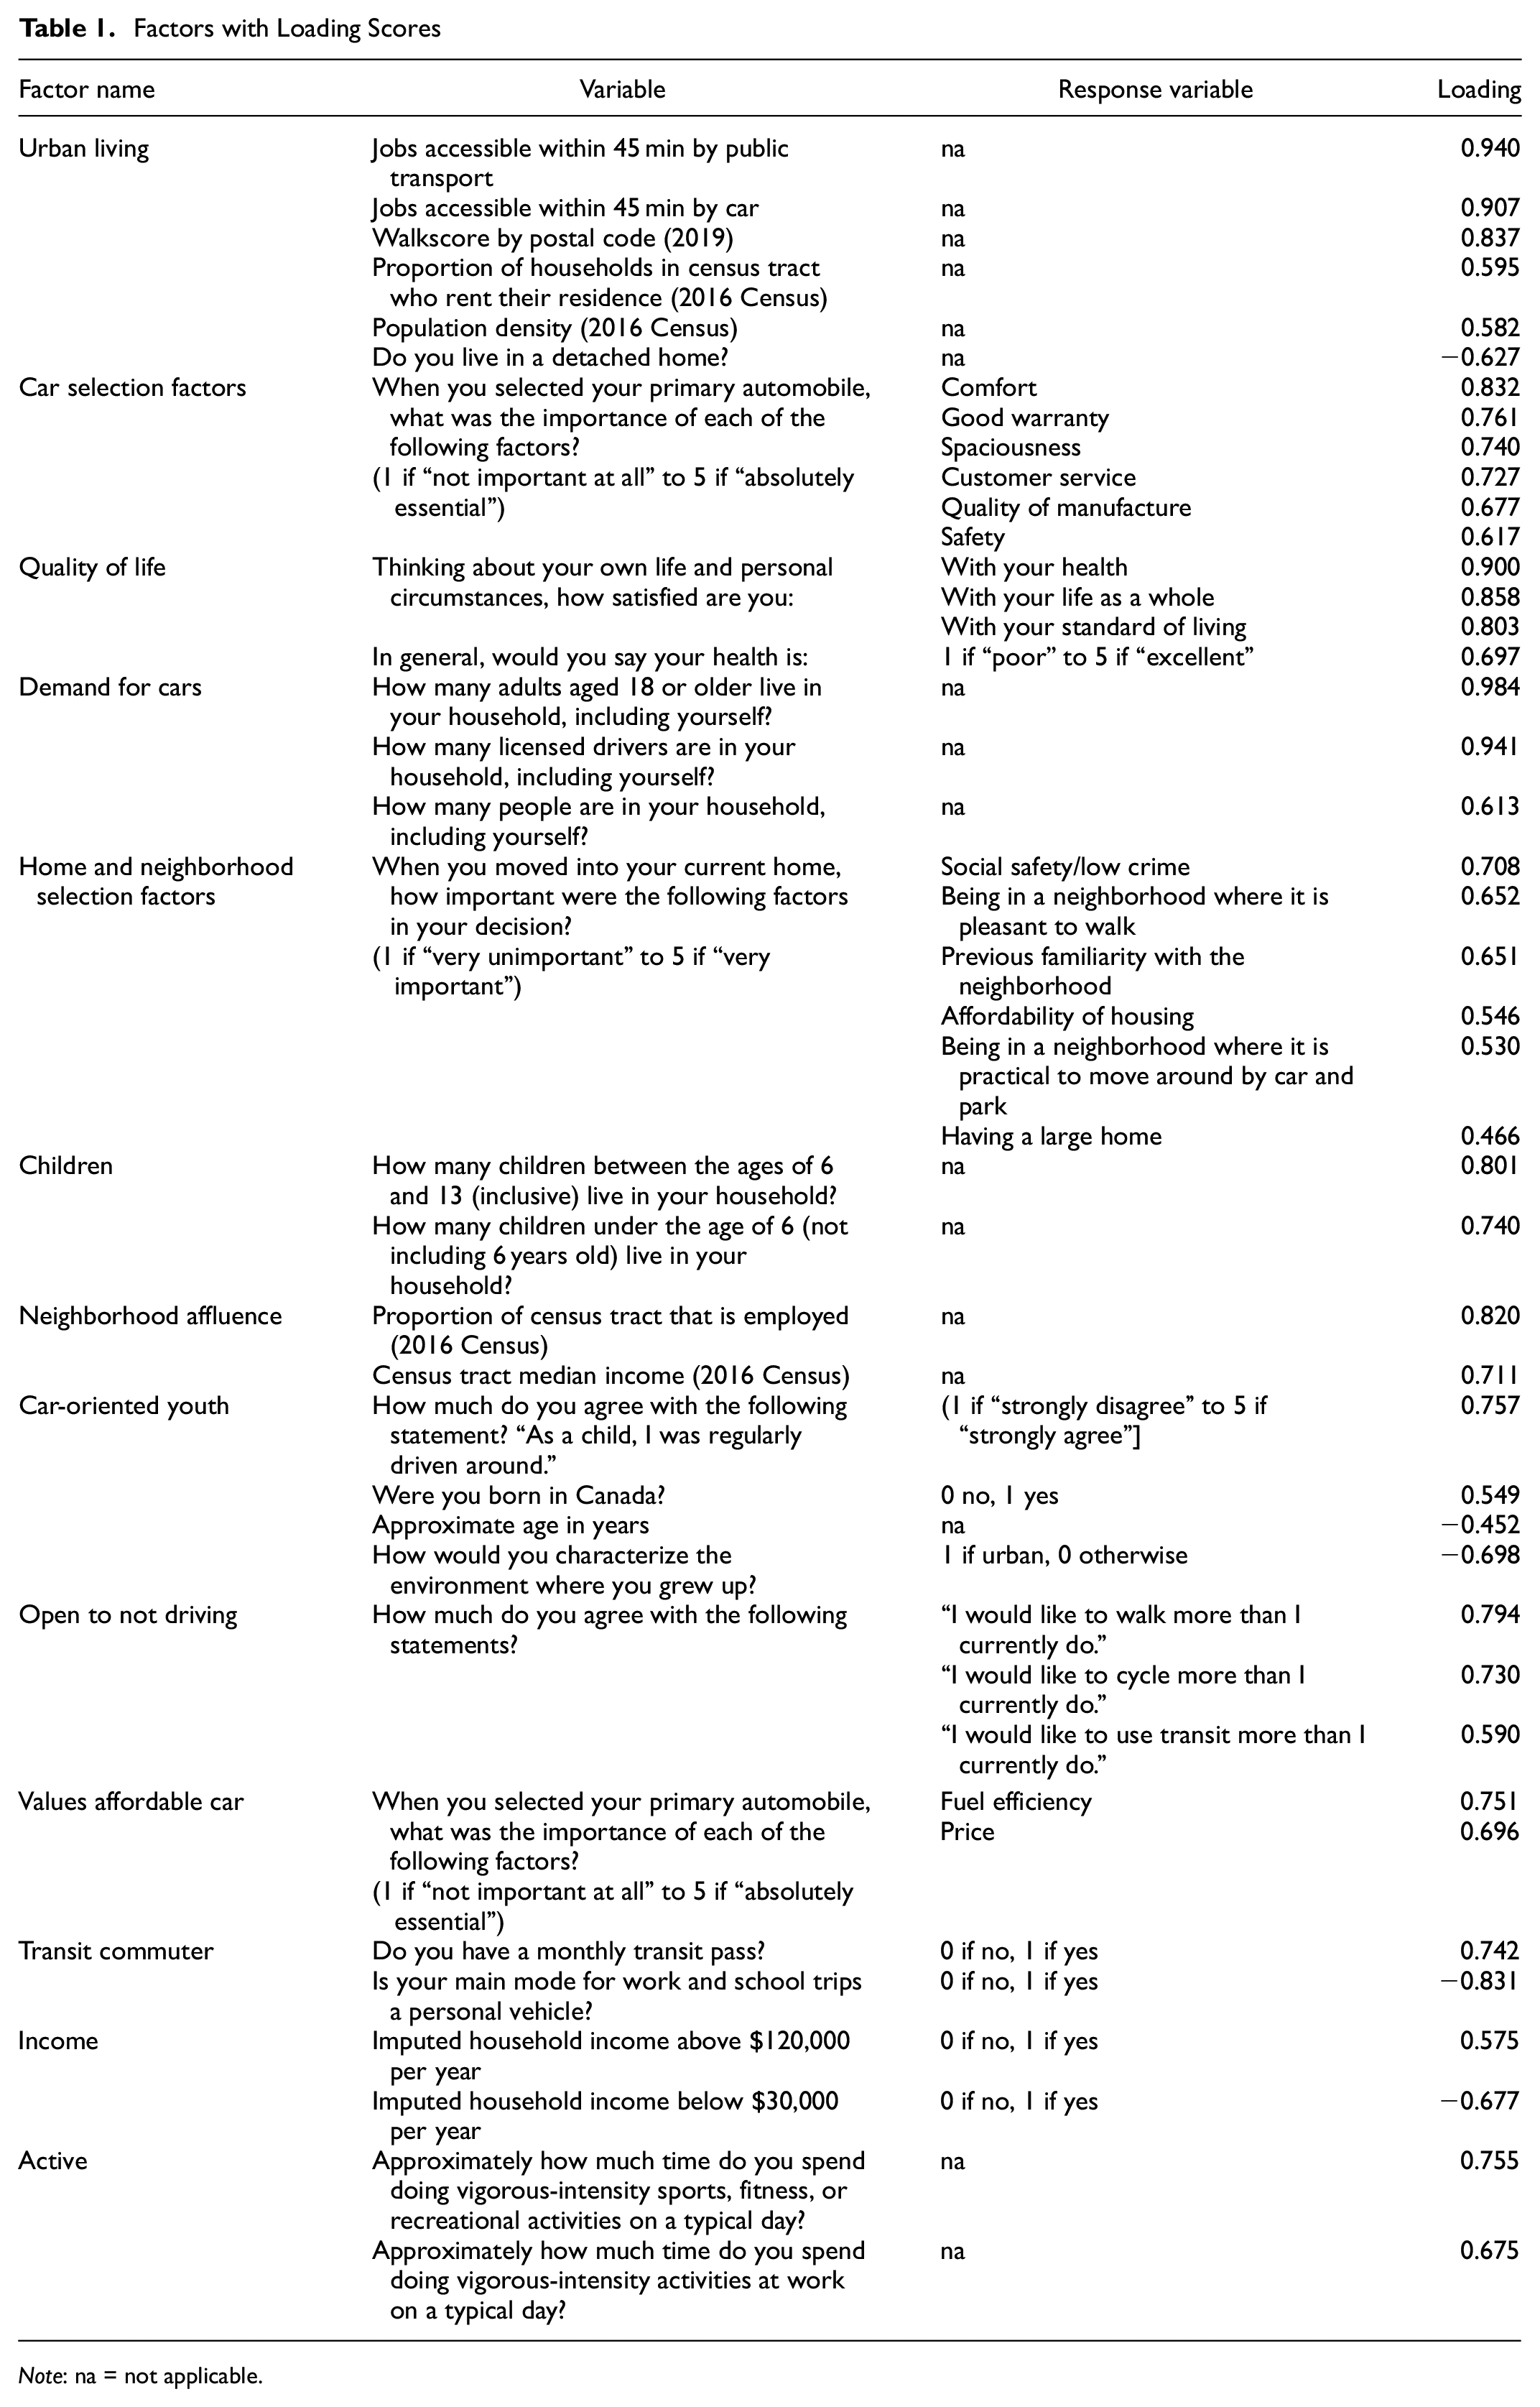
Note: na = not applicable.
Afterwards, several cluster variations ranging from two to eight were attempted in a K-means cluster test with five providing the best distribution and most reasonable results. The resulting five clusters, as shown in Figure 1, are named to reflect the characteristics of their household traits, travel behavior, and stated reasons for car and home choice, as well as several other factors. In order of most light trucks owned to least, the groups are: auto-oriented families, pragmatic drivers, established drivers, physically active workers, and urban drivers. Figure 1 shows the characteristics of the five clusters of drivers.
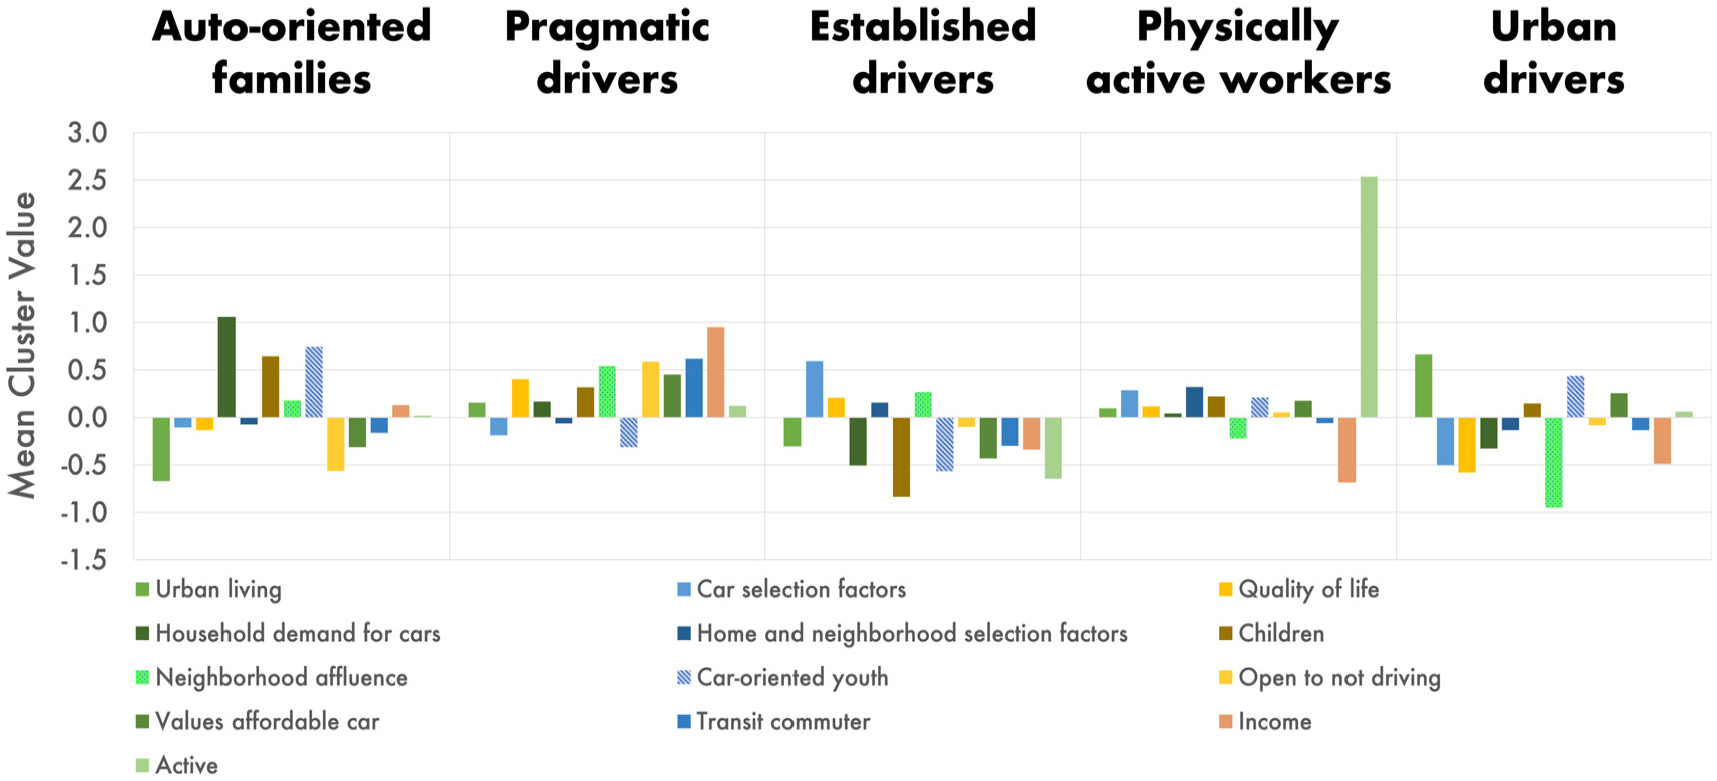
Factors and clusters.
Results
Survey Overview and Summary Statistics
After filtering, the sample of 2,203 included 1,147 (52.07%) who identified as female, 1,035 (46.98%) who identified as male, 9 (0.41%) who identified as non-binary, 1 (0.05%) who identified as other, and 11 (0.5%) who preferred to not answer. The sample had a median age of 46 years. Of these 2,203 drivers, 41% own at least one light truck with the average number of this type of vehicle owned at 0.46 per household. Since respondents were only able to provide information on their primary and secondary vehicles, the actual number of SUVs and light trucks per household may be higher than our calculations as it is possible that some households have three or more light trucks. A total of 1,310 (59.5%) respondents commute to work with 621 (47.4%) using a personal vehicle to get to work, 135 (10.3%) using active transportation, and 549 (41.9%) taking public transport. A total of 275 respondents (12.5%) commute to school, with 74 (26.9%) using a personal vehicle, 45 (16.3%) using active transportation, and 150 (54.5%) taking public transport.
Factors
Clusters
Auto-Oriented Families (17%, n = 376)
Auto-oriented families own the highest number of light trucks and are the most likely to own at least one of these vehicles. As Table 2 indicates, this cluster also owns the most private automobiles per household, their incomes skew higher, and they have the highest rate of home ownership. This group is the most likely to be born in Canada, has the largest household sizes, and has the highest employment rate. The younger ages, higher income distribution, large household sizes, and high rate of student responses from those in auto-oriented families is indicative of a high number of respondents being from young adults who still live with their parents.
Household Characteristics of Cluster Groups
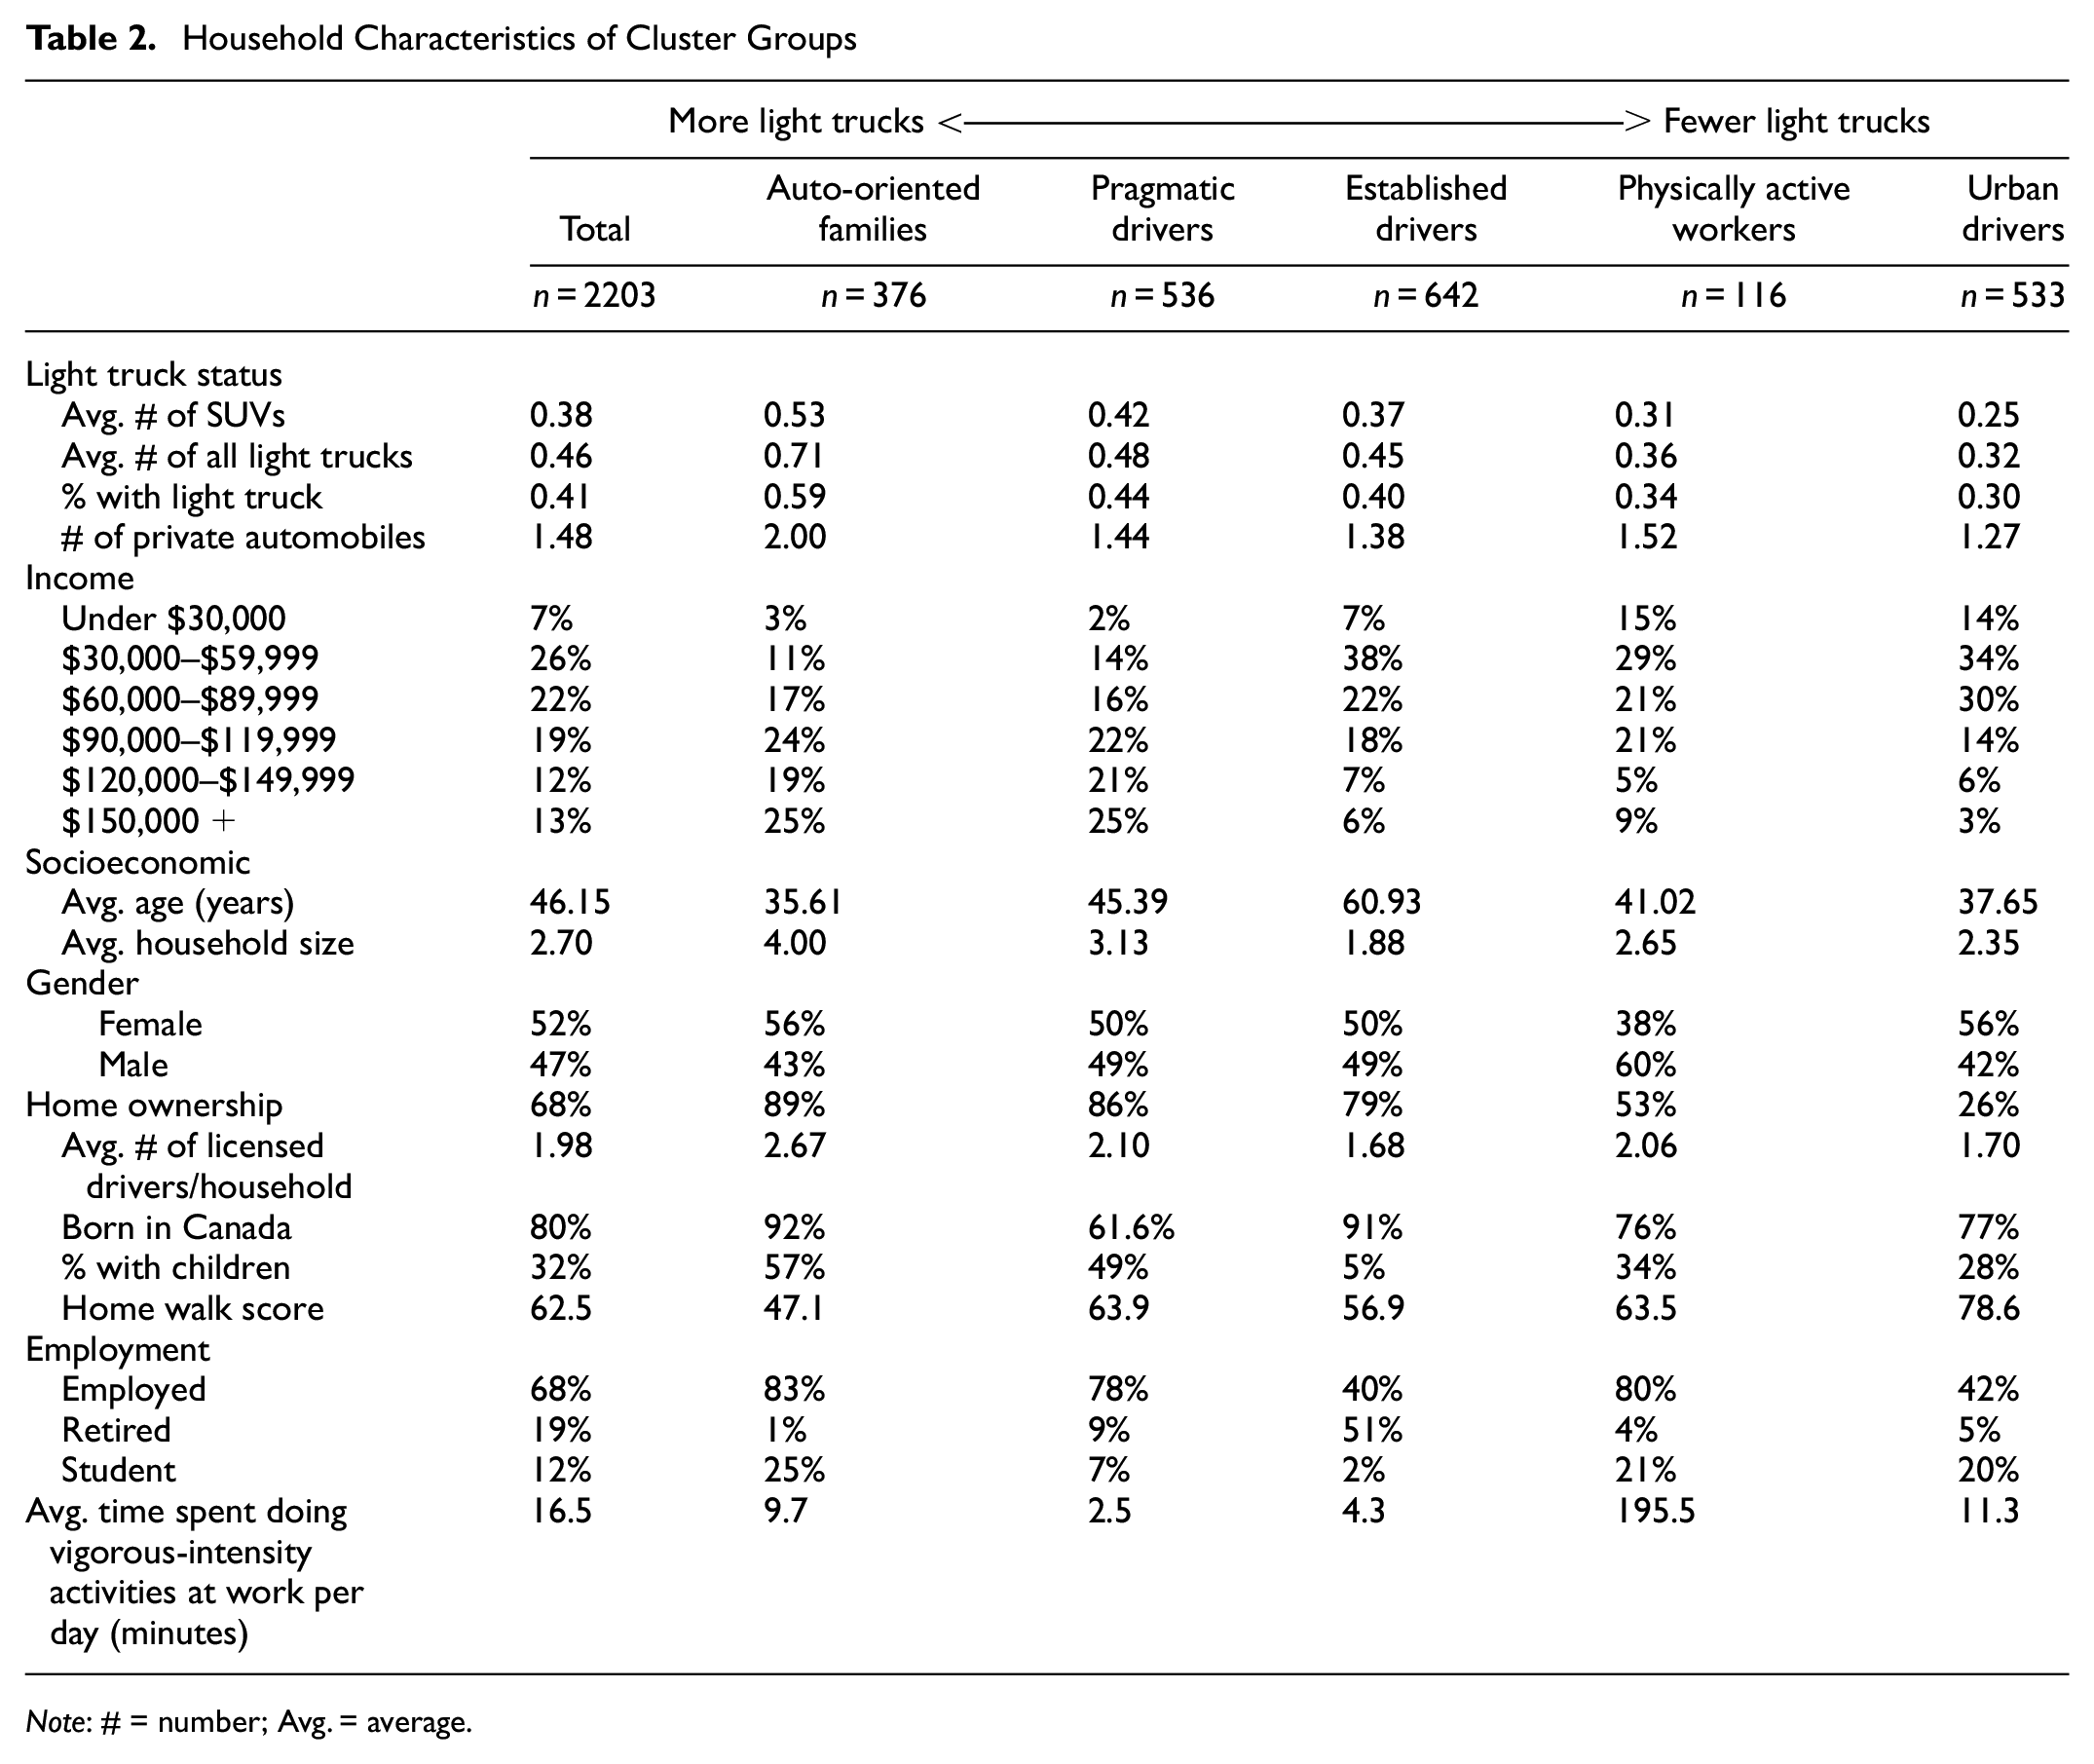
Note: # = number; Avg. = average.
Table 3 shows that the automobile is an essential element of the daily lives of this group with half of drivers using their automobile as their primary mode to get to work and nearly half of non-work trips (49%) being taken by private automobile. This group has a higher-than-average reported number of driving trips in the last 7 days for work, school, shopping, and healthcare. This group also has the highest average number of licensed drivers per household and the highest access to cars.
Travel Behavior and Attitudes
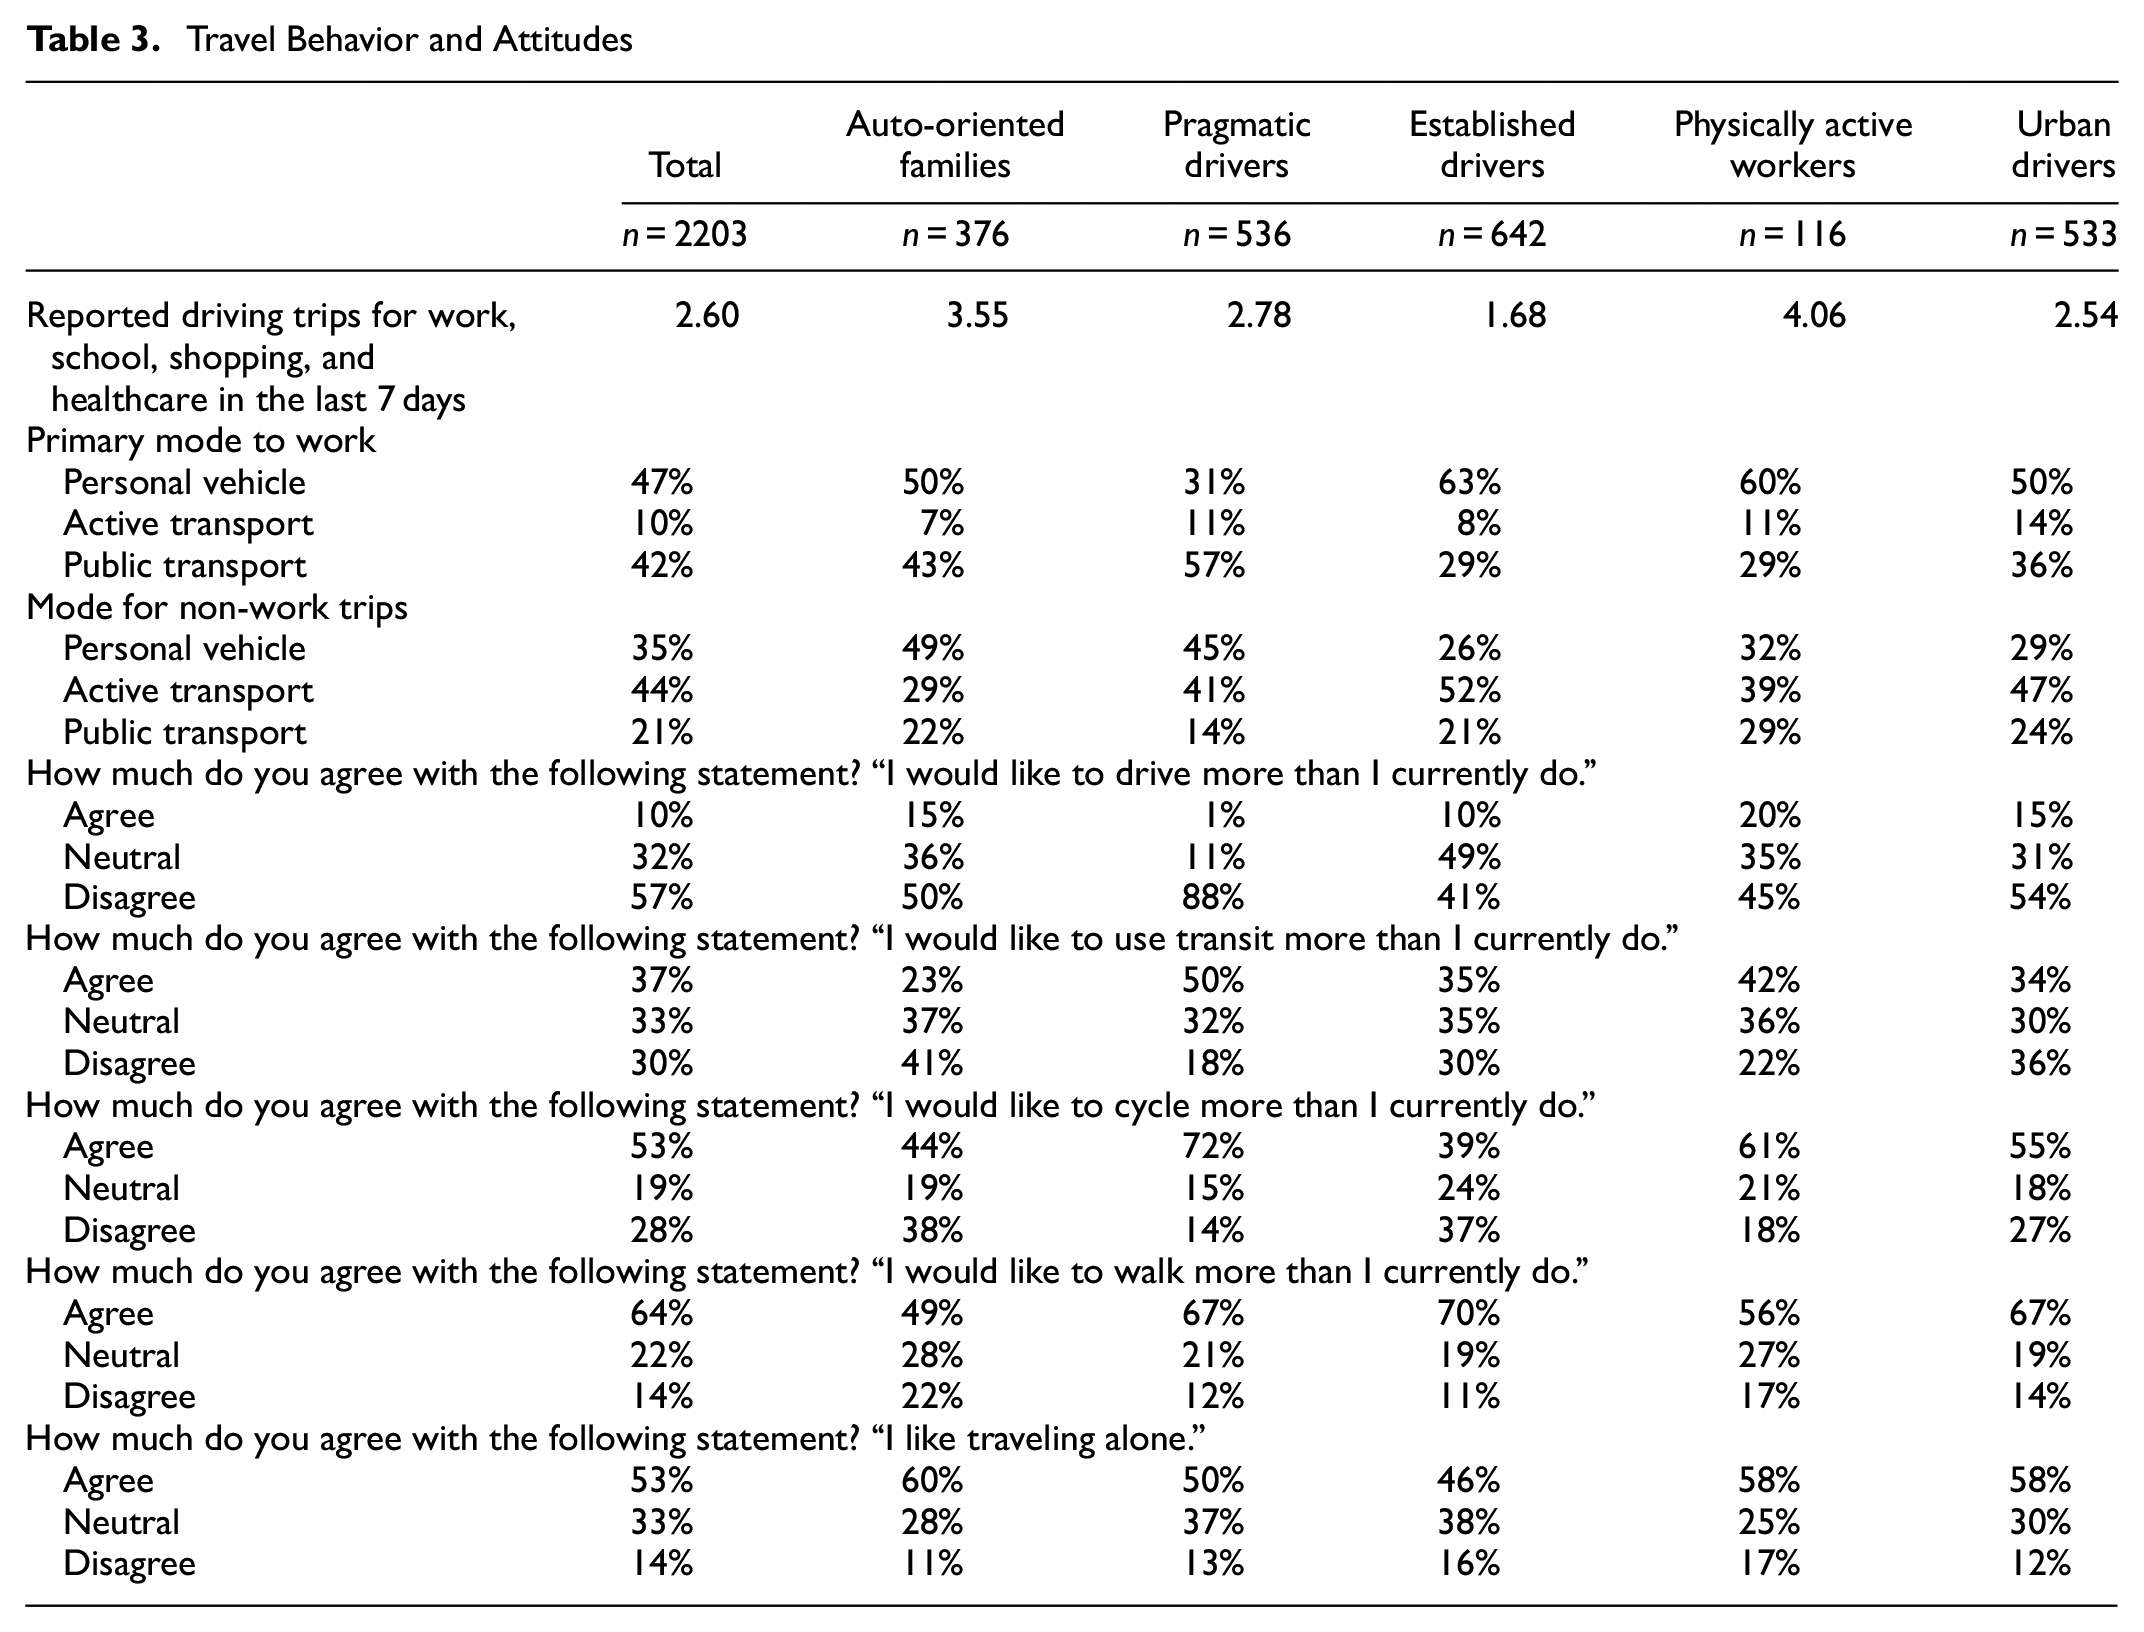
Table 4 indicates that, when choosing an automobile, this group’s biggest focus is on price, followed by usefulness for everyday driving, and quality of manufacture. Auto-oriented families also care relatively less about fuel efficiency. Their overall lower emphasis on all features is indicative of their attitude to their automobile as a utilitarian good that simply makes their daily lives easier. When choosing their home, this group cares the most about social safety/low crime and places a relatively higher value on the presence of good schools for their children and having a large home.
Reasons for Vehicle Ownership and Use
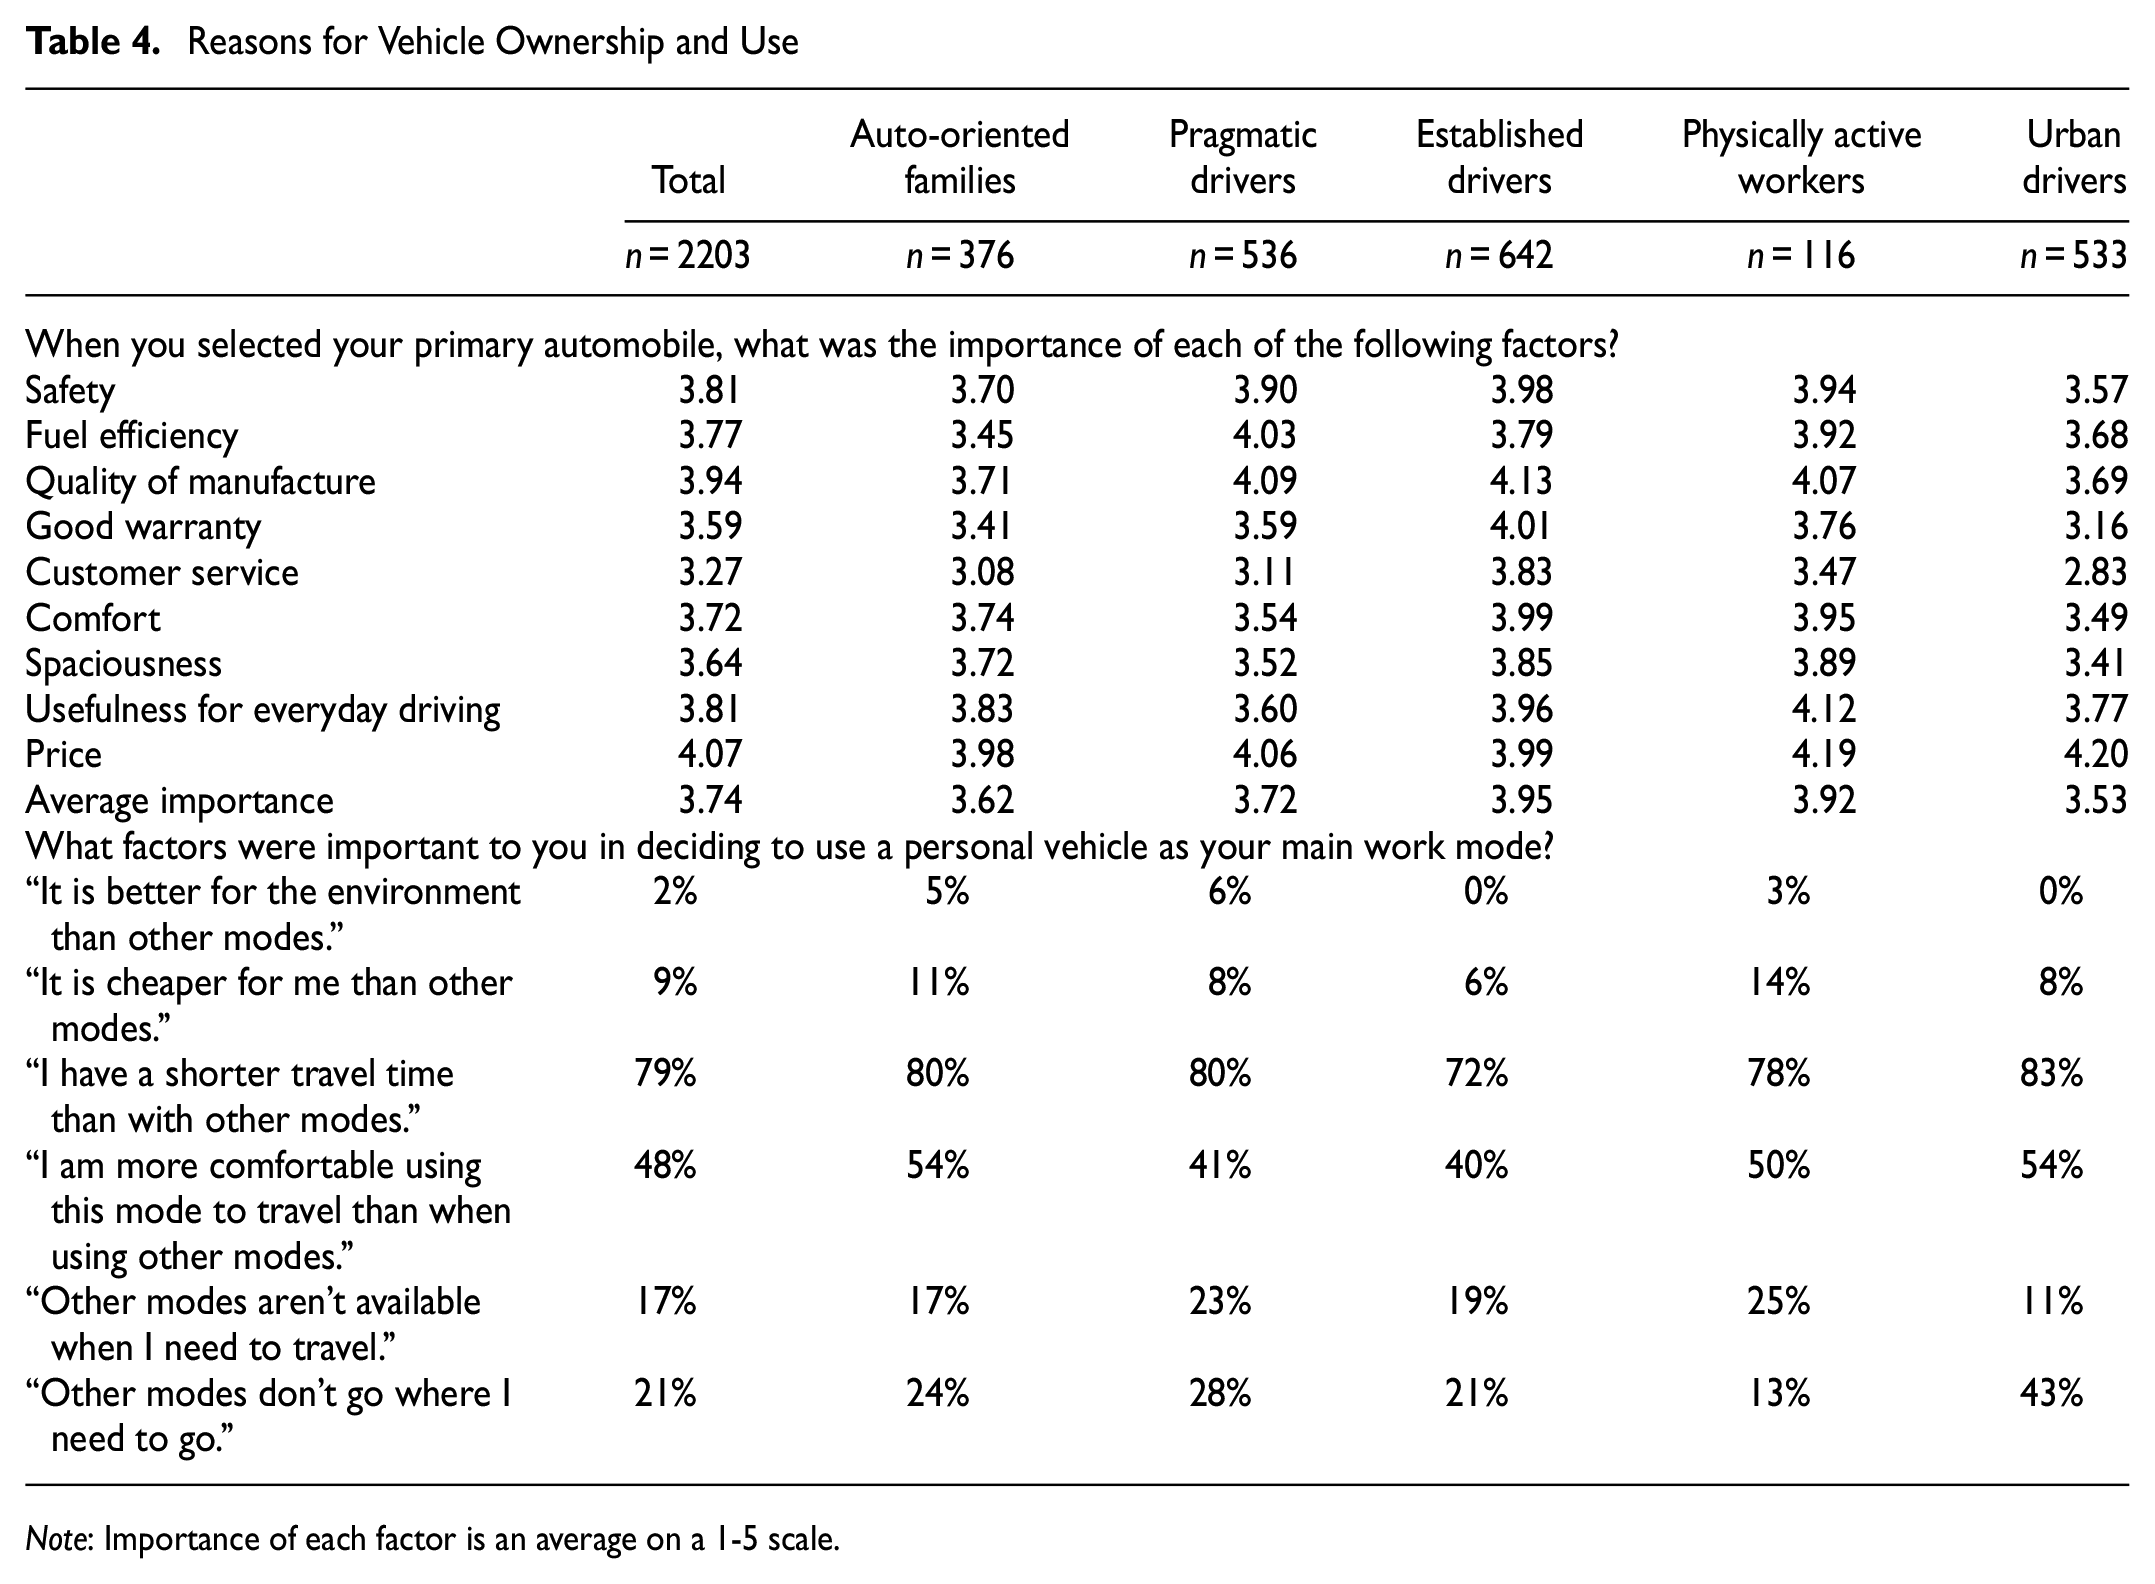
Note: Importance of each factor is an average on a 1-5 scale.
As Figure 2 indicates, auto-oriented families make the fewest trips to the grocery store per week at only 1.32 but are the most likely to drive (71%) for these trips. This behavior, deemed the Costco effect, suggests that these households purchase large quantities of groceries at once. Bulk purchasing can explain why a larger vehicle may be chosen by these households. Conversely, it is possible that owning a larger vehicle shifts the behavior of grocery shoppers toward bulk purchasing.
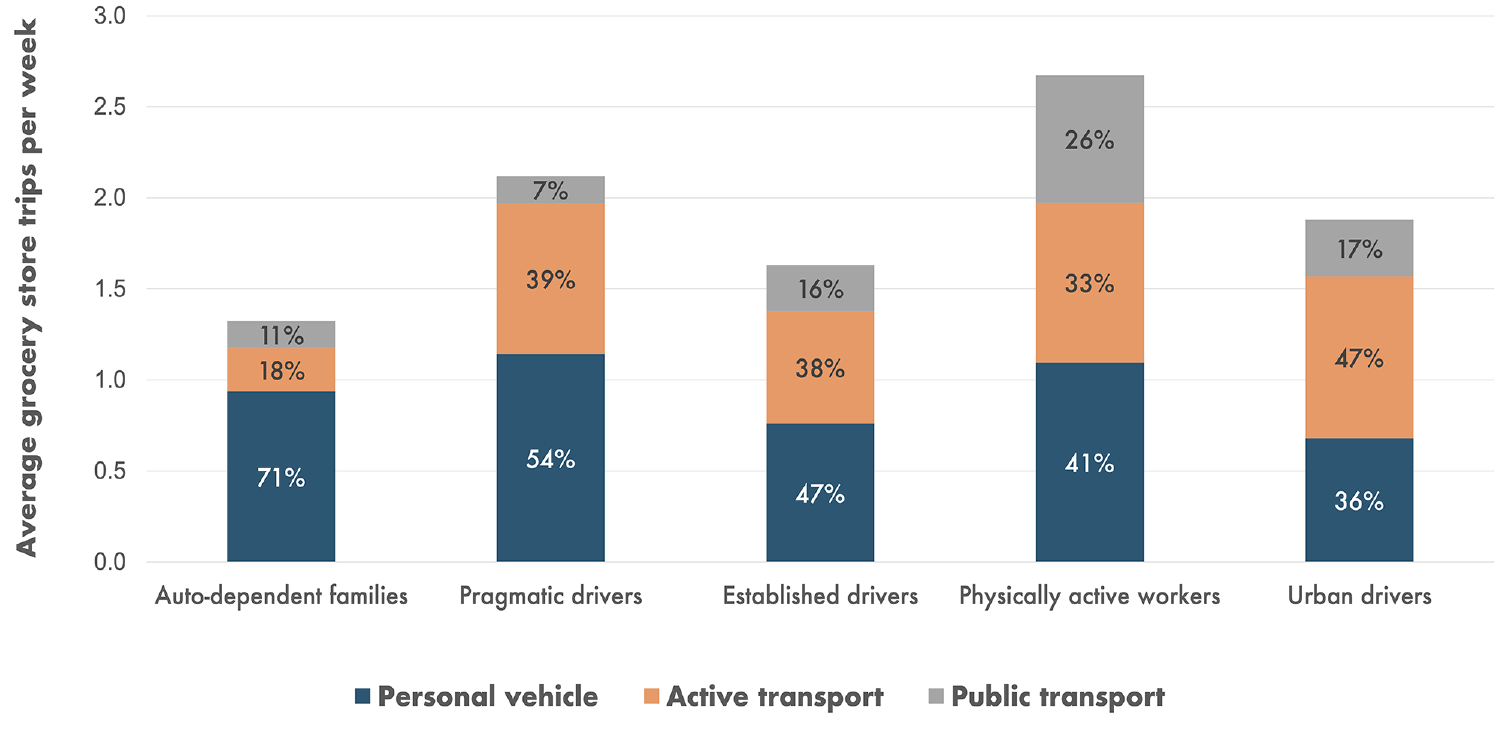
The Costco effect—average trips to the grocery store per week by mode.
Table 5 indicates that auto-oriented families generally place a lower importance on living close to jobs, amenities, and services than other groups. This group values living in a neighborhood where it is practical to move around by car and park, owning a larger home, and living near good schools for their children.
Home Location Factors
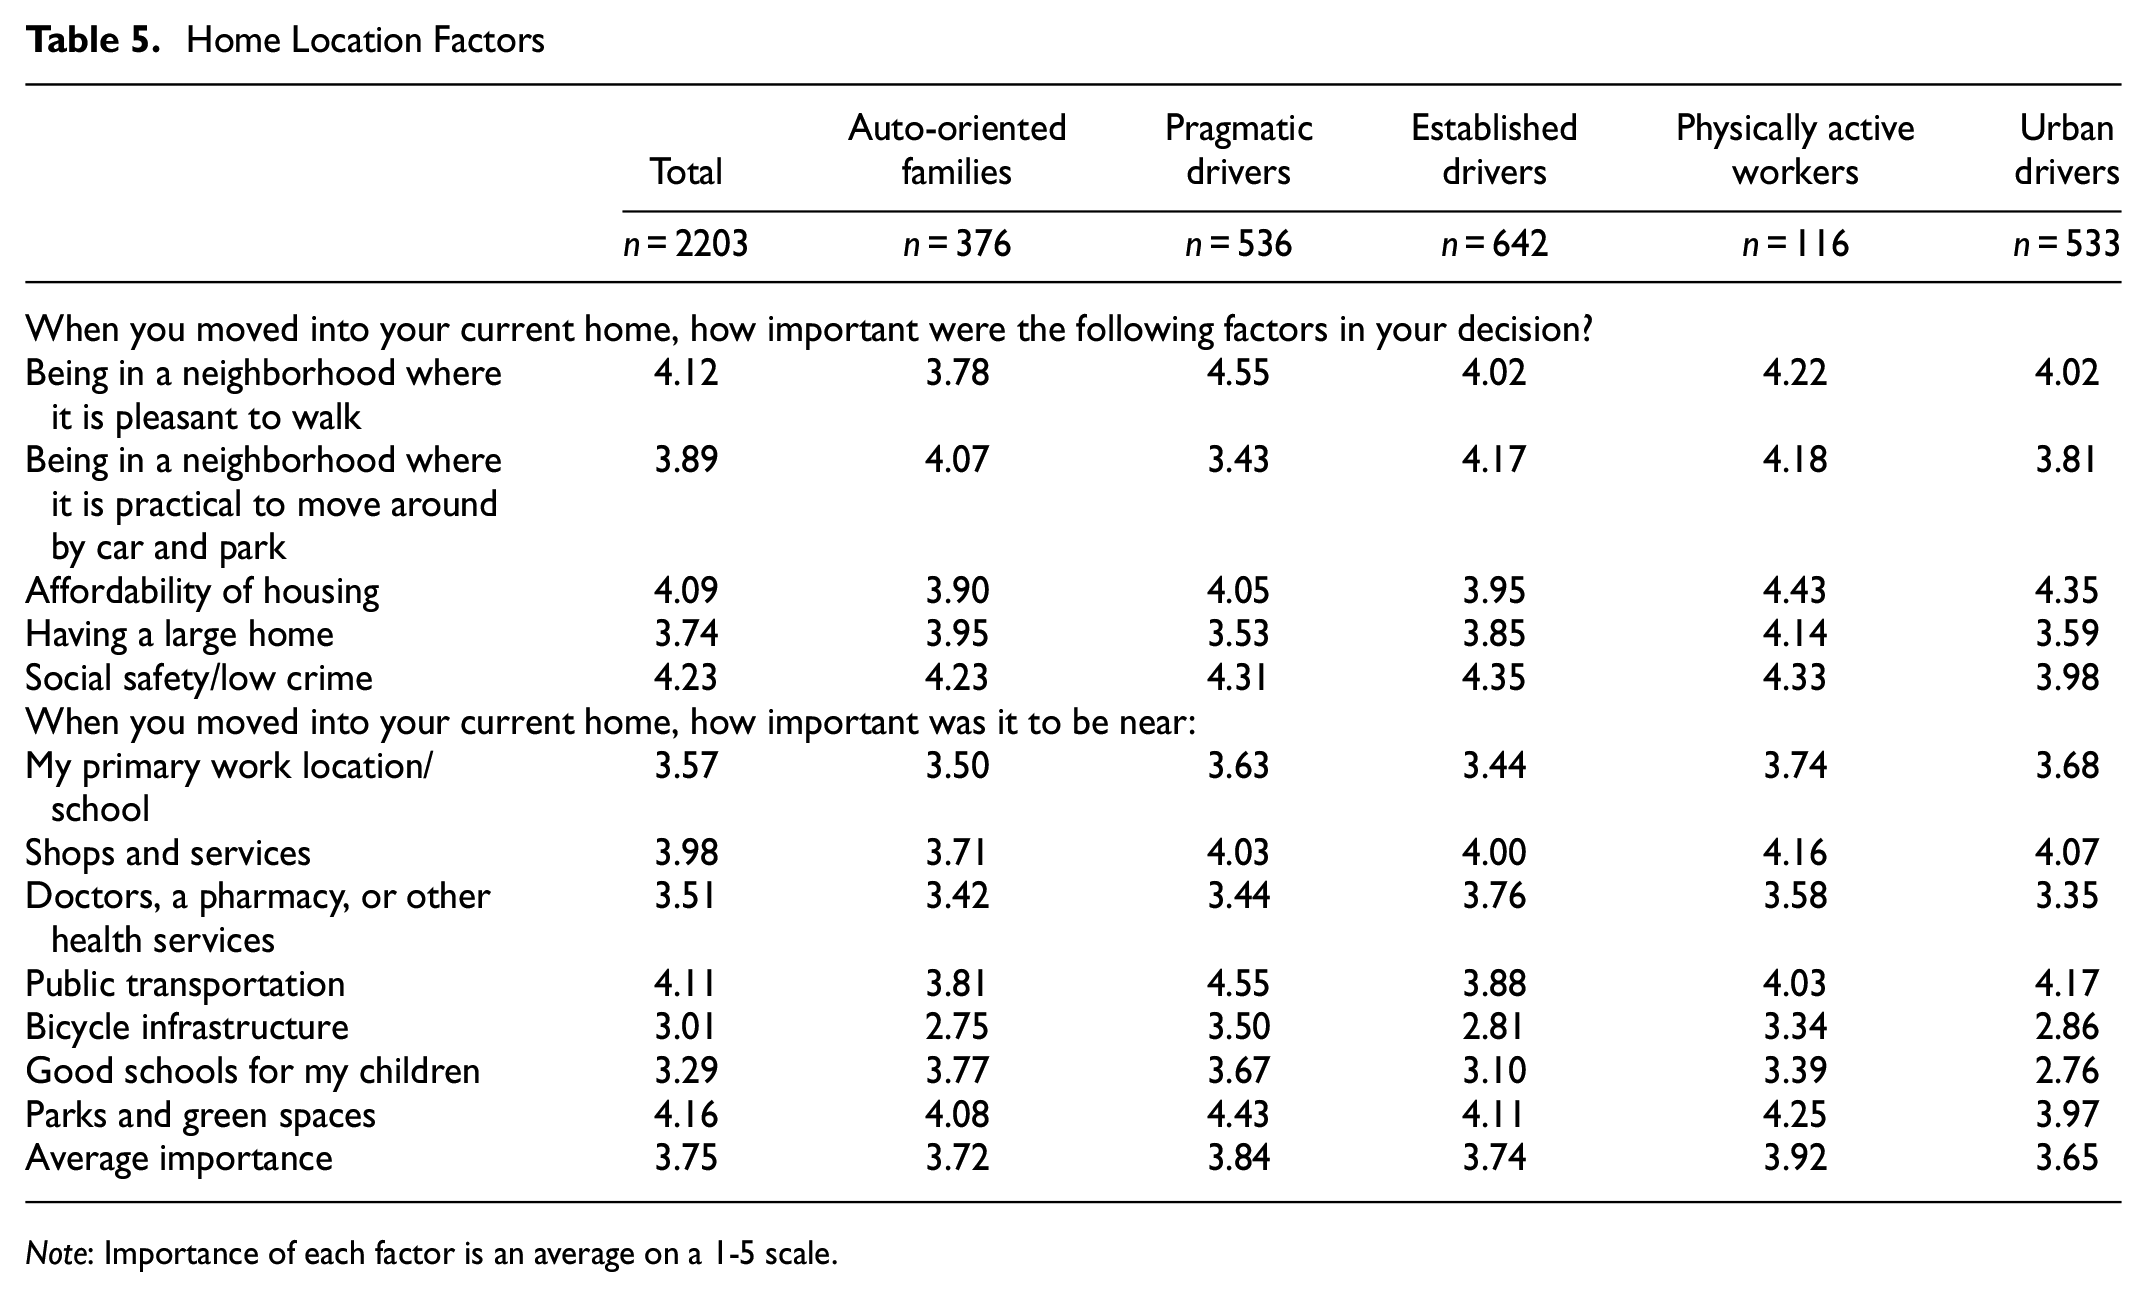
Note: Importance of each factor is an average on a 1-5 scale.
This group is content with their level of driving and is not particularly interested in switching to another mode. This attitude may stem from having upbringings that were car-oriented with 72% agreeing that they were regularly driven around as a child.
Pragmatic Drivers (24%, n = 536)
Pragmatic drivers own 0.48 light trucks per household with 44% having at least one. Despite owning the second-highest rate of light trucks, this group is very open to alternative modes. As Table 3 shows, this group reported the third highest level of driving trips in the last 7 days. Despite this, only 1% of these drivers agreed that they would like to drive more. The vast majority would like to bike and walk more than they currently do, with 50% reporting that they would like to take public transport more. Pragmatic drivers use public transport for a high number (52%) of work trips yet are the least likely to use public transport for non-work trips (14%) with a large shift toward personal vehicles. There is a significant opportunity for mode shift for this cluster outside of peak commute hours.
The minority of pragmatic drivers who used a personal vehicle to get to work do so mainly because of shorter travel times than other modes. If this group stops on their way to work, it is likely to drop off their children at school or daycare. This group has a higher percentage of first-generation immigrants (38.4%) and is well off economically with 68% earning above $90,000 per year, 86% owning their home, and an employment rate of 78%. Their car choice is motivated by quality of manufacture with a relatively higher emphasis on fuel efficiency and safety. When choosing their home, members of this group care the most about being in a neighborhood where it is pleasant to walk with a relatively higher priority on being near bike infrastructure, and the presence of good schools for their children.
Established Drivers (29%, n = 642)
Established drivers are older respondents who are mostly retirees. This group owns 0.45 light trucks per household with 40% of respondents owning at least one SUV or truck. This group was predominantly born in Canada, live in small households, and have the lowest rate of children at home.
As such, established drivers have different travel needs and behavior than groups such as auto-oriented families and pragmatic drivers. This group has the lowest number of reported driving trips in the last 7 days, and they commute to work far less than other clusters do. If they do commute, they are the most likely to use a personal vehicle to get there. With a lower regular access to cars, this group places the highest average importance on all car characteristics with a higher emphasis on car comfort and spaciousness and a lower emphasis on price. Their logic for owning a light truck is likely that since they may only need one automobile, they might as well get one that is reliable, comfortable, and serves their needs. This group is content with their current level of driving but 70% report that they would like to walk more than they currently do. When choosing their home, this group cares the most about social safety/low crime with a relatively higher priority on being in a car-friendly neighborhood and proximity to health-care services.
Physically Active Workers (5.2%, n = 116)
The smallest group of drivers is physically active workers who own, on average, 0.36 light trucks per household. As Table 2 shows, this group is defined by their dramatically higher average minutes spent doing vigorous activities at work on a typical day at 196 min (3.26 h). This suggests that this cluster is dominated by those working in the trades, manual labor, and other physical work. The nature of their employment, often going to different job sites and sometimes having to bring tools and equipment with them, likely makes their travel behavior distinctly different from those commuting to offices or teleworking. As a result, this cluster has the highest reported driving trips in the last 7 days and is tied for the lowest mode share to work by public transport (29%).
Physically active workers are the most likely to stop on their most recent work or school trip. For this group, their automobile gives them flexibility and provides increased convenience through trip chaining. Physically active workers have the most car-friendly attitudes with 20% reporting that they would like to drive more. This group likes traveling alone, is open to cycling and public transport, and is uninterested in walking more than they already are. Price is the most important automobile trait for this group with a relatively high premium placed on usefulness for everyday driving, and spaciousness.
This cluster has the highest share of those identifying as males (60%), a lower home ownership rate (53%), the second highest employment rate (80%), and an income distribution skewed toward lower-income groups. The principal factor in choosing their home is affordability with a relatively higher importance on having a large home and being in a neighborhood where it is practical to move around by car and park than other groups.
Urban Drivers (24%, n = 533)
Urban drivers have the lowest rate of light truck ownership with 0.32 per household. Half of this group uses an automobile to get to work with 83% of these commuters reporting that their automobile is used because it is faster than other modes, and 43% saying that other modes do not go where they need to. When not going to work, this group uses active and public transport for most trips. This suggests that many of these urban individuals go to work locations outside of the downtown core that are difficult to access by public and active transport.
When choosing their vehicle, urban drivers, on average, valued all car characteristics lower than other clusters. Price is by far the most important factor followed by usefulness for everyday driving. When choosing their home, this group values affordability, being near public transport, and being near shops and services the most.
Conclusion and Policy Implications
Using a factor-cluster analysis of drivers in Montreal, this study helps understand the motivations that influence a household’s decision to own and use a light truck. The resulting five clusters can be a useful first step to identify policy interventions that would reduce or minimize the negative externalities of vehicle choice, with specific reference to light trucks and SUVs.
To discourage light truck ownership and use, a variety of policy interventions should be considered to address different groups of drivers. As Figure 3 shows, this can be primarily done through changing the vehicle choice of light truck drivers, changes to transportation systems that encourage a mode shift away from using a personal vehicle, and changes to land use that promote accessibility. The targeted policy interventions are based on travel behavior, attitudes toward transport modes, and stated home location preferences. The width of each cell is reflective of the standard deviation of each group’s reported number of driving trips in the last 7 days.
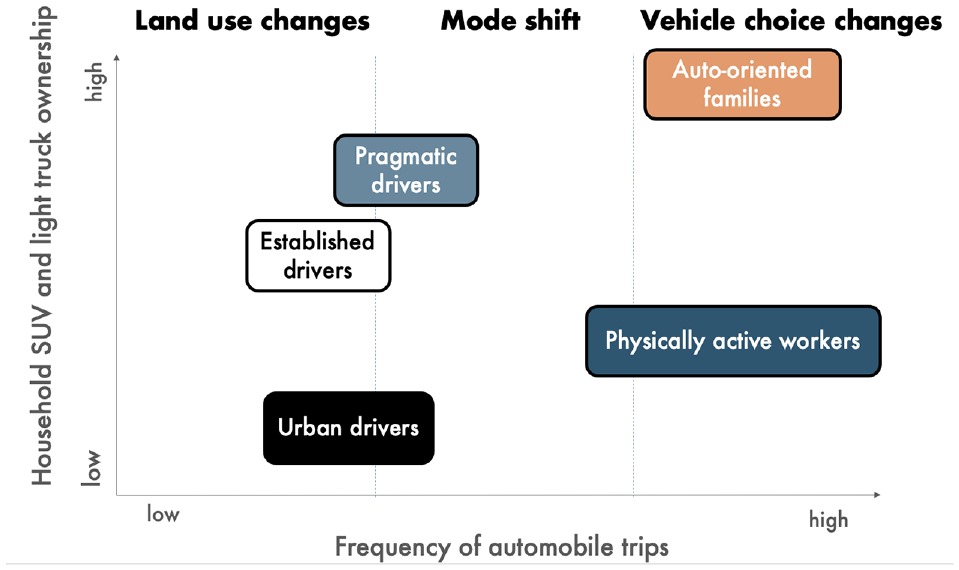
Targeted policy goals by cluster group.
Recommendations
Vehicle Choice Changes
To reduce the light truck share of vehicles on Montreal’s roads, several policies oriented toward auto-oriented families and physically active workers would be the most effective. For example, a Pigouvian tax on light trucks could prove to be effective in shifting vehicle choice away from these larger vehicles because of increased costs ( 8 ). Considering the higher environmental impacts, higher gas or carbon taxes, as well as incentives for purchasing an electric vehicle, could possible reduce the number of gas- and diesel-powered light trucks on the streets ( 10 ). Other policy options could include congestion pricing, reducing road width, and reducing the size and availability of parking to shift preferences toward smaller, more maneuverable vehicles ( 3 ).
Mode Shift
To reduce the amount of light truck driving on Montreal’s streets, policies to encourage mode shift away from personal vehicles should be considered. To incentivize this shift, policies such as a vehicle-miles-traveled tax, a reduction in the size and availability of parking spaces, or increasing the cost of parking could be explored ( 13 , 28 , 29 ).
Public transport improvements, especially at off-peak hours, could meet the needs pragmatic drivers and physically active workers who are open to using the service yet feel that it doesn’t get them where they need to go when they need to. An improved cycling network could reduce the number of personal vehicle trips taken by pragmatic drivers for non-work trips. With above-average household sizes, a focus on the environment, and a preference for being near bicycle infrastructure, this group could be primed to adopt cargo and e-bikes. For physically active workers, better cycling connections would improve accessibility to work locations and provide the flexibility they desire through the ability to trip chain. For established and urban drivers, better pedestrian infrastructure and connections could permit these groups to feel safer walking and get them to destinations faster. Improved public transport service and active transport connections should serve desired destinations such as schools, daycares, job locations, health care, and food services to maximize the benefit.
Land Use Changes
To maximize the benefits of the previous policy recommendations, policies which promote mixed-use, dense, and accessible neighborhoods should be implemented. In an analysis of U.S. cities, empirical evidence indicates that, when density increases, the probability of owning a light truck decreases, vehicle miles traveled decrease, and individuals decrease their vehicle size ( 30 ). These higher density, mixed-use neighborhoods promote accessibility and increase opportunities for interaction by public and active transport.
Such land use changes could enable closer proximity to desired destinations such as schools and daycare, especially near public transport, which would benefit pragmatic drivers. For established drivers, locating retirement homes in accessible neighborhoods with proximity to health-care services could enable this group to maintain mobility and independence as they age. Local accessibility is also important for urban drivers, who value being near shops and services. With increased accessibility, this group could see its already high share of non-work active transport trips increase.
Future Research
This analysis provides insight into the factors that influence light truck ownership and use, and, through a factor and cluster analysis, we were able to determine how different households make vehicle decisions and define strategies to attempt to reduce the number of light trucks and SUVs on Canadian streets.
Future research on this topic could isolate the factor-cluster analysis to only variables that reflect attitudes and preferences before running a regression model to analyze the effects of land use changes on the use and ownership of light trucks by group. Changes in vehicle choice, travel attitudes, and behavior in a post-pandemic world would also be important to analyze.
Footnotes
Author Contributions
The authors confirm contribution to the paper as follows: study conception and design: S. Hickson, J. DeWeese, K. Manaugh, A. El-Geneidy; data collection: S.Hickson, J. DeWeese, K. Manaugh, A. El-Geneidy; analysis and interpretation of results: S. Hickson, M. Badami, J. DeWeese, K. Manaugh, A. El-Geneidy; draft manuscript preparation: S. Hickson, J. Badami, K. Manaugh, A. El-Geneidy. All authors reviewed the results and approved the final version of the manuscript.
Declaration of Conflicting Interests
The author(s) declared no potential conflicts of interest with respect to the research, authorship, and/or publication of this article.
Funding
The author(s) disclosed receipt of the following financial support for the research, authorship, and/or publication of this article: This research was funded by The Natural Sciences and Engineering Research Council of Canada (Project number: NSERC RGPIN-2018-04501).