
Abstract
Over past the several decades, most transportation organizations have gathered a large amount of data through travel surveys. The data they provide is typically used as the basis of their transportation planning and modeling processes. In the province of Quebec, regional household travel surveys take place every 5 to 10 years in the main regions. Conducting large-scale surveys more frequently is not always possible, especially for less populous areas. Relying on old data is, however, becoming increasingly problematic. In this context, it is interesting to explore methods to value historical travel surveys in innovative ways. Based on two travel surveys from the city of Sherbrooke in Quebec, a large-scale regional survey from 2012 and a smaller ad-hoc travel survey from 2019, this paper proposes a methodology for combining the two survey samples. The objective of this process is to benefit from the advantages of both samples: (i) up-to-date travel behaviors from the 2019 survey and (ii) a large and controlled sample size from the 2012 survey. The integration process relies on proportional iterative updating. The descriptive analysis of the two surveys confirmed significant changes in travel behaviors and population had occurred between 2012 and 2019. Despite these differences, the results obtained with the combined samples allow us to reproduce faithfully the trip behaviors and populations of 2019. The proposed method therefore confirms a strong potential to gain better value from historical travel survey data using innovative data combination approaches.
Keywords
Collecting travel behavior data has become increasingly difficult over time. Travel surveys across the world are facing issues such as reduced response rates or lack of representativeness. In addition, the post-survey processing tasks are becoming increasingly complex with higher non-response or the use of multi-frame sampling and multi-modes to collect data. Despite the availability of a variety of datasets from different sources (smartphone, GPS, smart card, etc.), travel surveys still provide data that are not available elsewhere and that are key for transportation planning.
Over the years, most transportation organizations have gathered large amounts of data through surveys. However, little use is made of this historical data once more recent data has been collected, when possible, or because of their decaying relevance over time. When surveys are conducted recurrently, data from the previous survey is mainly used to track key mobility indicators and trends in travel behavior. However, ageing datasets may offer additional usages. When the recurrence is low because of lack of resources (human, financial), data become less representative with time. Can they still partially represent up-to-date travel behaviors? Is there a way to rejuvenate large-scale surveys to make then usable over a longer period?
In the province of Quebec, Canada, most transportation surveys take place every 5 to 10 years depending on the size of the regions. However, trip behavior is changing ever more rapidly, and one may question the relevance and validity of the data after 5 to 10 years. This paper uses the city of Sherbrooke, Quebec, as a case study. In this region, the last regional survey was conducted in 2012 by the provincial ministry of transportation and the next one has not yet been announced. Relying on data from 2012 to plan transportation infrastructure and services has therefore become increasingly problematic. First, the population has increased and aged since 2012. The demographic changes have significant impacts on the number of trips and their spatial-temporal distribution. Features of trips have probably changed as well as mode choice, distribution of trip ends, and share of the various trip purposes. Finally, there have been additions to transportation infrastructure and significant changes to the transit network.
The transit organization in Sherbrooke, being fully aware of these issues, conducted a travel survey in 2019. While imitating the methodology of the 2012 regional survey, the 2019 survey was conducted with limited resources, covered a smaller area and reached a sample five times smaller than the 2012 regional survey. This new survey had some weaknesses, namely the size of the available sample, that led to challenges for expansion and large weighting factors. Unfortunately, these issues limited the possibility to use the 2019 data for planning purposes. Still, this survey confirmed significant changes in the mobility behavior of Sherbrooke’s population.
In this context, it is interesting to develop ways to value historical or ageing travel surveys in innovative ways. In the Sherbrooke context, the question translates into how to combine two surveys to create a usable and up-to-date dataset on travel behaviors. In this perspective, the main objective of this research is to develop a methodology for combining the two survey samples to benefit from the advantages of both: (i) up-to-date travel behaviors from the 2019 survey and (ii) a large and representative sample from the 2012 survey. This methodology should also ensure that the reference population of 2019 is reproduced. This study therefore aims to propose a methodology to combine in a coherent way the samples of these two surveys from two different time periods to represent the observed travel behaviors of the population.
This paper first proposes some background elements with respect to issues faced by household travel surveys. In addition, some experiments on data combination conducted by researchers will also be discussed. The datasets required for our study are then detailed, including a summary and comparative descriptive analysis of the two considered surveys. The methodology developed in this study for combining and weighting the merged sample is then detailed. Results showing the effectiveness of the developed method are then presented, namely the reconstruction of the reference populations and the key travel indicators. A conclusion, limitations and perspectives follow.
Background
Despite an increase in the amount and diversity of transport data available, travel surveys remain relevant and are still a key component of the data bouquet in a region ( 1 – 3 ). However, these surveys face several issues that have become increasingly important in recent decades ( 4 ). Issues are, for instance: recruitment difficulties ( 5 ), increasing complexity of data processing when using multi-frame sampling ( 6 , 7 ) or combining multiple survey modes ( 3 , 8 ), difficulty of obtaining a representative sample in relation to the target population ( 3 ), growing importance of data confidentiality privacy intrusion concerns ( 9 , 10 ), and burden on respondents ( 1 , 11 ). Stopher and Greaves ( 4 ) also mention the importance of the quality of the information collected and discuss methods by which good quality information can be collected. In addition, this type of data collection requires a large investment of resources (financial, human) and time ( 1 , 2 , 12 )
These issues make it harder to increase the frequency of travel surveys even though it would be highly preferable to correctly monitor changes in behaviors. The frequency of travel surveys varies from region to region, but they are usually infrequent ( 2 ). They are often designed as cross-section surveys that take place every 5 to 10 years ( 4 ). This is the case in North America. The U.S. National Household Travel Survey (NHTS) is conducted approximately every 8 years ( 13 ), the Transportation Tomorrow Survey in Toronto every 5 years ( 14 ), the Origin-Destination (OD) survey in Montreal every 5 years ( 15 ), and the California Household Travel Survey every 10 years ( 16 ). This type of cross-section survey is also at risk of being conducted in periods with specificities such as an economic crisis, a transit strike, and so forth. Despite the importance of these surveys and the increasing difficulty of collecting good quality data on travel behaviors, historical data are typically undervalued. There are few papers specifically on this subject. It is commonly agreed, though, that historical data are primarily used to establish and understand trends and to feed travel demand forecasting models.
Several researchers are trying to improve the quality of transport surveys data by merging them with other data sets. In transportation, the term data fusion is used to explain several operation types. Venigalla ( 5 ) defines fusion as the process in which “two or more databases are integrated so as to obtain necessary parameters or a single database.” According to Bayart et al. ( 3 ), data fusion, data integration, or statistical matching aims to increase the amount of information of one source using information from other sources. In fact, data fusion methods can be used to combine information from multiple data sources, to add missing information, or to combine samples from multi-frame sampling and/or multiple survey modes. Usually, the data sources to be combined come from a similar time period.
Several researchers are therefore trying to answer the issues raised previously by proposing ways to combine surveys and data from other sources. Technologies offer new opportunities to collect data and may increase response rates ( 17 ). Verreault and Morency ( 6 ) combined the samples of a phone survey targeting the entire population and a web survey targeting university students with the aim of increasing the survey coverage and quality. Bwambale et al. ( 2 ) presented a framework for combining disaggregated transport survey data and mobile phone data to improve data accuracy in trip generation models. Grapperon et al. ( 18 ) proposed a data fusion approach to combine transit data from smart cards and information from a transport survey in Montreal. Wang et al. ( 19 ) proposes a data fusion approach to combine two surveys, one of which is targeting specific population subgroups, to improve the quality of the main survey. This method was mainly aimed at correcting the proxy respondent bias of certain subgroups of the population. Survey data can also be used to complement other data sets. For example, Hossain and Habib ( 20 ) propose a fusion methodology to impute the activity purpose of a ride-hailing service from several data sources including a travel survey. Several other examples exist in the literature including some more experimental works such as those using data from social media ( 21 ).
In all cases, the objective of these works is to increase the information available and improve the quality of the data collected. Stopher and Greaves ( 4 ) mention that it is important to take advantage of several data sources because it make it possible to reduce, among other things, the resources required and to maximize the usable information.
Data
The main data sets used in this study include the reference or target population data as well as the two household surveys that are to be combined. The next section provides details of these datasets. The study area corresponds to Sherbrooke City, which had a population of 168,762 people in 2019 and an area of 367 km2.
Target Population
Target population data are important for this study because the objective is to combine two samples that are 7 years apart. Between 2012 and 2019, the population of the city of Sherbrooke increased by 7.8%. In addition to population increase, the demographic composition also changed over those years. Figure 1 shows the distributions of people for 2012 and 2019. These data come from the Institut de la statistique du Québec (ISQ). This figure mainly illustrates a population ageing trend and therefore, an increase in the population aged 65 years and over, from 16.4% in 2012 to 19.9% in 2019. An increase in people under the age of 10 is also observed over the same period of time.
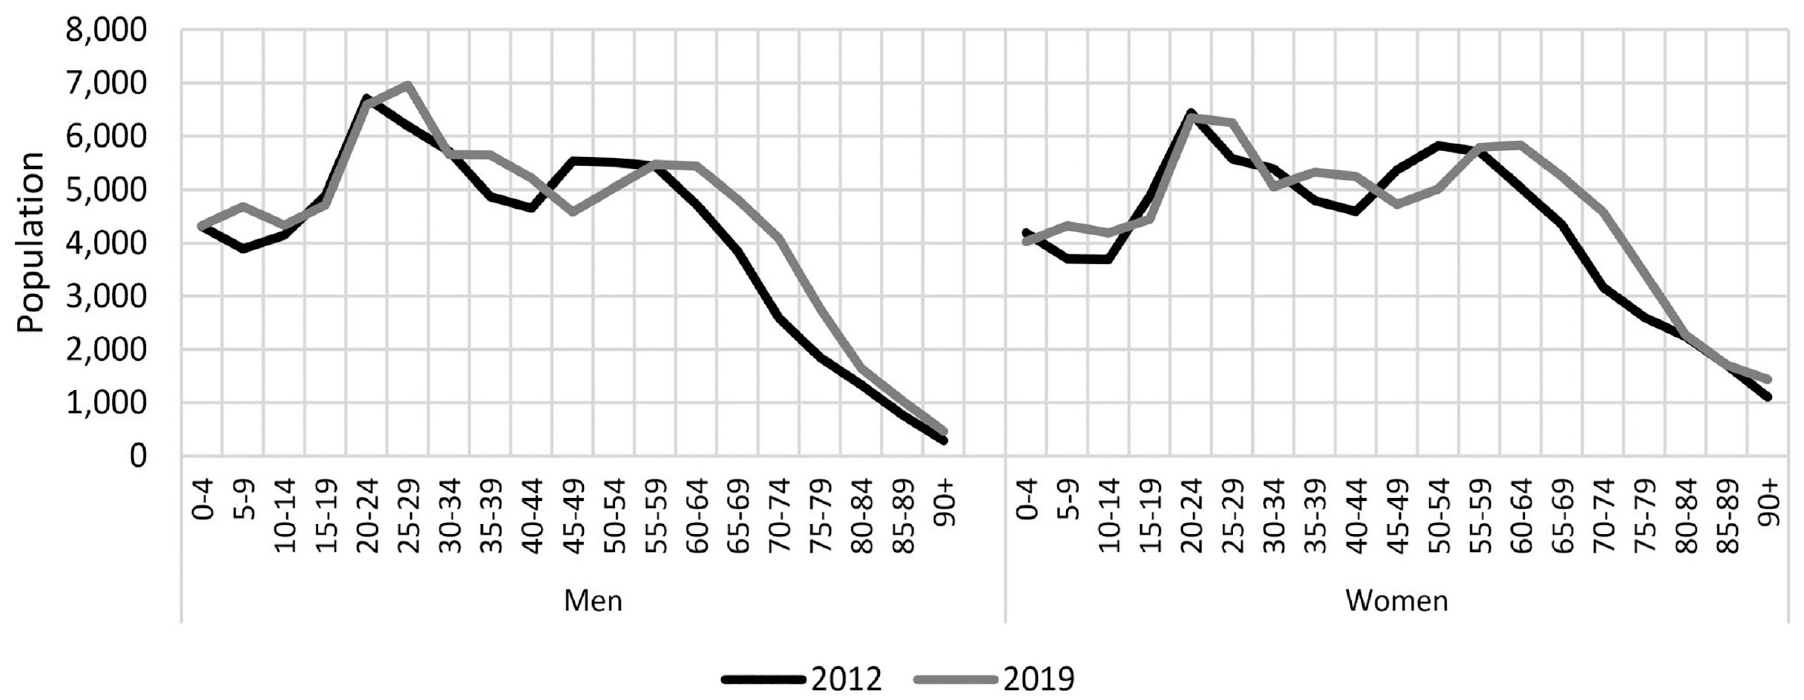
Population of study area by age and gender in 2012 and 2019.
2012 Sherbrooke Regional Household Travel Survey
The Quebec ministry of transportation conducts surveys in the various urban regions of the province every 5 to 10 years. The sampling rates of these surveys depend on the region and usually vary between 4% and 12%. The most recent household travel survey conducted in the Sherbrooke region was in 2012. Up to now, four surveys have been conducted in the Sherbrooke region at intervals of about 10 years. However, the next survey has not yet been announced. These surveys mainly allow organizations to plan their transportation networks and determine the most promising mobility strategies. The 2012 survey area includes the entire Sherbrooke region. However, this research solely focuses on the city of Sherbrooke since the 2019 survey was limited to this area.
The 2012 survey is mainly a CATI (computer assisted telephone interview) survey where the sample was contacted by landlines. A small part of the sample was also collected by CAWI (web assisted telephone interview) where university students in the region who did not have a landline were targeted. This recruitment was done via emails. These two samples were then combined to better represent the target population ( 6 ).
The questionnaire focused on household characteristics, including place of residence, household size, car ownership and income, the characteristics of household members including age, gender, main occupation, and possession of a driver’s license, as well as the characteristics of trips made on the day before the interview (single-day trip diary). Trip characteristics include transportation mode, activity purpose, origin and destination, and time of departure. Only the trips of people aged 5 years and older were gathered. Within Sherbrooke City, 7,827 households were sampled for an average sampling rate of 11.2%.
2019 Sherbrooke City Household Travel Survey
The 2019 household travel survey, which was conducted by the Sherbrooke transit company, is the second survey used in this study. This survey was conducted in the fall of 2019. The transit company decided to conduct this survey to obtain a more recent description of travel behaviors. They were also interested in seeing the impacts of new infrastructure and recent changes in transit configuration and level of service. Unlike the 2012 regional survey, the area covered by the survey solely includes just the Sherbrooke municipality.
It is a CATI survey whose respondents were contacted by landline. The questionnaire and survey methodology were similar to those of the 2012 survey. The questionnaire included questions on the household and people belonging to the households as well as their daily trips. However, only trips of people aged 10 years and older were collected. The number of households sampled was 1,512 while the average sampling rate was 2.1%. The survey was initially weighted on the population of the 2016 Canadian Census. However, these factors have been updated based on the population provided by the ISQ for 2019.
Comparative Descriptive Analysis of Travel Surveys
When analyzing data from both surveys, results confirm that the main trip indicators have evolved. These changes can be related to three phenomena. First, as mentioned earlier, demographic changes between the two survey reference years contribute to changes in trip behavior. Second, changes in travel behavior (trip rates, modal shares, origin–destination, etc.) also contribute to behavioral changes. The third aspect that may contribute to the differences observed between the two data sets is the methodological differences between the two surveys. Although the methodology used is similar, some biases could be observed arising from the inexperience of the transit company and its subcontractor in conducting travel surveys and constructing a representative sample of the target population. It is difficult to assess the impact of methodological components on the differences in travel behaviors observed between the two datasets. Since the objective of this research is to test a data fusion methodology and assess its effectiveness, this aspect is not crucial.
Figure 2 illustrates the sampling rates and the people sampled for both surveys by age and gender. The combined sample that will be used in the proposed methodology will therefore have a sampling rate of 13.3% for 10 years and older. Rates by age and gender are similar between the two surveys. For both surveys, people between the ages of 30 and 49 are under-sampled. Nevertheless, people aged 65 and over are over-sampled in the 2019 survey.
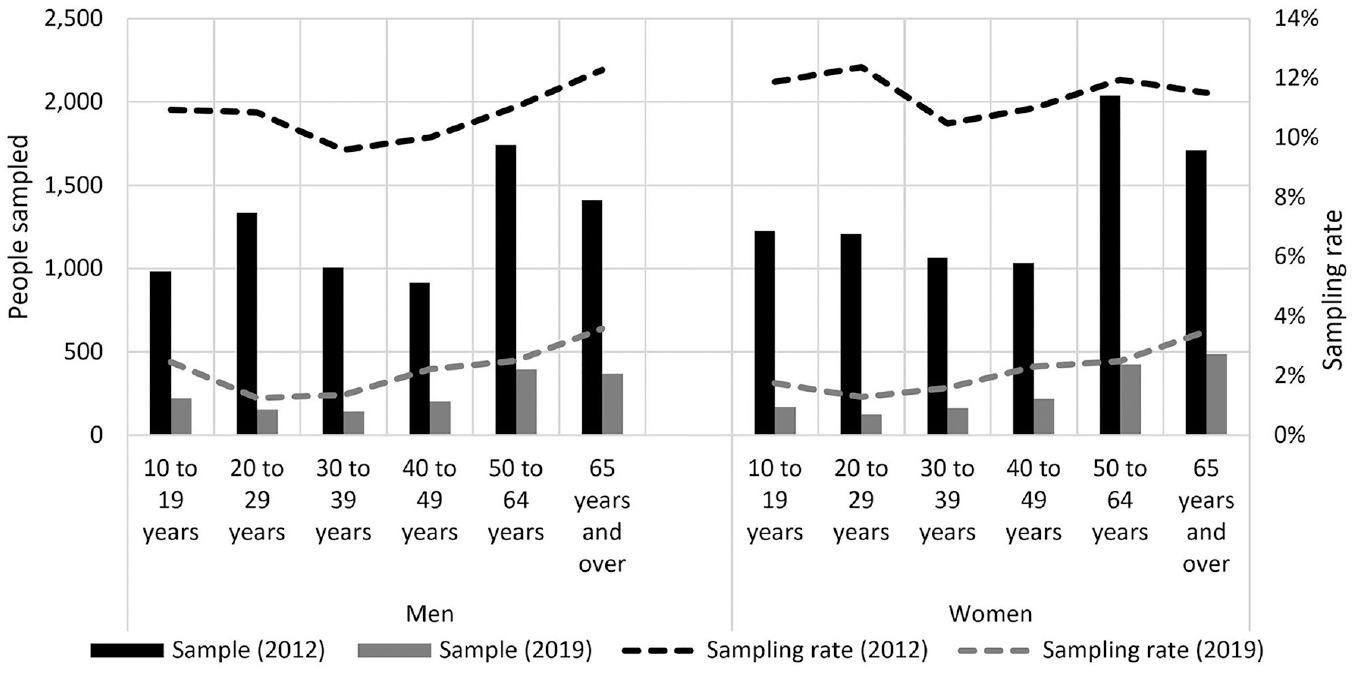
Comparison of sampling rate by gender and age between the 2012 and the 2019 surveys.
The next section focuses on comparing the two data sets to understand the contribution of demographic and behavioral changes when comparing the two surveys. It should be noted that the comparison focuses on people aged 10 and over as only this population was surveyed in the 2019 survey.
The differences in observed trip behaviors between the two surveys can be explained mostly with the proportion of people who reported no trip and by differences in trip rates. Figure 3 illustrates the comparison of the percentage of the population who reported no trip in the two surveys. The indicators presented rely on the initial weighting factors of the surveys, as provided by those who conducted the surveys. In general, the percentage of immobile people decreased between 2012 and 2019, for both men and women. This percentage decreased from 14.7% to 13.9% for men and from 19.4% to 19.2% for women. However, this finding is not observed for all age groups. Immobile rate seems to have decreased greatly for people over 50 years old. The 40–49 years age group is the only cohort where the immobility rate increased.
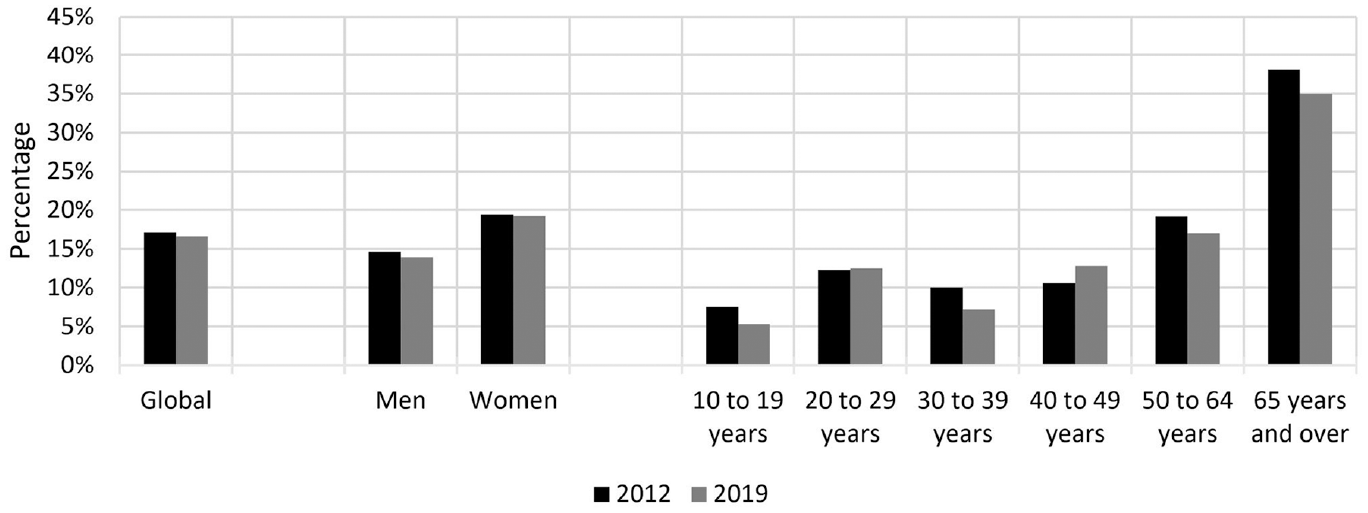
Comparison of the share of people who declared no trips during the day in 2012 and 2019.
Figure 4 then illustrates trip rates per mobile person in 2012 and 2019 by gender and age group. For all categories, trip rates decreased significantly between 2012 and 2019 according to both surveys when considering only those who reported at least one trip.
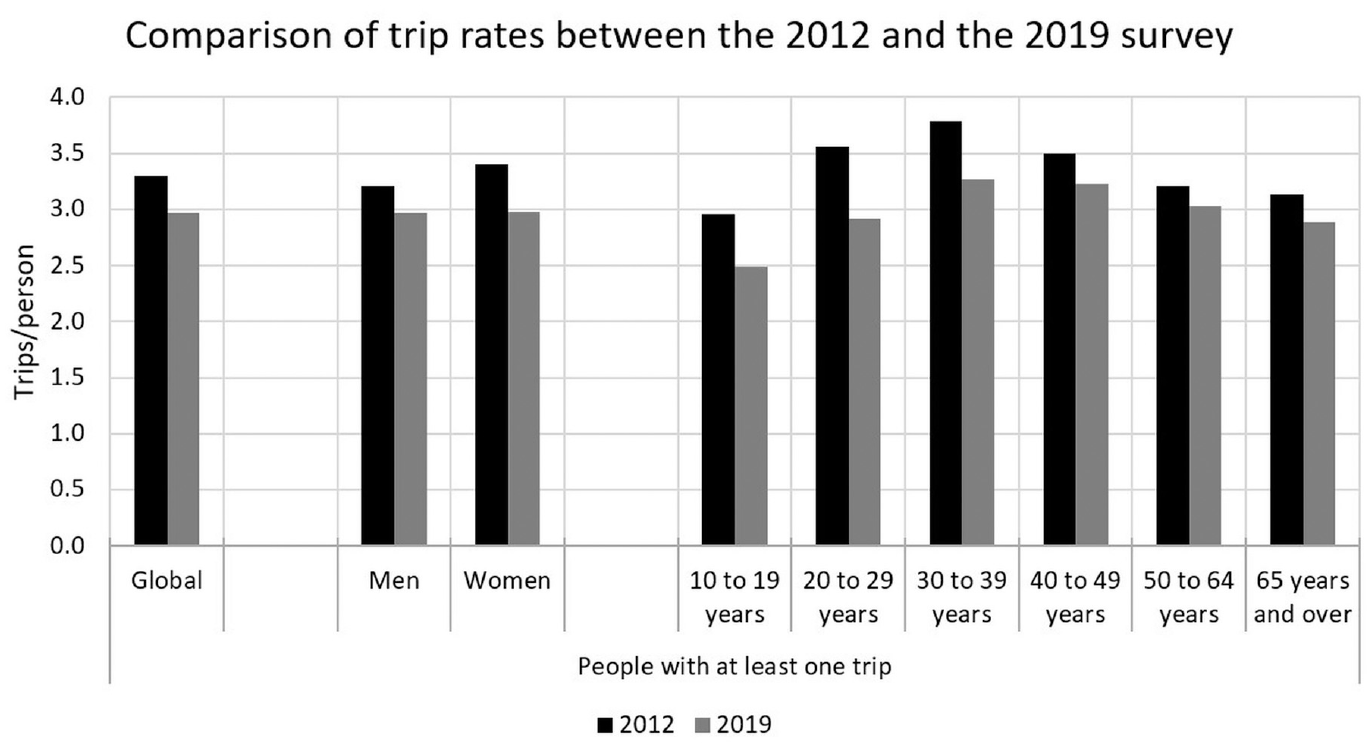
Comparison of trip rates in 2012 and 2019 surveys.
There are therefore significant differences observed in the trip indicators between the two surveys. As mentioned earlier, these differences are related to demographic changes and changes in the trip behaviors. The proposed methodology should ensure that the combined samples recreate the trip indicators observed in the 2019 survey.
Methodology
The general methodology presented consists of combining the samples of the two surveys by modifying the weights of the observations. The specific objectives of this methodology are:
Generate a single database with a larger sample of people and trips;
Balance the respective influence of both samples by decreasing the size of the weighting factors of the 2019 sample;
Be representative of the population of Sherbrooke in 2019 provided by the ISQ and mobility provided by the 2019 survey.
The combined sample must then be completely reweighted to be usable. However, in addition to the usual constraints on population totals, some constraints aimed at reproducing the 2019 travel behaviors must be added. The selected weighting method must therefore be able to incorporate these types of constraints. The proposed methodology involves several steps:
Combine the two survey samples.
Prepare constraints to weight the combined sample: a. Constraints based on 2019 demographics. b. Constraints based on immobility rates in 2019. c. Constraints based on observed trips in 2019.
Weight samples while respecting these constraints.
This methodology is therefore based on three main steps. First, the samples from the two surveys need to be combined and standardized to obtain a single person and trip file. The second step is to create several constraints to weight the sample. These constraints are segmented into three types: those concerning population demography, those concerning immobility rates, and those concerning trips. Respectively, these three sets of constraints are based on the 2019 population estimates from ISQ and on the trips of the 2019 survey. Finally, the weighting method used is based on iterative proportional updating (IPU). It allows the sample to be weighted according to several constraints concerning both demography and trips. Figure 5 illustrates the general methodology used.
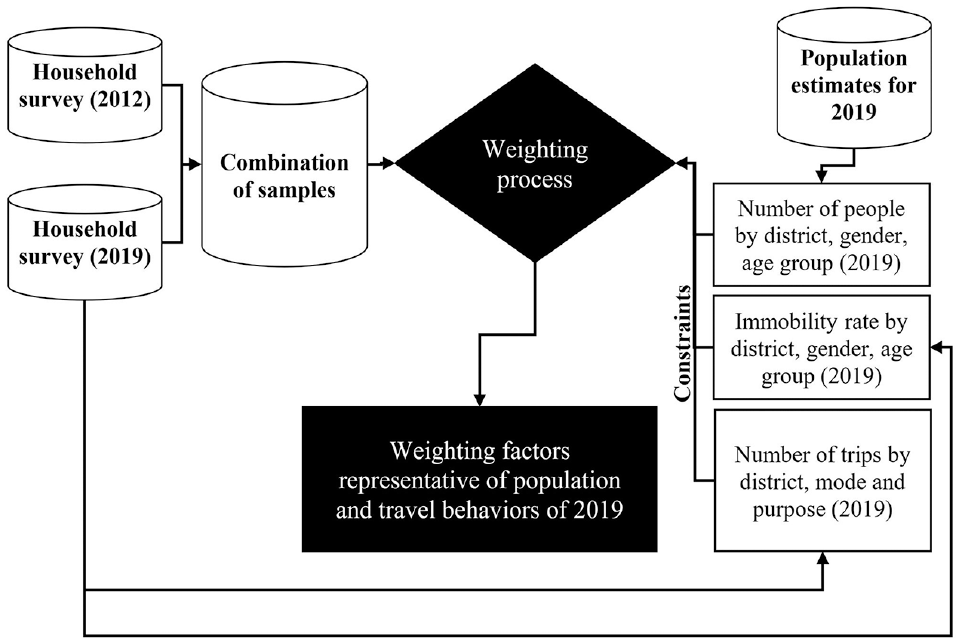
Steps of the proposed methodology.
Combining Samples
Samples from the two surveys must be combined to represent a single set of data. It should be noted that only people aged 10 years and over are selected in the final file. Finally, the file includes a sample of 20,534 people and 49,011 trips. Records from the 2012 survey represent 85.2% of the sampled people and 84.9% of the sampled trips respectively, while those from the 2019 survey represent 14.8% and 15.1% of the records respectively.
Weighting Process
The method used to expand the sample is based on the IPU ( 22 ). This method allows multiple constraints based on two dependent objects to be considered simultaneously. The objective is to match both object distributions as closely as possible. Usually, this method is used to produce a series of weighting factors that reconstruct both household and people reference populations, while preserving the links between the household and its members. As part of this study, the IPU method is used in an innovative way to reproduce the reference number of people and trips of 2019.
The constraints to be used in the method relate to the two objects, namely people and trips. At the end of the algorithm, a weighting factor is obtained for each person of the sample. The trip reference frame and other constraints mentioned above should be, theoretically, met using this factor. In practice, these constraints are not completely satisfied depending on the various parameters used in the algorithm and the composition of the available sample. A final adjustment is therefore necessary to perfectly fit the reference populations of the census and/or other sources. This adjustment recreates sets of weighting factors that apply to both individuals and trip.
Using the algorithm requires setting the adjustment function. Our goal is to obtain a realistic and usable solution afterwards. It is thus important to make thoughtful choices and to evaluate the impacts of these choices on the results. The main parameter that has been studied is the minimum and maximum weight that can be assigned to an individual. In this study, the maximum factor is set to 2.5 times the average factor while the minimum is set to 0.5 times the average factor. The average factor is the inverse of the estimated sampling rate with the two samples combined. Limiting the amplitude and scale of weighting factors facilitates the use of data for a diversity of usages without the risk of emphasizing particular behaviors. Still, the value set remain arbitrary choices that would need to be adjusted in other contexts. Of course, less restrictive limits would help to have more precise adjustments in the reconstitution of trips and population. However, the variability of the weighting factor size created would be greater. Without constraints, the method could even produce weights of zero for some observations. Nevertheless, since an objective of the methodology was to increase the available sample size, a constraint was added to have a minimum factor size.
Another important parameter is the possibility of prioritizing constraints related to one of the two objects. In our case, the trip constraints were prioritized. This choice was made because it is easier to make a final adjustment on the number of people following the first results obtained.
Constraints
The IPU method allows us to estimate a weighting factor for each person to satisfy constraints on the totals of people and trips. Nevertheless, this method does not always satisfy all the constraints. The probability of obtaining a perfect solution depends on the number and type of constraints as well as on the quality of the sample. Also, it is necessary to ensure that there is at least one observation in each of the classes of constraints, although there are methods to overcome this issue ( 23 ). As part of this study, the constraints were applied at the district scale (six in total). These were used as a spatial stratum because they are usually used as planning areas. In addition, sampling rates ranged from 1.9% to 4.5% depending on the district in the 2019 survey.
The constraints are therefore segmented according to the two objects to be reconstructed, namely individuals and trips. Constraints on individuals are based on age and gender while trip constraints are based on mode and trip purpose.
Sociodemographic constraints: Total number of people Number of people by gender (men and women) Rate of immobile people per age group (10–19, 20–29, 30–39, 40–49 50–64, and 65 and over) Number of people by age group (10–19, 20–29, 30–39, 40–49 50–64, and 65 and over)
Trip constraints: Total number Trips according: • to mode: (car driver, car passenger, transit, walk or bike) • to activity purpose: (work, study, leisure, shopping, return to home, other)
It would also be possible to apply cross-constraints on an object. Although such constraints allow the correction of several biases at the same time, they make the algorithm convergence more complex and increase the computation time. In addition, this type of constraint often leads to problems of missing values in the sample for a subgroup. For all these issues that appeared in our tests, we decided not to include this type of constraint in our final methodology. However, it would be interesting to pursue further work studying whether it is more interesting to add this type of constraint and reduce or increase the number of spatial strata.
Final Adjustments
As mentioned before, the IPU method does not allow perfect reconstruction of the population by gender and age groups. A second adjustment is therefore made to ensure that the populations of these groups are perfectly reconstructed. Of course, it will affect the quality of the fitting of the trip distribution. Therefore, this second adjustment also allows us to fit the reference population using more groups than in the previous step. Categories from the ISQ population data, that is, populations by cohorts of 5 years and by gender, are then used for further adjustment. As a result, weighting factors to perfectly reconstruct the 2019 reference population are created. Depending on the constraints used in the IPU, this adjustment may or may not be significant. The adjustment factors are obtained with Equation 1.
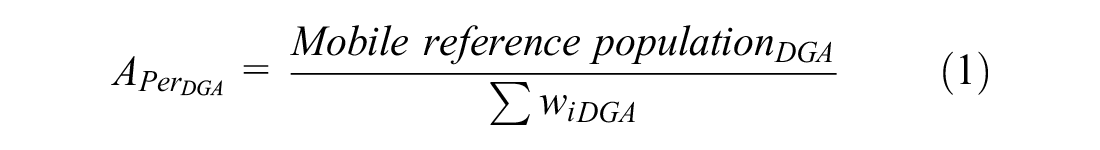
where D is the district, G is the gender, and A is the 5-year cohort.
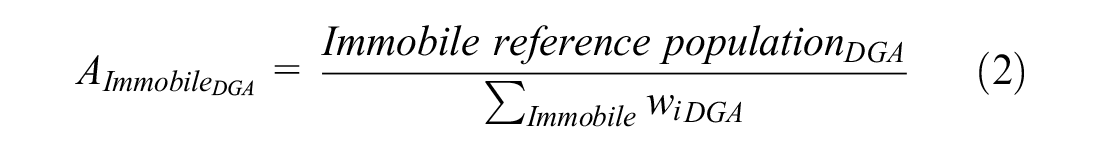
The final weighting factor is obtained by multiplying this adjustment factor with the factor obtained using the IPU method. It should be noted that the weighting factors derived from the IPU method in our methodology can only reconstruct the mobile population. Weighting factors for immobile people must therefore be estimated later to reconstruct the total population of 2019. The adjustment factor used for this subset is calculated using Equation 2.
It would also be possible to apply an additional adjustment to the trip object. However, since the reference data for population were considered more reliable than the data for trips, it was decided to solely make this adjustment for people.
Results
The primary objective of the methodology was to reconstruct the population and travel behaviors of 2019 using both survey samples. In this context, Table 1 presents the results of population and trip reconstruction following the estimation of the weighting factors (before and after the final adjustments) applicable to the combined sample. The results in the table represent the differences between the reference population (R) and the population reconstructed by the combined sample (C).
Differences in Reproduction of Population and Trips Before and After the Application of the Final Adjustment
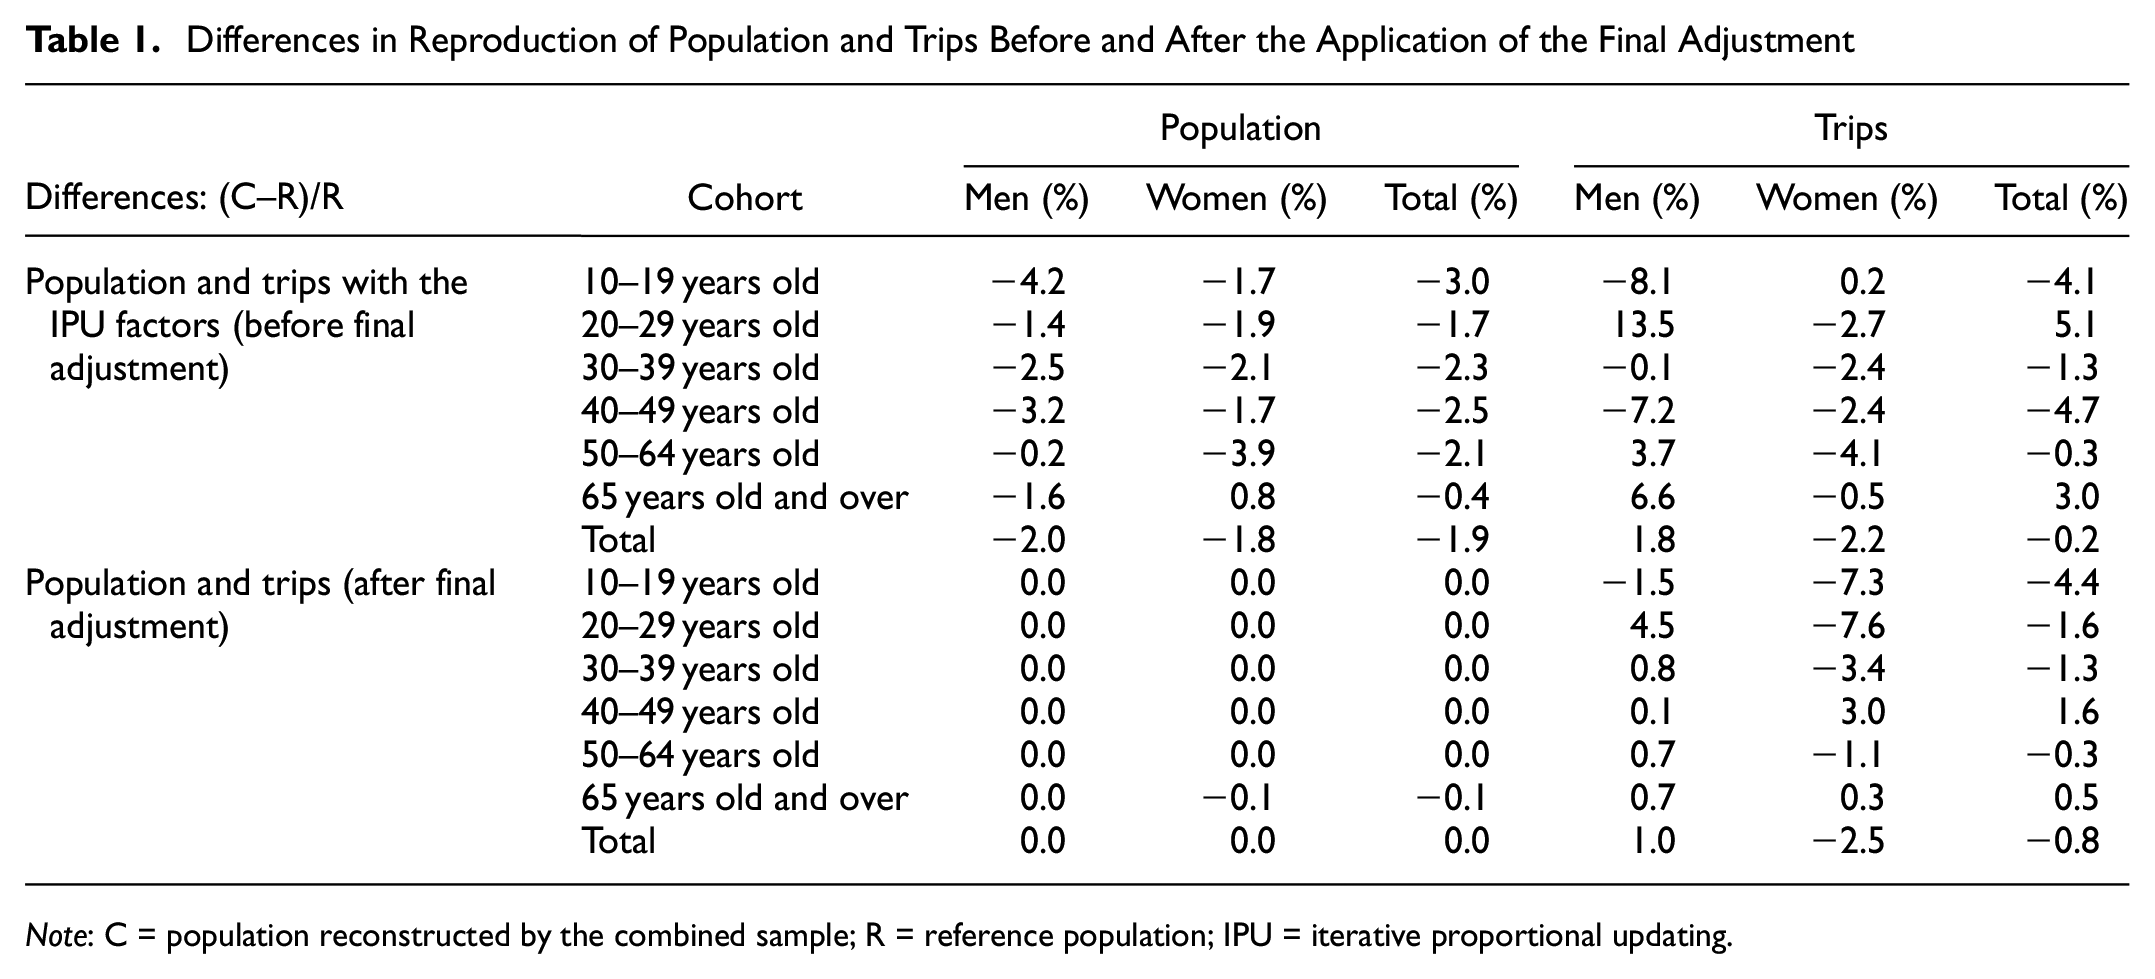
Note: C = population reconstructed by the combined sample; R = reference population; IPU = iterative proportional updating.
First, the analysis will focus on results before final adjustment factors are applied (top part of Table 1). As mentioned before, despite the use of constraints, the method is not able to perfectly reconstruct these two populations, namely people and trips. Not using age group constraints for trips leads to greater variability in these groups, specifically for men. More specifically, there is a significant gap for trips generated by men aged 20 to 29 (−13.5%). However, the overall gap in trips is smaller than that of the population, as was expected. For population, the method overestimates the number of people compared with the reference value. However, this overestimation allows us to provide a more similar trip distribution and to give better consideration to the differences in trip rates (see Figure 4) between the two samples. It should be noted that the differences observed are mainly related to one of the six districts where the method has issues with regard to the constraints. The non-uniform sampling of the population in 2019 in this sector partly explains this issue.
After applying the final adjustments in relation to the population, as expected, the distribution of the number of people is perfectly similar to that of the reference population. The only difference observed, −0.1% for 65 years and older, is related to rounding errors. However, differences larger than in Table 1 are observed for the distribution of trips. Overall, the trips estimated by the weighting factors are overestimated by 0.8% compared with the reference value. The variability of the estimated gaps is greater for women than men. It is for women aged 10 to 29 that the gaps are the highest for trips. It should be noted that this last adjustment applied to people can reduce the variability observed on the distributions of trips by men. This demonstrates that the categories of people used in the constraints probably had significant intra-class variability. The addition of cross-constraints on the number of trips by gender and cohort would likely also have improved the results.
Table 1 showed that the method was successful in rebuilding the populations of 2019 but failed to reconstruct the 2019 trips perfectly after the final adjustment. However, this problem is mainly caused by the results of a single district. Nevertheless, it is still interesting to look at the impact of these results on certain trip indicators and on the distribution of weighting factors. It is also interesting to study the effectiveness of the method in reproducing the travel behaviors of 2019 (as estimated by the 2019 survey).
It should be noted that one of the objectives was to increase the sample size compared with that of the 2019 survey to obtain smaller weighting factors and more diversity in observed trips. Since the combined survey has a larger sample, the average weighting factors are therefore smaller than their equivalent for each survey taken independently. For the updated sample of the 2019 survey, the average factor decreases from 49.3 to 16.6 following the process. For the updated 2012 OD survey sample, the average factor decreases from 9.7 to 6.7. After the combination and weighting process, the share of each sample in the combined dataset is 66.1% for the 2012 survey sample and 33.9% for the 2019 one while they were respectively 84.2% and 15.8% with the initial samples. In the combined sample, the weight of the 2019 survey has therefore increased in importance compared with that of the 2012 survey, which can better account for trip behaviors of 2019. Amplitude of the weighting factors is also decreasing, as shown in Figure 6.
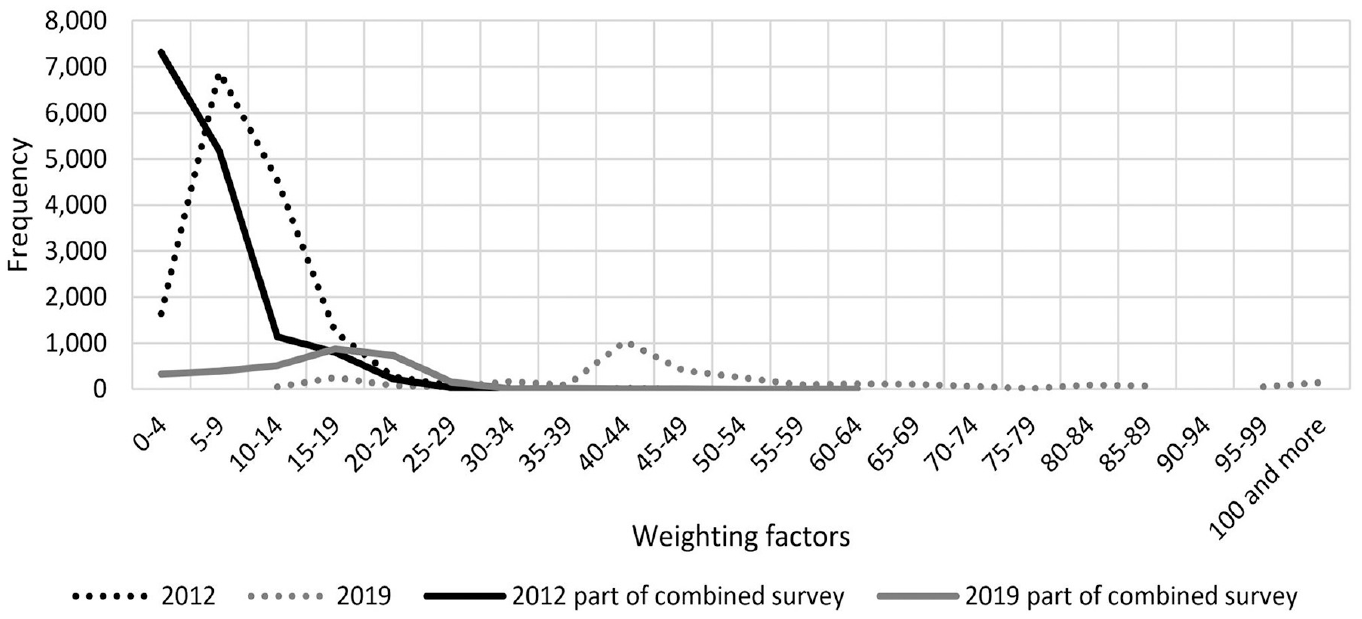
Distributions of weighting factors for the two independent surveys and combined survey.
The third objective of this study was to replicate the travel behaviors of 2019 with the combined sample. As mentioned earlier, the method does not perfectly reproduce the number of trips according to gender and cohorts, particularly for women. However, for some indicators, namely modal and activity purpose shares, the results are similar to those observed using the 2019 survey. Table 2 compares the distributions of trips by mode and activity purpose between the combined survey (C) and the 2019 survey (R).
Comparison of the Modal Share and the Activity Purpose Share Between the Combined Survey and the 2019 Survey Used as a Reference
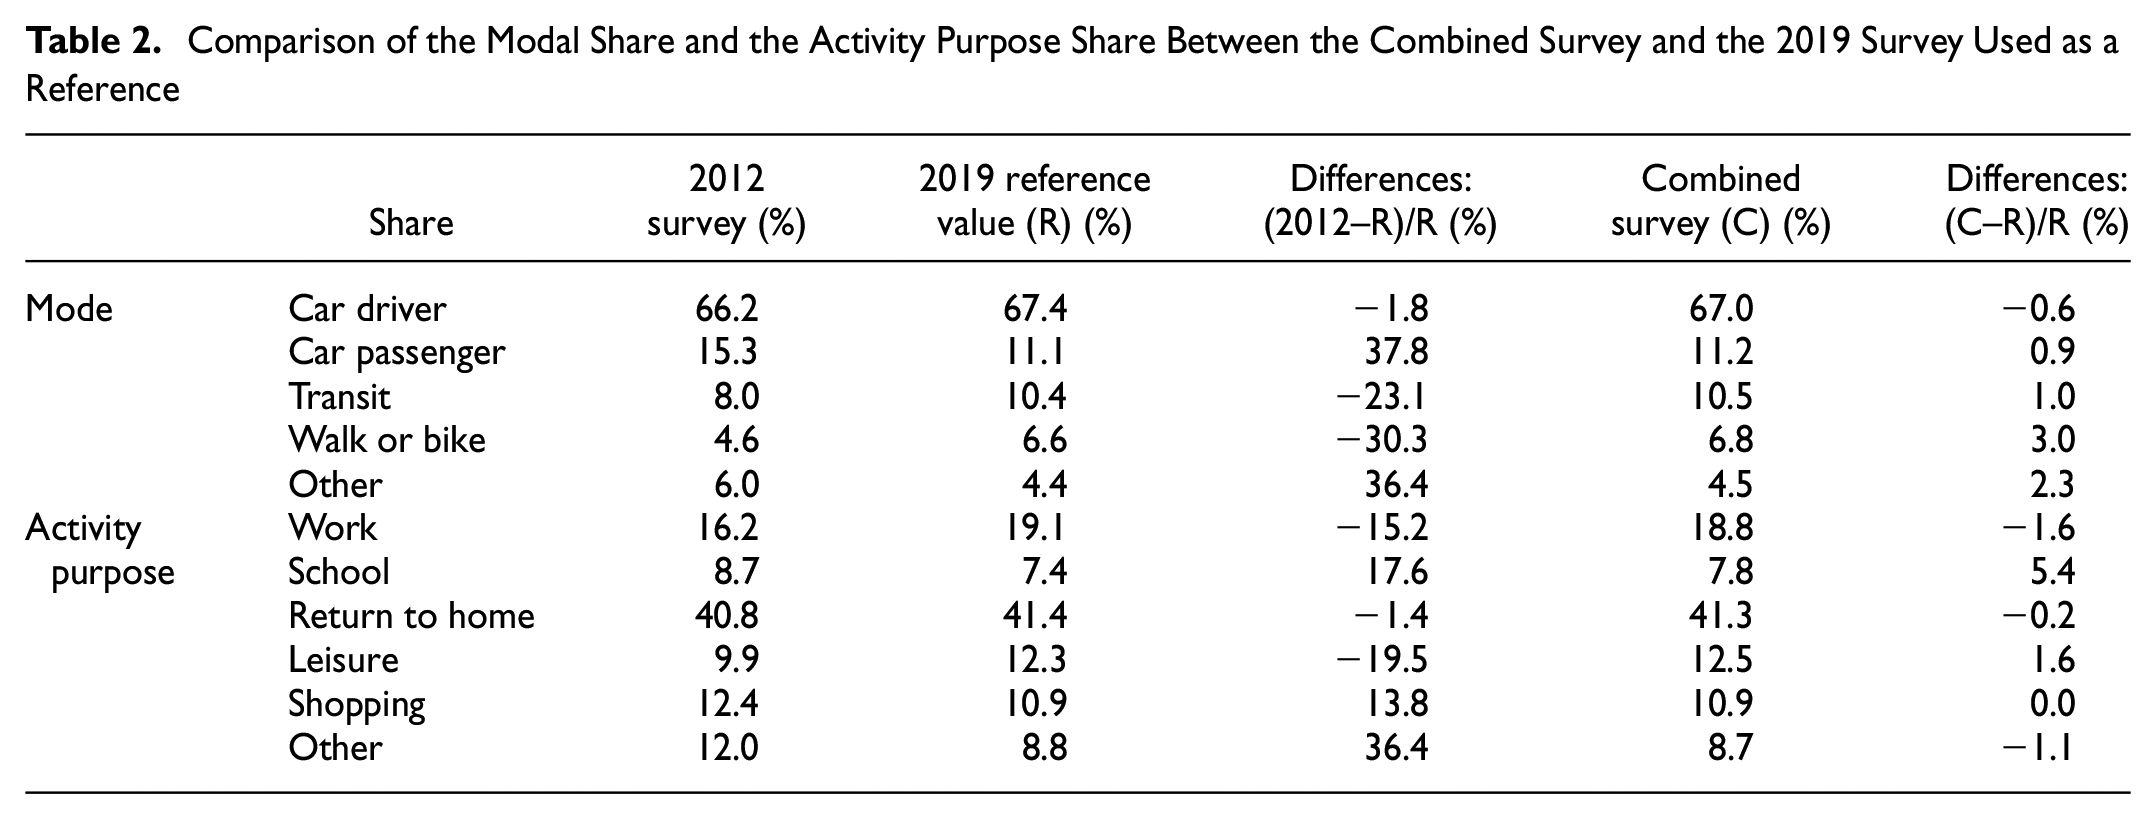
First, by comparing the distributions obtained using the combined survey and the 2019 survey (considered as the reference for travel behaviors), it is observed that the method has managed to get closer to the reference distribution. The maximum deviations obtained for a mode or a trip purpose are 0.4%. However, these differences are observed respectively for the car driver mode and the work activity, which remain the subsets with most of the trips generated.
Results of Table 2 reveal the effectiveness of the method proposed in this study. Indeed, when we compare the results for the combined survey with those obtained by considering only the sample of the 2012 survey, we see that the method has largely succeeded in filling in the gaps observed between the 2012 and 2019 surveys. For example, the gap between the 2012 survey and the 2019 survey (reference value) for car driver trips was +37.8% while it is only +0.9% with the combined survey. This demonstrates that the method has been effective at replicating these indicators despite the significant differences between the 2012 and 2019 surveys.
There is, however, a link to be made with the trip constraints used in the method which were based on total trips by mode and trip purposes. Since trips by modes and by purposes are included in the constraints, it is expected that these indicators would be strongly corrected. It also demonstrates that the addition of certain trip constraints could improve the method’s effectiveness.
The objective is therefore not to outperform the results of the most recent survey, but to increase the sample size, the number of observed trips, and the variability of observed behaviors and thus to add value to historical data collected. However, other positive impacts may emerge from the sample fusion. For example, the number of transit trips sampled in the 2019 survey file was 384 while it increased to 2,996 trips in the combined file. This increases sampling variability, especially for hard-to-reach groups.
Conclusion
This study presented a methodology to allow the fusion of samples from two surveys from two different time periods. It was applied to the city of Sherbrooke with the aim of reproducing the population and travel behaviors of 2019. From a practical point of view, it also aimed to increase the number of people and trips in the combined sample and, consequently, to reduce the size of the weighting factors obtained. Finally, the methodology aimed to use historical data in innovative ways while they are usually undervalued.
The methodology developed is based on a step process that allows the combination of samples from two surveys in a coherent way and to weight this combined sample. The weighting method is mainly based on IPU which can use constraints based on two objects simultaneously. While some constraints based on people and trips were used in this study, other constraints or types of constraints could be included as well. In fact, the type of constraints to consider depends on several aspects including the size of the available samples, the biases observed in the surveys, and the key indicators to be estimated with the data. Although the constraints that were used in this study were directly outputted from the surveys themselves, it is also possible to add constraints from external sources, such as the number of cars owned by the population or the number of people owning a driving license. The question of the representativeness of the most recent survey is therefore not mandatory although this is our assumption in this study. It could also be interesting to simulate some new trends or impacts on mobility by choosing specific arbitrary constraints and validate the effectiveness of the method developed to reproduce these impacts and trends.
First, travel behavior indicators significantly changed between the 2012 and 2019 surveys. Some of these changes are the result of demographic changes while others are related to real changes in behaviors. The results obtained following the application of the developed method allow us, despite the significant differences observed between 2012 and 2019, to combine the samples to reproduce fairly faithfully the travel behaviors and population of the reference year. Although the proposed method does not allow, from the two surveys used in this study, perfect reproduction of the numbers of trips by age groups and gender, indicators such as mode or purpose shares are more faithfully reconstructed because they are directly related to some constraints used in the weighting algorithm. The proposed method therefore demonstrates a strong potential to make innovative use of historical data.
The number of years between the two surveys used in this study is significant and it may be easier to combine surveys with a shorter gap. Various applications can be imagined. For example, an annual survey with a low sampling rate could be used to update a larger survey by combining both. Using smaller intermediate surveys could facilitate to bridge the 5 to 10 years gap between two surveys. The lower change in travel behaviors would make the application of the methodology easier. Moreover, whereas samples from two surveys were combined in this study, there is theoretically no limit on the number of surveys to be combined. This last point also offers an alternative to the way of conducting surveys in Quebec with large samples that are increasingly difficult to recruit.
Limitations
The methodology has several limitations that are important to highlight. First, one of the important assumptions of this study is that the 2019 survey is perfectly representative of the 2019 travel behaviors. As mentioned above, several questions can be raised with respect to the methodology used and the overall quality of the results. The results obtained from the combined sample cannot therefore theoretically be better than the results of the reference survey. However, this demonstrates an advantage of using historical data according to the method developed. As mentioned above, in Quebec, surveys are typically conducted every 5 to 10 years depending on the region, with very few validation points between them. This increases the risk of using a single survey because when a change in trend is observed, it is difficult to know if it is really a new trend in behaviors or if contextual (transit strike, for instance), economic (crisis, fuel price increase), or methodological circumstances have affected the survey. Using historical data can mitigate some of the variability and lead to results that are a little more conservative.
Another important assumption of our method is that it assumes changes in behaviors that are relatively slow and continuous and where the old trip behaviors observed in the less recent survey are still present in the reference year. The method developed is much less suitable if rapid and significant changes in mobility behaviors are observed such as those caused by COVID-19.
Footnotes
Acknowledgements
The authors wish to acknowledge the Sherbrooke transit company (STS) and the Quebec Ministry of Transportation (MTQ).
Author Contributions
The authors confirm contributions to the paper as follows: study conception and design: H. Verreault, C. Morency; data collection: H. Verreault, C. Morency; analysis and interpretation of results: H. Verreault, C. Morency; draft manuscript preparation: H. Verreault, C. Morency. All authors reviewed the results and approved the final version of the manuscript.
Declaration of Conflicting Interests
The author(s) declared no potential conflicts of interest with respect to the research, authorship, and/or publication of this article.
Funding
The author(s) received no financial support for the research, authorship, and/or publication of this article.
Data Accessibility Statement
The data that support the findings of this study are available from Société de transport de Sherbrooke (STS) and Quebec Ministry of Transportation (MTQ). Restrictions apply to the availability of these data, which were used under license for this study. Data are available from MTQ and STS.