
Abstract
This study aims to inform the development of pedestrian-friendly self-driving vehicle (SDV) policies by investigating how perceptions of pedestrian comfort and safety are affected by SDV technology. We use structural topic modeling to investigate themes in open response survey comments from participants who viewed and rated short video clips of pedestrian interactions with motor vehicles. Although they were all human-driven vehicles (HDVs), participants were told that half of the interactions (randomly for each individual) involved SDVs. This deception-based survey design enabled isolation of the intrinsic effect of automated driving on comfort and safety perceptions across a broad sample of the population. Model results identified latent topics significantly more likely to be discussed for SDV versus HDV interactions, ceteris paribus. There is a greater focus on pedestrian responsibility to be cautious, aware, and predictable in interactions with SDVs than HDVs. Topics more associated with SDVs tend to focus on strict rule compliance (obligation fulfillment), whereas topics more associated with HDVs tend to focus on risk mitigation (with less focus on rules). Recommendations to mitigate potential negative impacts of introducing SDVs on the attractiveness of walking include requirements for conservative SDV operation in city streets, limiting potential interactions that require negotiated priority with SDVs (through physical separation and clear traffic controls), and enhancing external communication from SDVs.
Fully automated self-driving vehicles (SDVs) are promoted as a technological fix to improve road safety. The full impact of a proliferation of SDVs is uncertain, and is expected to be interdependent with the regulatory policies implemented to facilitate and regulate the introduction of the technology ( 1 , 2 ). In parallel to discussions of SDVs, many governments have committed to policies that prioritize and promote active transportation (such as walking and cycling), to advance system goals and priorities such as safety, efficiency, resilience, health, and sustainability. These governments must find ways to integrate SDVs onto city streets without compromising the appeal of active transportation ( 1 ).
Demand for active transportation is related to the perceived comfort and safety of using those modes ( 3 , 4 ). While the objective safety of SDVs has been extensively considered, perceptions of safety for the road users that will need to interact with these vehicles remains less explored. Many studies have examined perceptions of comfort and safety for pedestrians and cyclists interacting with human-driven vehicles (HDVs) ( 5 – 9 ). However, interactions with SDVs are likely to elicit different perceptions than interactions with HDVs.
This study aims to inform development of pedestrian-friendly SDV policies by investigating how perceptions of pedestrian comfort and safety are affected by SDV technology. Understanding the perceptions of comfort and safety for pedestrians, who must interact with SDVs, is essential to developing policies that improve rather than diminish walkability. These perceptions are also important for policymakers because safety perceptions will influence public support for or opposition to permissive SDV policies ( 10 ). We next summarize the state of knowledge on pedestrian comfort and automated vehicles, followed by a statement of the research objectives, descriptions of the data used in this study, analysis methods, analysis results, discussion of findings, and concluding thoughts. Note that we use the term “self-driving” vehicles because that is the term that was most comprehensible to the public in our pilot testing and to be consistent with our survey instrument, while acknowledging that the preferred terminology for automated vehicle technology is varied and evolving ( 11 ).
Literature Review
A small portion of the large body of literature on SDVs has investigated attitudes and affective (emotional) orientation toward SDVs, with a particular focus on the issues of public acceptance and willingness to use SDVs ( 10 , 12 , 13 ). Past studies have shown that public receptivity or acceptance of SDVs varies greatly across the population, and is generally higher for people who identify as men, are younger, live in urban areas, are more technologically oriented, and have more experience or knowledge of SDVs ( 10 , 14–21). A smaller subset of the SDV literature focuses on pedestrian experience and behavior interacting with SDVs, often still focused more on acceptance than pedestrian comfort as a desirable outcome per se ( 22 ).
Perceptions of how safe and comfortable it is to walk affect an individual’s desire and willingness to engage in walking activity ( 3 ). Past studies have investigated the effects of a range of environmental and perceiver attributes on perceptions of comfort and safety for pedestrians, including sidewalk conditions, street lighting, weather, socio-demographics, travel habits, and past experience ( 6 , 22–28). A consistently important factor for pedestrian comfort is distance from motor vehicles, particularly in crossings because that is where risks and conflicts are concentrated ( 29 – 32 ).
Safely negotiating interactions with motor vehicles requires pedestrians to convey and interpret intentions through primarily non-verbal communications ( 33 – 35 ). The introduction of SDVs complicates pedestrian-vehicle communications, and recent studies have found mixed results concerning pedestrian crossing behavior and the effects of various methods of communication between pedestrians and SDVs such as signs and lights ( 36 – 38 ). A few particularly relevant findings are that pedestrians may be uncomfortable personally interacting with SDVs, despite believing SDVs to be generally safer than HDVs, and that pedestrian experience and familiarity with SDVs may increase perceived safety of SDVs, but not necessarily receptivity or acceptance ( 16 , 21 , 39 ).
In this and other literature, perceptions of comfort and safety for active travelers have been studied using a variety of methods, including general survey items, first-person evaluations after participants experience an event or environment, and third-person evaluations of an observed event or environment (6–9, 16 , 28 , 40–42). Investigating perceptions of SDV interactions is a unique methodological challenge, because of the relative rarity of experienced interactions ( 22 ). Past study methods include interviews during SDV field trials, virtual reality, and deception-based behavioral experiments ( 37 , 38 , 43–47). Each method varies in strengths and limitations, across dimensions such as realism, experimental control, and sample representation (i.e., internal, external, and ecological validity) ( 22 ).
Almost all of the research on perceptions of SDVs and pedestrian comfort and safety cited above uses quantitative measures of perceptions, such as Likert-style responses to specific prompts describing risk, emotion, intention, and so forth. Closed-response questions like these facilitate statistical analysis, but the validity of the deductive analyses depends on the researchers’ correct a priori conceptualization of the perceptual framework. These types of measures can fail to capture the complexity of participants’ opinions and concerns ( 48 ). Therefore, emerging topics, such as pedestrian interactions with SDVs, also require inductive research methods that allow for the discovery of new information.
Unstructured response data, such as open text comments, can be used to discover previously unconsidered factors affecting attitudes and perceptions. Several analysis methods, such as topic modeling, have been developed and used to facilitate systematic analysis of this type of unstructured data with efficiency and transparency comparable to traditional quantitative methods. In topic modeling, each document or comment is comprised of latent topics, and each topic is expressed through a probability distribution across words in the vocabulary ( 49 , 50 ). Basic topic models, such as latent Dirichlet allocation, require topic prevalence (how often a topic is discussed) and topic content (the words used to discuss a topic) to be held constant across documents ( 49 ). In contrast, structural topic modeling (STM) can accommodate systematic variation in topic prevalence (how often a topic is discussed) and topic content (the words used to discuss a topic) with document meta-data, enabling investigation of factors that affect how often a topic is discussed and the words used to discuss those topics ( 50 ).
STM has only been applied in three transportation studies, to our knowledge ( 5 , 14 , 51 ). Most recently, Bardutz and Bigazzi used STM to investigate perceptions of comfort and safety for pedestrians interacting with bicycles and HDVs, showing that open text analysis provided new information and insights, distinct from quantitative ratings of comfort and safety ( 5 ).
Previously, Bennett et al. used STM to investigate attitudes toward and willingness to travel in SDVs among people with physical disabilities ( 14 ). They identified three topics in open responses to the prompt “Tell me about all the things that come into your mind when you think about driverless vehicles,” which reflected negative (“dangerous”), neutral (“ambivalence”), and positive (“helpful”) sentiments. A comparison sample from the general population yielded four different topics: unsafe human drivers, unattractiveness, software and control problems, and technology development.
Subsequently, Lee and Kolodge used STM to investigate trust in SDVs among drivers in the U.S., with a focus on consumer attitudes and acceptance ( 51 ). They identified 13 topics in open responses to the prompt “How much would you trust the ability of a vehicle equipped with self-driving technology to operate without a human driver’s input?” The topics mostly focus on different aspects of the reliability of SDV technology and the consequences of failures, and the authors suggest that people might overestimate the risks of SDVs because of perceptions of their risks as “uncontrollable, consequential, and unobservable”—that is, “dread risk.”
Three other past studies have examined perceptions of SDVs using unstructured response data analyzed with other methods. Brell et al. used focus group data to inform development of an online questionnaire on SDV perceptions ( 52 ). The focus groups revealed a mixture of positive and negative perceptions, with participants expressing generally positive perceptions of safety benefits from introducing SDVs, but “affective discomfiture” toward personally interacting with SDVs on the street. Das et al. evaluated YouTube comments using text analysis tools to identify topics and sentiments associated with SDVs, reporting mixed sentiments toward SDVs (majority positive) and key issues of “efficiency, performance, trust, comfort, and safety” ( 53 ). Later, Das presented basic topic models using latent Dirichlet allocation on open comment data, identifying general patterns of “key topics such as regulation, traffic law, speed limit, uber crash, safety concerns, and interaction with AVs,” and specifying the need for further study of this topic ( 54 ).
Summary and Objectives
In summary, the existing literature gives limited consideration to the impacts of SDVs on pedestrians (versus potential SDV users). Methodologically, the existing literature relies mostly on closed-form measurement of the magnitude of support, acceptance, and so forth, and lacks inductive analysis from unstructured responses to characterize perceptions. In addition, most existing studies fail to include a comparison measurement to directly contrast perceptions of SDVs and HDVs.
To address these research gaps and inform pedestrian-friendly SDV policies, this study investigates how perceptions of comfort and safety for crossing pedestrians are affected by self-driving technology in interacting vehicles. We do this by determining whether pedestrian interactions with SDVs evoke different topics than interactions with conventional vehicles, using open comments from an online survey in which a broad sample of participants rated eight video clips of pedestrian crossings in Vancouver, Canada. Although all the clips showed HDVs, participants were told that half of the interactions (randomly for each participant) involved SDVs. The deception research design isolates the intrinsic effects of self-driving technology on expressed perceptions, independent of potential confounding factors such as vehicle size or operating differences. This study is unique in undertaking inductive analysis from unconstrained expressions of comfort and safety for pedestrians interacting with SDVs versus HDVs.
Data
Data for this study were collected using a third-person evaluation method—an online survey in which participants evaluated videos of pedestrian interactions. The survey ran from October 22 to December 12, 2021. The study population was residents of British Columbia, which provides contextual variation (in population density, pedestrian facilities, etc.) while controlling for a fixed transportation policy context. The survey used short video clips of pedestrians interacting with HDVs at unsignalized crosswalks on two-lane minor streets (annual average daily traffic of 2,000–8,000) in Vancouver, Canada. Although all the video clips showed HDVs, participants were told that half the videos they watched showed SDVs. This deception-based survey design, described in detail in the following paragraphs, was used to control for interaction differences and isolate the influence of (purported) automation technology on perceptions. In addition, at the time of the study fully automated SDVs were not legal to operate in British Columbia.
The video data used in the survey were collected in fall (September–December) of 2018 at 11 unsignalized marked crosswalks in Vancouver, Canada, using overhead cameras oriented to capture the crosswalk and pedestrian and vehicle approaches. The video data were originally collected and used in a study to contrast the effects of bicycles and motor vehicles on perceptions of pedestrian comfort and safety ( 55 ). Of the over 4,000 recorded pedestrian interactions in the available video data, eight clips were selected that showed dark-colored, late-model sedans, so that the vehicles were plausibly automated and to control for the effects of vehicle attributes on perceptions. The clips were also selected to include a range of interaction severities (ranging from <1 to 4 s post-encroachment time). Every participant rated all eight videos, which, for each participant, were randomly divided into two groups of four videos each: one group identified as HDVs and the other as SDVs. For each participant, either the HDV or SDV group of videos (randomly) was shown first, and the order of the four videos within those groups was also randomized.
The survey began by informing the participant that “self-driving vehicles use advanced technology to scan the surrounding road environment and carry out all driving tasks, including steering, speed control, following traffic signs and lights, yielding at crosswalks, etc.” consistent with an automation level of 4 and above (
11
). Participants were then asked a series of questions about their attitudes toward and familiarity with SDVs, and prepared to view the video clips with the following prompt: “We are investigating interactions between self-driving vehicles and pedestrians during pilot testing on public streets. In collaboration with the Department of Electrical Engineering at UBC, several passenger vehicles were modified with self-driving equipment. The vehicles traveled on an approved test route of low-traffic city streets, and their interactions with pedestrians at several crosswalks were recorded. In compliance with federal safety requirements, a driver was present to take control of the vehicle in case of an emergency. The vehicles were not labelled as self-driving to make interactions with other road users as normal as possible.”
After viewing each video clip, participants were asked to provide their agreement ratings to the following severity statements (drawn from Bigazzi et al.): 1) “The vehicle yielded to the pedestrian.” 2) “The vehicle should have yielded to the pedestrian.” 3) “The pedestrian felt comfortable in this crossing.” 4) “The risk of injury for this pedestrian in this crossing was low.” (emphasis in the original) ( 55 ). This paper focuses on the open response comment box that was provided after the above statements (analysis results from the quantitative ratings will be reported in a forthcoming paper). Participants were prompted with “Please provide comments if you wish to clarify your rating or describe any confusion/difficulty you had with rating this video.” Following the video ratings, socio-demographic information of participants was collected, including household income, gender, age, and educational attainment. Self-reported risk aversion and travel habits were also collected.
At the end of the survey, the deception was revealed, and participants were asked to agree or disagree (binary) with the statement, “I believed that the videos in the survey showed self-driving vehicles when I responded to the questions above.” Finally, participants were asked to re-consent to the use of their data, with knowledge of the true nature of the study. Study methods were reviewed and approved by the University of British Columbia Behavioural Research Ethics Board (#H21-02214).
Survey participants were recruited using advertisements on Facebook and Instagram targeted to online users located in British Columbia. According to recent survey data, 91% of adult Canadians are on social media, with Facebook and Instagram adverts capable of reaching 62% and 48%, respectively, of Canadians aged 13 and above ( 56 ). The advertisement stated that the research laboratory was seeking participants for a “survey on road-user interactions at crosswalks.” SDVs were not mentioned in the advertisement to reduce bias and maintain a neutral sample. As an incentive, participants were given the option to enter a raffle for one of 10 $25 gift cards.
The survey received 1,563 raw responses. Responses were removed if participants declined initial consent (N = 6), quit the survey before re-consenting at the end of the survey (N = 347), declined re-consent at the end of the survey (N = 18), reported a home postal address outside of British Columbia (N = 52), spent less time on two or more video survey pages than the duration of the videos (N = 7), or were not deceived by the experiment (N = 42). Of the remaining 1,091 participants, 545 (c. 50%) left at least one comment clarifying their ratings of comfort and safety on a video page, with a total of 2,129 comments collected (up to eight per participant).
Methodology
Overview
Individual perceptions of comfort and safety were hypothesized to be directly affected by the attributes of the perceiver (socio-demographics), and attributes of the interaction (Figure 1). Perceptions of comfort and safety are then expressed through the closed-response ratings and open comments, which in turn are composed of topics. Topic prevalence (how likely a participant is to discuss a topic in their comment) is expected to be affected by the perceiver’s attributes and attributes of the interaction, and topic content (the words the perceiver uses to discuss a given topic) is expected to be affected by interaction attributes. Previous research indicated that perceiver attributes failed to affect topic content when discussing perceptions of pedestrian comfort and safety ( 5 ).
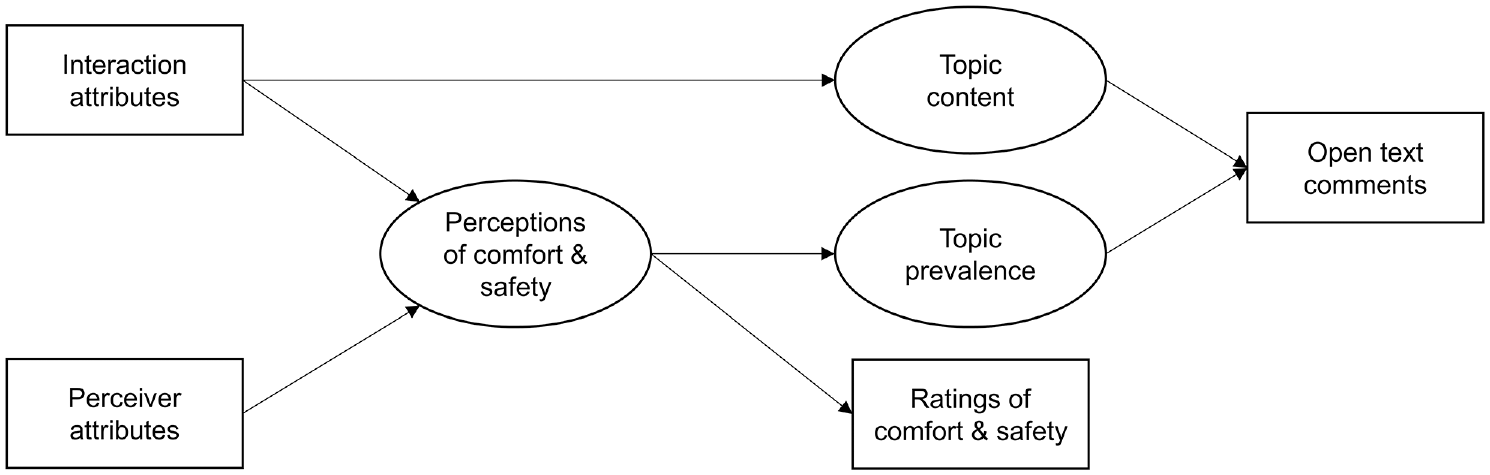
Conceptual framework.
To test these hypotheses, the text data were analyzed using STM, a machine-assisted text analysis method that discovers latent topics within text data. The model uses text document data (i.e., comments) to simultaneously infer latent topics, document-topic proportions (each document is composed of some proportion of all topics), and the probability distribution of words in the vocabulary used to discuss each topic. Representative words (those with the highest likelihood of being used to discuss a topic) and representative documents (those with the highest proportion of a particular topic) are used to interpret the meaning of each topic.
The analytical framework for applying the STM model structure to the study data is illustrated in Figure 2. Each comment recorded in the survey (i.e., response in the open text box for one video clip by one participant) is a document,
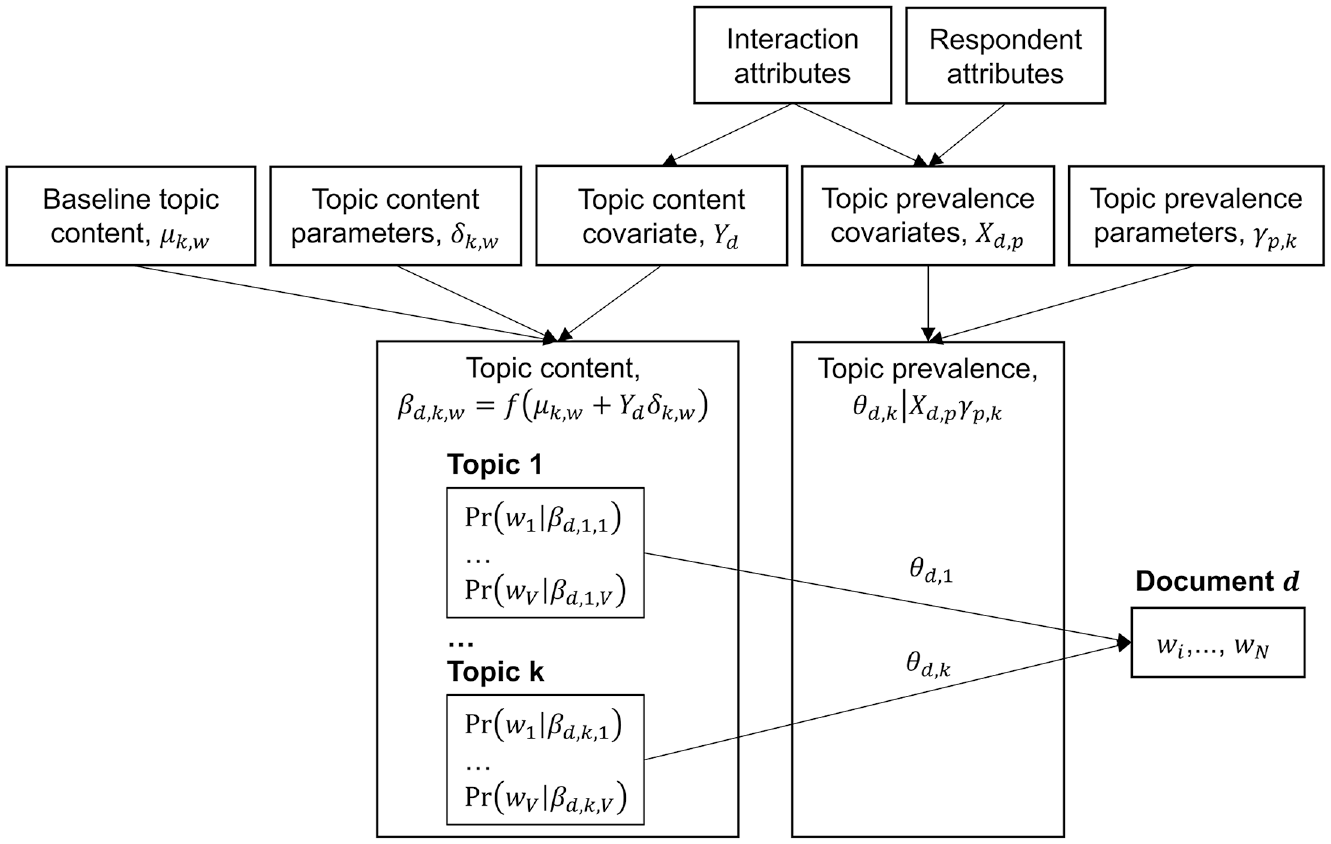
Illustration of the application of structural topic modeling in this study.
Each document also has its own unique topic content, or probability distribution of words used to represent or express each topic. The words
The value of applying STM in this study is the inference of latent topics, and subsequent interpretation of their prevalence and content characteristics in survey response data. Of particular interest for the research objectives is how topic prevalence is conditional on SDV versus HDV interactions. Which topics are more likely to be discussed in evaluations of pedestrian comfort and safety during interactions with SDVs versus HDVs, all else equal?
Model Specification
To specify a STM model, the researcher must choose the number of latent topics and the independent variables (covariates) associated with topic prevalence and topic content. To select the number of topics, models were run with 2–15 topics, using interacting vehicle type (SDV or HDV) as the only topic prevalence covariate. Two candidate models (number of topics) were selected based on high semantic coherence (prioritizing word consistency across topic occurrence), high exclusivity (prioritizing word differences between topics), low residual variance, and low held-out likelihood (log-likelihood for the fitted model applied to test data in cross-validation). The two candidate models were further investigated by re-estimating with the full set of covariates, and the final model was selected based on interpretability. Topics were interpreted by reading the top five exemplar comments (i.e., comments with the highest proportion of each topic) and word profiles. Word profiles were created using four methods, which differ in their weighting of topic frequency, topic exclusivity, and corpus frequency: Highest Prob, FREX, Lift, and Score ( 50 ). All analysis was conducted using the statistical software R, with the stm package ( 50 , 59 ).
Two interaction attributes were included as topic prevalence covariates: vehicle type (SDV versus HDV) and video ID (fixed effects representing the average effect of all other interaction features). Self-reported perceiver attributes included as topic prevalence covariates were: socio-demographic indicators, risk aversion, technology acceptance, familiarity with and affective orientation toward SDVs, and travel habits. Age (8 levels), household income (6 levels), and educational attainment (5 levels) were specified as integer variables. Gender was specified as a binary variable for cis-man (versus non-cis-man); this construction unfortunately aggregates non-binary participants with cis-women, but with only six non-binary responses in the data we lacked sufficient statistical power to estimate non-binary parameters in the regression analysis. Risk aversion, technology acceptance (embracing new technology), familiarity with SDVs, and affective orientation toward SDVs (from anxious to enthusiastic) were specified as integers from their Likert-style responses (from −10 to 10). Travel habits were specified as frequency of walking, cycling, using public transit, and using a vehicle as a driver or passenger, coded as integers: 1 = “never,” 2 = “monthly or less,” 3 = “several times a month,” 4 = “several times a week,” and 5 = “almost daily.” Vehicle type was specified as the sole topic content covariate.
Text Data Preparation
First, the comments were manually read, spelling errors were corrected, and irrelevant comments were removed (i.e., any comments that did not relate to the content of the video). Common terms were standardized, including “pedestrian” (variations included “ped”), “crosswalk” (variations included “cross walk” and “xwalk”), and “self-driving” (variations included “self driving” and “SD”). Punctuation, numbers, and stop words (words that only serve a grammatical function, such as “the” or “which”) were removed. Words were then stemmed to their base form (i.e., “bicycling” and “bicycles” were both reduced to “bicycl”), so that words with the same core meaning but different affixes or variations (such as bicycle, bicycles, bike) are all treated the same in the text analysis. Finally, words that appeared very frequently (in
Correlation between Topic Prevalence and Ratings of Comfort and Safety
Pairwise correlations between document-level topic proportions and the respective participant’s rating of comfort and safety were investigated after finalizing the topic model. Correlation coefficients greater than
Results
Processed Text Data
After text processing, 1,783 (84%) comments remained from 470 respondents. Compared with the population (British Columbia residents), the sample of commenting participants is older (20% versus 32% under 40 years), has higher educational attainment (50% versus 29% with a bachelor’s degree or higher), and includes more women (60% versus 51%) ( 62 ). The majority of these participants reported walking (72%) and driving (78%) at least several times a month, while 32% bicycle and 37% use transit at least several times a month.
The mean and median comment lengths were 24 and 19 words, respectively. Comment lengths ranged from 1 to 155 words. The original corpus vocabulary was reduced from 1,858 unique terms to 206 terms after processing. The comments were split nearly equally between SDV (53%) and HDV (47%) interaction videos. The top three most frequently used words were “pedestrian,”“car,” and “stop” (Figure 3).
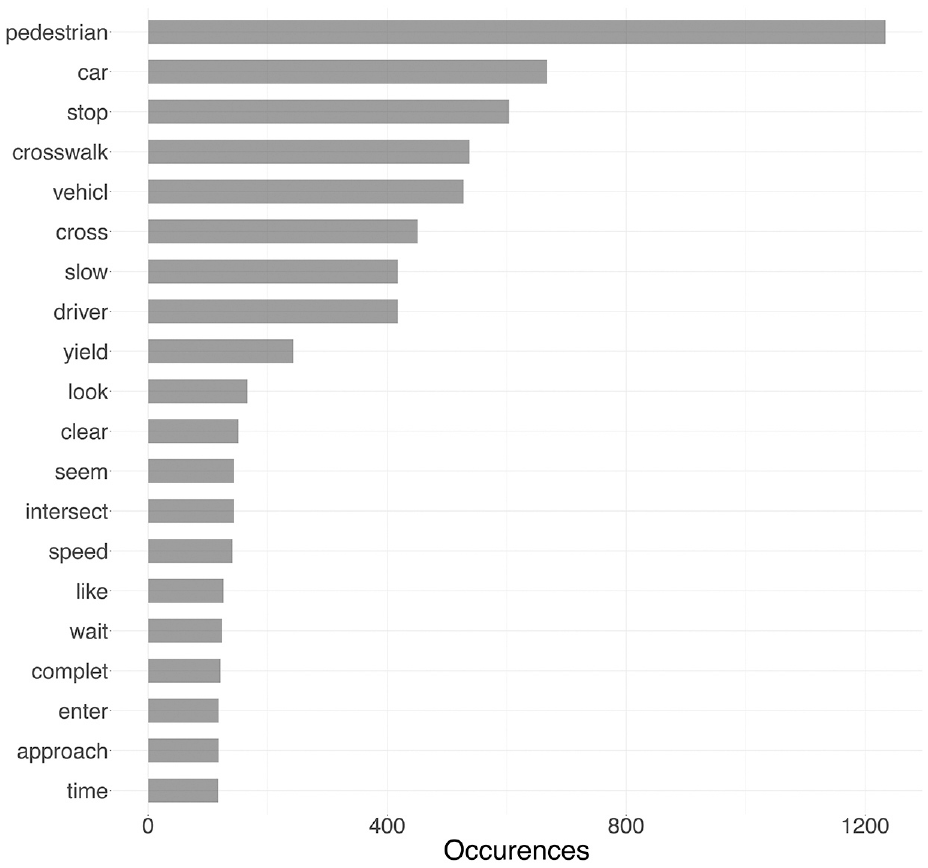
Word frequencies for the 20 most frequently used (stemmed) words in the vocabulary.
Model Estimation Results and Topic Interpretation
As described above, we examined models with 2 to 15 topics for a combination of high semantic coherence, high exclusivity, low residual variance, and low held-out likelihood; these four measures for all 14 models are shown in Figure 4. The best-performing candidates over these four measures were the 8- and 10-topic models, which were re-estimated with the full set of covariates and examined for interpretability based on the exemplar comments and exemplar words (word profiles) for each topic. The 8-topic model produced two topics with unclear themes after inspection (i.e., the exemplar comments were semantically incoherent), and so the 10-topic model was selected for its added information and greater interpretability.
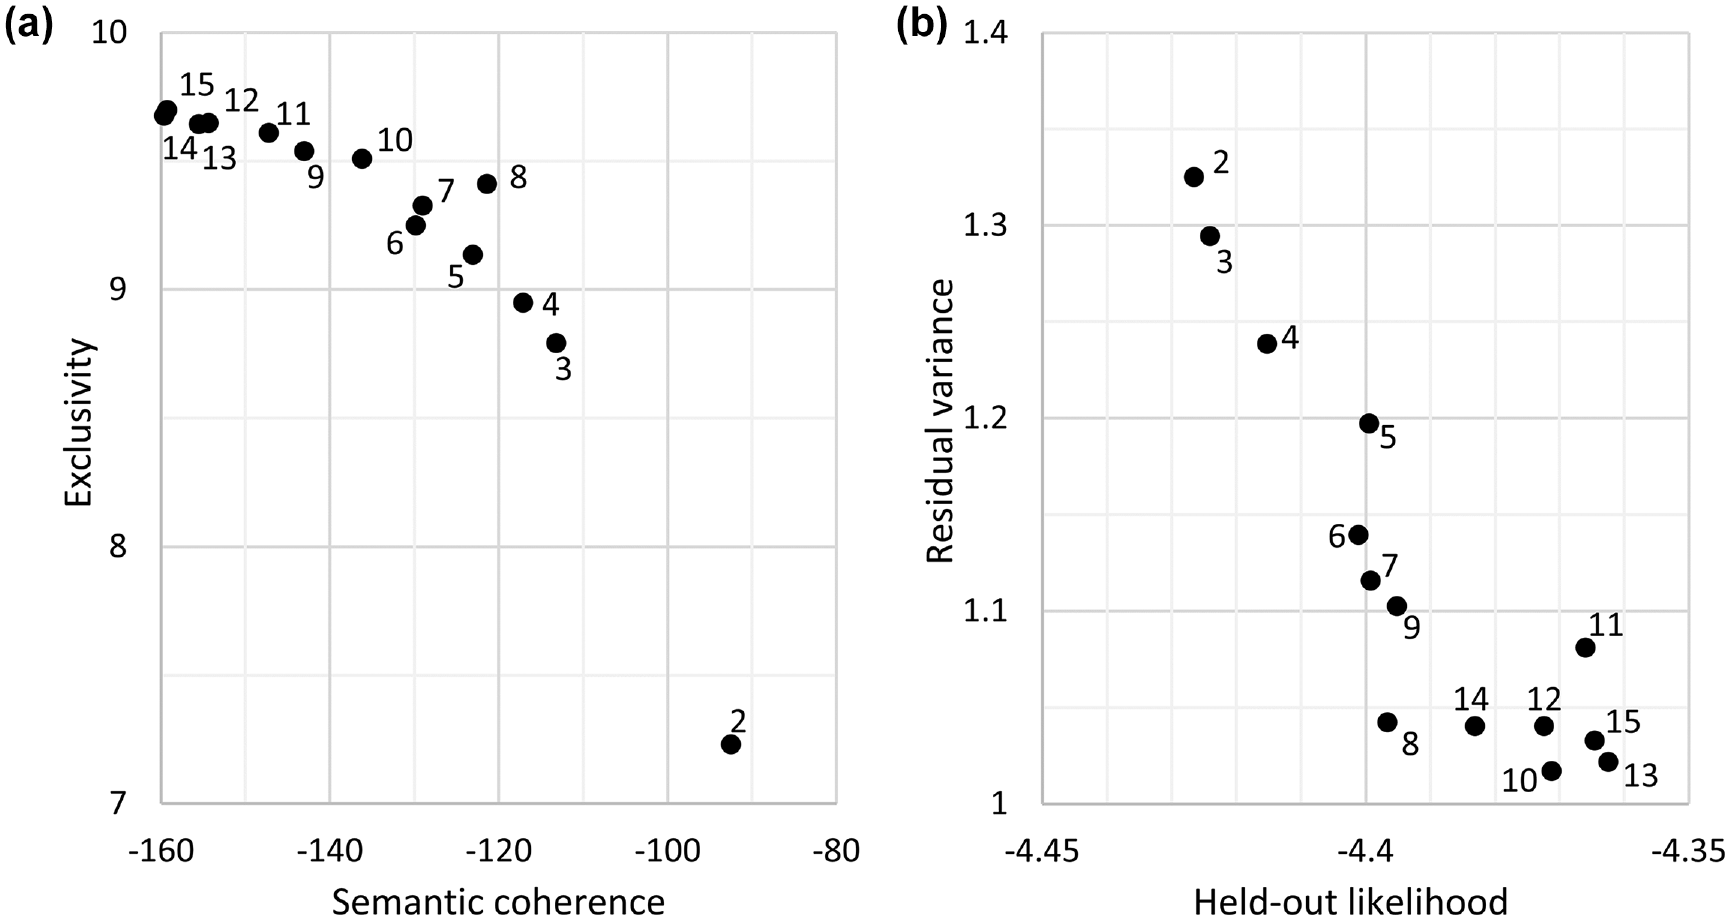
Candidate model diagnostics: (a) semantic coherence and exclusivity and (b) residual variance and held-out likelihood.
The 10 topics were interpreted using their exemplar comments and words, which are given in Table 1. Topics are interpreted by identifying the common thread among the exemplar comments and words, noting that exemplar comments still contain a portion of other topics. To aid in the interpretation, Table 2 gives the subject, issue, impact, and sentiment identified for each topic in inductive analysis of the model results in of Table 1. “Subject” refers to the primary actor, “issue” refers to the primary matter of discussion (e.g., speed or proximity), and “impact” refers to the primary outcome discussed (pedestrian safety, pedestrian comfort, or fulfillment of obligations). Following interpretation, the 10 topics were labeled:
Vehicle should make a complete (not rolling) stop
Agency and individuality of risk in a given situation
Importance of awareness and communication for pedestrian safety
Car need not yield if pedestrian not in crossing
Pedestrian should be aware and cautious before crossing
Car should slow and give pedestrian space before proceeding
Bicycle did not yield
Safe for vehicle to proceed if pedestrian is not in crossing
Car’s false indicator is confusing for pedestrian
Driver should stop/slow and wait for pedestrian to clear crossing.
Top Five Exemplar Comments and Words for Each Topic
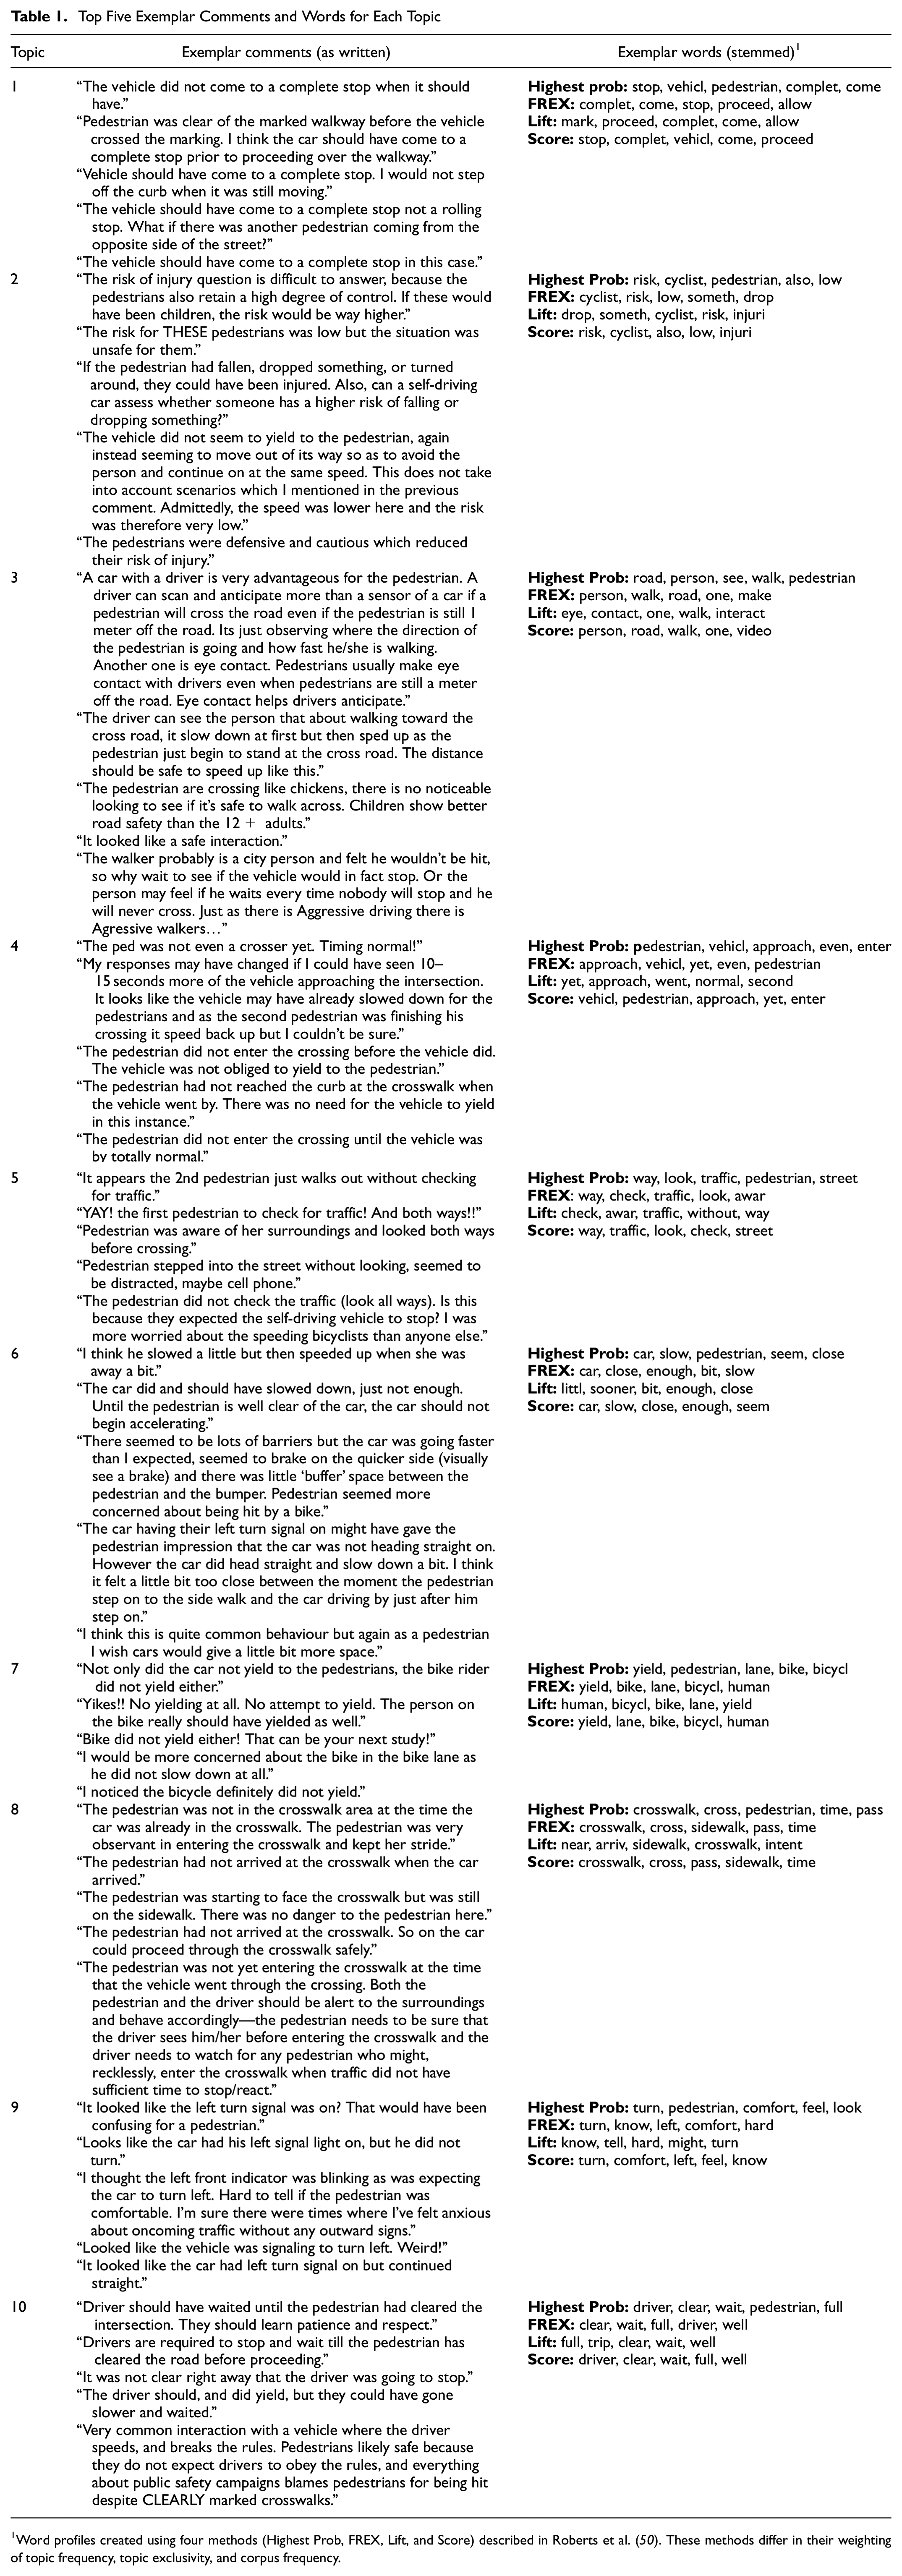
Word profiles created using four methods (Highest Prob, FREX, Lift, and Score) described in Roberts et al. ( 50 ). These methods differ in their weighting of topic frequency, topic exclusivity, and corpus frequency.
Topic Interpretation through Subject, Issue, Impact, and Sentiment
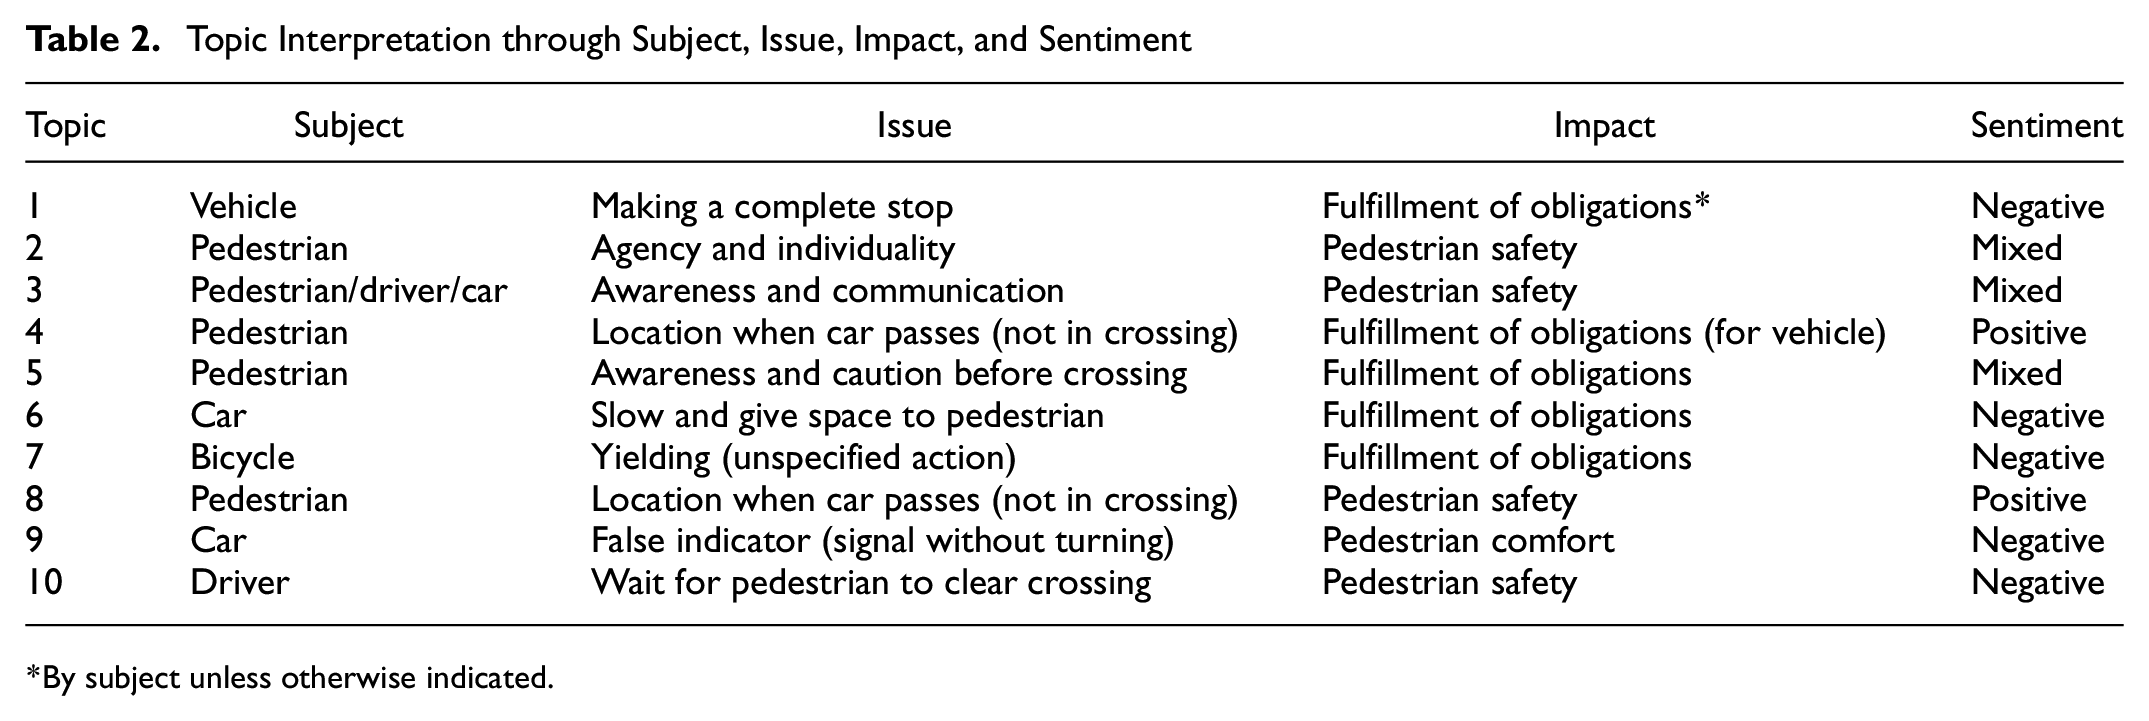
By subject unless otherwise indicated.
The odds ratios for topic prevalence covariates in the 10-topic model are reported in Table 3, where the dependent variable is topic prevalence. Odds ratios > 1 indicate that the topic is more likely to be discussed when the independent variable increases (or is true for binary variables). For example, the odds ratio of 1.046 for SDV vehicle type under Topic 1 indicates that Topic 1 was more prevalent in comments when the participant was told the vehicle was an SDV, and, conversely, less prevalent in comments when the participant was told it was an HDV. Odds ratios < 1 indicate that the topic is less likely to be discussed when the independent variable increases (or is true for binary variables). For example, the odds ratio of 0.968 for the “man” gender under Topic 6 indicates that Topic 6 was less likely to be discussed by participants self-identifying as men, and, conversely, more likely to be discussed by participants self-identifying as other genders.
Estimated Odds Ratios for Topic Prevalence Covariates
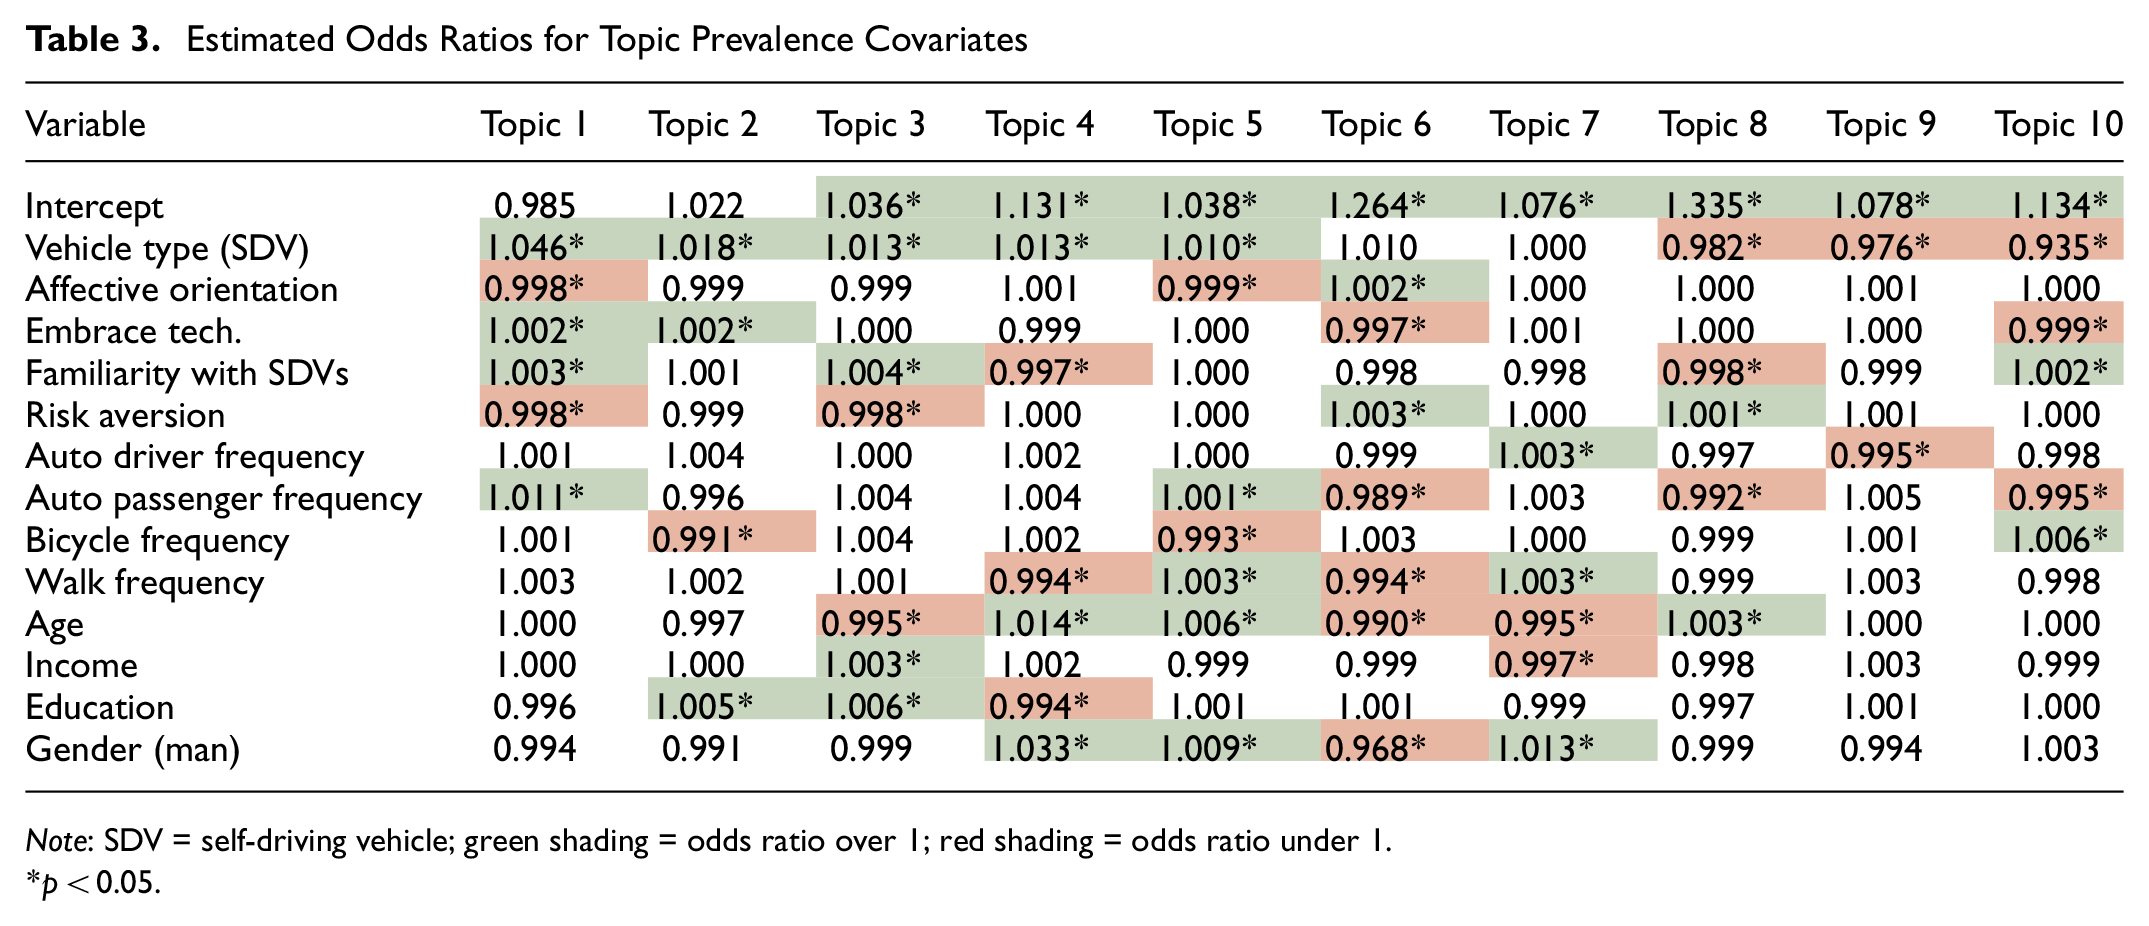
Note: SDV = self-driving vehicle; green shading = odds ratio over 1; red shading = odds ratio under 1.
p < 0.05.
The magnitudes of the odds ratios are relative to unit changes in the independent variables. For binary variables, an odds ratio of 1.046 for SDV vehicle type indicates the odds of discussing that topic for a given video were 4.6% higher if the respondent believed the vehicle was self-driving (versus human-driven). Most of the variables were expressed as integers, with 5 to 20 levels, and so the impacts of these variables on topic prevalence are up to 20 times larger than the per-unit odds ratios. The relationship between odds ratios and probability of a topic being discussed also depends on the baseline prevalence; the overall prevalence of each topic across all comments in the corpus is illustrated in Figure 5. Generally small shifts in topic prevalence (on the order of a few percentage points) because of topic prevalence covariates is consistent with past topic modeling results ( 51 , 63 ).
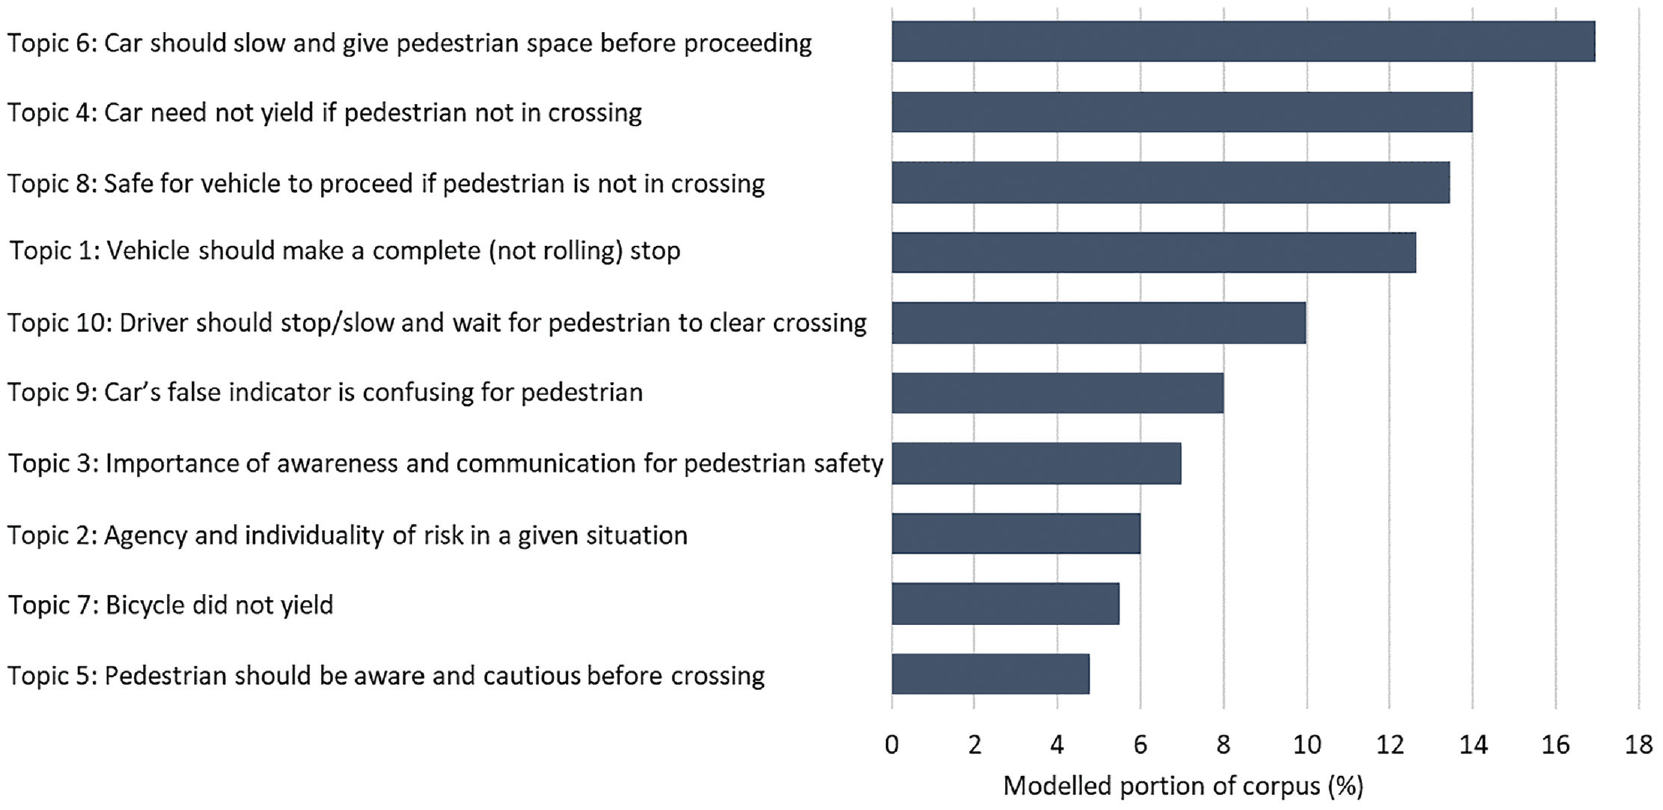
Topic prevalence across all comments.
Table 3 omits the video ID fixed effects; each topic had at least two video effects that were significant (at p < 0.05), and all video effects were significant for at least one topic. The topic content covariate (SDV vehicle type) was also significant, indicating a tendency to use different words to discuss a given topic for SDV versus HDV interactions (vehicle versus driver, for example).
The topic numbers are reverse-ordered according to the “Vehicle type” parameter (SDV = 1), so that Topics 1–10 are decreasingly likely to be discussed when the participant was told the interacting vehicle was self-driving. Vehicle type significantly affected the prevalence of all but two topics (6 and 7), with topics 1–5 more associated with SDV interactions and topics 8–10 more associated with HDV interactions. The following sub-sections provide details on each topic, grouped according to the direction and significance of the “Vehicle type” variable.
Topics Associated with Self-Driving Vehicles (SDVs)
The first five topics were discussed significantly more when participants were told they were watching an SDV interaction. These topics may have been distinctly important to participants for pedestrian interactions with SDVs, or they may represent issues that participants were more attentive to or felt more compelled to discuss when they were told they were watching SDVs.
Topic 1 is about vehicles making a complete (not rolling) stop (e.g., “The vehicle did not come to a complete stop”). The subject of the topic is the vehicle, and the outcome of the topic is obligation fulfillment (e.g., “The vehicle should have come to a complete stop”). Topic 2 is about pedestrian agency and individuality. The exemplar comments argue that the interaction’s risk depends on traits of the pedestrian, such as their age (e.g., “If these would have been children, the risk would have been way higher”) or the specific context (e.g., “If the pedestrian had fallen, dropped something, or turned around, they could have been injured”).
Topic 3 is about the safety impact of awareness and communication from both the driver/vehicle and pedestrian (e.g., “The driver can see the person” and “Pedestrians usually make eye contact with drivers”). Topic 4 is about the location of the pedestrian when the car passes (e.g., “The pedestrian had not reached the curb”), discussed with reference to obligation fulfillment (why the interaction did not necessitate a yield from the interacting vehicle). Topic 5 returns to the issue of pedestrian awareness and caution before crossing (e.g., “The second pedestrian just walks out without checking for traffic”), this time focused on obligation fulfillment.
Topics Unassociated with Vehicle Type
The prevalence of Topics 6 and 7 was not significantly affected by vehicle type; participants who were told they were watching SDVs discussed these topics at a similar rate to those who were told they were watching HDVs. These topics were important to participants, or participants felt compelled to discuss these topics, regardless of the vehicle’s automation.
Topic 6 is about slowing and giving space to the pedestrian (e.g., “He slowed down a little but then speeded up”). The exemplar comments are negative in sentiment, generally criticizing the vehicle’s behavior. Topic 7 is about a coincident bicycle (in a parallel bicycle lane to the interacting vehicle) that did not yield to the crossing pedestrian. The survey prompt indicated the motor vehicle, but some participants felt compelled to comment on the bicyclist. The discussion of yielding in this topic is unspecific, contrary to other topics (discussed later) that focus on a specific action of yielding (i.e., slowing, stopping, waiting). The exemplar comments discuss obligation fulfillment, rather than an explicit effect on pedestrian safety or comfort, and have a negative sentiment (e.g., “The person on the bike really should have yielded” and “Yikes!! No yielding attempt at all”).
Topics Associated with Human-Driven Vehicles (HDVs)
Topics 8, 9, and 10 were discussed significantly more when participants were told they were watching an HDV. This may indicate that these topics were distinctly important to participants when they believed the vehicle was being operated by a human, or that participants were more attentive to these issues or felt more compelled to discuss these topics when they were told they were watching an HDV.
Topic 8 is about the location of the pedestrian when the car passes (e.g., “The pedestrian was not in the crosswalk”). This issue is discussed explicitly with regard to its effect on pedestrian safety (e.g., “There was no danger to the pedestrian”), in contrast to Topic 4 described above (associated with an SDV), where pedestrian location was discussed with regard to obligation fulfillment. Topic 9 is about a false indicator in one of the videos (e.g., “Looks like the car had his left signal light on, but he did not turn”), and its effect on pedestrian comfort. Topic 10 is about the need for vehicles to stop/slow and wait for the pedestrian to clear the crossing (e.g., “Driver should have waited until the pedestrian had cleared the intersection”)—again related to pedestrian safety.
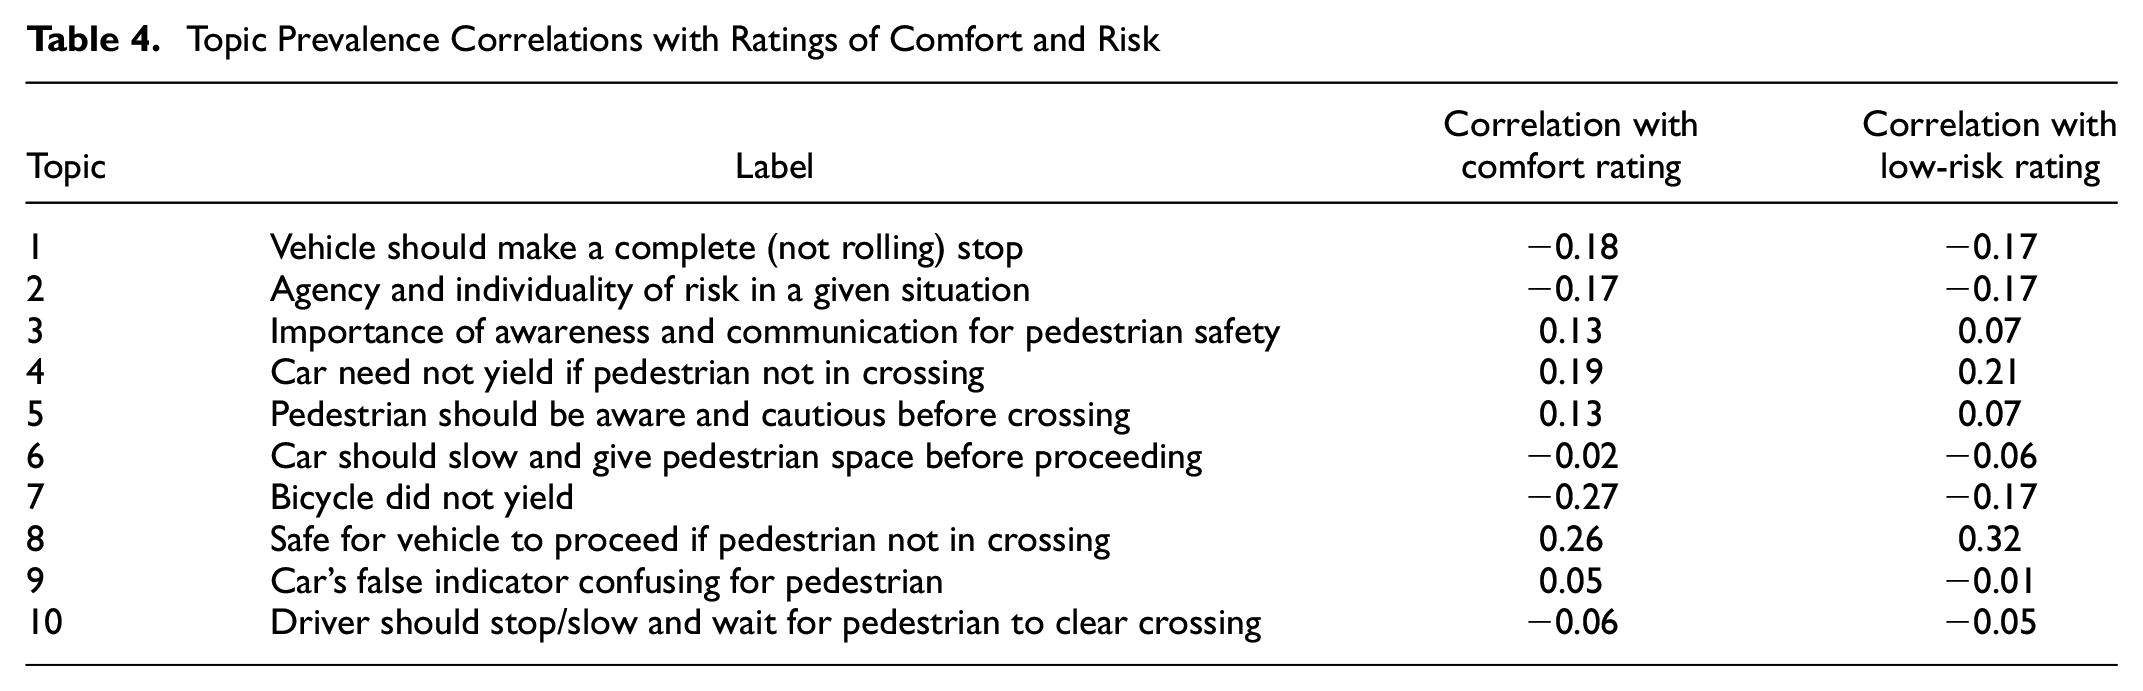
Topic Prevalence Correlation with Ratings of Comfort and Safety
Correlations between topic prevalence and ratings of comfort and safety (coded as integers) are given in Table 4. The correlations generally correspond with the sentiment assigned based on the exemplar comments (Table 2). But most correlations are below
Topic Prevalence Correlations with Ratings of Comfort and Risk
Discussion
Two key findings are derived from interpretation of the STM model results, as presented in detail in the preceding section. The inferred topics, combined with the estimated topic prevalence parameters for SDV vehicle type, reveal the key considerations for people evaluating pedestrian comfort and safety during interactions with SDVs, in contrast to HDVs, controlling for all other factors. Additional insights about the moderating influences of personal factors (e.g., demographics, travel habits, and affective orientation) are gained from the other estimated topic prevalence parameters.
Our first main finding is that, when evaluating the appropriateness of observed behavior, there is a tendency to focus more on rule compliance for SDVs and on consequent pedestrian risk for HDVs. Participant comments suggested that SDVs should comply strictly with traffic rules, whereas HDVs could deviate from the rules, as long as they did it safely. Most of the topics more associated with SDVs focused on obligation fulfillment (i.e., rule compliance), whereas two of the three topics more associated with HDVs focused on the pedestrian safety impact, and the third on pedestrian comfort. Issues that were discussed more than once, such as location of the pedestrian, were discussed with regard to obligation fulfillment when associated with SDVs (Topic 4) but discussed with regard to pedestrian safety when associated with HDVs (Topic 8). The only specific yielding action discussed significantly more in SDV comments was complete versus rolling stops (Topic 1)—a strict rule framing.
Our second main finding is that evaluator comments suggest a greater focus on pedestrian responsibility when interacting with SDVs versus HDVs. The pedestrian is identified as a key risk-controlling agent for three of the five topics associated with SDVs (Topics 2, 3, and 5). In comparison, none of the topics associated with HDVs place the pedestrian as the risk-controlling agent; the responsibility for ensuring a safe interaction is primarily ascribed to the driver. The increased responsibility ascribed to pedestrians to be cautious, aware, and predictable may reduce the attractiveness of walking in environments with SDVs by increasing levels of pedestrian stress ( 3 , 64 ).
These two key findings may be related to “algorithm aversion”—people’s general dislike and distrust of algorithms, even when those algorithms make statistically fewer errors than humans performing the same task ( 65 ). Algorithm aversion is especially strong for subjective tasks, such as negotiating road space with human road users ( 66 ). A distrust of SDV algorithms may underlie a greater focus on strict rule compliance (versus the flexibility to negotiate a safe interaction) and a greater responsibility for the pedestrian to be defensive. Participants may also have focused on rule compliance in lieu of other signals of intent or communication from the SDV (Topic 3). Any external communication feature (visual or auditory) has been shown to be preferred to no communication feature by pedestrians interacting with SDVs ( 45 ). The findings are supported by past research showing travelers to have higher safety requirements for riding in automated vehicles rather than HDVs, and assigning greater responsibility to human than automated drivers in crash scenarios ( 67 , 68 ).
Beyond self-driving effects, individual participant attributes also influenced topic prevalence in the comments. Self-reported affective orientation toward SDVs (from anxious to enthusiastic), tendency to embrace new technology, familiarity with SDVs, and risk aversion each significantly influenced the propensity to discuss three or four of the 10 topics, in varying directions. For example, more SDV-anxious respondents were significantly more likely to discuss Topic 1 (Vehicle should make a complete [not rolling] stop) and Topic 5 (Pedestrian should be aware and cautious before crossing). Travel habits and socio-demographic variables each significantly influenced the propensity to discuss two to six of the 10 topics. Among the personal attribute variables, the largest magnitude of tropic prevalence associations were for gender, where men were substantially more likely to discuss Topic 4 (Car need not yield if pedestrian not in crossing) and less likely to discuss Topic 6 (Car should slow and give pedestrian space before proceeding).
This study is comparable to a previous study that used STM to investigate perceptions of comfort and safety for pedestrians interacting with bicycles and HDVs ( 5 ). That study found that rule compliance was a greater concern for interactions with HDVs than bicycles, and that pedestrians were ascribed more agency to ensure a safe crossing when interacting with HDVs than bicycles. The two studies together show a clear pattern in which, as the degree of separation between the pedestrian and the interacting road user increases (from bicycle to HDV to SDV), people increasingly focus on rule compliance by the interacting road user and ascribe more responsibility to the pedestrian to be cautious. This broader finding of focusing more on formal versus informal “rules of the road” could be a result of increasing verbal and non-verbal communication challenges. The magnitude of contrasts between HDVs and bicycles in that study was larger than between SDVs and HDVs reported here; an important methodological difference is that the previous study contrasted different interactions, whereas here we have more specifically evaluated a purely perceptual bias for the same interactions. We would expect larger differences in topic prevalence between comments on SDV versus HDV interactions that also varied by vehicle type, operation, appearance, and so forth (combining the effects of disparate factors on perceptions).
Conclusion
This study examined perceptions of comfort and safety for pedestrians interacting with SDVs versus HDVs, to help ensure that the introduction of SDVs does not undermine efforts to promote active transportation. We find that SDVs can create a challenge, because pedestrians are ascribed greater responsibility to be cautious, aware, and predictable in interactions with SDVs versus HDVs, which may reduce the attractiveness of walking. A key issue differentiating expressed perceptions of SDVs from HDVs is a focus on rule compliance versus risk mitigation, which has several key policy implications.
To enhance pedestrian comfort, SDVs should be programmed to strictly comply with road rules, and perhaps exaggerate their performance (e.g., remain fully stopped until the pedestrian has completely exited the intersection). Even if SDV algorithms allow for design of closer interactions (shorter gaps, higher speeds, etc.) than HDVs at lower probabilities of collision, pedestrian comfort demands the opposite design approach, in which SDVs operate more conservatively than HDVs in street environments. Another implication is that environments where pedestrians must interact with SDVs should be designed to limit negotiated priority by implementing clear traffic controls. In other words, SDV and “shared space” designs are likely an uncomfortable combination. Other mitigation approaches include enhancing external communication from the SDV and strategies to reduce algorithm aversion; existing research has recommended public education, reframing subjective tasks, and anthropomorphizing the automated “driver” ( 66 ).
The scope of this study was limited to eight specific interactions in unsignalized marked crosswalks on minor arterial streets. This study design was used to isolate the effect of vehicle autonomy on perceptions, independent of all other factors, at the cost of reduced contextual factors that could be investigated. SDV versus HDV perceptions may be different in high-volume facilities or signalized intersections, for example, or for other vehicles types such as shuttles. Our study scope was also limited to residents of British Columbia, Canada, and transferability to other populations is uncertain. In particular, SDVs have not yet been allowed to operate on public roadways in British Columbia, and so the study population may have less exposure to SDV technology than people in other places such as California, U.S.
Methodologically, we did not include survey weights or random effects in our model specification, which could improve the model representation and precision. The online recruitment method presents a risk of sample bias on age and technological orientation, although those factors were included as control variables in the model. A large majority of British Columbians use social media regularly, and our sample over-represents (not under-represents) people aged 60–79 in the British Columbia population (ages 20–59 are well represented) ( 56 , 69 ). We also assume that participants discuss issues that are important to them, but comments can be limited by participant ability and willingness to articulate complex thoughts and perspectives ( 70 ). In addition, as with all text analysis, the findings rely to some extent on researcher interpretation of the topics. The deception experiment was highly successful (with 96% of participants deceived), but it is expected that the un-deceived 4% (who were excluded from the analysis) were non-random, introducing sampling bias. The effect of this bias on the results is likely small, given the small portion of the sample excluded and the inclusion of SDV-related personal attributes as topic prevalence covariates in the model.
The purpose of inductive analysis on open response text data is to better understand perceptions without a priori assumptions of their characteristics; future research should expand on and validate these findings with a closed-response survey method. With new understanding of the isolated self-driving effect on perceptions, future work can build on this study’s findings by examining the moderating influences of varying vehicle and pedestrian behavior—that is, testing different SDV operation and different pedestrian behavior when interacting with SDVs. The SDVs could be real, as the technology develops and SDV vehicles are increasingly road-tested, or synthesized, as in past research ( 37 ). Another potential area for further inquiry is how the focus on rule compliance and pedestrian responsibility may be moderated by external communication features on the SDVs. Future research should also investigate interactions in more or less traffic-controlled settings and with higher traffic volumes. Advancement along these research paths and others is needed to ensure future transportation systems enjoy the benefits of both SDVs and active transportation.
Footnotes
Acknowledgements
We would like to acknowledge the time and input of the study participants, as well as members of the UBC REACT Laboratory and the TransLink New Mobility Laboratory. We would also like to thank the reviewers for their suggestions to improve the manuscript.
Author Contributions
The authors confirm contribution to the paper as follows: study conception and design: A. Bigazzi, E. Bardutz, J. Honey-Rosés, G. Gill; data collection: A. Bigazzi, E. Bardutz, J. Honey-Rosés, G. Gill; analysis and interpretation of results: A. Bigazzi, E. Bardutz, J. Honey-Rosés, G. Gill; draft manuscript preparation: A. Bigazzi, E. Bardutz, J. Honey-Rosés, G. Gill. All authors reviewed the results and approved the final version of the manuscript.
Declaration of Conflicting Interests
The author(s) declared no potential conflicts of interest with respect to the research, authorship, and/or publication of this article.
Funding
The author(s) disclosed receipt of the following financial support for the research, authorship, and/or publication of this article: This research was funded by TransLink and the Social Sciences and Humanities Research Council of Canada (SSHRC), with additional support from the City of Vancouver. J. Honey-Rosés was supported by the Ramón y Cajal Fellowship (Ministerio de Ciencia y Universidades RyC-2019-027279-I) and this work contributes to ICTA-UAB “María de Maeztu” Programme for Units of Excellence of the Spanish Ministry of Science and Innovation (CEX2019-000940-M).
The views expressed in this paper are those of the authors and do not represent the views of the project funders.