
Abstract
This study comprehensively explores static and dynamic occlusion issues in urban scenarios, focusing mainly on their interplay with the rising prevalence of connected automated vehicles (CAVs). We propose a unique methodology for pinpointing static and dynamic occlusions and examining the impacts of CAVs that integrate collective perception in their sensing systems. A crucial aspect of our investigation is identifying a critical point concerning the CAV penetration ratio, past which dynamic occlusion ceases to exert significant influence. Based on our investigation, a penetration rate of around 34% seems to alleviate the problems associated with dynamic occlusions. Nonetheless, our research also uncovers that issues related to static occlusion may endure even with increased CAV penetration levels, thus requiring additional mitigation approaches. Furthermore, this study broadens the understanding of static and dynamic occlusion, creating a new metric to explain the level of visibility in urban areas. The framework applied in our evaluations is disclosed in conjunction with this paper. This research represents a substantial advancement in understanding and improving the operation of CAVs in occluded scenarios.
Keywords
The field of automated vehicles (AVs) is rapidly advancing, with a significant amount of research primarily focusing on their deployment and performance in highway settings ( 1 ). However, there is a critical need to extend this focus to urban environments, as the impact of AVs on urban mobility is a relatively understudied research area ( 2 ). Operating in urban settings presents AVs with numerous challenges, including increased densities of vulnerable road users (VRUs) such as pedestrians and cyclists, complex road infrastructures, and frequent occlusions. As the Society of Automotive Engineers levels of automated driving advance from level 3 to 5, the operational design domain (ODD) will become more complex ( 3 ). While at level 3, the ODD is defined by a controlled environment; higher levels of automated driving will include ODDs defined for urban areas, which will lead to the integration of VRUs ( 4 ).
The challenges for connected automated vehicles (CAVs) operating in urban environments are manifold. As per Staubach, the most common errors committed by human drivers involve factors such as distraction, fatigue, medication, lighting conditions, occlusion, attention focus, and traffic violations ( 5 ). Among these, occlusion exhibits the highest influence on accidents occurring at urban junctions. Notably, most of the issues cited can be mitigated using driver assistance systems and, in certain cases, roadside infrastructure ( 6 ). However, occlusion poses a unique challenge—as it arises from the situational context and not human error, it will persist as a substantial concern.
Occlusion, which is defined as a state where an object or sensor’s field of view (FoV) is obstructed by physical barriers such as stationary vehicles or buildings, poses a significant impediment for vehicles in urban environments ( 7 ). Despite the potential of AVs to alleviate some limitations intrinsic to human driving, such as attention deficits, occlusion remains a major hurdle in ensuring the safety of all road users ( 8 ). By utilizing CAVs for collective perception—leveraging the individual sensing systems of each vehicle—occlusion can be mitigated by collectively observing the urban environment.
This paper addresses the critical issue of occlusion in urban settings for AVs or CAVs and identifies potential strategies to recognize specific types of occlusion and corresponding areas. Through an analysis of the current state of CAV occlusion research and its impact on CAV performance in occlusion scenarios, this study will contribute to the collective body of knowledge aiming to create safer urban transportation systems.
The subsequent sections will provide a comprehensive literature review pertaining to occlusions in the context of CAVs. We will present a robust methodology for evaluating occlusions in urban scenarios and discuss the results and implications of our study. A critical objective of this research is to contribute to the existing definitions of dynamic and static occlusion, thereby providing a foundation for further discussion on this topic. In the concluding part, we will analyze the penetration rate of CAVs in urban environments and discuss their impact on occlusions. This analysis introduces our novel level of visibility (LoV) metric, a tool we developed to define and measure visibility in urban areas. Through this metric, we aim to provide a quantitative measure to improve the effectiveness and safety of CAVs in urban contexts.
Literature Review
This section reviews the current state of research on occlusion in the context of AVs and CAVs in urban traffic. First, we present studies on how AVs and CAVs can manage occlusion in urban environments and how occlusion can be mitigated by roadside infrastructure sensing systems. This introduction is followed by a discussion on the taxonomy of occlusion and a short outline of the highlights of our work.
Managing Occlusion
Numerous studies address the issue of occlusion for AVs. The purpose of occlusion-aware maneuver planning is to make the vehicle drive safely yet efficiently ( 9 ). This means that the vehicle should be able to react safely if a road user appears from an occluded area, but without driving overly slowly and cautiously when approaching an urban junction. Lin et al. discuss decision-making in occluded junctions, considering static and dynamic obstacles ( 10 ). A general approach using a partially observable Markov decision process (POMDP) is proposed and customized for autonomous driving. The experiments demonstrate that the proposed approach enables AVs to exhibit human-like driving behavior when facing occlusions. Hubmann et al. propose a POMDP-based behavior planner that explicitly considers occluded vehicles in urban environments ( 11 ). By predicting the future FoV and considering occlusions generated by static and dynamic objects, the planner can generate optimized policies for various urban driving scenarios that allows AVs to approach occluded areas less conservatively than a baseline strategy.
Müller et al. include external perception from infrastructure-mounted sensors to resolve occlusions ( 12 ). Their work addresses the challenge of motion planning at urban junctions by using a sampling-based optimization approach that combines set-based methods and probabilistic approaches. Their motion planning scheme provides safety guarantees and is validated through real-world experiments. Pechinger et al. show that CAVs in fact greatly benefit from roadside infrastructure support ( 8 ). Using an advanced submicroscopic 3D hardware-in-the-loop simulation framework, they demonstrate that, when roadside infrastructure support is available, maneuver time is reduced, and traffic efficiency is increased by 19.8% on average.
Nevertheless, the widespread installation of roadside infrastructure to support AV decision-making might not be financially justifiable at every junction. Moreover, over-roadway sensors also face occlusion problems ( 13 ).
The objective of this study is to elucidate the concepts of dynamic and static occlusion while highlighting their implications within a geospatial context.
Taxonomy of Occlusion
In a comprehensive review article on overcoming occlusion in the automotive environment, Gilroy et al. identify occlusion as one of the most formidable challenges for automated driving ( 4 ). Their work categorizes occluded objects based on the degree of obscurity, identifying objects as partially or heavily occluded, or fully occluded when they are entirely concealed by another object. They show that state-of-the-art vehicle detection algorithms can achieve detection rates of approximately 80% and 90% for heavily and partially occluded objects, respectively. For VRUs such as pedestrians and cyclists, the detection rate falls to about 65% to 75%, which further emphasizes the critical need for further research in this area. Li et al. have put forth an occlusion taxonomy that outlines three distinct levels of occlusion: not occluded, partially occluded, and heavily occluded ( 14 ). These gradations are symbolized as levels 0 to 2 and are detailed in Table 1a. Building on their foundational work, our study introduces an additional level, signifying complete occlusion. This augmentation fills a gap as there is no comprehensive definition for complete occlusion in the existing literature (refer to Table 1a). Through this, we aim to provide readers with a holistic understanding of the concept and degrees of occlusion.
Definitions of Occlusion Used in this Work
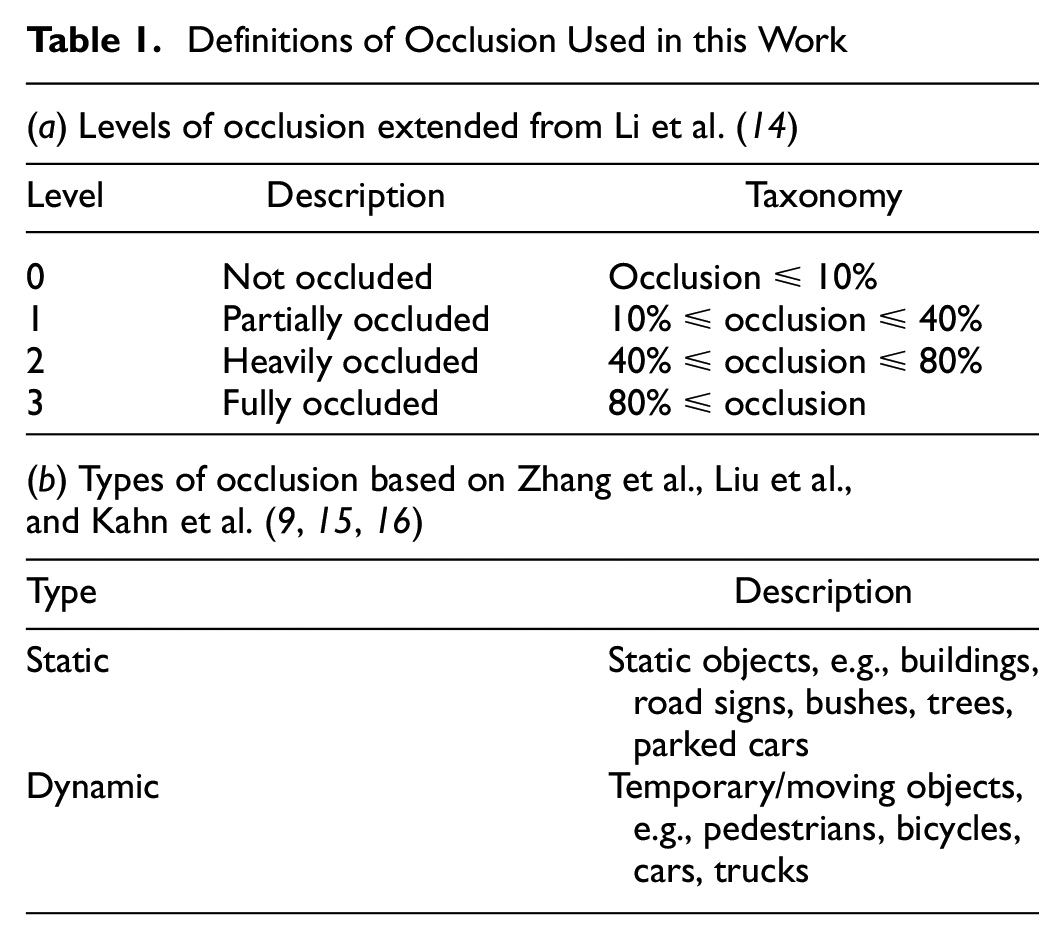
Several studies distinguish occlusion into two primary categories: dynamic and static occlusion ( 9 , 15 , 16 ). Others prefer to classify objects themselves as either static or dynamic ( 17 ). Our research aligns with these established classifications, as detailed in Table 1b. Kahn et al. observe that much of the prevailing literature predominantly emphasizes static occlusion when evaluating occlusion risks ( 16 ). This focus has inadvertently led to a noticeable research gap concerning dynamic occlusion. Furthermore, Kahn et al. contend that gleaning insights from static occlusion analysis to address challenges posed by dynamic occlusion is not a pragmatic approach ( 16 ). However, there is potential to assess dynamic objects in a pre-emptive manner, even before their actual encounters in real-world driving scenarios. A method introduced by Yu et al. utilizes a metric named “meta-collision rate” to assess and identify dynamic occlusion, exemplifying this very potential ( 7 ). Building on this, our research also taps into road network data and microscopic traffic simulations to derive insights into dynamic occlusion within road networks.
Contributions
In contrast to the above-mentioned literature, our work leverages simulations to dynamically evaluate occlusion by integrating traffic flow data with vehicular positional information. By simulating many vehicle trajectories and their respective FoVs, this approach allows us to identify dynamic occlusion hot spots before the actual occlusion event. Through the result analysis and visualization, the definition of occlusion for vehicles in urban environments is extended by introducing our new metric: LoV. Furthermore, the effects of shared sensor information from an increasing number of CAVs on the extent of static and dynamic occlusion are analyzed and discussed. Finally, the presented occlusion evaluation framework is published on GitHub ( 18 ).
System Setup
An occlusion evaluation software using Matlab was developed to evaluate static and dynamic occlusions. The input for this software uses microscopic traffic simulation data generated by Aimsun Next. The methodology comprises three main steps: 1) running a microscopic
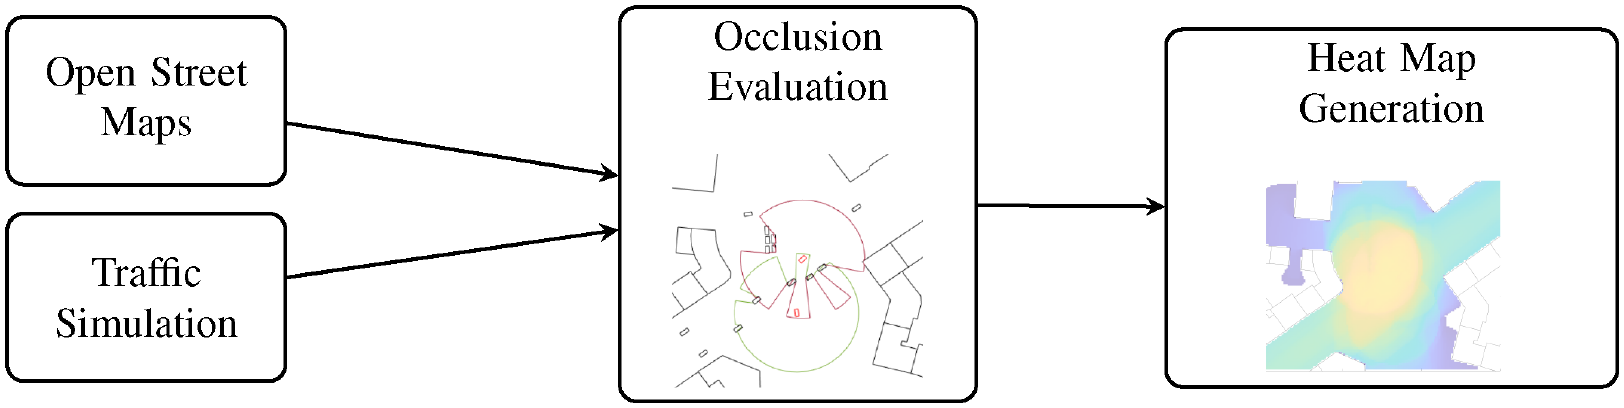
Overview of the framework used for occlusion evaluation in this work.
Traffic Simulation
A microscopic traffic simulation is carried out for a junction, with the vehicle positions being collected throughout the simulation. These data are saved in an xml file which can be accessed on a frame-by-frame basis. The Aimsun simulation operates at a frequency of 10 Hz, resulting in a temporal and spatial resolution that provides vehicle bounding boxes and positions every 100 ms.
Occlusion Evaluation
The dataset extracted from the vehicle movements within the traffic network serves as the foundation for examining occlusions created by moving entities. A basic ray-tracing technique is employed for this evaluation. This method comprises projecting a series of rays surrounding each CAV in the simulation. These rays depict the FoV of the CAV and are referred to as FoV-Ray. A graphical depiction of the process for the algorithm for a single CAV is illustrated in Figure 2, which is divided into four distinct sections. This ray-based detection is used to detect occlusion in a 2D space and is independent of sensing technologies. Therefore, for example, a camera or lidar may be used in the actual vehicle. Figure 2d highlights that static objects and buildings contribute to static occlusion.
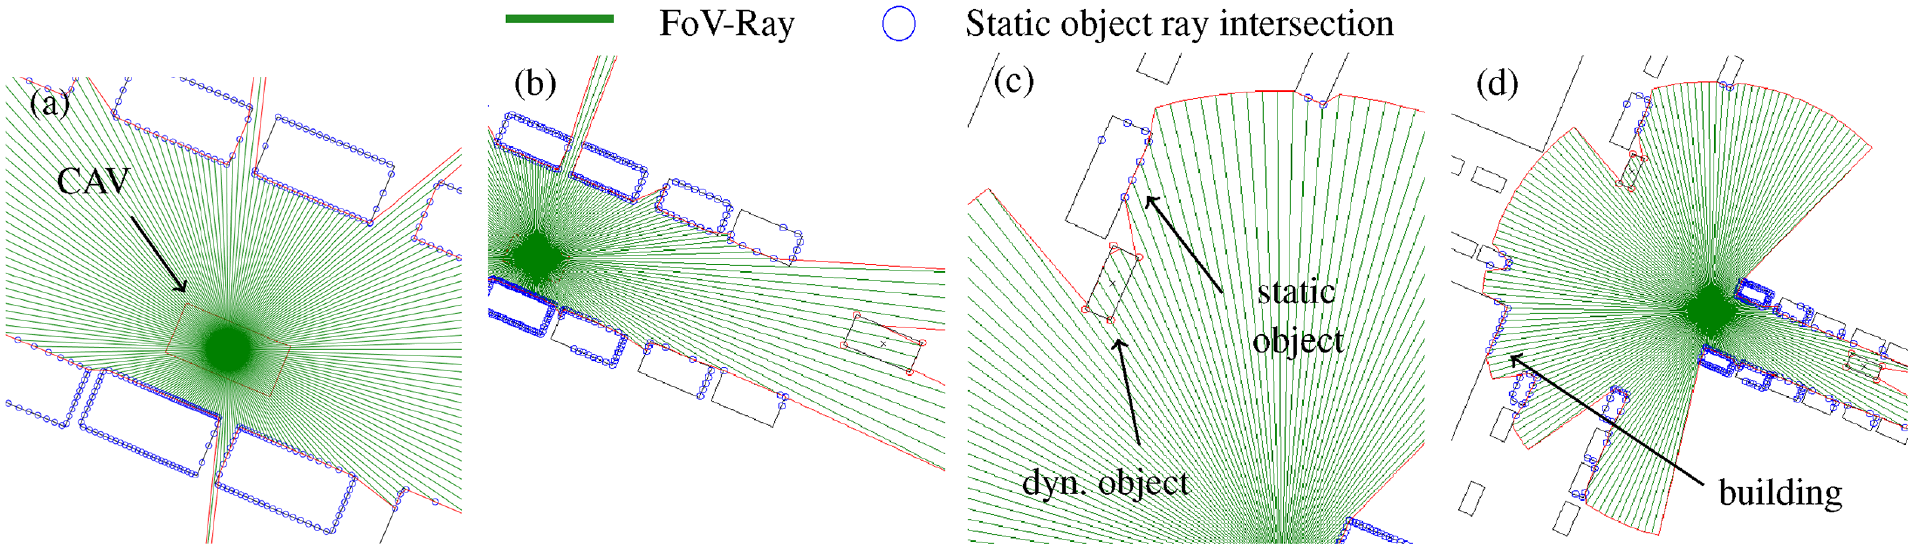
Detailed visualization of the simulation evaluation system, showing the field of view that results from the ray-tracing (FoV-Ray) approach. Subfigures a, b, c, and d represent different simulation scenarios, highlighting specific features of the architecture.
Heat Map Generation
From the ray-tracing procedure, we obtain a FoV contingent on a maximum radius, which results in a circular shape for the detection area. This is visually represented by the red circular shapes, which collectively define the CAV’s total FoV. Figure 3a displays the approach for occlusion evaluation in a bird’s-eye view of a junction, incorporating cars and buildings. The occlusion for a specific timestep on the left is depicted based on all vehicles and structures in the road network at that moment. Small black boxes symbolize manually-operated vehicles which lack environment-sensing technology and thus create dynamic occlusion for CAVs. Small red boxes represent the CAVs which are currently operating in the road network.
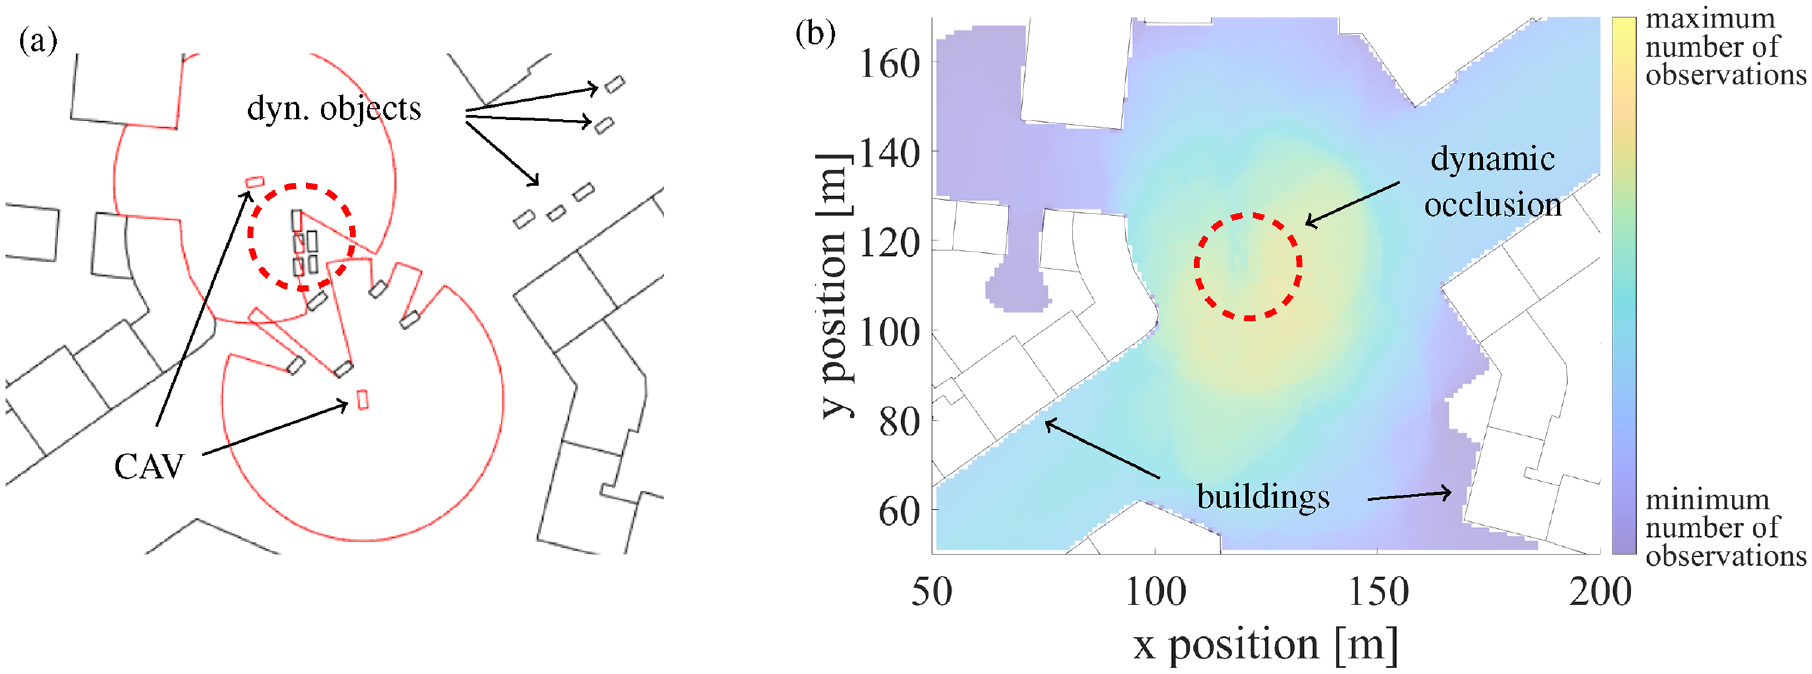
Side-by-side image of: (a) the simulation and (b) a generated heat map.
Figure 3b presents a resulting heat map generated from a binning map. The bright yellow regions signify areas with the highest frequency of CAV observations, while the darker, blue-tinted areas represent the regions with the lowest number of observations. The setup for the binning map is detailed in the “Binning Map Setup” section below.
Within Figure 3, two red dashed circles are visible. These represent spots in the road space that are dynamically occluded—a consequence of dynamic objects traversing the junction.
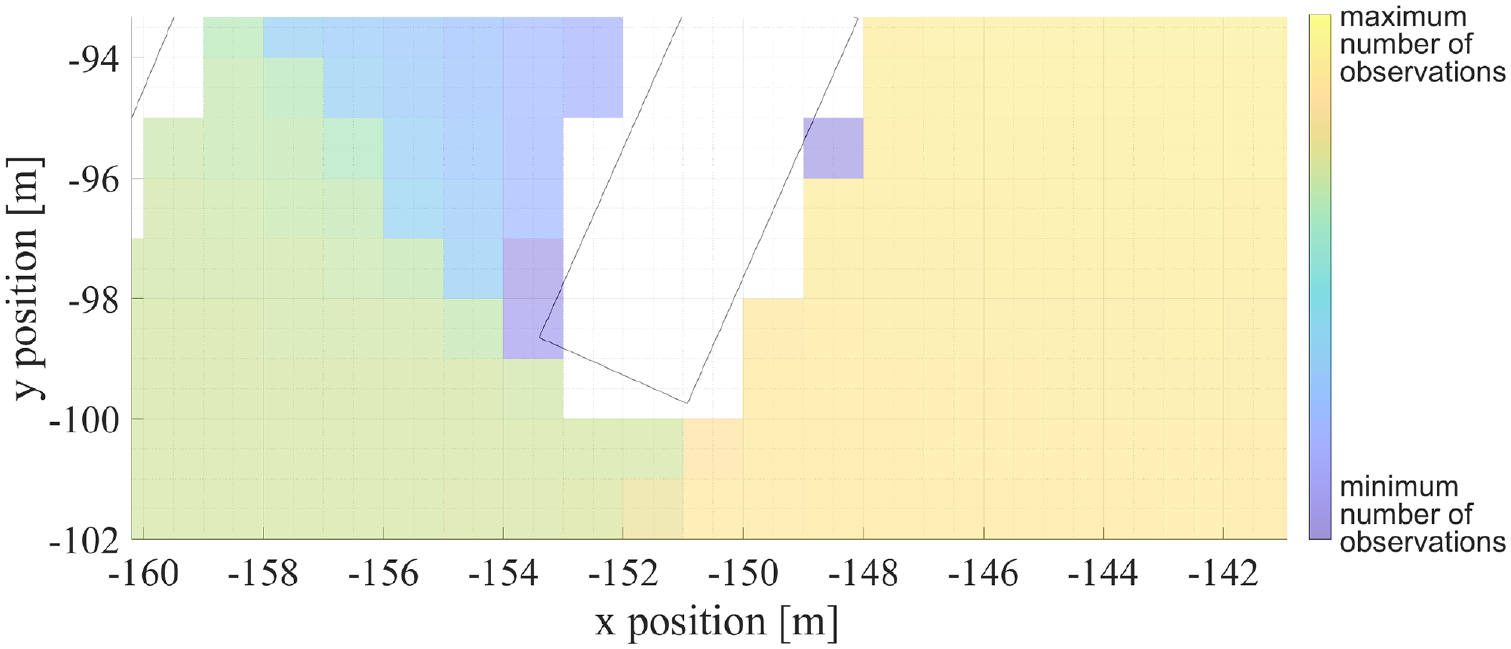
Closeup image of the binning map with a resolution of 1 m.
An interesting anomaly can be seen at the coordinates x = −148 m and y = −96 m, where an outlier exists. This irregularity arises from an overlap between the stationary object and the roadway, as well as the resolution chosen for the simulation. Throughout the ray-tracing process, this particular spot was intermittently observed by some vehicles from specific positions. Such irregularity could be mitigated by opting for a higher binning map resolution; however, this would invariably lead to increased simulation times. We decided to accept this compromise, as it made it possible to obtain reliable results without excessively prolonging the simulation duration.
Effect of Occupation versus Occlusion Consideration
From previous figures, it is apparent that we have considered a distinct methodology for evaluating occlusion within our framework. Figure 5 illustrates the divergence in outcomes between these two methodologies. In the upper part of Figure 5a, the area occupied by a moving object is shown as occluded (Approach A), while Figure 5b does not consider the occupied area as occluded (Approach B). By comparing the heat maps provided by Figure 5, a and
b
, it is possible to observe that Figure 5a displays a slightly blue spot in the heat map’s center, whereas Figure 5b does not. This is a direct consequence of our occlusion evaluation technique. Our goal is to consider actual occluded spaces that could be used by another road user. Figure 5a depicts a blue spot in the heat map because many vehicles are dynamically halting there and
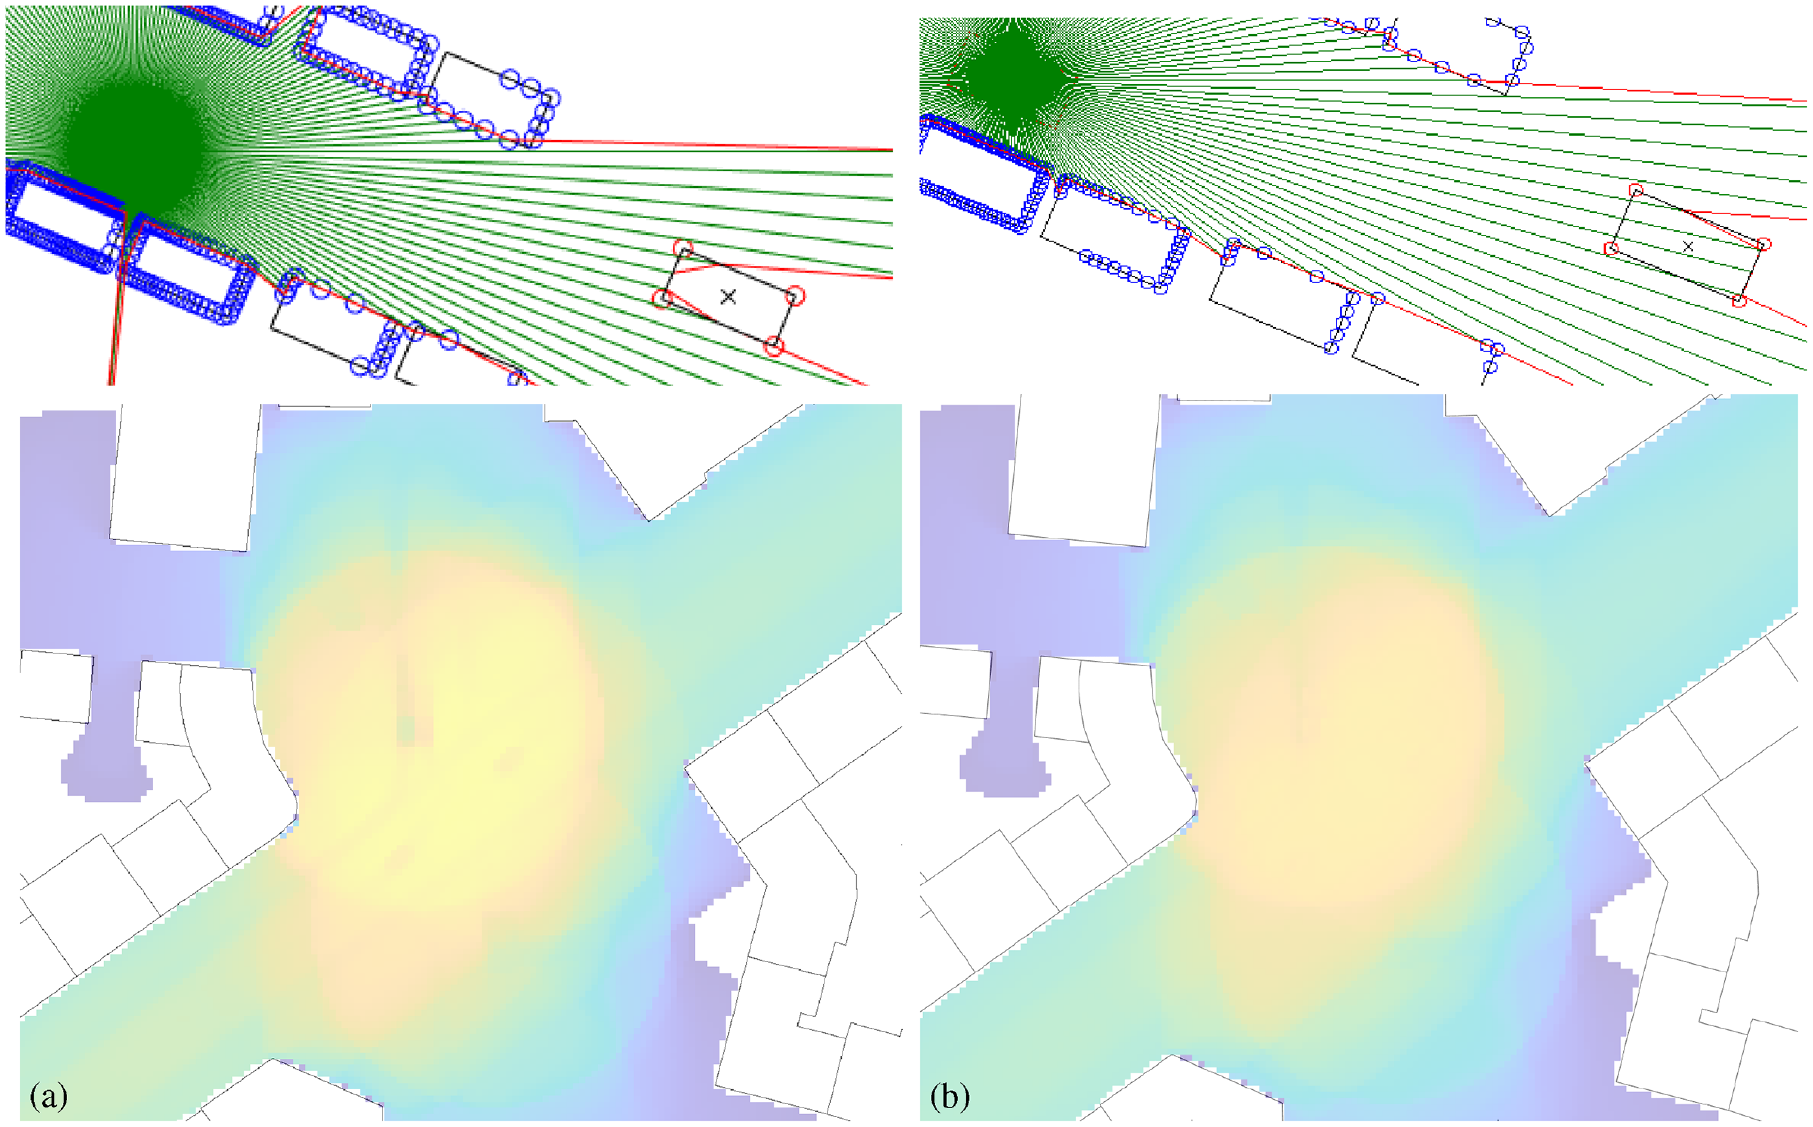
Comparison of two different occlusion estimation strategies, showing the difference in the ray-tracing approach and the resulting heat map: (a) Approach A—indicates occupied space of a dynamic object that creates occlusion and (b) Approach B—highlights occupied space of a dynamic object that does not create occlusion.
Setup Summary
The heat map, created through our framework, can expose dynamic occlusions within a road network. It does so by executing a microscopic traffic simulation of a road network, evaluating occlusion derived from the generated data, and subsequently generating an occlusion heat map. In essence, this methodology facilitates the assessment of static and dynamic occlusions in urban junctions. By modifying the penetration rate of CAVs, it makes it possible to evaluate the impact of different mixed-traffic situations. The system simulation is described in more detail in the next section.
System Simulation
Our simulation setup employs two junctions specifically chosen to assess static and dynamic occlusion. Consequently, the study is divided into two parts: initially, an examination of static occlusion considers the prevalent issue of parked cars and buildings, followed by an analysis of the more intricate case of dynamic occlusion.
The selection of the junctions for the static occlusion study was informed by visual analyses, primarily pinpointing significant static occlusion resulting from parked vehicles. While other junctions could have been evaluated, this particular one demonstrated the relevant occlusion. The second junction was chosen based on clustered open accident data from Unfallatlas, which exposed a significant concentration of cyclist accidents ( 20 ). We particularly chose bicycle accidents as they account for the highest share (34.8%) of accidents considering urban crossings. The next VRU group that is inflicted by accidents inside urban junctions are pedestrians with 8.5% ( 6 ). In summary, we can see that occlusion is a significant driver of accidents and that bicyclists have the highest share in urban junctions accidents.
We clustered bicycle accidents using a distance-based clustering from Macron ( 21 ). Our utilization of the clustering framework can be found on GitHub (https://github.com/MathiasPechinger/MatlabAccidentClustering). The clustering used accident data from 2016 to 2020 in the area of Munich, Germany. We achieved the derivation of nine clusters for Munich, showing a mean cluster size of 23.4 accidents. Despite a comprehensive investigation, the frequent accidents at the junction at the “Goetheplatz” location remained unattributable to a discernible cause, leading to a further investigation of this specific junction in this work.
Table 2 provides a concise summary of the essential simulation parameters. Our simulation framework is designed with the flexibility to adjust the CAV penetration rates
Simulation Parameters
The traffic flows in our study are based on insights of Pechinger et al. for static occlusion and Dandl et al. for dynamic occlusion ( 8 , 23 ). In our work, a sub-microscopic hardware-in-the-loop (HIL) test was conducted to consider a small number of sensors ( 8 ). This work, in contrast, utilizes several magnitudes more sensors which significantly affects the feasibility of HIL simulations, resulting in the given setup. We configured both junctions to handle a demand of approximately 800 vehicles per hour on the major road. For the static occlusion scenario, we utilized a signalized junction, leveraging an existing model. For the dynamic occlusion, we omitted junction signalization. We acknowledge the potential limitations of this decision for the dynamic scenario. Nevertheless, it is paramount to highlight that our traffic flows remained unhindered and smooth. This is attributed to the adept driving models used in our simulations, which can navigate simulated agents efficiently, circumventing the typical challenges associated with human-driven behavior and the comparatively moderate demand. To capture a true-to-life urban setting for the occlusion simulations, we sourced building data from OpenStreetMap.
Simulation Evaluation
This section provides the evaluation of two scenarios, focusing on static and dynamic occlusion, based on the simulation approach detailed in the previous section.
Static Occlusion
Static occlusion remains a salient concern within urban transportation frameworks, as evidenced by literature. The scope of the present evaluation on static occlusion is narrowed to a specific junction proximate to the Technical University of Munich. In this evaluative paradigm, parked vehicles are integrated into the road network and occlusion is evaluated.
The outcomes, in relation to CAV penetration rates, are graphically represented in Figure 6. To maintain conciseness and ensure clarity, only selected images are presented: the reference penetration rate denoted with
Heat maps from the static occlusion simulation for increasing connected automated vehicle penetration rates
Figure 7 presents our definition of static occlusion: areas in the binning map that have low observation counts, given in blue on the left side of the vehicle, and are close to a static object, represent objects that cause
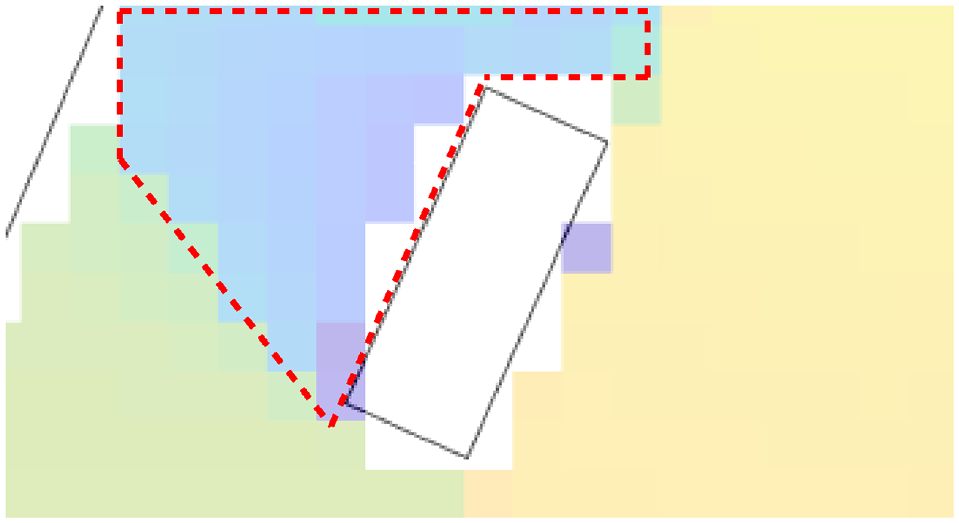
A heat-map-based representation of static occlusion, highlighted by the area inside the dashed red lines.
However, a potential solution could involve empowering CAVs with external power to facilitate the constant sharing of their data. We delve deeper into this subject in the Conclusion section of this paper.
Dynamic Occlusion
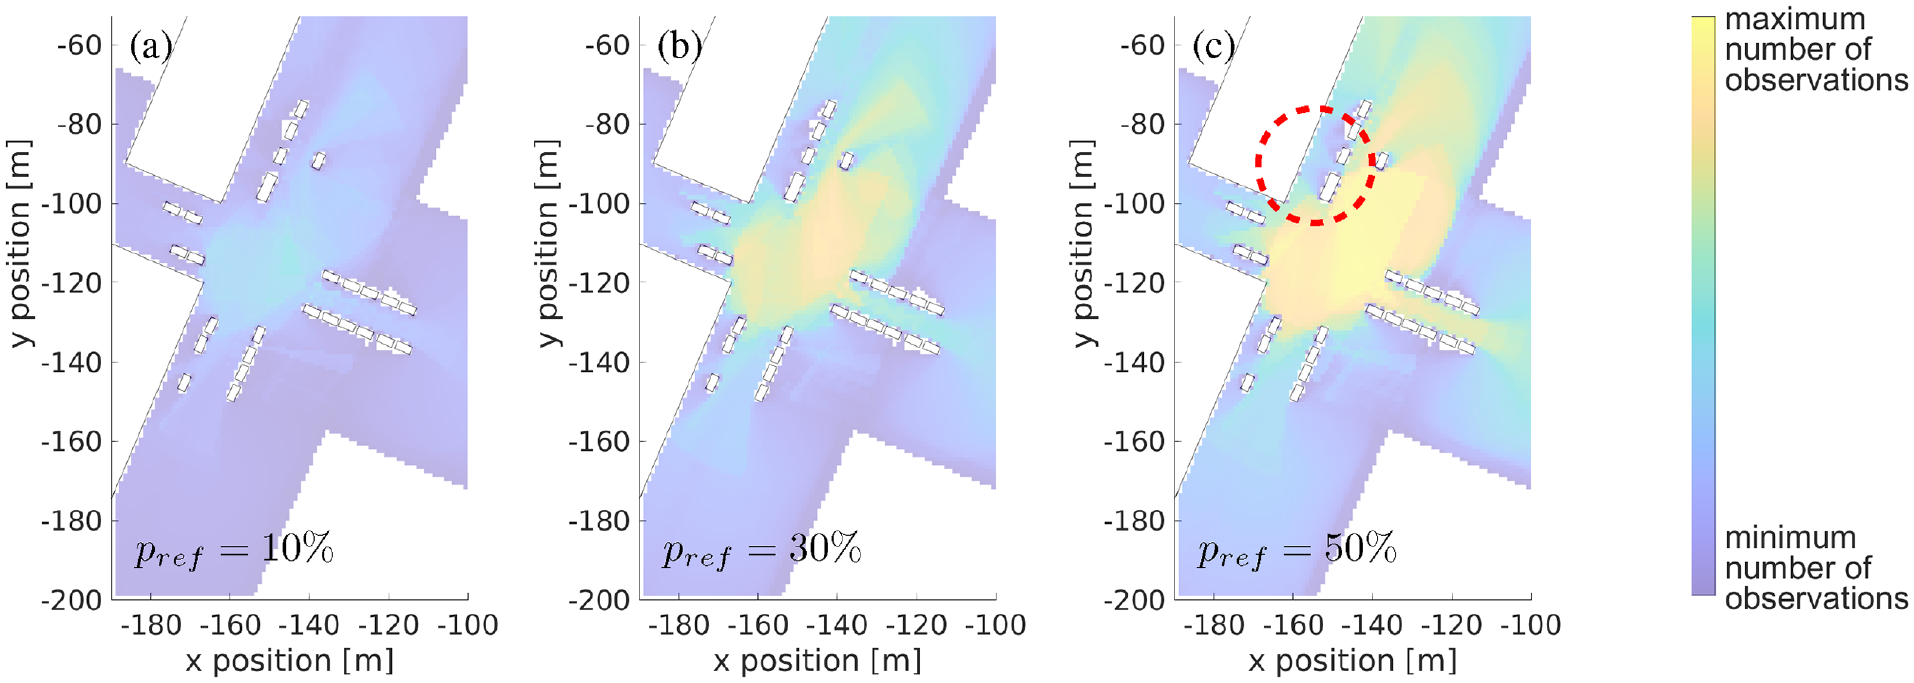
A junction characterized by a high rate of bicycle accidents, as identified within accident clustering, was chosen for a focus on dynamic occlusion analysis. An example of the simulation can be seen in Figure 3a, indicating two CAVs and dynamic objects. Importantly, this particular junction does not display significant occlusion caused by elements such as buildings or parked cars based on visual observation. The occlusion simulation was performed with varying CAV penetration rates, operating on the hypothesis that dynamic occlusion would become less apparent at certain CAV penetration rates within the road network. Beyond a specific threshold, the density of CAVs would be high enough that dynamic occlusion would no longer be observable, as, ideally, occlusion should be eliminated when all vehicles are sharing their data.
Figure 8 presents heat map results for CAV penetration rates ranging from 10% to 100%. Substeps that do not show significant differences were omitted. Starting with Figure 8a for
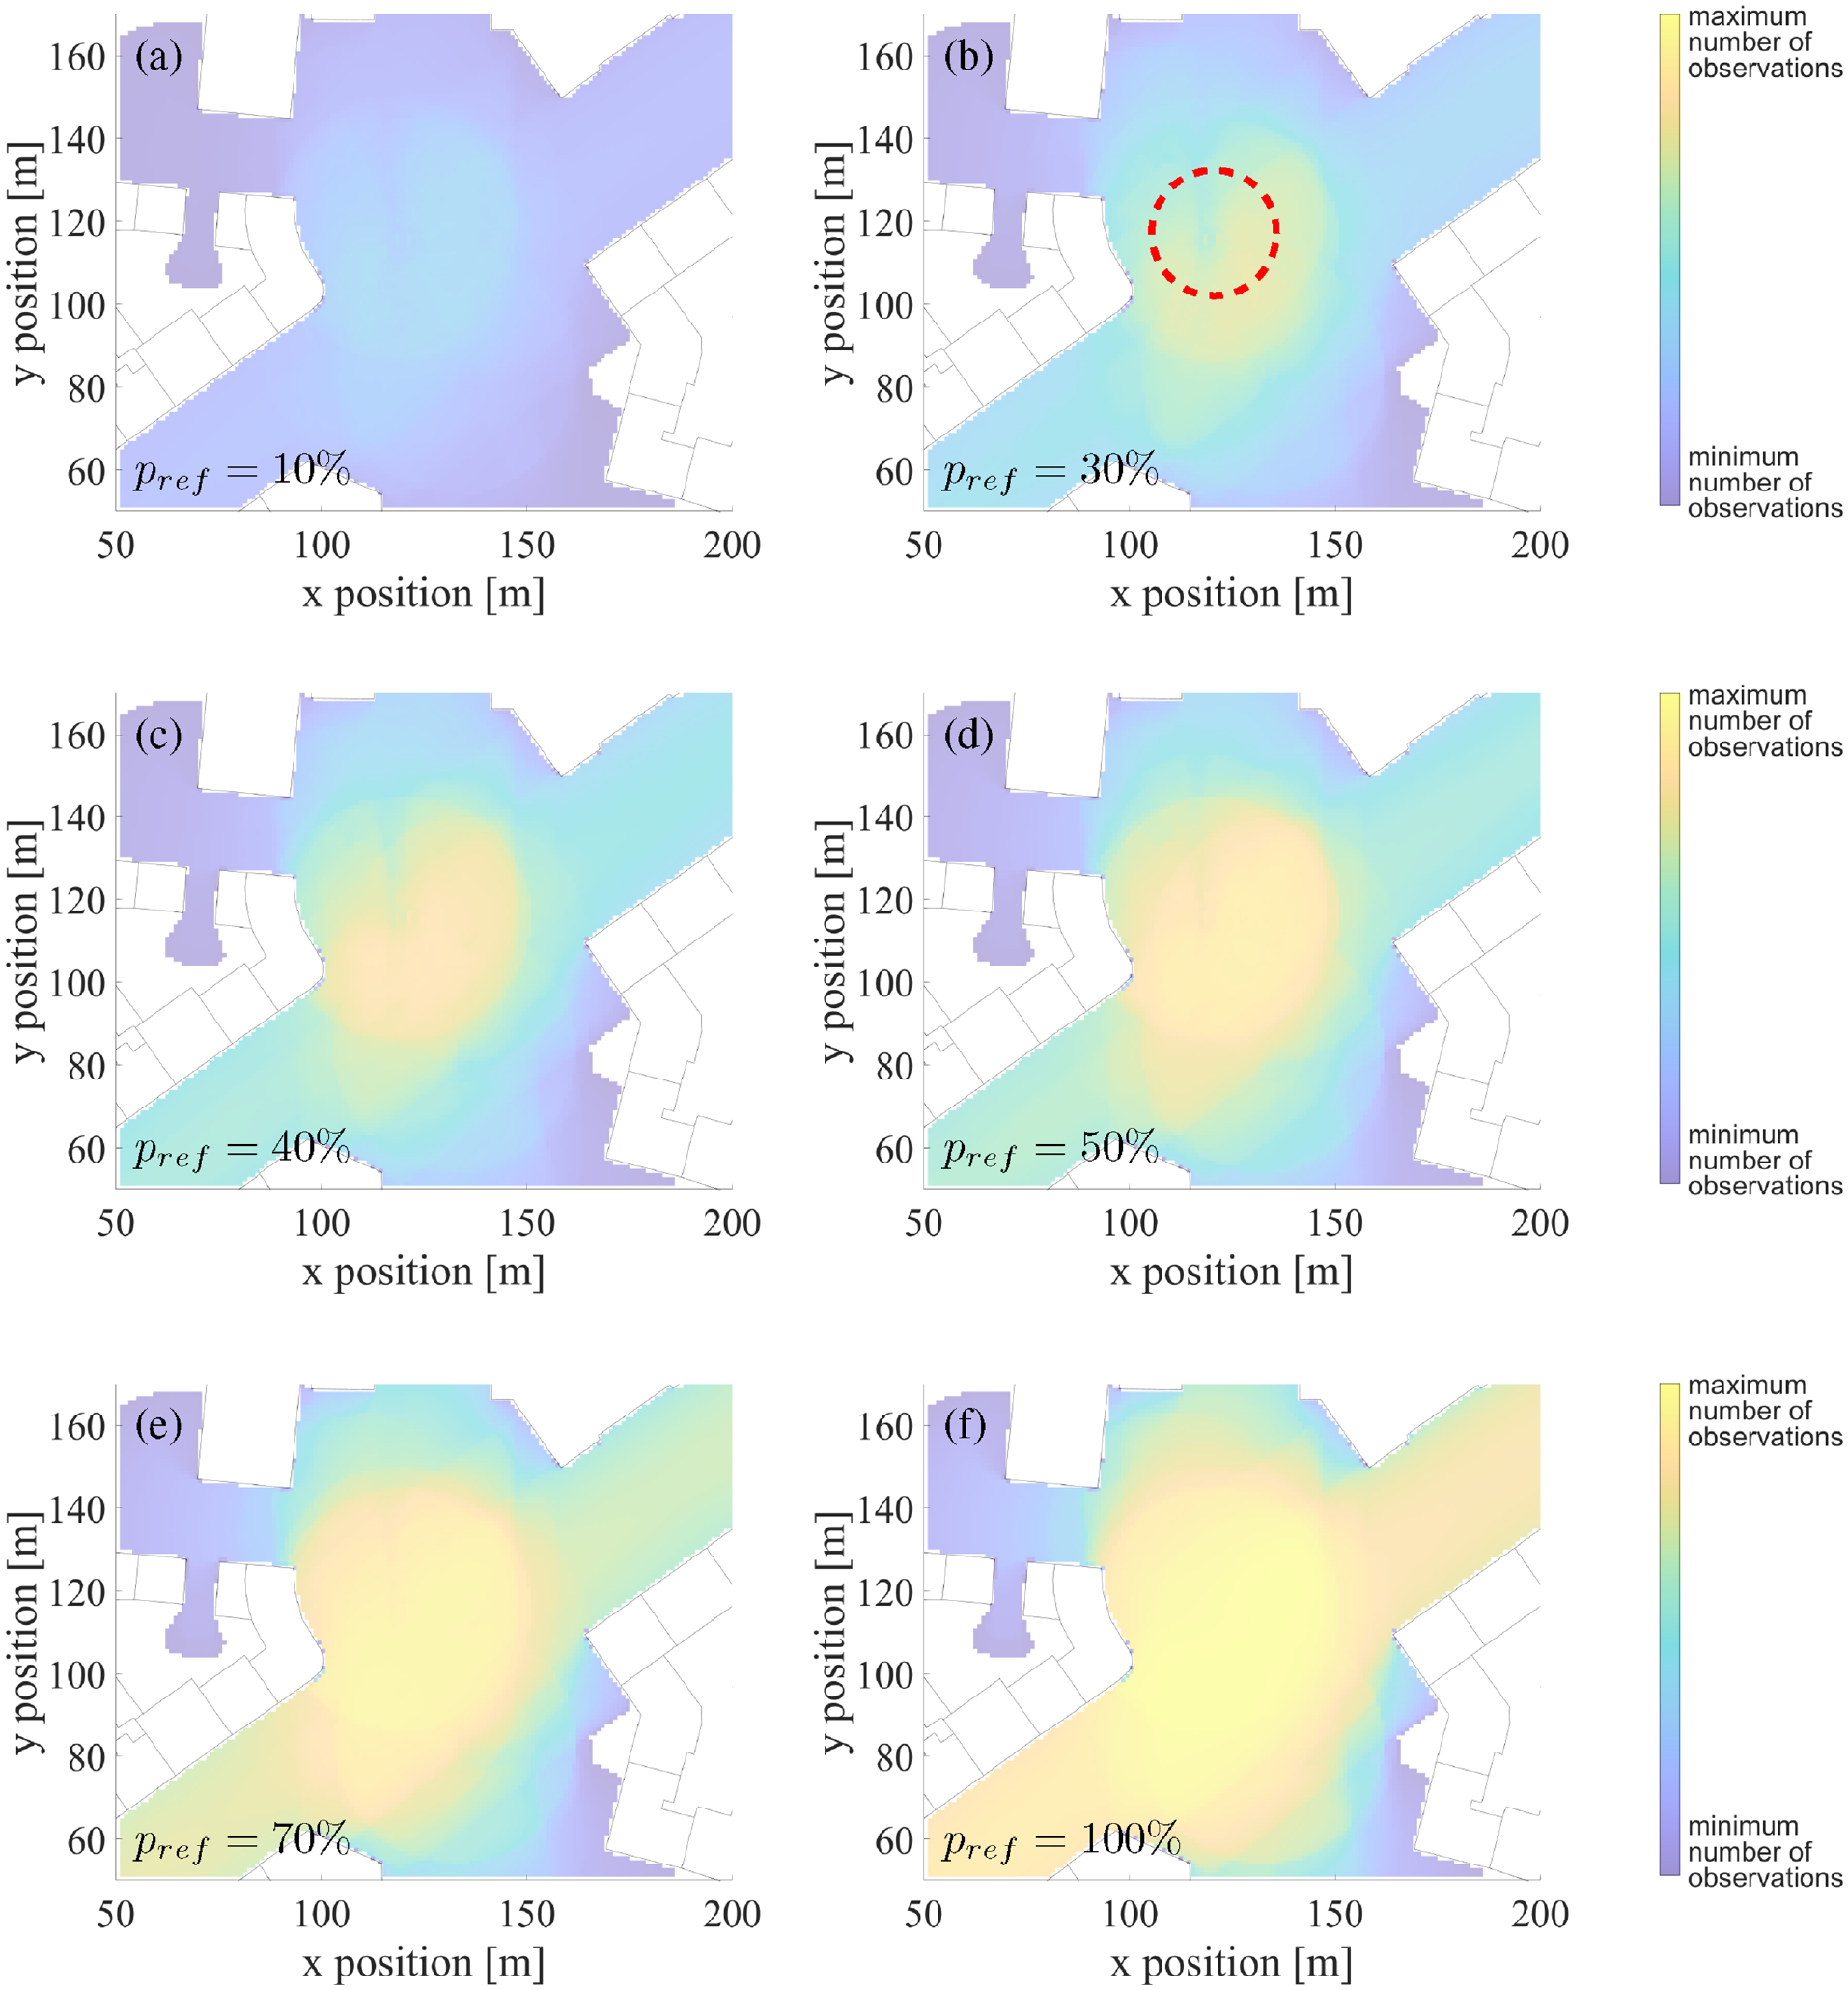
Heat maps from the dynamic occlusion simulation for increasing connected automated vehicle (CAV) penetration rates
To further evaluate the impact of the CAV penetration rate on dynamic occlusions, we introduce the observation rate
Figure 9 shows the bin observation rate in relation to the maximum and median values for the assessed penetration rates. Understanding the relationship between the median observation rate and the maximum observation rate is crucial. The heat maps show that minor roads subjected to low demand aren’t observed as frequently as junction areas. This discrepancy influences the median observations such that a relatively linear increase can be observed when examining the relationship between
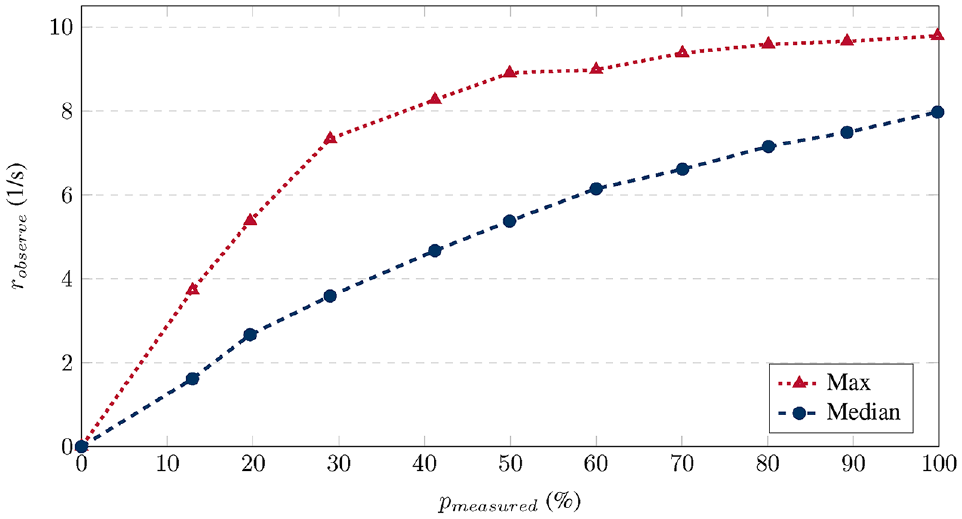
An overview showing the bin observation rate over the connected automated vehicle penetration rate.
Occlusion—Level of Visibility (LoV)
Utilizing the observation rate, visibility within the road network becomes more comprehensible. Drawing on the insights from the maximum observation rate and our investigations into the CAV penetration rates, we introduce a novel metric: LoV.
A distinctive aspect of this metric, setting it apart from others, is its capacity to account for mixed traffic scenarios, incorporating both human-operated vehicles and CAVs. Compared with a heatmap, LoV enables comparability between junctions and an easy-to-grasp visualization of the occlusion situation for the junction as a whole. This measure captures the inherent complexity of mixed-traffic environments, providing a nuanced understanding of visibility conditions that reflects the interaction and potential visibility constraints between different types of road user. This contribution represents a crucial step forward in developing holistic and realistic evaluations of visibility in urban traffic environments.
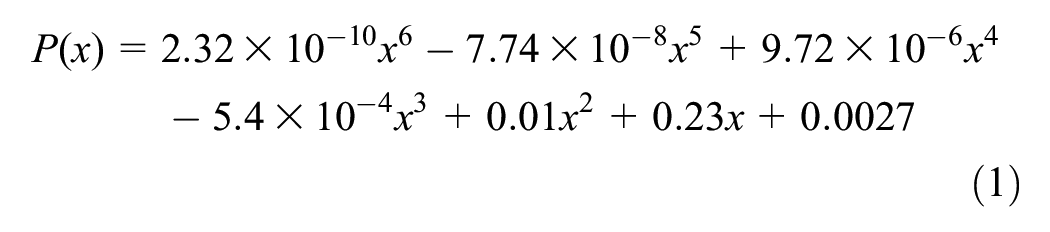
We have fitted a sixth-order polynomial
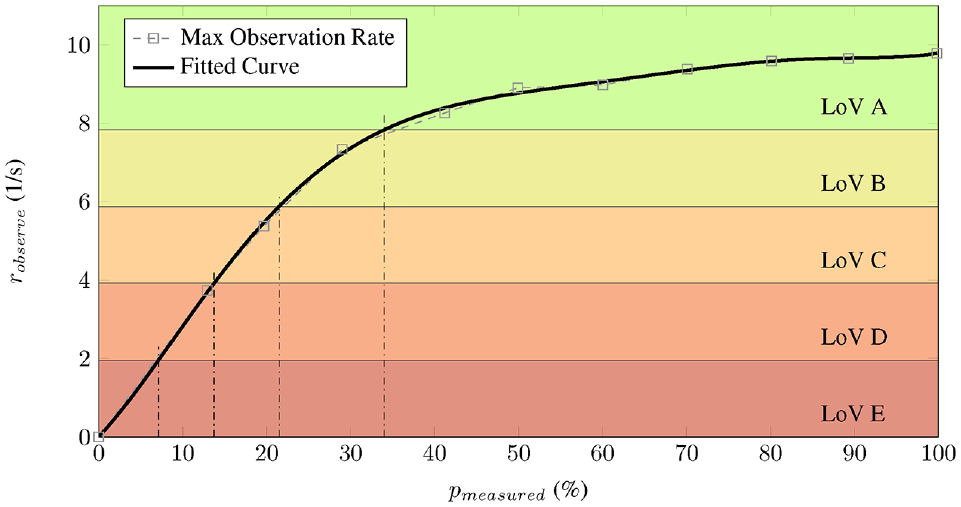
Visualization of the fitted curve and simulation results, with respect to the level of visibility (LoV) metric.
Leveraging the polynomial-fitted curve, we established thresholds for the LoV metric. These thresholds are determined based on the maximum observation rate reached at
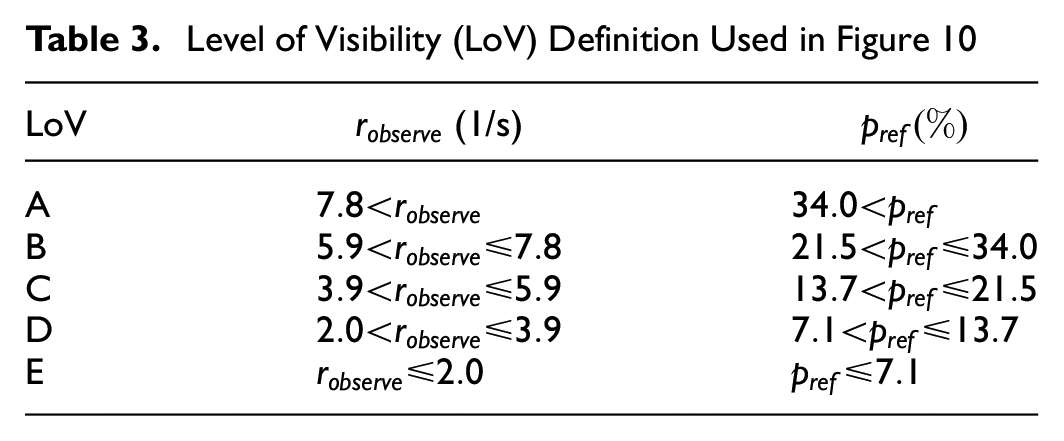
Level of Visibility (LoV) Definition Used in Figure 10
In Figure 11, the spatial progression of LoV is depicted, ranging from 10% to 100% penetration rate. Notably, the representation at 90% has been omitted because of the lack of significant changes. Figure 11a accentuates a dynamically occluded zone, demarcated by a red dashed circle. The regions posing the most challenges within this marked area correspond to LoV D, surrounded by territories characterized by LoV C. As we move to Figure 11b, we can see the emergence of LoV A. This LoV A designation steadily broadens with each increment in penetration rate up to the 100% scenario shown in Figure 11i. Given our estimation that a CAV penetration rate of 34% is requisite to attain LoV A, it is observable in Figure 11c that the junction area is thoroughly enveloped, signifying saturation in relation to observability.
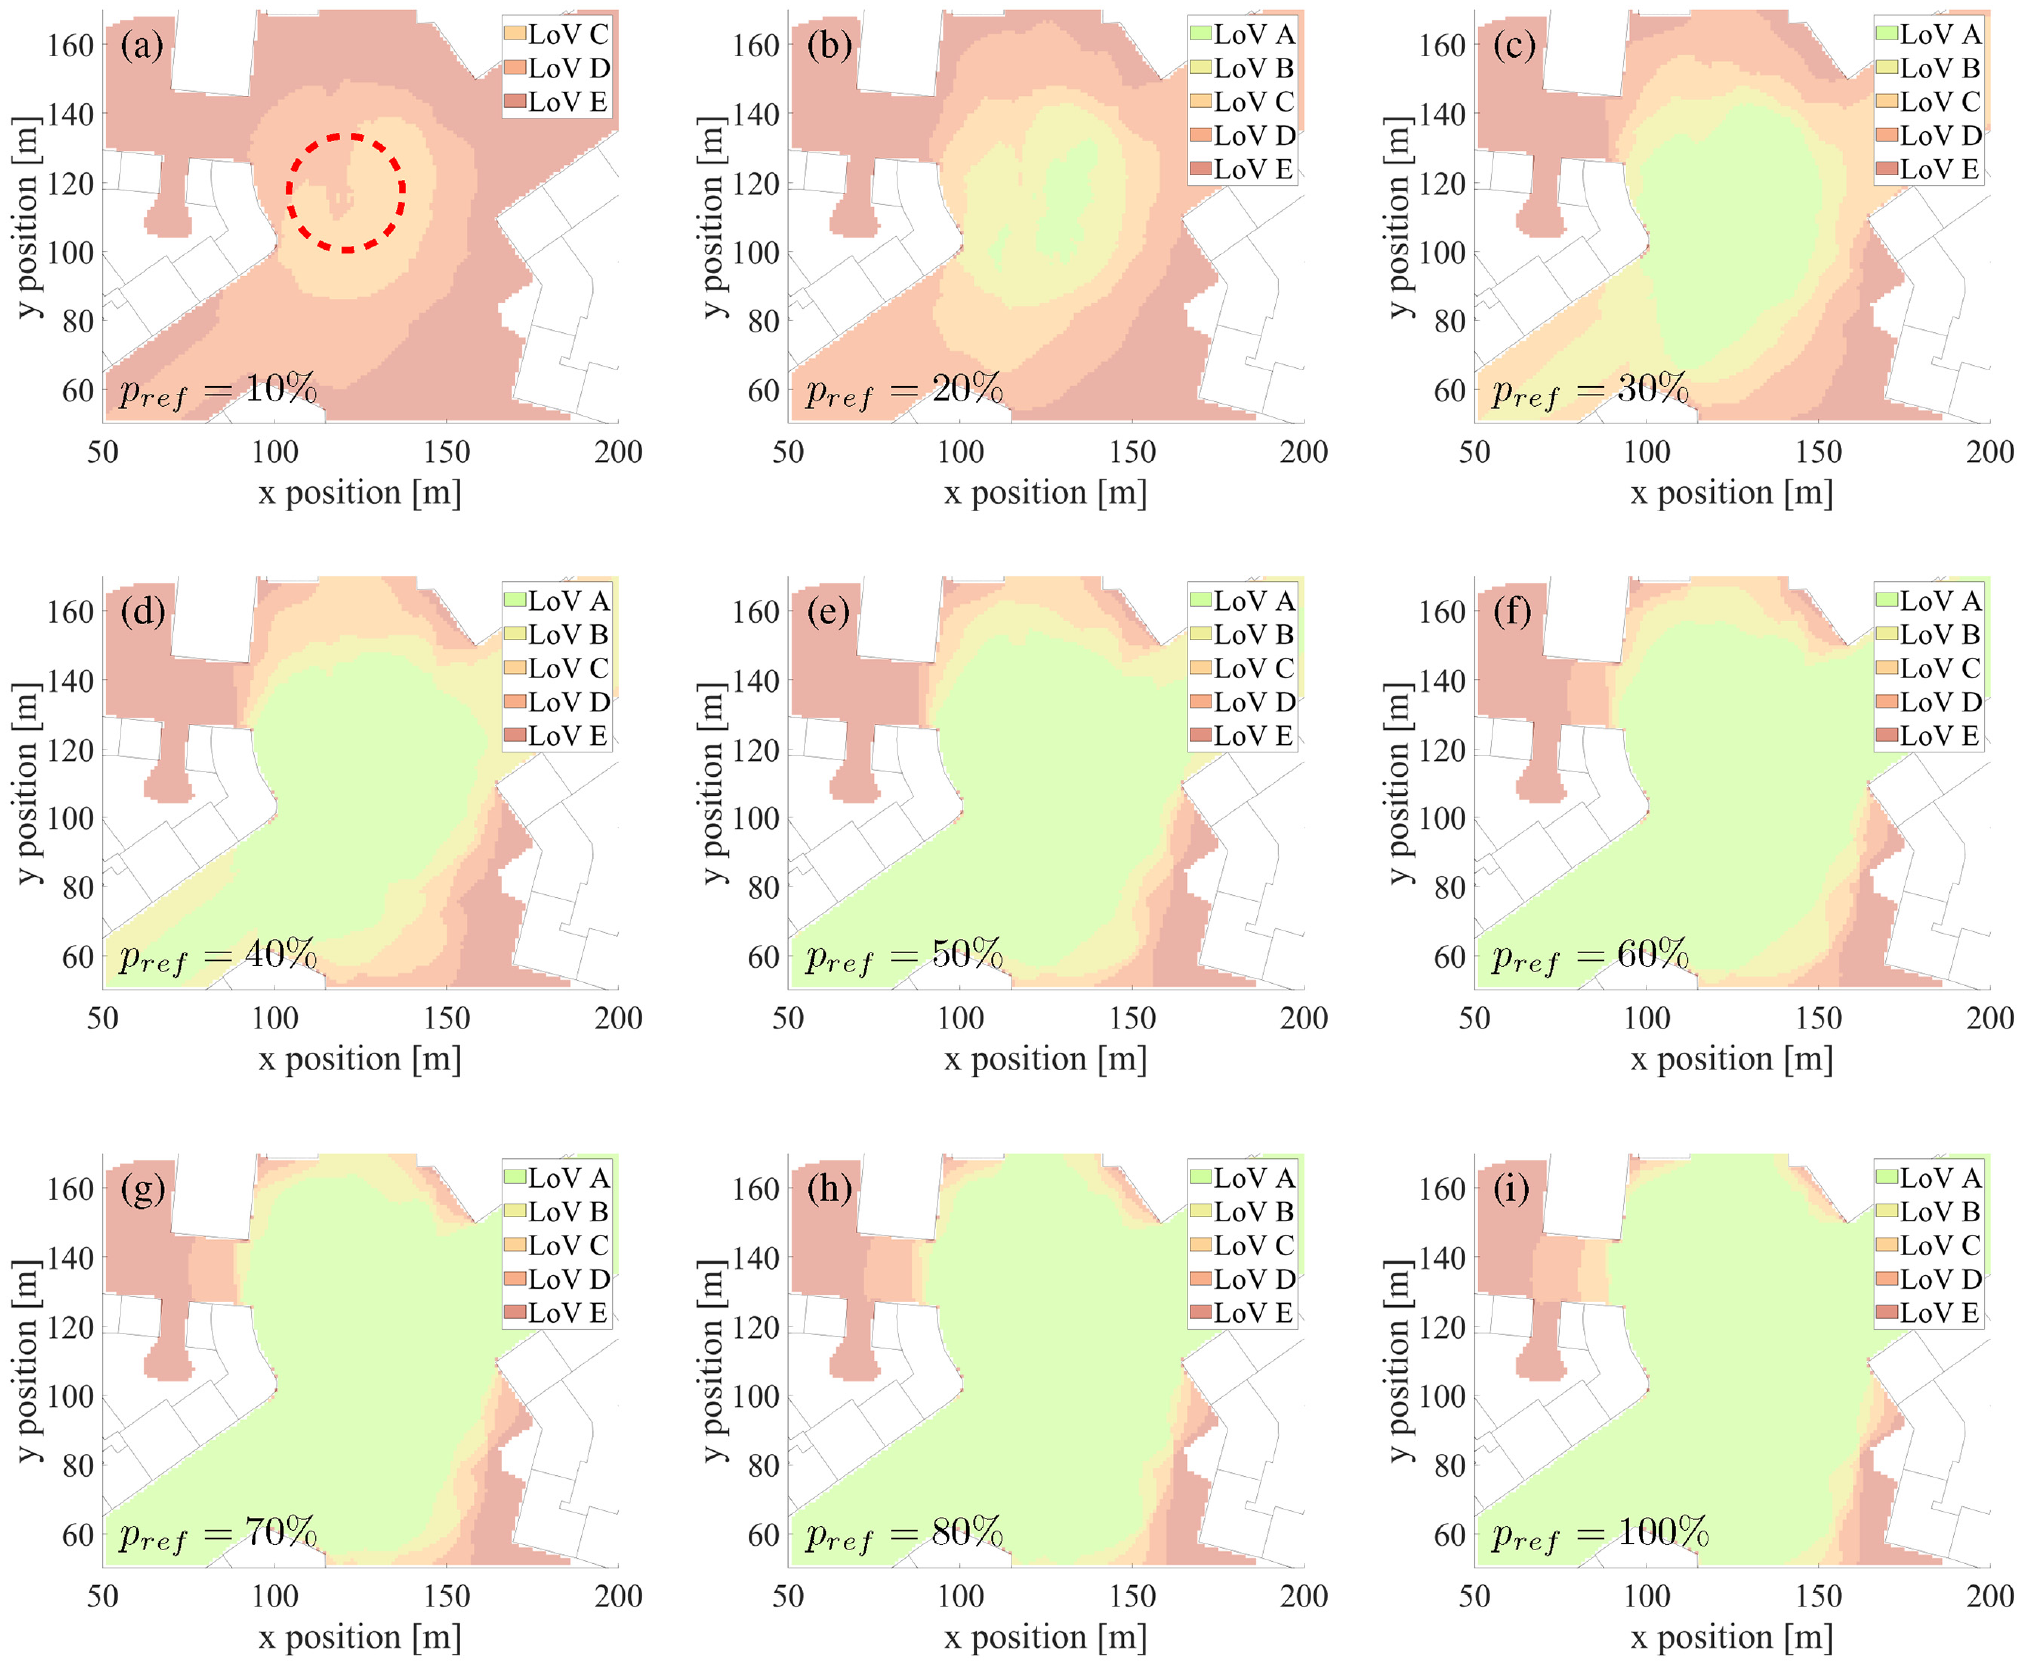
Level of visibility (LoV) analysis on a spatial basis, showing the subsequent development of penetration rates: (a) 10%, (b) 20%, (c) 30%, (d) 40%, (e) 50%, (f) 60%, (g) 70%, (h) 80%, and (i) 100%.
Our new metric effectively describes LoV in urban junctions. However, one specific issue should be looked at. A primary concern is that, in low-demand areas such as streets infrequently traversed by vehicles, the metric might highlight these as low-grade LoV. Although this is technically correct, it can convey misleading information. In such areas, high visibility may not be necessary at LoV A. It is essential to align LoV with actual demand in the area to mitigate this bias.
Conclusion
Through our simulation approach, we have analyzed occlusion in urban areas, focusing on its two primary types: static and dynamic. We have delineated definitions for both. Moreover, we have demonstrated the influence of CAV penetration rates on occlusion and introduced a novel metric to assess visibility in urban settings using the LoV metric.
Static Occlusion
Concerning the penetration rate of CAVs and their potential to address static occlusion, several considerations come to the forefront. Static objects such as parked vehicles pose a constant threat to VRUs by blocking the line of sight to bike lanes or walkways, and this problem may not be solved using collective perception by CAVs.
A potential solution is continuously powering parked CAVs, as they could mitigate occlusion they induce themselves. However, such an approach would necessitate infrastructure modifications, especially equipping each parking spot with a power source. Additionally, it is crucial to highlight that the perception systems of vehicles, which detect surrounding objects, consume substantial energy. Another perspective to consider is the strategic placement of parking spaces. Specifically, parking spots should perhaps not be located where they could potentially cause critical occlusions for VRUs. By addressing this, static occlusion could be eradicated without the introduction of any additional infrastructure. As outlined in previous work, the straightforward solution in such scenarios would be to remove these parking spaces ( 24 ).
An alternative approach involves deploying dedicated roadside intelligent transport systems stations (ITS-S), which capitalize on collective perception to oversee areas masked by occlusion ( 8 ). While parked vehicles, with their built-in sensing systems, could theoretically supplant roadside ITS-S perception, it is imperative that these systems are both reliable and accurate. Entrusting a stationary vehicle with a safety-critical mission, such as detecting VRUs, is challenging.
Given solutions would mandate significant infrastructure investments. Therefore, future research should delve into the feasibility and economic implications of these strategies.
Dynamic Occlusion
A key finding from the heat maps and LoV visualizations underscores that dynamic occlusion remains a formidable obstacle for CAVs until roughly 34% of AVs in mixed-traffic scenarios are connected. Considering safety issues induced by dynamic occlusion, these may be resolved at the given penetration rate. As an interim solution until the necessary ratio of CAVs is achieved—employing dedicated roadside ITS-S to monitor areas with limited visibility—emerges as a plausible strategy ( 8 ). By harnessing the software framework detailed in our article, we empower the capability to pinpoint regions where dynamic occlusion is observed at specific CAV penetration rates. Such information can be used to devise infrastructure-centric solutions, such as deploying roadside ITS-S or instigating modifications to the built environment.
Considering the LoV metric, it is pivotal to emphasize its correlation with traffic density. The larger the number of vehicles navigating a particular region, the greater the number of observations achieved by CAVs. Elevating the demand and, subsequently, the number of vehicles in the road network linearly increases the fraction of CAVs. This necessitates the integration of traffic flows for an accurate calibration of the LoV metric. We anticipate that, with increased demand, the LoV A threshold may be attainable at a lower CAV penetration rate, whereas reduced demand might necessitate a higher penetration. Nonetheless, the saturation effect is expected to remain consistent.
At the current state of our framework, we do not consider VRUs, but this would benefit our system, for example directly cross-checking if there actually are VRUs inside areas we evaluate as being occluded. We highly recommend that fellow researchers make use of and enhance our framework, which we are distributing alongside this paper. Different traffic flow volumes must be tested to further validate our approach. More efficient ray-tracing techniques that are already available, such as GPU-acceleration-based or voxel-based ray casting methodologies, could be employed ( 25 , 26 ). Our approach could benefit from improvements in computational speed, as it currently relies on a single core. This limitation led us to opt for a relatively large binning map and a reduced number of rays for our ray-tracing methodology. Once real-time execution is attained, CAVs can utilize collectively perceiving the environment to ensure safer automated driving in urban environments.
Footnotes
Acknowledgements
We extend our gratitude to Armin Straller for highlighting the potential distinction between occlusion and occupation in the context of our framework’s occlusion evaluation. The text in this work was refined with the assistance of ChatGPT to enhance its readability.
Author Contributions
The authors confirm contribution to the paper as follows: study conception and design: M. Pechinger, K. Bogenberger; data collection: M. Pechinger; analysis and interpretation of results: M. Pechinger, T. Niels; draft manuscript preparation: M. Pechinger, T. Niels, K. Bogenberger. All authors reviewed the results and approved the final version of the manuscript.
Declaration of Conflicting Interests
The author(s) declared no potential conflicts of interest with respect to the research, authorship, and/or publication of this article.
Funding
The author(s) disclosed receipt of the following financial support for the research, authorship, and/or publication of this article: This work was funded by the German Federal Ministry for Economic Affairs and Climate Action (BMWK) and by the European Union in the frame of NextGenerationEU within the project STADT:up (FKZ 19A22006T).