
Abstract
Automated driving systems, which can take over certain dynamic driving tasks from the driver, are becoming increasingly available in commercial vehicles. One of these automated driving systems widely introduced in commercial vehicles is adaptive cruise control (ACC). This system is designed to maintain certain desired driving speeds and time headways as chosen by drivers and based on the settings available within the system. The properties and actual performance of these systems will affect the traffic flow and its stability. However, the specific properties and their workings are rarely publicly available. Therefore, the main aim of this paper is to test the actual performance of a commercial ACC system under different desired speed and distance gap settings, as well as driving modes in a car-following situation. For this purpose, a pilot field test was conducted in the Netherlands in which two identical commercial vehicles equipped with ACC systems were driven simultaneously. The first vehicle was used to create a pre-specified speed profile by adapting the ACC system settings manually, whereas the second vehicle followed the lead vehicle when the ACC system was engaged to test its actual performance. The main findings indicate that the different system settings affect the car-following indicators, and system response times were found to be comparable to human response times. The eco mode was found to affect some of the car-following indicators, and it does not deteriorate safety below the safety level of driving with short headway setting in drive mode.
Automated vehicles are increasingly becoming available to the public. Different commercial Original Equipment Manufacturers (OEMs) are working on research and development of their automated systems. Although the expectations of 2016 to commonly see completely self-driving vehicles by 2021 may have not been fully realized yet ( 1 ), users today have easy access to lower levels of vehicle automation with various types of driver-assistant systems. Examples of such systems include, but are not limited to, (adaptive) cruise control, lane-keeping assist, automatic emergency braking, and lane departure warning. These systems are expected to increase traffic safety and efficiency ( 2 – 8 ). The human driver, however, is the one responsible for safe driving. Several studies aimed to predict the effect of such systems on traffic safety and efficiency ( 9 – 14 ). Generally, these studies adopt simulation approaches that involve defining the microscopic behavior of automated vehicles which depend on the specific control algorithms of the systems. As these are commercial vehicles, the control algorithms are not in the public domain. Therefore, simulation studies often resort to making assumptions on the driving behavior of these systems. Empirical data on the behavior of these systems in operation would contribute to underpinning the simulation studies.
There are relatively few studies documented in the literature which have conducted field tests and collected empirical data on the performance of automated vehicles. Li et al. have recently investigated the car-following behavior characteristics of commercial adaptive cruise control (ACC) vehicles based on empirical data from a field test ( 15 ). The authors concluded that the car-following behavior depends to a large extent on the ACC headway setting, speed setting, and leader stimulus. In addition, the authors have studied the performance of a single ACC vehicle and a platoon of ACC vehicles.
Gunter et al. did an eight-vehicle fleet testing covering more than 1,200 mi of driving with ACC engaged by seven following vehicles with distinct models from two different vehicle makes ( 16 ). Using the collected data, they first fitted the parameters of a linear second-order delay differential equation model that is used to approximate the behavior of the black box ACC systems, then assessed the string stability accordingly, and found that all the ACC systems within the seven tested vehicle models are string unstable. Another recent open database of car-following experiments involving a total of 22 vehicles of different brands equipped with state-of-the-art commercial ACC systems is the OpenACC database ( 17 , 18 ). The authors’ main aim was to study the properties of commercial ACC systems and their performance in car-following. Several findings were in line with previous literature; for example, that commercial ACC systems have in general lower speed and headway variabilities but lack the ability to monitor the traffic down the road, and as a result have sometimes extreme acceleration and deceleration values. Interestingly, the authors found that the reaction times of automated vehicles are like humans’ reaction times, and not instantaneous as one would expect. In addition to this, the authors also discuss the implications on capacity, string stability, and hysteresis.
Li et al. ( 19 ) further presented a comprehensive empirical study on the ACC equilibrium behaviors by analyzing all the available experimental evidence worldwide together with the rich open-sourced datasets collected by Gunter et al. ( 16 ) and Makridis et al. ( 17 ). Their main findings indicate that there is a linear speed–spacing relationship in the ACC systems which accords with human-driven vehicles, although the key parameters of the speed–spacing relationships can differ significantly from human-driven traffic depending on their different input settings (e.g., in relation to time headway).
Table 1 presents some examples of ACC settings of different vehicles by different OEMs. It can clearly be noticed that the speed range in which the ACC system can be activated is different between different vehicles, as is the number of levels that drivers can choose from for setting the following time/distance. For example, for Nissan three settings are available (1 s, 1.6 s, 2.2 s), for Volvo five different settings are available (between 1 s and 3 s), whereas for Tesla seven levels are available (exact following-time distances are not known). In addition to following distances and speed range, the ACC systems in different vehicles also differ in relation to the available driving modes. This demonstrates the existing variability between different OEMs. The official user manuals provided by the OEMs provide limited information in relation to the actual performance of the ACC systems in different conditions. Therefore, field tests for collecting empirical data on the actual performance of these systems is of high importance to understand their potential effects on traffic flow and safety. These empirical data are also needed to be able to model such systems, for example, for implementation in microscopic simulation models.
Examples of Adaptive Cruise Control (ACC) Settings of Different Vehicles by Different Original Equipment Manufacturers (OEMs)
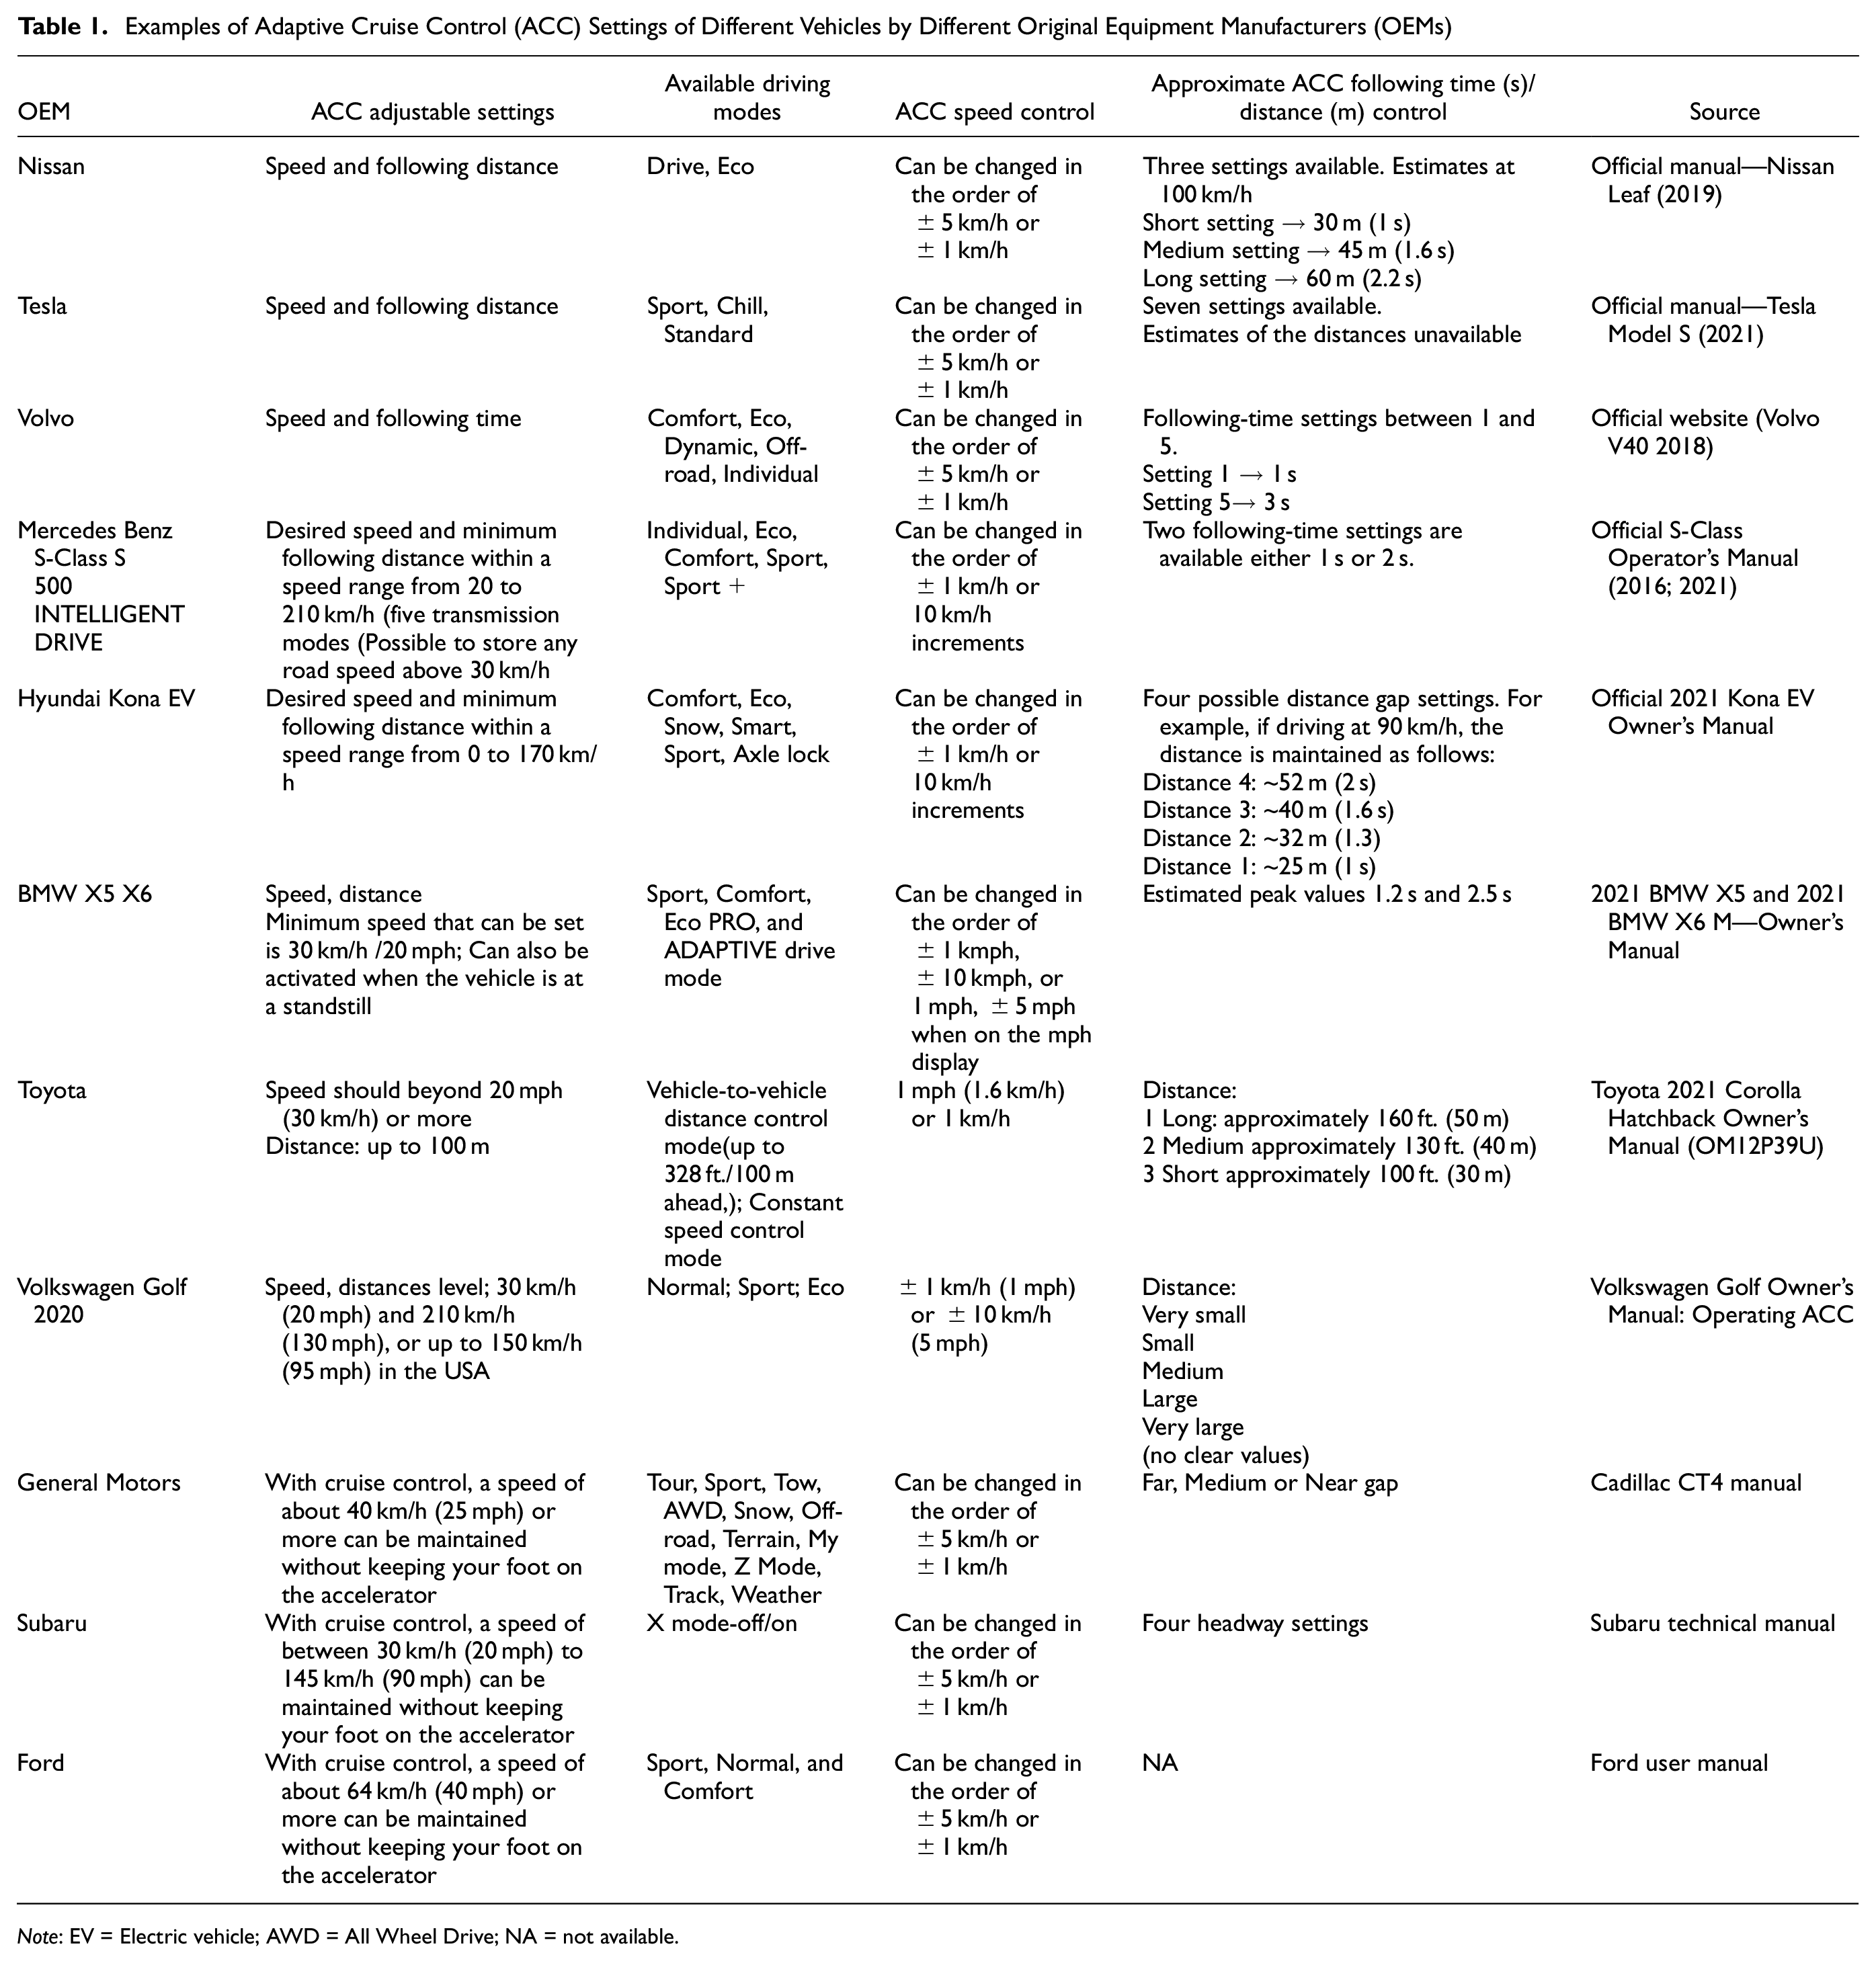
Note: EV = Electric vehicle; AWD = All Wheel Drive; NA = not available.
The above summarized studies provide valuable information on the actual performance of different ACC systems on public roads and as well the implication on traffic stability. At the same time, as Table 1 shows, different car manufacturers have different ACC systems with different properties and settings. Therefore, it is important to understand if and how these different systems perform in the field, and how they affect traffic flow. This requires the collection of empirical data from field tests when driving with vehicles equipped with these different systems. Consequently, the main aim of this paper is to contribute to these efforts by testing the actual performance of a commercial ACC system under different desired speed and distance gap settings, as well as different driving modes. Following this, the main research questions were defined as follows:
RQ1: What are the actual distance-gap and time-gap values maintained by the system with different distance-gap settings when driving at different desired speeds?
RQ2: What is the system’s acceleration behavior when executing an ascending and a descending speed profile (with different distance gaps and mode settings)?
RQ3: What is the response time of the system with respect to the lead vehicle’s changing speed profile (with different headway and mode settings)?
Research Methodology
The research methodology is explained in the following sub-sections. First, we briefly explain the vehicle automated driving systems of the Nissan Leaf ProPilot vehicle, followed by a description of the field test location, the scenarios and testing procedure, data collection, and finally data processing and analysis method.
Vehicle Automated Driving Systems
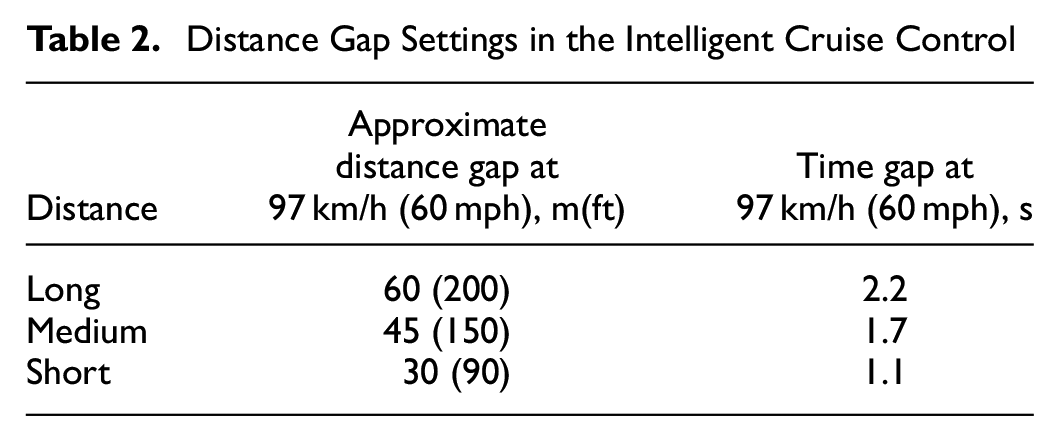
The two Nissan Leaf ProPilot vehicles used in the field test, which are electric vehicles, are equipped with Intelligent Cruise Control (ICC) systems. The ICC system, which is a Vehicle-to-Vehicle distance control mode, maintains a selected distance from the vehicle in front within a speed range of 0 to 144 km/h (0 to 90 mph) up to the set speed. The set speed can be selected by the driver between 32 to 144 km/h (20 to 90 mph). Table 2 presents the three distance gaps that the driver can choose from: “Short,”“Medium,” and “Long,” and the time gaps in seconds assuming the driving speed is 97 km/h.
Distance Gap Settings in the Intelligent Cruise Control
In addition to the ICC system, the vehicles are also equipped with a Steering Assist system which controls the steering system, when ProPILOT Assist is engaged, to help keep the vehicle near the center of the lane when driving. When there is no vehicle ahead, Steering Assist is not available at speeds under 60 km/h (37 mph). Finally, the Intelligent Blind Spot Intervention helps to alert the driver of other vehicles in adjacent lanes when changing lanes and helps assist the driver to return the vehicle to the center of the traveling lane. The Blind Spot Warning system operates above approximately 32 km/h (20 mph).
In addition, the vehicles have an “Eco” mode switch button. The “Eco” mode, according to the vehicle user manual, helps reduce power consumption by reducing acceleration when compared with the same accelerator pedal position in the D (Drive) position. The field test of this paper is however operated in cruise control mode. According to the manual, “when the cruise control is operated, the vehicle makes it a priority to maintain a constant speed.”
Field Test Location
The field test took place on two provincial roads in the north of the Netherlands, N201 and N205 with speed limits of 80 km/h and 100 km/h, respectively, as shown in Figure 1. Each road has two carriageways with two lanes each and a median separating the two traffic directions. Lane width is 3 m. The blue crosses along the route indicate the locations of signalized intersections. In road N201 there is a diamond interchange 2.10 km from the starting point of the field test at Kruisweg intersection.
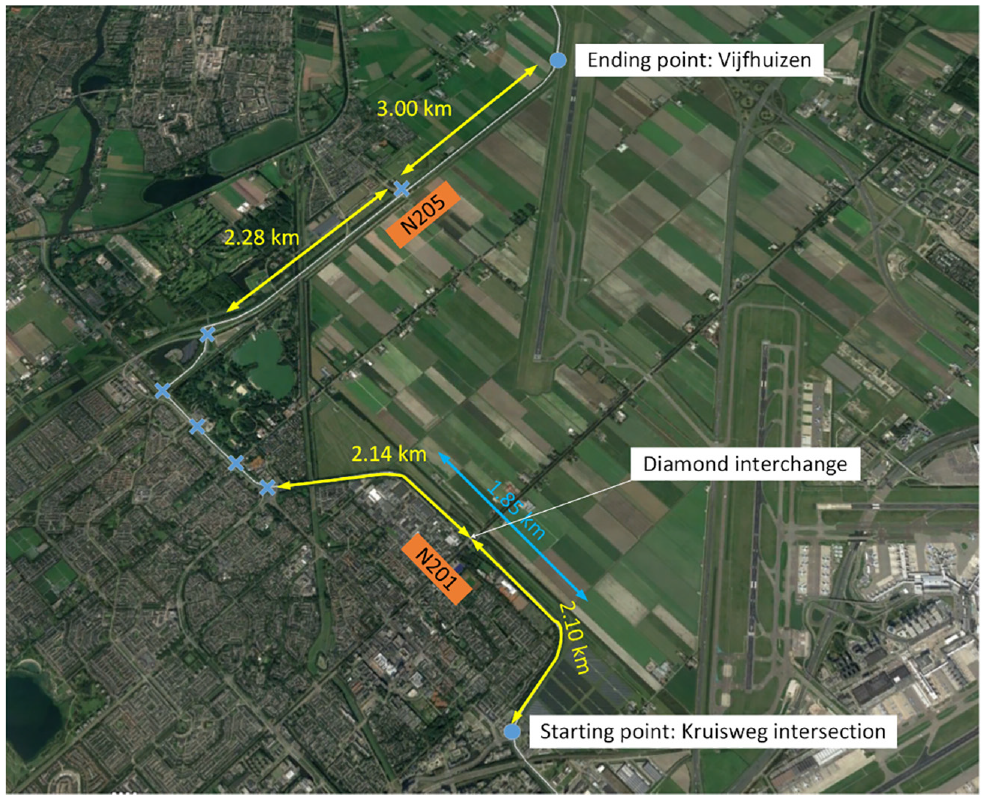
The location of the field test (yellow arrows indicate the sections in which data was collected, and blue crosses indicate signalized intersections).
Scenarios and Test Procedure
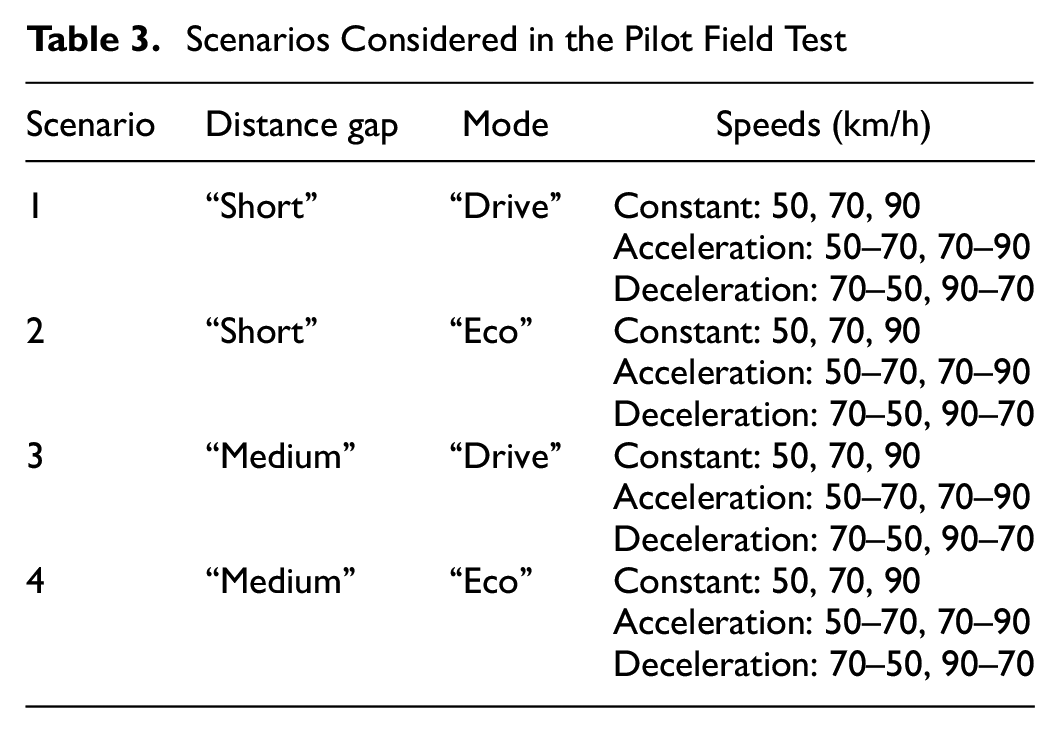
This study aimed to focus mainly on assessing the performance of the ICC system at different speed and distance gap settings, for each of the two driving modes (i.e., “Drive” or “Eco” mode). Considering the speed limits of both road sections, three driving speeds were considered, 50, 70, and 90 km/h. A pre-test to examine and experience the three distance gap settings before starting the pilot test revealed that the “Long” distance setting led to frequent cut-ins from other vehicles, and therefore it was decided to exclude it from the pilot test. The exact scenarios tested are summarized in Table 3.
Scenarios Considered in the Pilot Field Test
The pilot test was conducted on the 10 May 2021 in non-peak hours, between 11:00 a.m. and 15:00 p.m., so traffic was relatively light with minimal interference from surrounding vehicles (e.g., cut-ins, close following). The test procedure included the two vehicles driving simultaneously followed by a Volvo car driven manually to prevent other cars on the road following the test vehicle closely. The first vehicle was used to set a pre-determined speed profile using the ACC system and the dedicated buttons for speed increase and decrease. The only task of the second vehicle was to drive behind the first vehicle when the ProPilot system was engaged and with the specific distance gap and mode settings depending on the tested scenario. The chosen cruise duration at each speed setting was at least 30 s, following the study by Li et al. ( 15 ). The drive started from the starting point on road N201 (speed limit of 80 km/h) reaching a speed of 50 km/h, cruising at this speed for 30 s followed by a speed increase to 70 km/h, cruising for 30 s and then decelerating again to 50 km/h, and so forth until reaching the first signalized intersection. Once entering road N205 the first vehicle accelerated to a speed of 70 km/h, followed by cruising at this speed for 30 s then accelerating to 90 km/h, cruising for 30 s and then decelerating again to 70 km/h, and so forth until reaching the end point where nearby a roundabout was located so it was possible to turn around and follow the same procedure on the way back. The acceleration and deceleration of the first vehicle was controlled by the vehicle system. The driver only had to set the desired speed. Four complete runs were undertaken according to the four scenarios in Table 3.
Data Collection
The measuring equipment included three GoPro cameras (two GroPro 9 and one GoPro 7) and two GPS devices. One GoPro 9 camera was facing the windscreen in the leader vehicle, and one GoPro 7 camera was facing the windscreen in the following vehicle, whereas the other GoPro 9 camera was facing the dashboard of the following vehicle to record the mode and specific settings in which the vehicle was driving. Along with recording the video footage, the GoPro cameras recorded the time stamp, longitudinal and lateral coordinates, and speed of the vehicle at every 0.1 s. Each vehicle also included one GPS device which had a better accuracy than the GPS integrated in the GoPro cameras. These recorded the time stamp, longitudinal and lateral coordinates, and speed at every 0.2 s. To extract the data from the GoPro cameras and to process them, the Telemetry Extractor ( 20 ) tool was used. The Telemetry Extractor provides numerous options for extracting the metadata to different formats, including CSV, JSON, KML, GPX, and so forth. Using Telemetry Extractor, trajectory data of the vehicles in relation to GPS coordinates were extracted for the entire survey duration.
Data Processing and Analysis
This section will discuss how the data were processed and analyzed. On viewing the raw data, it was found that:
The GPS device in the leading vehicle only had data for the last quarter of the test.
The data of the GoPro in the following vehicle were not synchronous with the data of the GPS device in the following vehicle.
A small portion of the data of the GoPro in the leading vehicle was considerably ahead of the other data sources. On closer inspection it was found that when the GoPro switches to a new video and GPS file internally, a gap was present in the time stamps, but not in the remaining data. This only occurred the first time when switching to a new file after the device was turned on, which was twice in our test.
Consequently, data of the GPS device in the following vehicle were used, and the GoPro data of the leading vehicle were used. For two files of the leading vehicle, the time stamps were shifted later in time by 6.00 s and 5.08 s, respectively, to reduce the time gap between files to the normal data frequency. After this it was found that the GoPro data in the leading vehicle were synchronous with the GPS data in the leading vehicle that were available and showed a consistent pattern of time difference relative to data sources in the following vehicle.
Episodes of acceleration, deceleration, or constant speed were derived from the data. Speed data were smoothed with a moving average with a span of 3 s. This was numerically differentiated to acceleration by v’(i) =(v(i) – v(i– 1))/(t(i) –t(i– 1)) for measurement i. Acceleration was subsequently also smoothed with a 3 s moving average. The following procedure was applied using the smoothed acceleration data.
A threshold value of ath = 0.25 m/s2 was used to distinct the three regimes of acceleration (v’ > ath), constant speed (ath ≥ v’ ≥ −ath) and deceleration (–ath > v’).
Only if the acceleration is beyond the selected threshold for at least tth = 5 s is the new regime considered valid. The start time of the new regime is equal to the first moment in time the threshold is exceeded.
It can occur that a threshold is exceeded within tth relative to the prior exceedance. In that case a list of exceedances is built up, in which the time and the regime that is entered is remembered for each exceedance. If the same regime is reached twice, all intermediate exceedances are removed from the list, that is, that whole time span is considered to be part of the same regime.
When the last exceedance in the list is considered valid (lasts beyond tth), any prior exceedance is removed from evaluation. Typically, these are short episodes where the data go from acceleration to deceleration (or vice versa) crossing the constant speed accelerations only momentarily.
This procedure results in many switch points as visualized in Figure 2 by circles in the bottom two figures. Around t = 46,750 s it can be seen that the acceleration of the follower is lower than –ath, but the regime remains constant speed as the duration is too short. Around t = 46,885 s deceleration quickly changes to acceleration, and a short intermediate episode results for both vehicles. This short episode is ignored. The first shown constant speed episode of the leader is not accompanied by a constant speed episode of the follower. The follower starts with a speed that is too high for the scenario. This is because this is the first constant speed episode after having accelerated from an intersection, and the following vehicle is not yet in equilibrium.
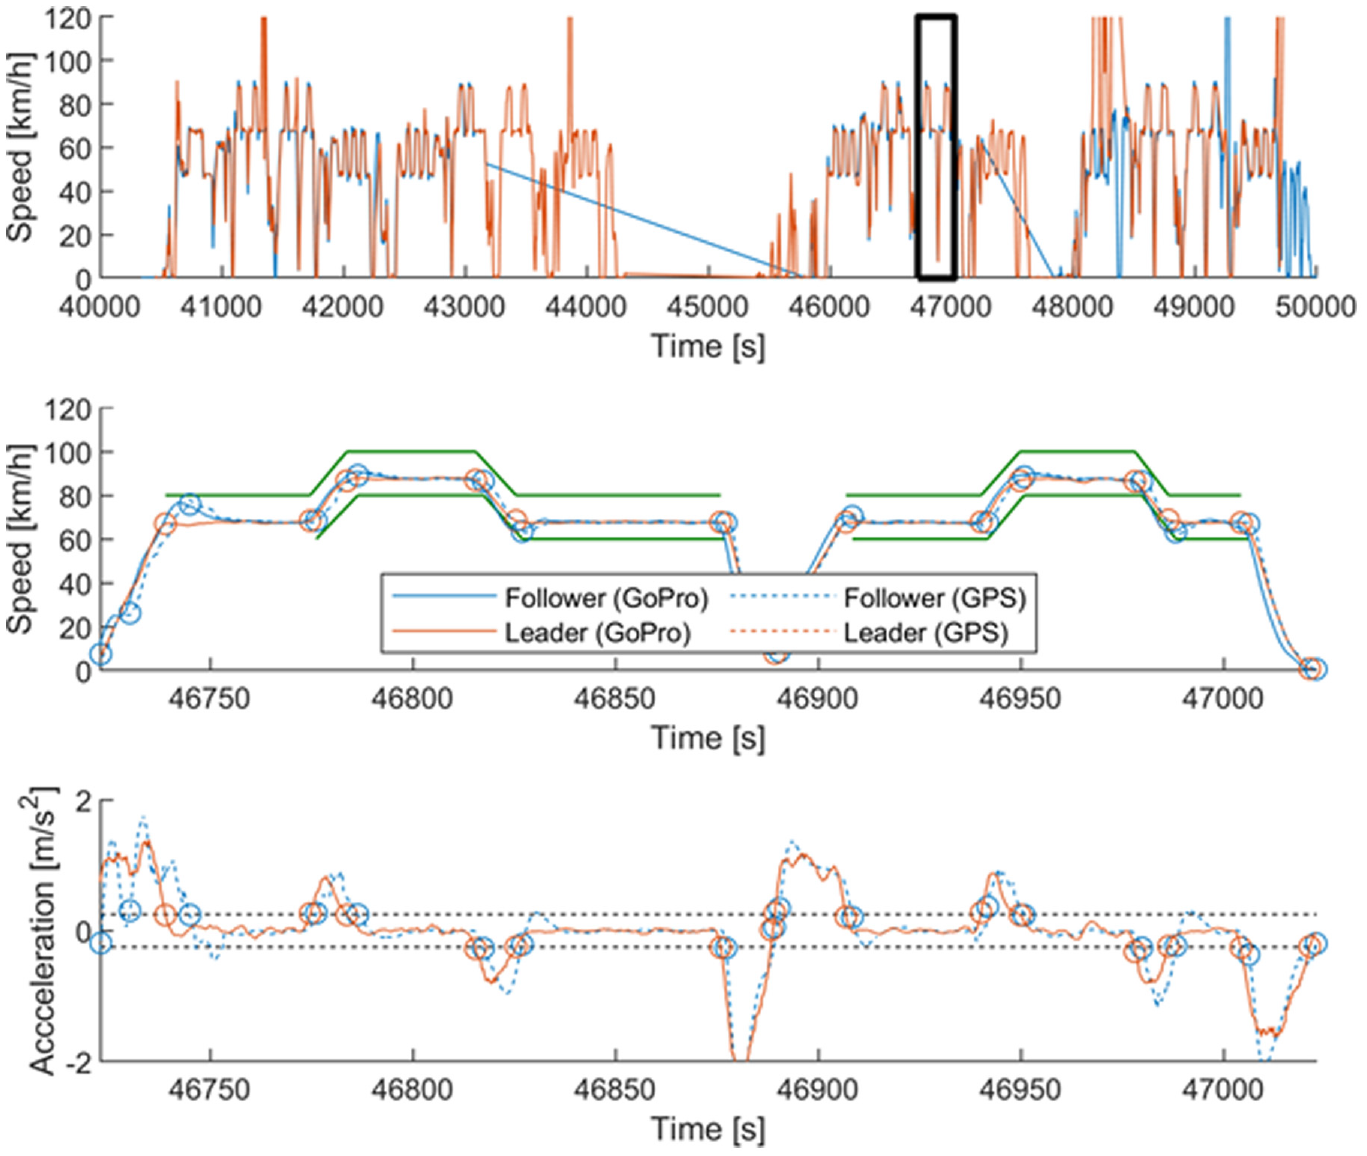
Smoothed speed and smoothed acceleration.
After episodes of acceleration, deceleration, and constant speed are derived, these need to be categorized into the different scenarios of speed, headway setting, and eco or drive mode. Episodes may also be ignored as they do not belong to a scenario or have faulty data. The times when the vehicles were on the yellow sections in Figure 1 were manually defined, accompanied by the settings of headway and eco mode that were used during the four runs over the entire field test location. On visual inspection, six points in time were defined where the data was faulty. Episodes that crossed these times were ignored. Faulty data were recognized by perfectly straight speed profiles probably resulting from momentary loss of GPS fix, or where the GPS position (not shown in Figure 2) was clearly off relative to other runs. The following procedure was applied to categorize the episodes.
If the episode was (partially) outside of all manually defined valid time periods, or the episode contains a moment defined as faulty, the episode was excluded.
The headway setting and drive or eco mode were coupled to the manually defined time period the episode falls within.
Constant speed episodes were categorized to a given scenario speed if vmin > vscenario–Δvmin and vmax < vscenario + Δvmax, where vmin and vmax are the minimum and maximum speed during the episode, vscenario is the speed of the scenario (50, 70, or 90 km/h) and Δvmin and Δvmax define an acceptable range around the scenario speed. Values of Δvmin = 10 km/h and Δvmax = 5 km/h were used, defining a 15 km/h speed band. This is slightly on the lower side as the vehicles drive slightly below the set speed because of the typical difference between speedometer and GPS.
Acceleration and deceleration episodes were categorized to a given scenario speed similarly to constant speed. The minimum speed in the episode has to be within the 15 km/h band of the minimum speed of the scenario (50 or 70 km/h) and the maximum speed in the episode has to be within the 15 km/h band of the maximum speed of the scenario (70 or 90 km/h).
All episodes that did not fit within the scenario speed thresholds were ignored. This applied, for example, to episodes caused by a traffic light in the middle of the N205 section, as visible in Figure 2 where the middle figure shows speeds almost reach standstill halfway through the shown time.
With all the switch points known, and the episodes categorized to scenarios, data can be analyzed. The results section shows various indicators (distance gap, time gap, follower acceleration, relative speed, follower response time) for the different scenarios. Response times are derived by taking the difference between the two vehicles entering a scenario, as defined by the switch points. In rare cases the follower may enter a scenario slightly earlier than the leader. Therefore, for each scenario the leader enters, the first moment in time that the follower enters the same scenario after this moment is considered, with a maximum of 10 s so as to not couple it to a different episode of the same scenario later in the test. Response times are not considered for all separate scenarios but aggregated over various dimensions because of the limited number of measurements. For the remaining indicators, all time points are considered where both vehicles are categorized in the same scenario (i.e., data during response time are not included for these indicators). Data points of the leader are taken as is, whereas the data of the follower are linearly interpolated at the time stamps of the leader data. Response times and episodes were derived using smoothed data, whereas all other indicators are derived from raw data during episodes.
Results
In this section the collected data points per scenario are first presented, followed by an analysis of the microscopic characteristics which includes the distance gap, time gap, accelerations, relative speeds and the response times.
Collected Data Points per Scenario
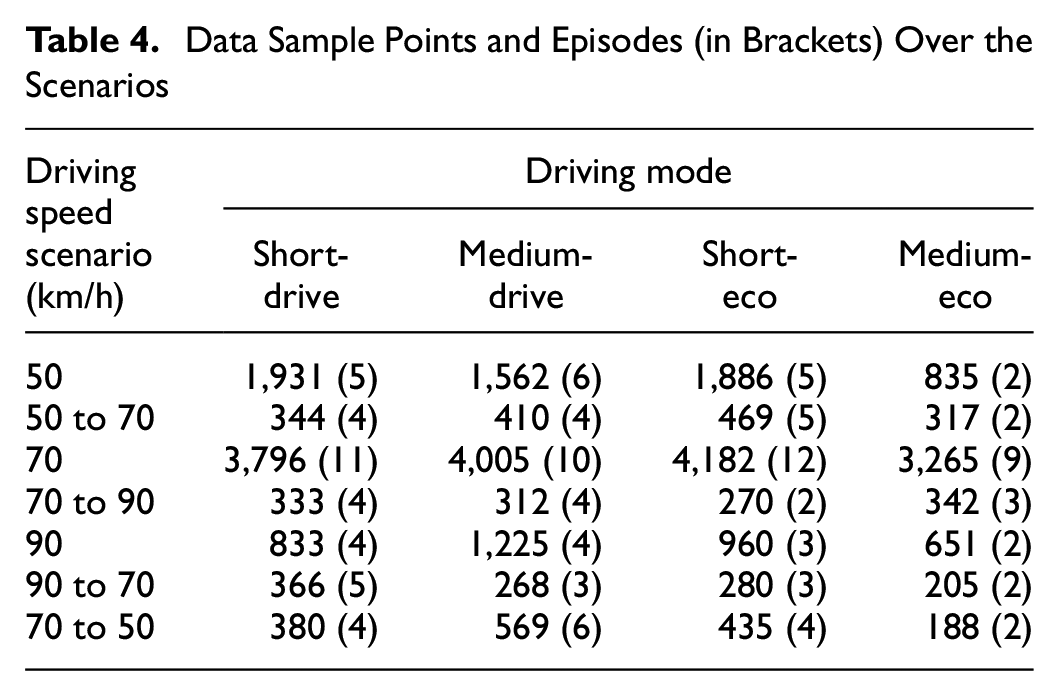
Before analyzing the data, the data sample points collected and number of episodes per scenario are presented in Table 4. As can be noticed, the data sample points for each driving speed scenario are more-or-less balanced between the different driving modes. Only in the two cases of driving speed scenario of 50 km/h and 70 to 50 km/h are there fewer data sample points for the Medium-Eco driving mode compared with the other modes. The number of episodes for the Medium-Eco driving mode in these two scenarios (only two episodes) is fewer compared with the number of episodes for the other driving modes (four, five, or six episodes), which could explain this difference in the number of data sample points. Nevertheless, there are sufficient data for analysis.
Data Sample Points and Episodes (in Brackets) Over the Scenarios
Microscopic Characteristics
Actual Distance Gap and Time Gap (RQ1)
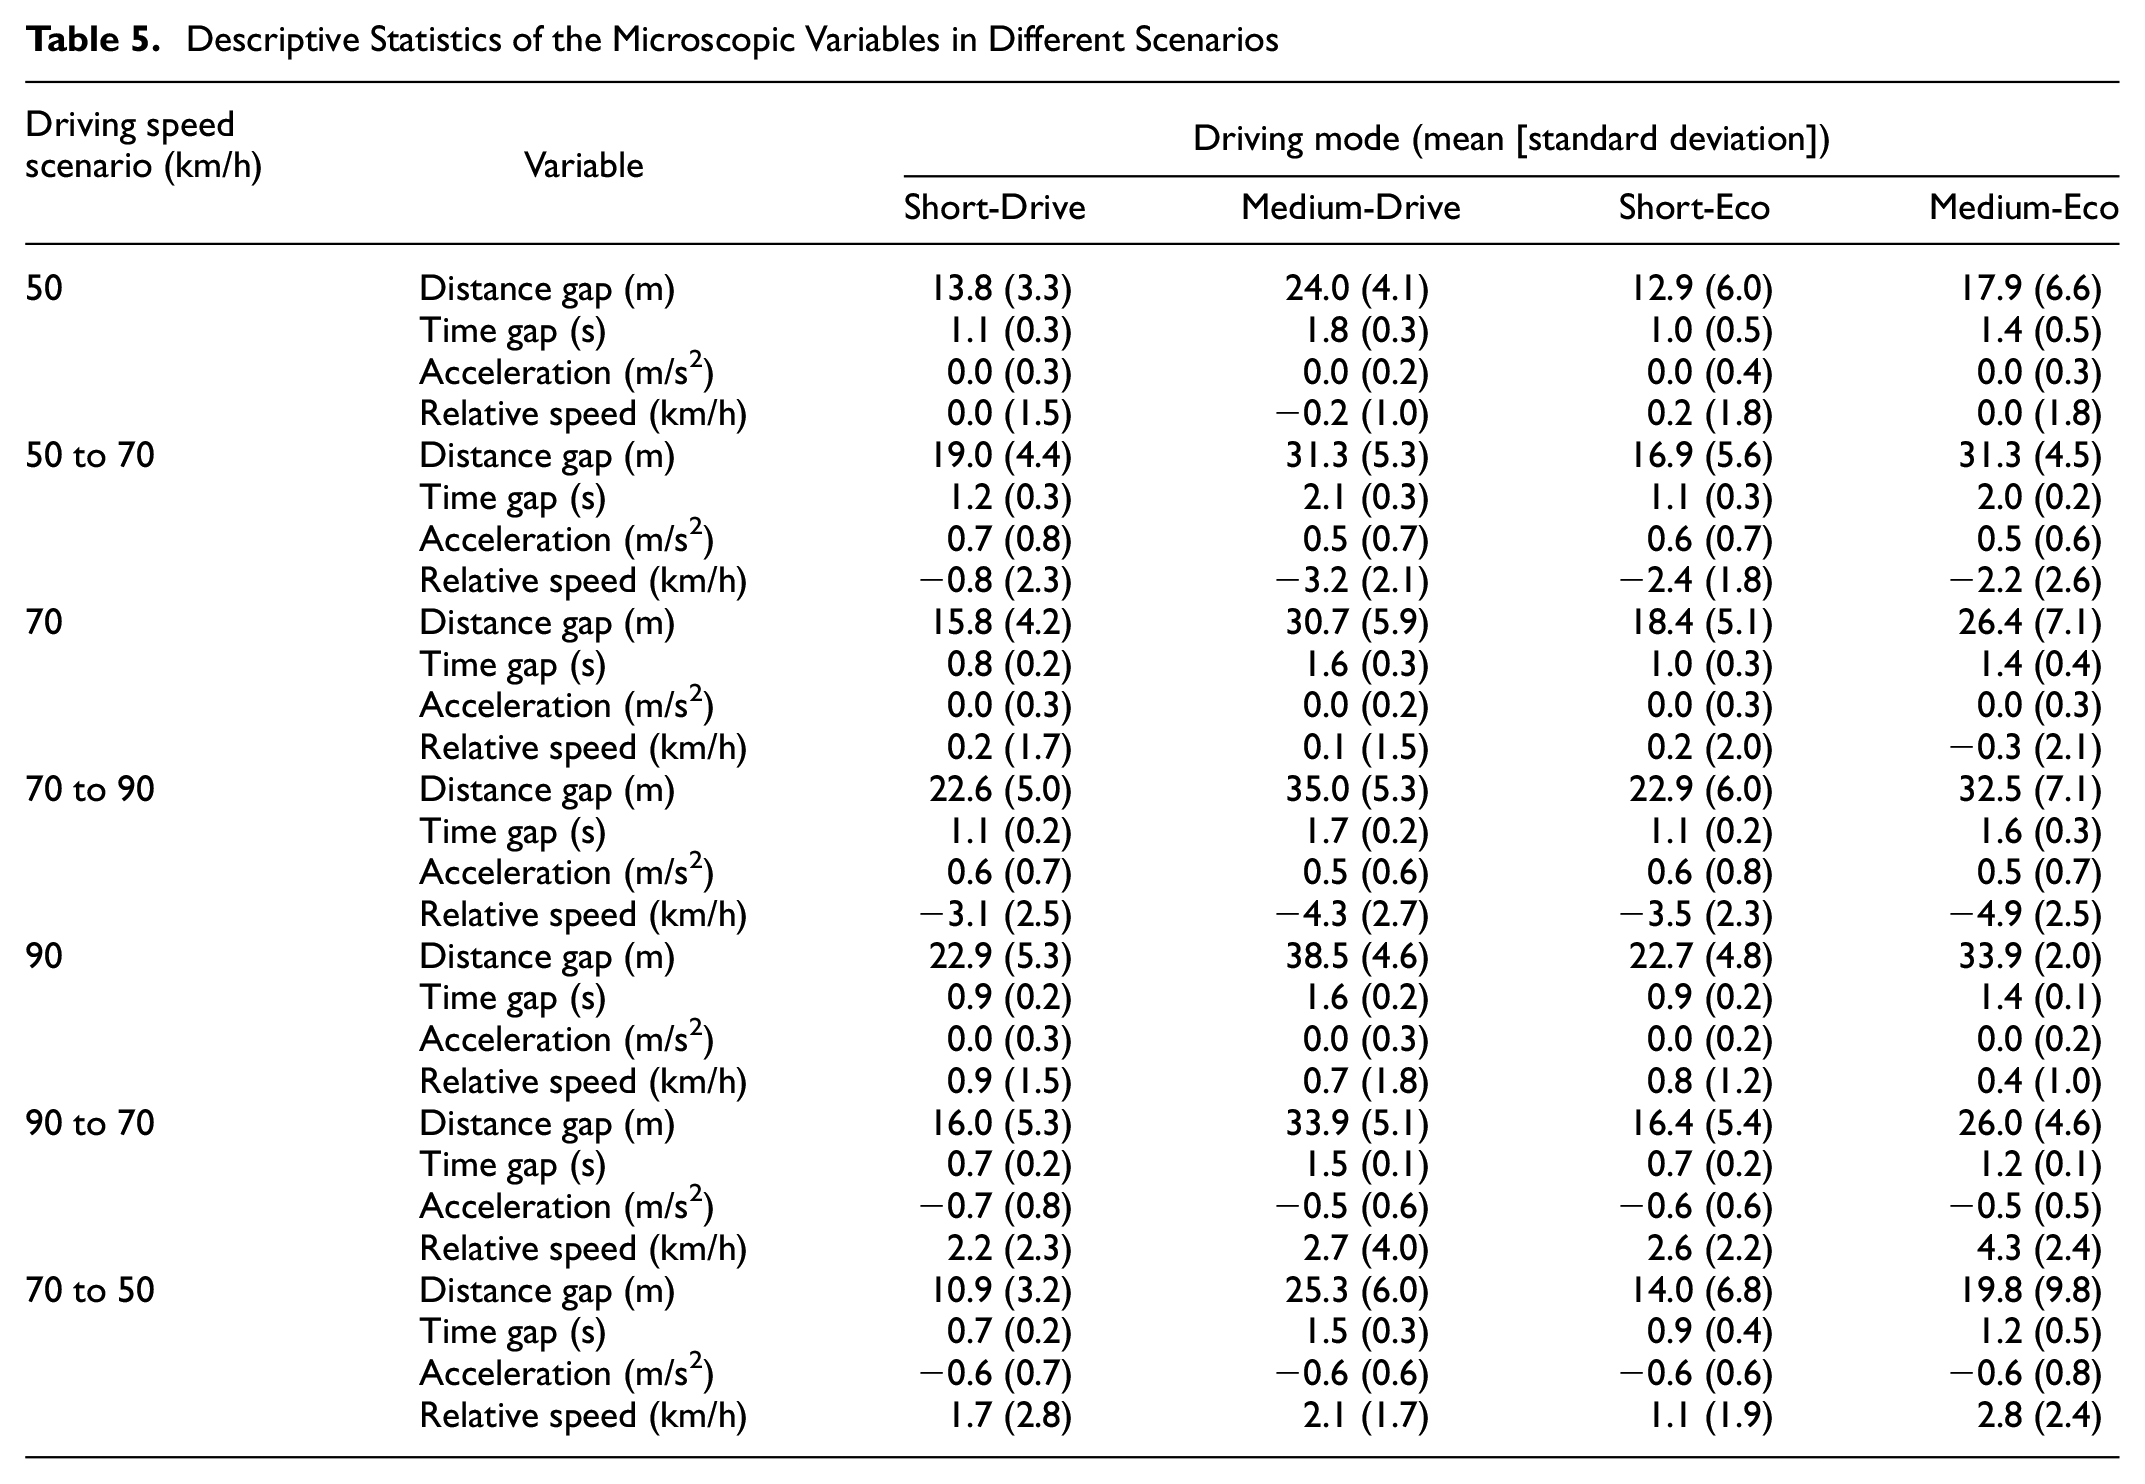
In line with the research objective and research questions, to understand the actual performance and response of the ACC in different driving scenarios, the microscopic characteristics, such as distance gap, time gap, acceleration of the follower, and the relative speeds are evaluated. First, a descriptive analysis of the microscopic characteristics is presented in Table 5 and afterward visualized as box plots in Figures 3 to 6.
Descriptive Statistics of the Microscopic Variables in Different Scenarios
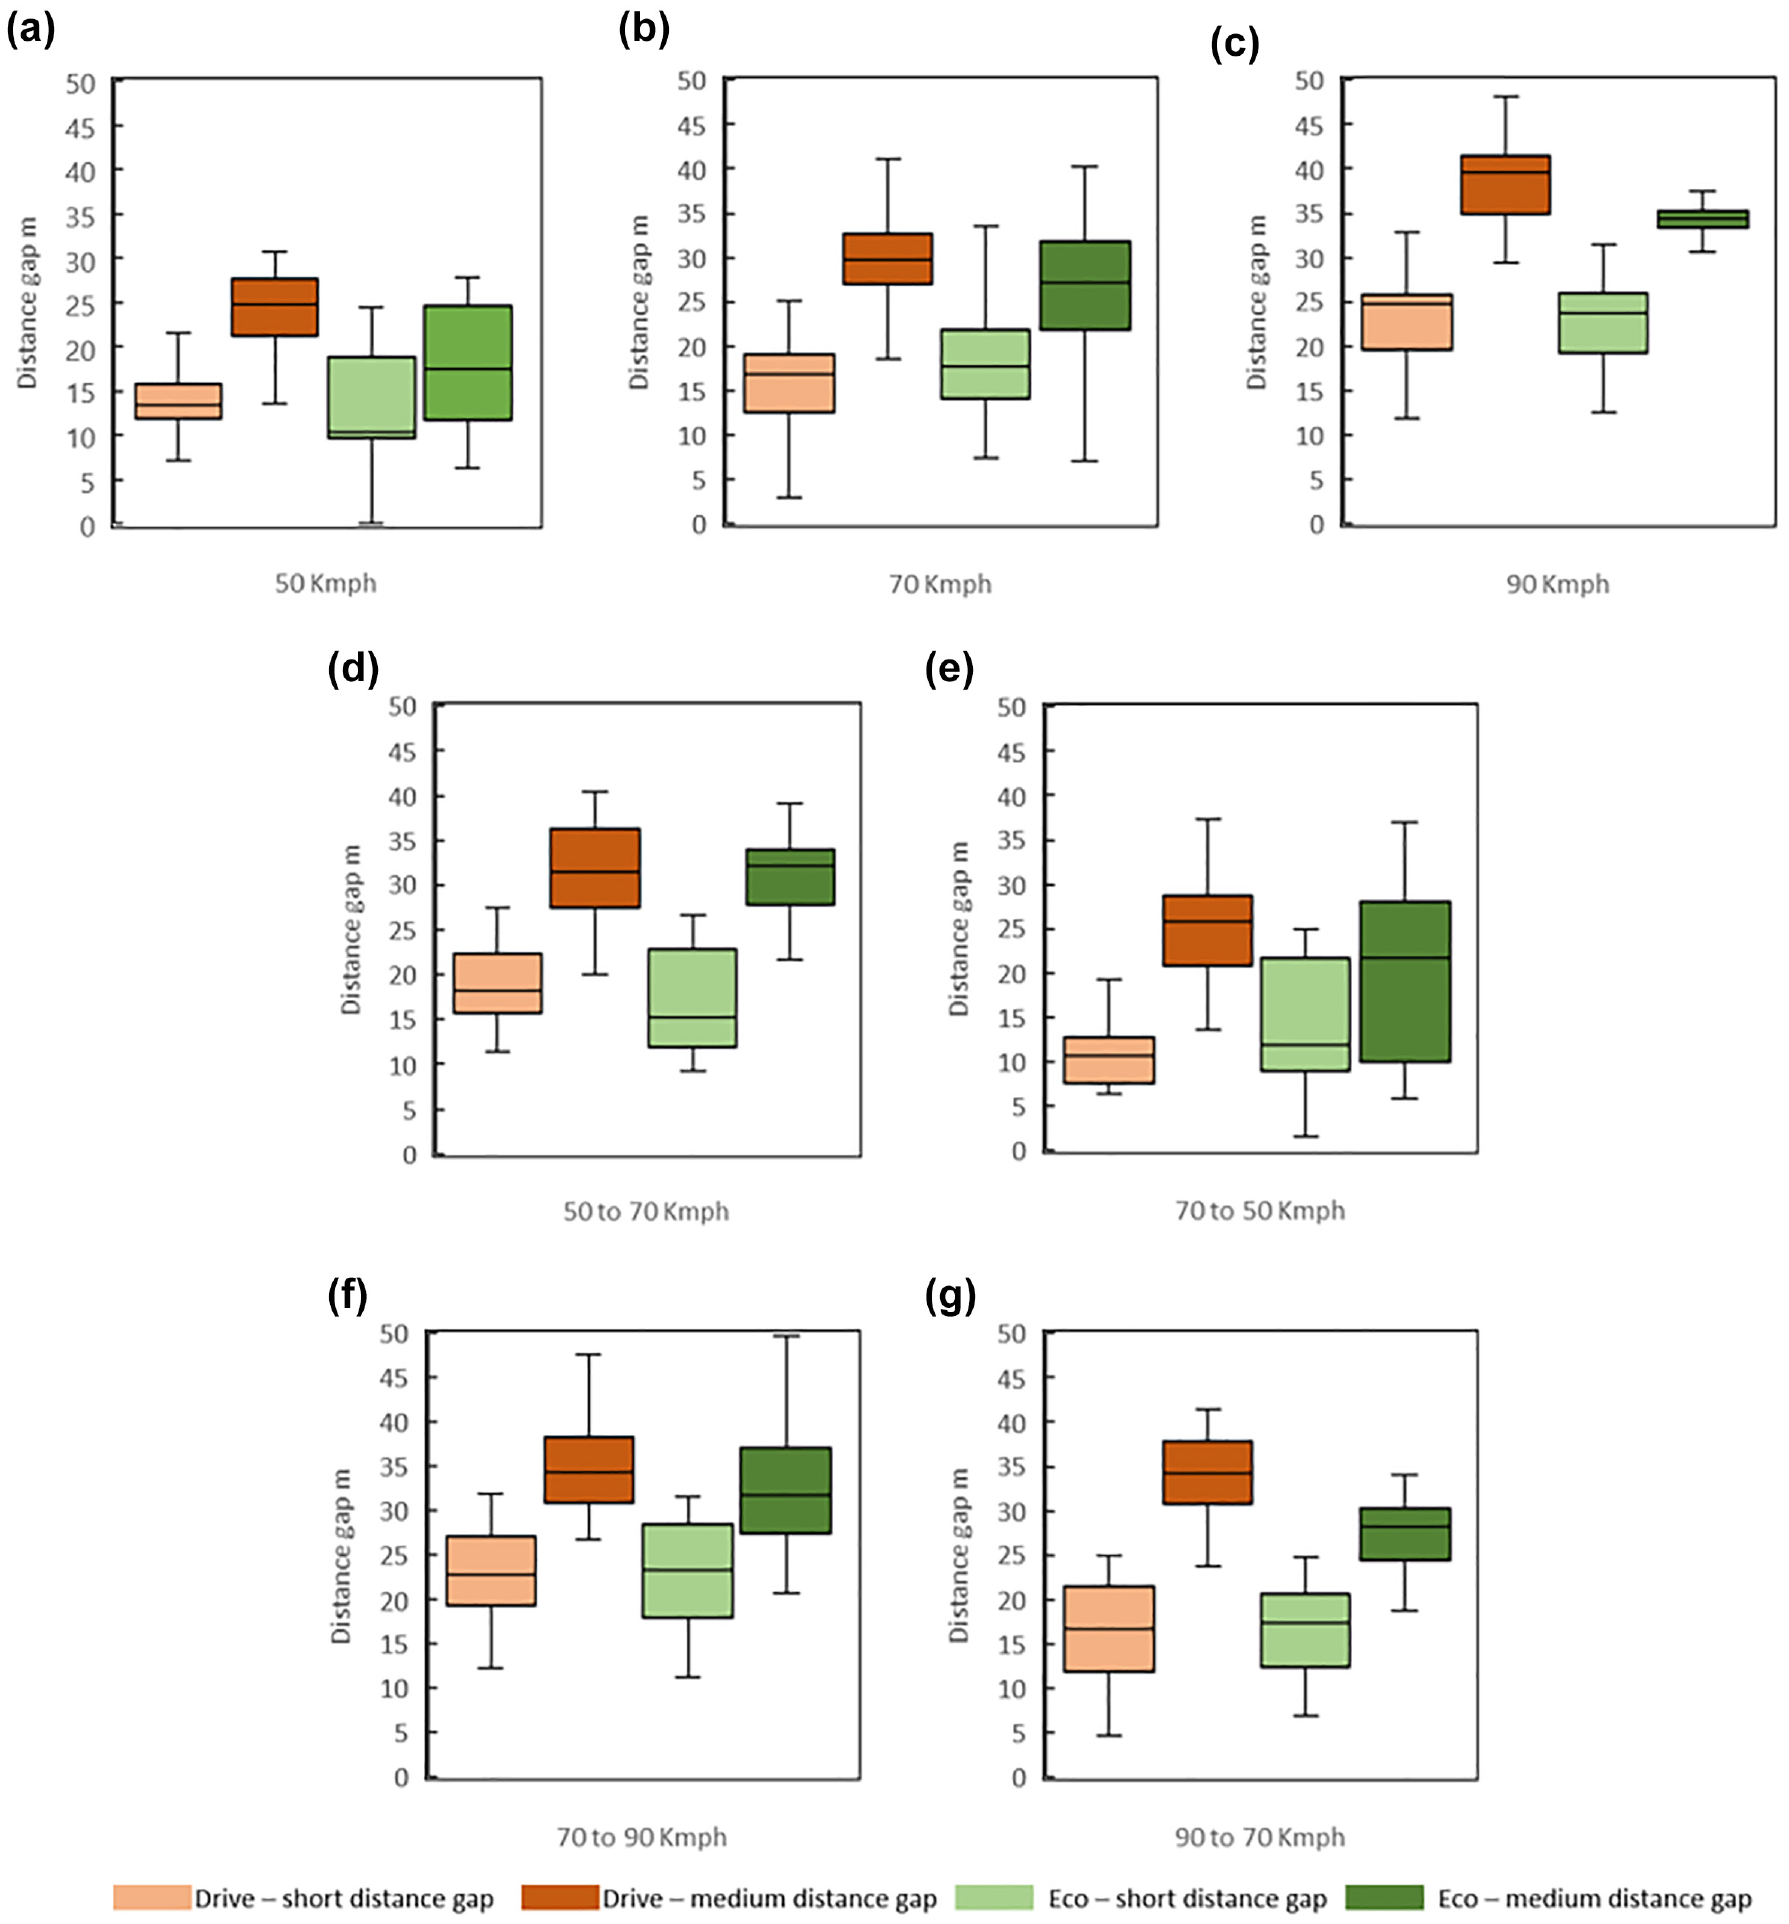
Distance-gap analysis of the following vehicle in different scenarios.
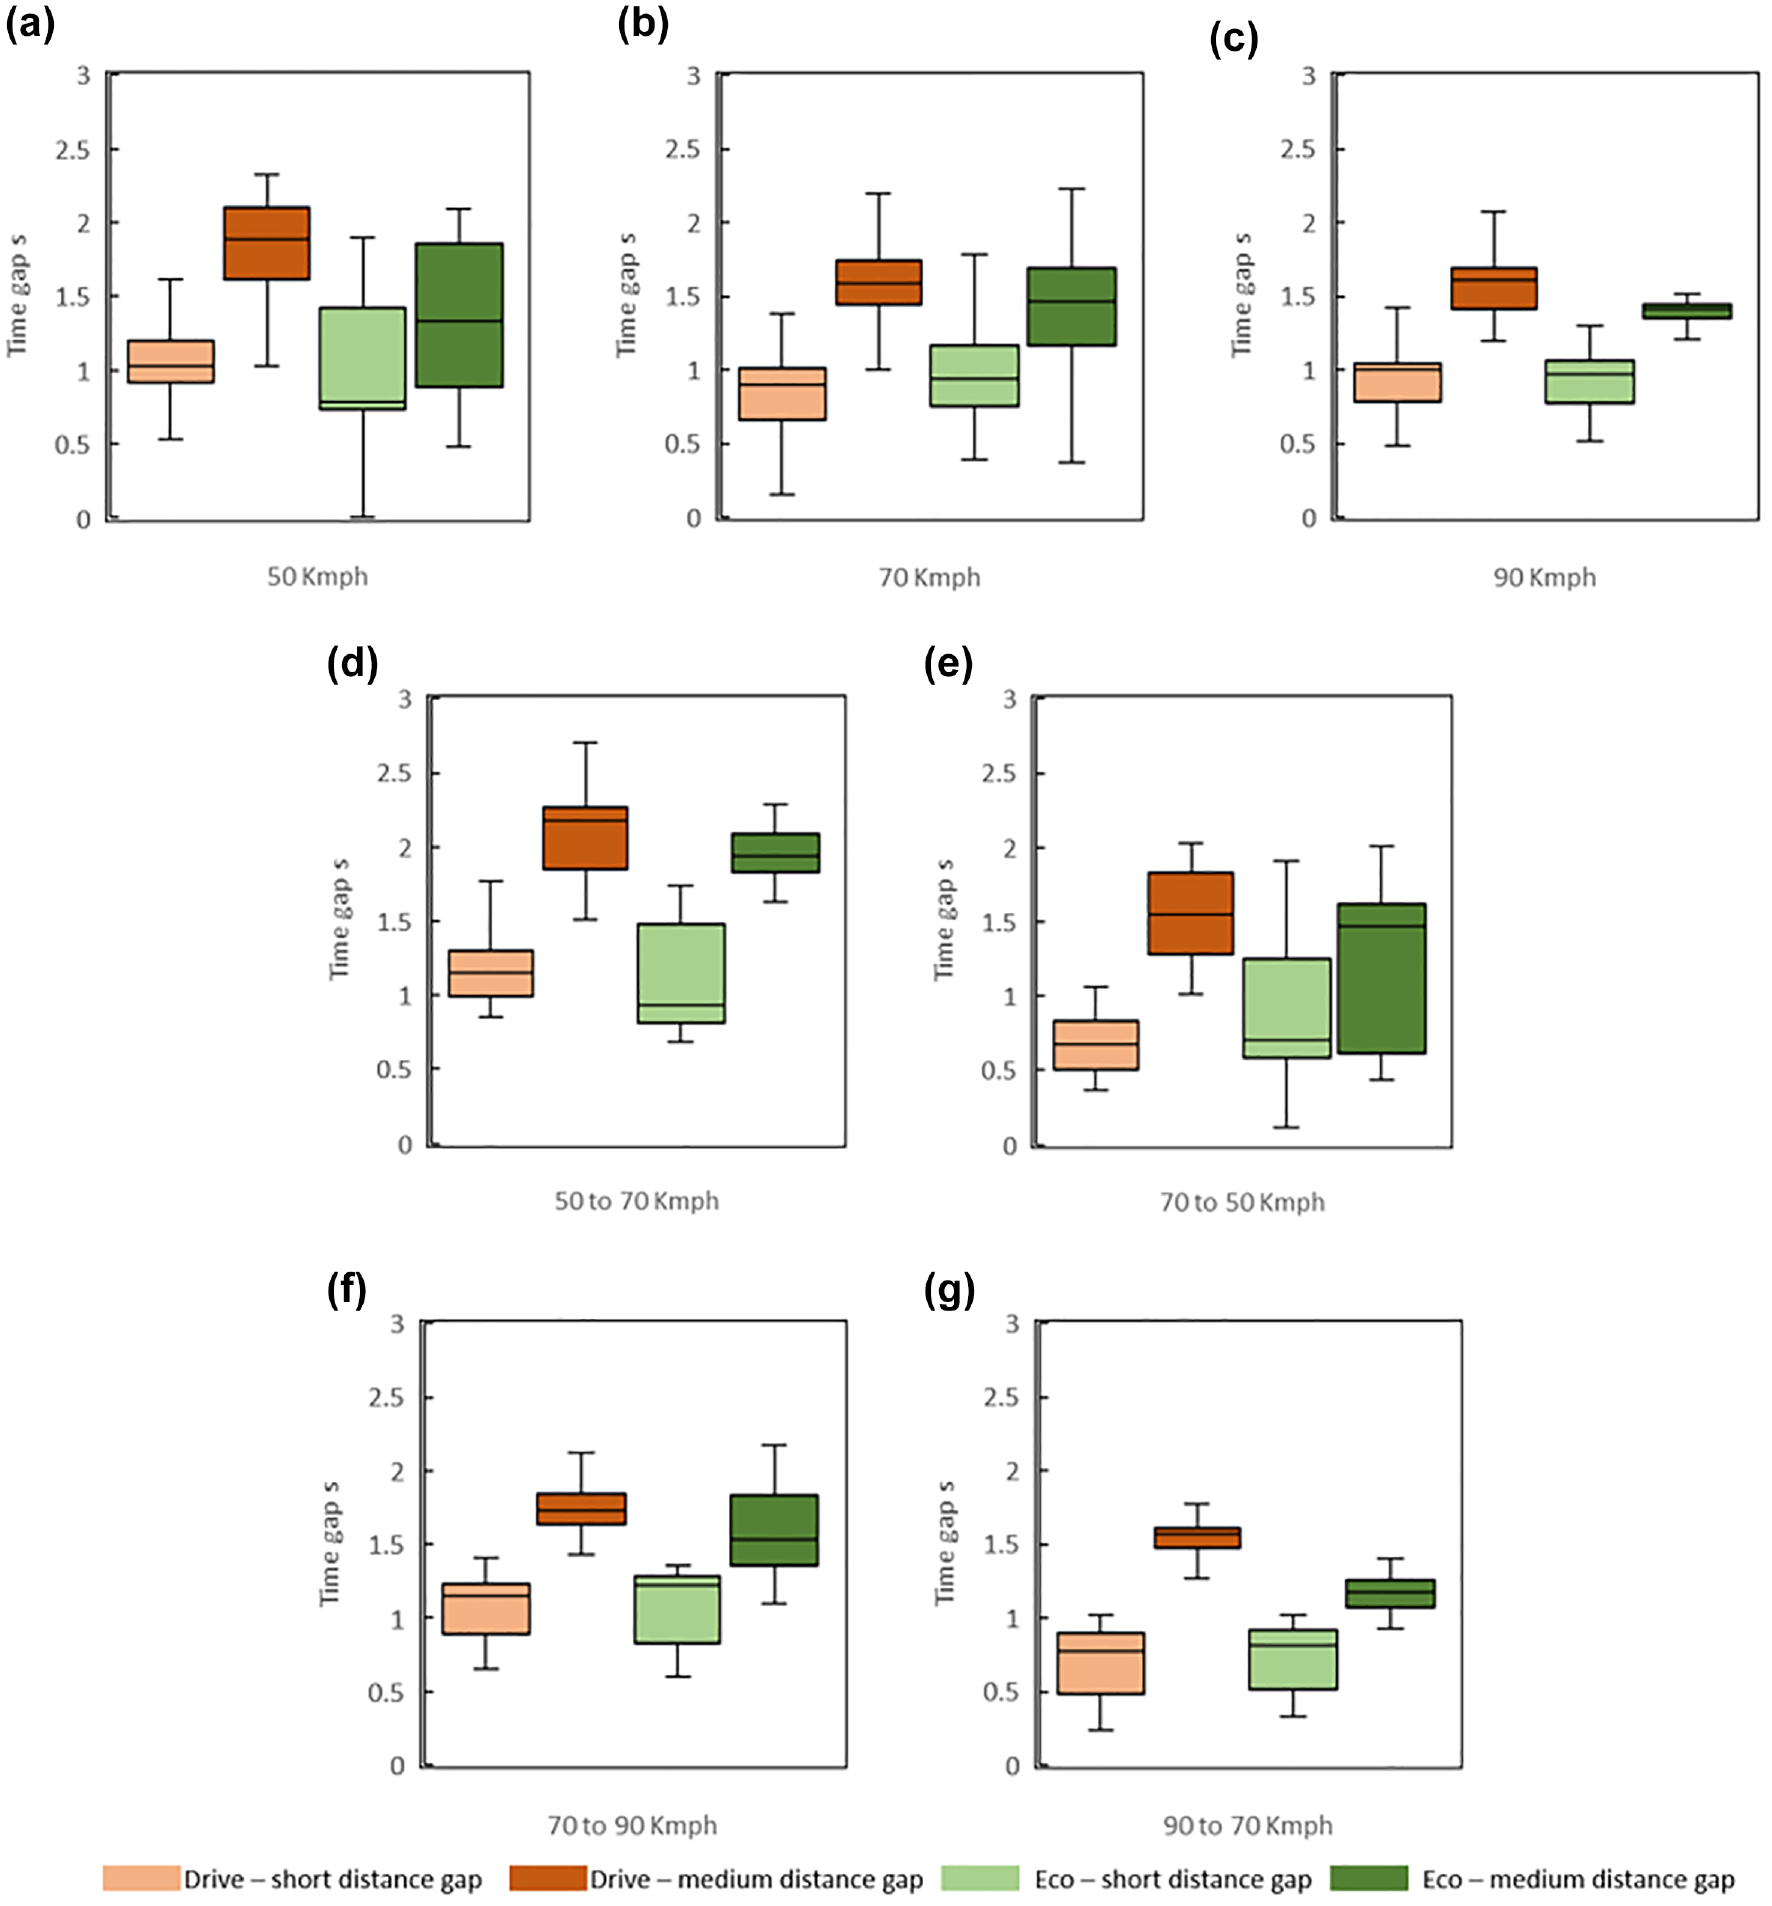
Time-gap analysis of the following vehicle in different scenarios.
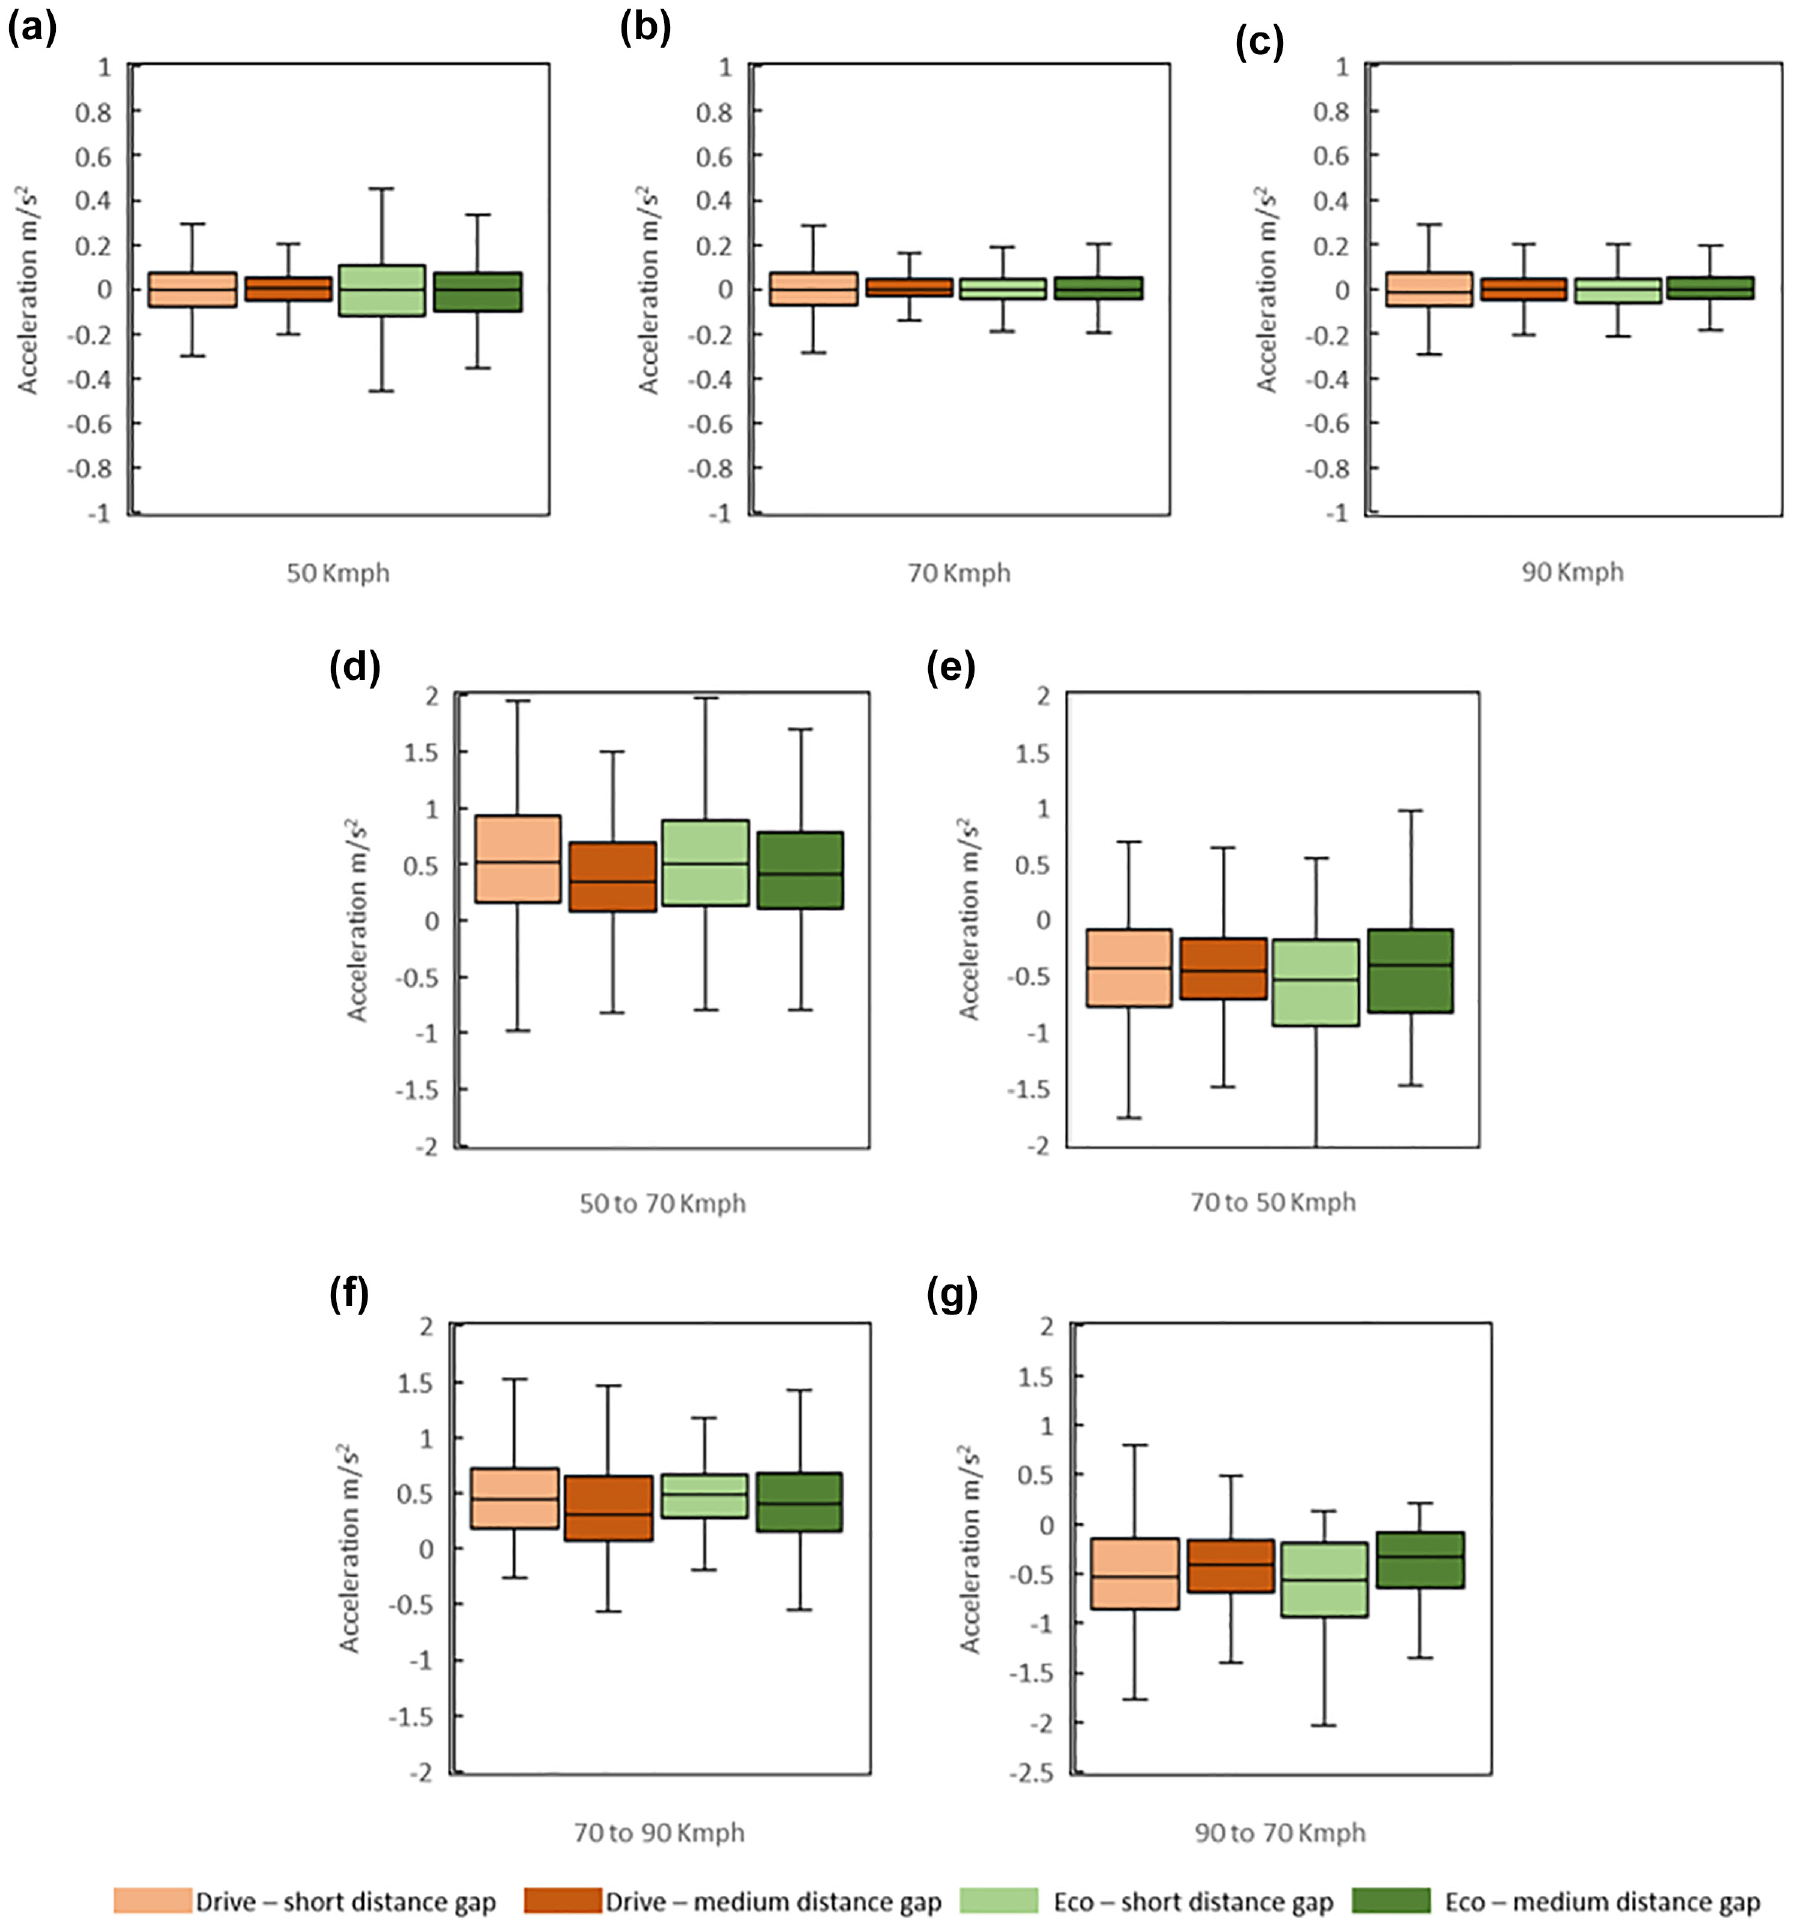
Acceleration of the following vehicle in different scenarios.
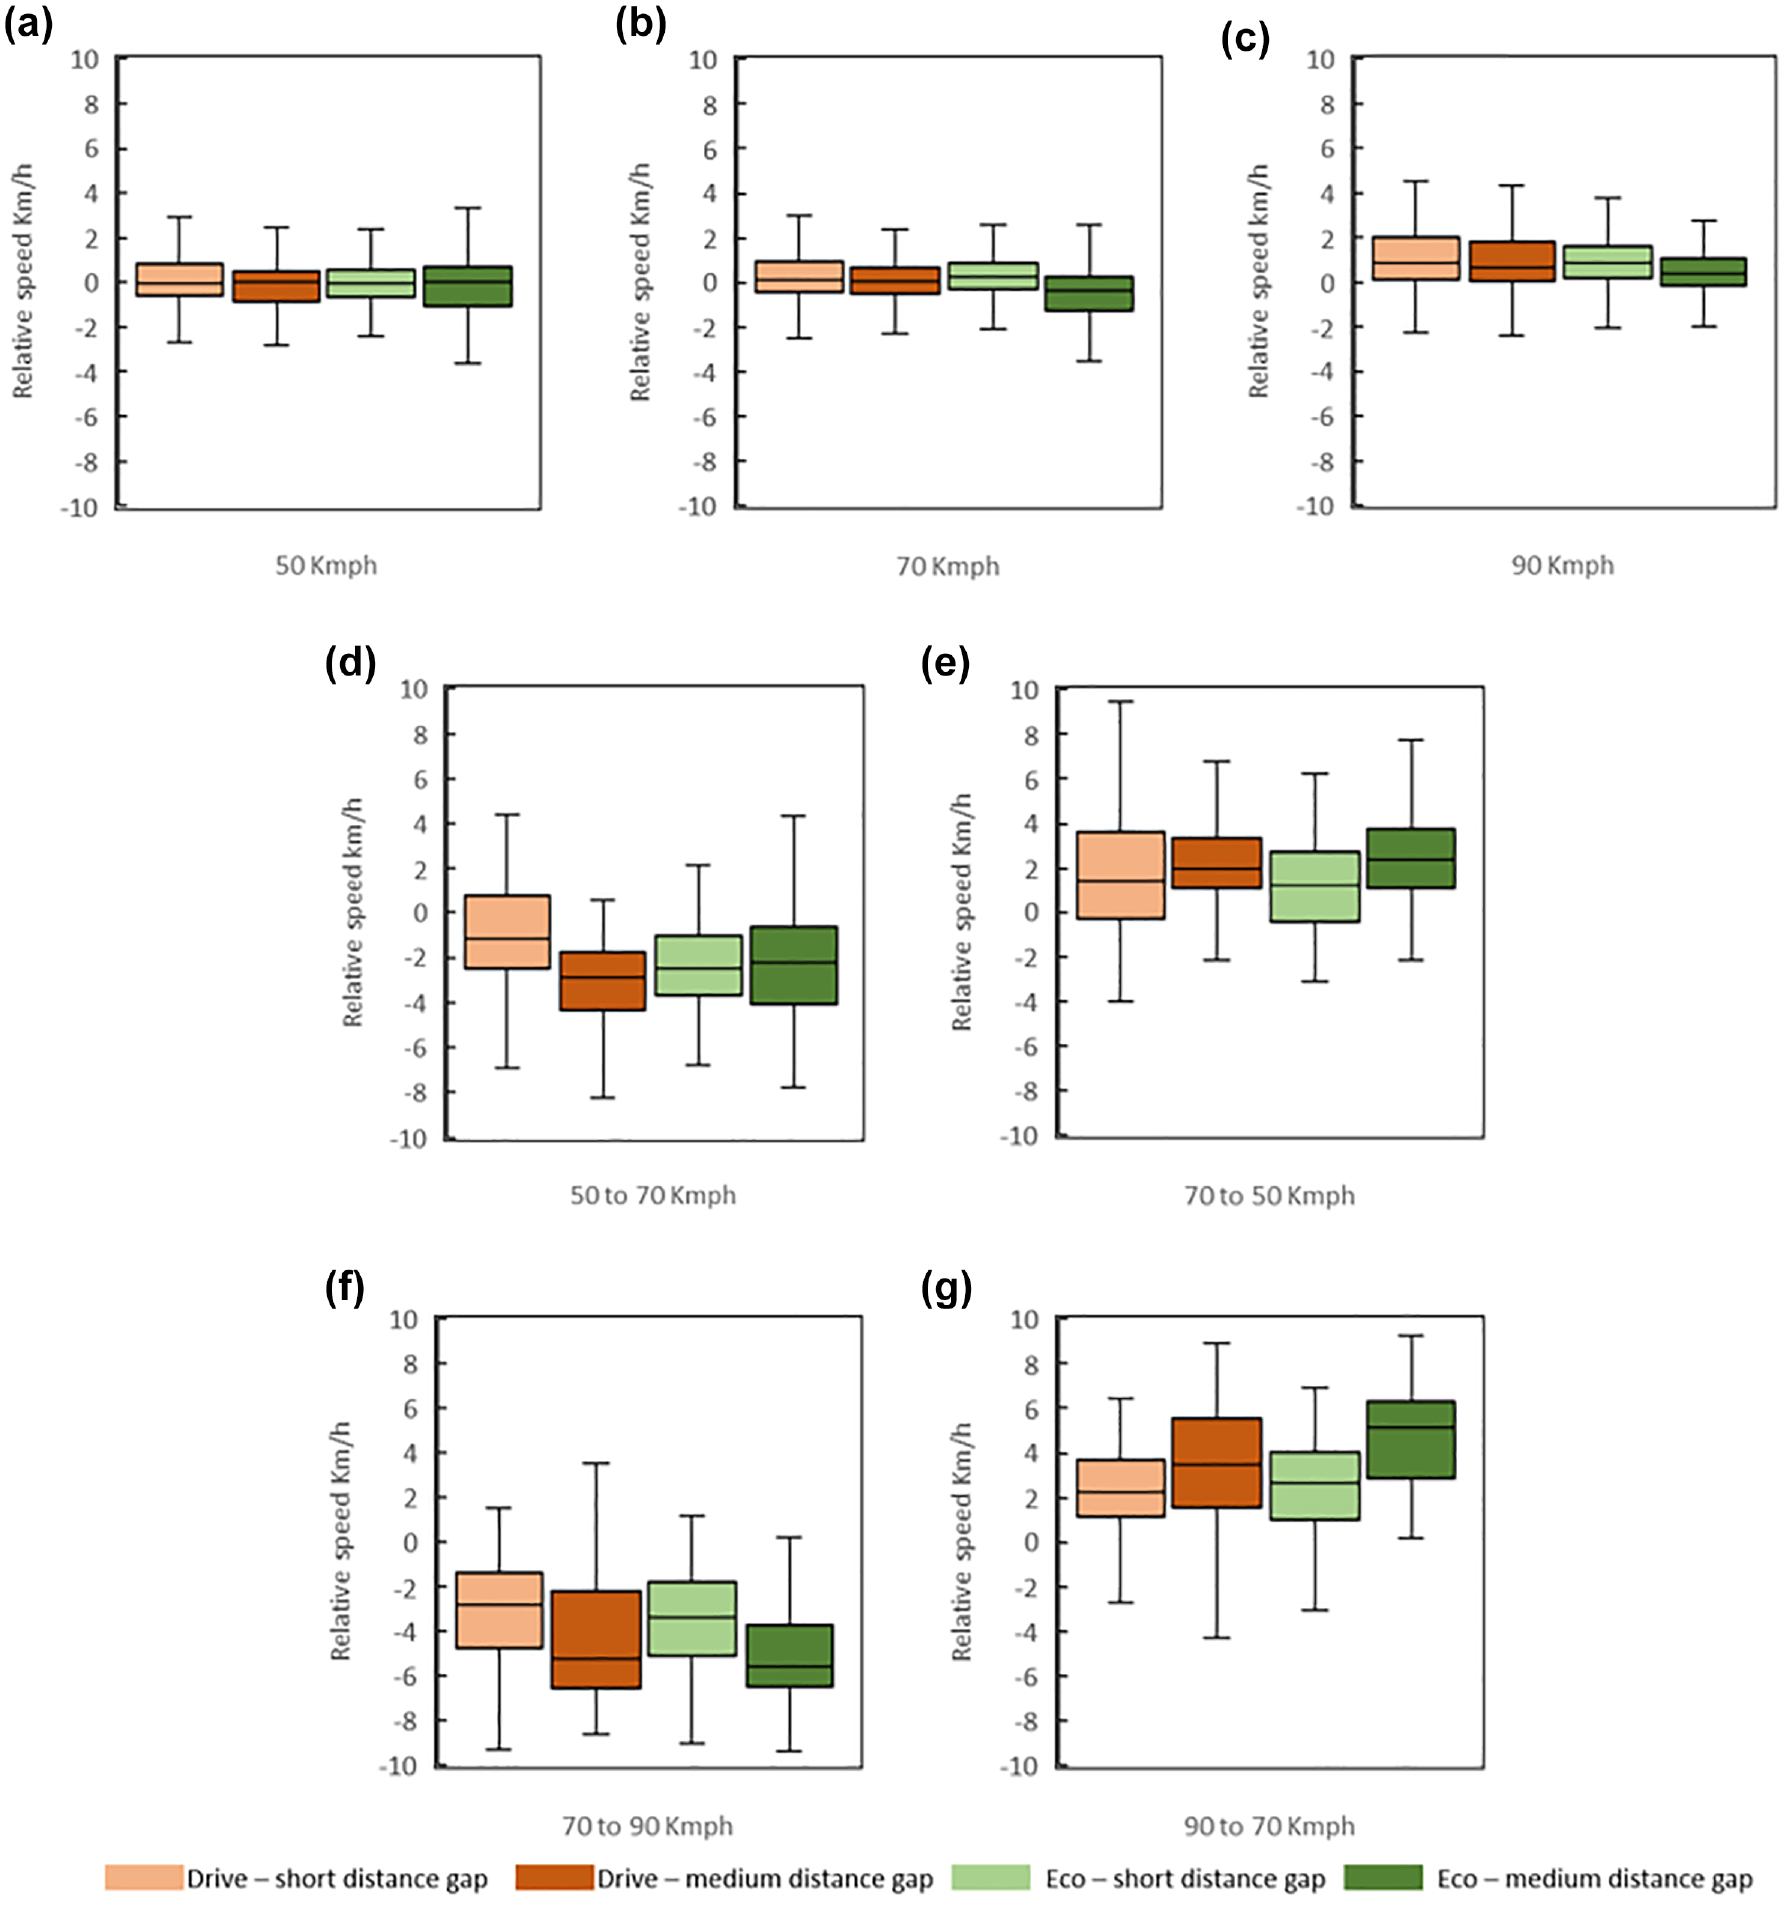
Relative speeds between the two vehicles in different scenarios.
From the analysis results, it is observed in Table 5 that the actual distance gaps maintained in the short and medium-distance gap modes at speed setting of 90 km/h are on average 22.8 m and 36.2 m, respectively, close to those reported in Table 2. Overall, the distance gap tends to have a standard deviation in the range of 2 to 9.8 m considering all driving scenarios. From Figure 3, it is observed that the distance gap variation in “Drive” modes is less in comparison with the “Eco” modes, except for the higher driving speeds nearing 90 km/h. Interestingly, in most scenarios with short-distance gap setting, the medians of the distance gap settings of the “Drive” and “Eco” modes are similar. This is not the case for the medium-distance gap, where in most cases the distance gap in the “Eco” mode is lower than the median distance gap in the “Drive” mode. The ACC tends to maintain a following distance gap in the range of 3 to 30 m in short-distance gap settings and 15 to 47 m in medium-distance gap settings. From Table 5, it can be noted that in case of constant speed conditions, the distance gaps between the vehicles tend to increase as the driving speed setting increases. For example, in the case of 50 km/h, the mean distance gaps for short and medium-distance gap settings are around 13 and 20 m, respectively. For 70 km/h, the mean distance gaps are around 17 and 27 m, and for 90 km/h, it is near to 23 and 35 m. In the experiment, the distance gap tends to have maximum variation at 70 to 50 km/h medium “Eco” mode scenario, and minimum variation at 90 km/h medium “Eco” scenario.
The time gaps between the vehicles shown in Figure 4 tend to follow the same trend as the distance gaps. The average time gaps between the vehicles at speed setting of 90 km/h and short and medium-distance gap settings are close to the stated time gaps in the manual, 1.1 and 1.7 s, respectively.
System’s Acceleration Behavior (RQ2)
On similar lines, to understand the follower vehicle reaction to the leader vehicle changes in speed, the instant accelerations of the follower vehicle in the different scenarios were analyzed, and the results are presented in Figure 5. From the analysis, it is observed that the variation in accelerations of the follower vehicle is minimal for the stable speed conditions (i.e., 50, 70, 90 km/h). For those cases, the interquartile range is around −0.1 to 0.1 m/s2, and the interquartile ranges in short-distance gap settings are marginally higher when compared with medium-distance gap settings, for the respective mode settings. For the speed change conditions (i.e., acceleration and deceleration), the interquartile acceleration ranges are around 0 to 1 m/s2 and −1 to 0 m/s2. Like stable speed conditions, other than the 70 to 50 km/h scenario, the interquartile acceleration ranges at short-distance gap settings are marginally higher compared with the medium-distance gap settings. As expected, the mean accelerations in stable speed conditions are near zero, and for speed change conditions, the mean is around −0.5 and 0.5 m/s2, respectively.
The relative speeds (speed of follower minus speed of leader) between the vehicles were analyzed and are presented in Figure 6. In stable speed conditions, the mean and median relative speeds are near zero, with a standard deviation of less than 2 km/h. When accelerating from 50 to 70 km/h the mean relative speed range is between −0.8 and −3.2 km/h, and when decelerating from 70 to 50 km/h the mean relative speeds are in the range of 1.1 and 2.8 km/h. The standard deviations range between 1.8 and 2.8 km/h. For acceleration from 70 to 90 km/h the mean relative speeds are in the range of −3.1 and −4.9 km/h (higher compared with acceleration from 50 to 70 km/h), and when decelerating from 90 to 70 km/h, the mean relative speeds are in the range of 2.2 and 4.3 km/h (again higher than from 50 to 70). The standard deviations range between 2.2 and 4.0 km/h. Interestingly, in speed change conditions, the data points are closer to zero for short-distance gap settings, whereas for the medium-distance gap settings, the data points are shifted away from zero.
Based on the microscopic analysis for the different scenarios, it is identified that the vehicle closely follows its leader in the case of short-distance gap and “Drive” mode settings. As a result, there is less variation in the distance/time gaps and the relative speeds. In medium-distance gap and “Drive” mode settings on the other hand, the vehicle is likely to have more spacing from the lead vehicle to adjust its motion. As a result, the relative speed data of the vehicles are shifted away from zero. In the case of “Eco” mode settings, the vehicle is aligned to limit fuel consumption. Given this, the vehicle in “Eco” mode gives greater priority to maintaining stable speed over adjusting the distance gap. As a result, in the following conditions, the variation in distance/time gaps is higher for the “Eco” mode in short- and medium-distance gap settings.
Response Time Analysis (RQ3)
Response times were aggregated for different groups of scenarios because of limited number of observations. For example, all scenarios with a speed setting of 50 km/h, regardless of the distance gap setting or the driving mode (i.e., “Drive” or “Eco”), were gathered under the name “50 km/h” in Table 6. Table 6 presents the mean value and standard deviation of the response times for each group of scenarios. In each row (except the first row) two groups were compared using a two-sample Kolmogorov–Smirnov test. The overall mean response time is 2.08 s with standard deviation of 1.24 s. At constant speeds, the response time is larger for larger speeds (1.24, 2.49, and 3.17 s for 50, 70, and 90 km/h, respectively). The medium time-gap setting results in longer response times than shorter time-gap setting, with 2.25 s over 1.90 s, which is according to expectations. The “Drive” mode versus “Eco” mode seems to make no difference in the response time. There also appears to be no statistically significant difference in response times when starting to accelerate or decelerate. Finally, the end of acceleration or deceleration (difference in time of the end of episode between leader and follower) results in different response times, with a mean of 2.45 s at the end of acceleration and 1.45 s at the end of deceleration.
Response Time Statistics
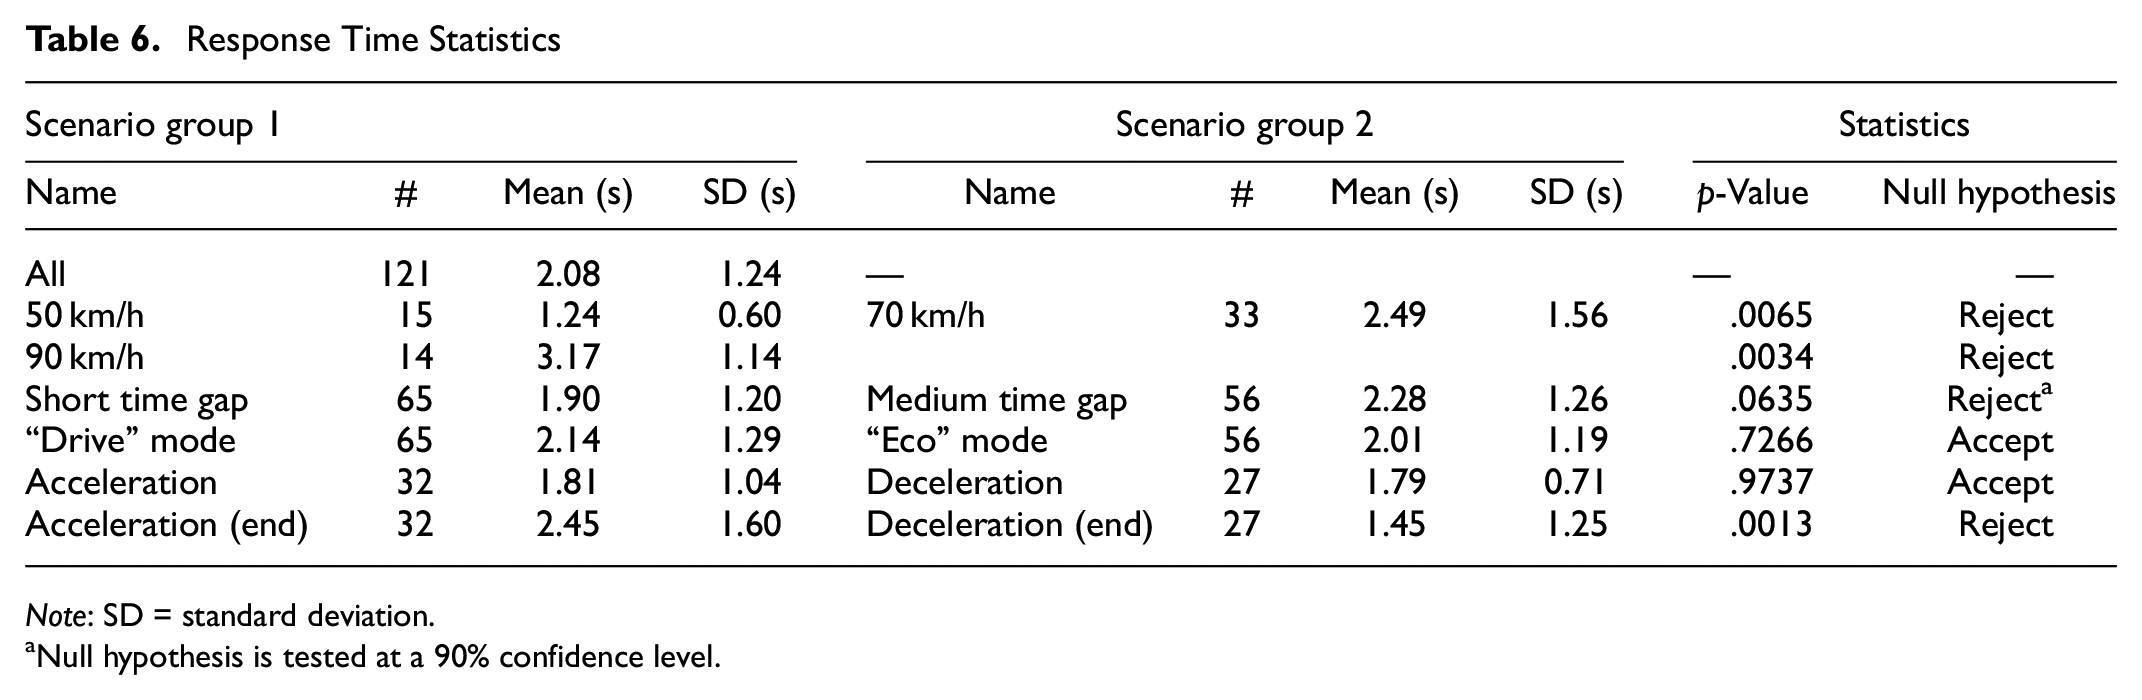
Note: SD = standard deviation.
Null hypothesis is tested at a 90% confidence level.
Discussion
In this study empirical data were collected in a controlled field test to investigate the actual performance of an ACC system under different driving speed, distance gap, and driving mode settings. In addition, an analysis methodology was developed and is proposed to analyze the collected data and identify different driving regimes. A first exploration of the different distance gap settings available in the system revealed that the long-distance gap setting (~2.2 s) led to frequent cut-in situations by nearby vehicles, and therefore in the field test only the short and medium-distance gap settings were included. This finding is similar to the earlier finding by Li et al. ( 19 ), who considered only levels 1 (short) and 3 (medium) for the headway setting in the tested vehicle (settings range: 1–7), skipping higher headway settings. The measured mean time gaps in the current study ranged between 0.7 s to 2.1 s, which is lower than the range of time headways 1–4 s reported in Makridis et al. ( 17 ) of several ACC systems. Li et al. ( 15 )’s finding that car-following behavior of ACC systems depends largely on the time-gap setting and leader stimulus is also reflected in this study. As an example, the following-time gap at 90 km/h is 0.9 s for the short-distance gap setting and 1.6 s for the long-distance gap setting. The analysis in this study, however, did not delve into the effect of leader stimulus.
The relative speed and acceleration analysis revealed that the mean and median relative speeds in stable speed conditions are near zero with a standard deviation of less than 2 km/h, and the interquartile range for acceleration is around −0.1 to 0.1 m/s2. In acceleration and deceleration scenarios, the relative speeds are higher for higher speeds. In other words, the relative speeds for acceleration/deceleration range of 70–90/90–70 km/h are higher than for acceleration/deceleration range of 50–70/70–50 km/h. For medium-distance gap settings, the relative speeds are larger than for short-distance gap settings. Similarly, the acceleration interquartile ranges in short-distance gap settings are marginally higher when compared with medium-distance gap settings. For the speed change conditions (i.e., acceleration and deceleration), the interquartile acceleration ranges are around 0 to 1 m/s2 and −1 to 0 m/s2.
The “Eco” mode was found to affect some of the car-following indicators. During scenarios of acceleration or deceleration, the “Eco” mode results in speed differences further from 0 km/h. The time and distance gaps are also closer to 0 s and 0 m, respectively. The effect on the gap is mostly seen for the medium-distance gap setting and not for the short-distance gap setting. Interestingly, the gap is also closer to 0 s or 0 m in the constant speed scenarios in “Eco” mode. For acceleration however, no differences were found. The user manual of the vehicles describes the “Eco” mode in case of using ICC as “the vehicle makes it a priority to maintain a constant speed.” From the results it appears that this is achieved by using slack in the time gap to maintain a more constant speed. But once the slack is gone (e.g., in the range of the short headway setting during acceleration), there is little to no difference. Therefore, “Eco” mode does not deteriorate safety below the safety level of driving with the short headway setting in drive mode.
Response times were larger when reaching higher speeds. This was likely largely because of higher speeds being reached more after acceleration, rather than deceleration. Note that the 90 km/h scenarios were only reached after acceleration, the 50 km/h mostly after deceleration (with few exceptions after accelerating from an intersection), whereas 70 km/h was reached after both acceleration and deceleration. Results show that the response time at the end of acceleration was 2.45 s on average, and larger than the response time after deceleration with a mean of 1.45 s. Response times seem large overall, when compared with general reaction times. This is probably related to the specifics of data smoothing (moving average over 3 s) and the thresholds being used. These values should not be taken as absolute and accurate measurements, but should only be regarded for comparison between scenarios. Despite of this, Makridis et al. ( 17 ) had a similar finding that reaction times of ACC systems are comparable to those of human drivers and not instantaneous. The response times measured in this field test, ranging between 1.24 and 3.17 s, also suggest that the ACC system does not react instantaneously to the leader. The measured response times are similar to the ACC response times range of 1.1 to 4.1 s found in Porfyri et al. ( 8 ). This brings into question the popular expectation that automated systems have almost negligible reaction times, which is assumed in many simulation studies.
Conclusions
The main conclusion of this study is that the different system settings (i.e., speed, distance gap, and driving mode) affect the car-following indicators (e.g., time and distance gap, relative speeds, and acceleration), and the system response time. Therefore it is important to consider the system settings in the development of behavioral models and in traffic modeling. In addition, opposite to what is expected, and in line with previous research, the response time of the ACC system is not instantaneous and is comparable with human driver response time. This has implications for traffic safety and traffic stability. Considering that different automated vehicles have different ACC system settings, this can lead to increased heterogeneity in traffic. Therefore, understanding the actual behavior of different ACC systems is an important step to be able to assess the potential effects on traffic flow and traffic safety.
Along with the insightful results of this study there are several limitations that require further explorations, and additional research directions that could be investigated in the future. In the pilot field test of this study the location coordinates of the two vehicles were derived from GPS devices integrated in the GoPro cameras and medium-fidelity GPS devices. These GPS devices do not have high accuracy level, resulting in some errors in the observations of the distance and time gaps, as well as the relative speeds and accelerations. In addition to this, the specific smoothing technique and thresholds used for calculating the response time would also affect the results. Future research is recommended to use higher fidelity GPS devices and explore the impact of different smoothing techniques and thresholds on the results obtained. The developed methodology for data extraction and processing in this study, however, can still be applied in future field tests for analyzing other ACC systems. In this study the performance of one commercial ACC system type was investigated because of limitations in resources. Future field tests could compare the performance of different ACC systems from different OEMs, similar to recent efforts by Gunter et al. ( 16 ) and Makridis et al. ( 17 ). The field test in this study was restricted to mostly dry weather and daytime conditions on provincial roads with speed range of 50–90 km/h and mostly car-following on straight sections (or large curves). Future research can test these systems in different weather and daytime conditions, and in other interaction scenarios including deceleration and acceleration when approaching signalized intersections, and standstill distance and time gaps in moving traffic jams, and ACC performance when following a human-driven vehicle or vehicles with other ACC systems. Furthermore, understanding the implications of vehicles equipped with ACC on traffic safety and stability, especially when in a platoon, is needed.
Footnotes
Acknowledgements
We would like to thank the Province of North Holland and Nissan Netherlands for their support in facilitating this pilot field test. We would like to thank Dr. Paul van Gent for his assistance during the pilot field test.
Author Contributions
The authors confirm contribution to the paper as follows: study conception and design: N. Raju, W. Schakel, N. Reddy, Y. Dong, and H. Farah; data collection: W. Schakel and N. Raju; analysis and interpretation of results: W. Schake and N. Raju; draft manuscript preparation: N. Raju, W. Schakel, N. Reddy, Y. Dong, and H. Farah. All authors reviewed the results and approved the final version of the manuscript.
Declaration of Conflicting Interests
The author(s) declared no potential conflicts of interest with respect to the research, authorship, and/or publication of this article.
Funding
The author(s) disclosed receipt of the following financial support for the research, authorship, and/or publication of this article: This work was supported by the Applied and Technical Sciences (TTW), a subdomain of the Dutch Institute for Scientific Research (NWO) through the Project Safe and Efficient Operation of Automated and Human-Driven Vehicles in Mixed Traffic (SAMEN) under Contract 17187.