
Abstract
This paper examines the impact of roundabouts implemented at intersections throughout a dense urban network on its operational performance. Metrics considered include the average free-flow speed, flow-moving capacity, trip-serving capacity, and fuel consumption rate. Three intersection strategies are compared: signalized intersections allowing left turns in a permitted manner (TWs), signalized intersections prohibiting left turns (TWLs), and modern roundabouts (RBs). Using the approaches of macroscopic fundamental diagrams and network exit functions, both analytical investigations and microscopic traffic simulations for grid networks were conducted. In general, the results from both analyses agree well. The results reveal that when single-lane roundabouts are applied in networks with a single travel in each direction, the RB network outperforms the TW network for all operational metrics. The RB network also outperforms the TWL network in free-flow speed and flow-moving capacity and has a similar trip-serving capacity as the TWL network. However, when roundabouts with two travel lanes are applied on multi-lane networks, the TWL network exceeds the RB network in both flow-moving and trip-serving capacities. This decrease in the performance of the RB network could possibly come from the complexity imposed on the entering vehicle that wants to use the inner lane. Moreover, because vehicles in the RB network need to accelerate/decelerate more frequently those in the other networks, the RB network generates a higher fuel consumption rate in uncongested and capacity conditions. The findings suggest intersections of roundabouts could be beneficial for networks with a single travel lane in each direction.
Intersections are critical locations in transportation roadway networks where conflicting traffic streams are forced to interact. The most common traffic control strategies at intersections in urban environments are stop-control or traffic signals. However, even with these control strategies, intersections are still the major bottlenecks for urban networks since they cause considerable crashes and traffic delays: the National Highway Traffic Safety Administration (NHSTA) estimates that U.S. drivers averaged over 1.9 million property damage crashes, 900,000 injury crashes, and 8000 fatal crashes annually at intersections between 2015 and 2019 ( 1 ); in addition, estimated delay costs had been rising every year for nearly three decades, peaking at US$190 billion in 2019 ( 2 ). Adding supplementary infrastructure to accommodate growing traffic demands is difficult in urban areas since they are typically “built out”—little to no space exists for additional roadways in dense urban environments. Thus, efficient intersection management methods serve as the most practical way to reduce travel delays/congestion, as well as provide safer vehicular movements.
One proposed solution to manage conflicting traffic streams is through the use of roundabouts. Roundabouts are traffic control devices in which the traffic circulates around a central island at the intersection and entering traffic yields to traffic in circulation. They have been shown to both reduce the severity and frequency of conflict points ( 3 ). As an established intersection type in Europe and Australia, roundabouts have increased significantly in the U.S.A. over the past three decades: there were 38 as of October 1997 ( 4 ) and over 8000 inventoried as of January 2022 ( 5 ). A major factor in roundabouts’ increasing prevalence is their safety performance: the Federal Highway Administration (FHWA) lists the modern roundabout as one of its 20 proven safety countermeasures, citing a 78% reduction in severe crashes compared to signal-controlled intersections ( 6 ). In an urban setting, conversion of an intersection from signal to modern roundabout reduces injury and fatal crashes by 60% ( 3 ). In addition to the improvement in roadway safety, roundabouts with metering signals have also been demonstrated to save fuel consumption, pollutant emissions, and operating costs ( 7 , 8 ).
Roundabouts also impose less delay and may improve intersection capacity since vehicles do not have to stop. Most of the studies of the effect of roundabouts on travel delay are modeled as a before-and-after comparison, where the “before” conditions are another form of intersection control, and the “after” conditions are a proposed or implemented roundabout. Three particular studies observed significant improvements in all traffic performance measures after a conversion to single-lane ( 9 , 10 ) roundabouts at isolated intersections and two-lane ( 11 ) roundabouts at intersections separated by over a mile with a 50 mph speed limit. In the single-lane cases, intersection delay was reduced by 30%–93%, and maximum delay was reduced by 35%–96%. In the two-lane cases, intersection delay was reduced by 4% and 40%, with maximum delay reduced by 85% and 62%, respectively. A handful of studies have focused on roundabout application along corridors. For example, a study in Golden, Colorado, found that the installation of four roundabouts along an arterial reduced average delay from 28 to 13 s per vehicle and maximum delay from 118 to 40 s ( 12 ). Another study found two series of roundabout installations in Kansas would reduce delays by 71% and 81%, and improve levels of service at the intersections significantly ( 13 ). In addition, Bared and Edara ( 14 ) used microscopic traffic simulation to study the effect of roundabouts in a progressed signalized road. The authors found roundabouts to perform similarly to the signals in each scenario, with neither alternative clearly outperforming the other. The accuracy of the evaluation of roundabout operations is dependent on the parameter calibration ( 15 ) and traffic conditions ( 16 ). A more detailed discussion on the benefits of the implementation of roundabout networks in urban networks can be found in Macioszek et al. ( 17 ). Above all, the improvement in traffic flows from the implementation of roundabouts has been widely demonstrated; however, all these studies focused on isolated intersections or corridors, and the impact of the network-wide implementation of roundabouts—particularly in urban areas—is not well understood. To bridge this gap, this paper aims to investigate the effect of roundabouts on traffic operations at a network-wide level.
Recently, several studies have applied network-wide or macroscopic performance measures to quantify the performance of various street network designs and intersection control types on urban traffic networks. Examples include use of one-way versus two-way streets or prohibition of conflicting left turns at signalized intersections ( 18 – 21 ). These studies leverage the existence of relationships between network productivity (e.g., average flow or trip completion rate) and use (e.g., average density or accumulation of vehicles) across a network, which have been shown to exist both theoretically ( 22 ) and empirically ( 22 , 23 ). Relationships between network average flow and density are more commonly known as network macroscopic fundamental diagrams (MFDs), and relationships between the trip completion rate and accumulation are often known as network exit functions (NEFs). Such an approach might also provide insight into how roundabout control might change traffic performance when implemented across a traffic network.
In light of this, the purpose of this study is to examine the influence of network-wide implementation of roundabouts on traffic operations as opposed to signalized intersections. Specifically, we compared the average flow, network exit rate, and fuel consumption between networks consisting of signal lights at all intersections and another one with roundabouts at all intersections using both analytical analysis and microscopic traffic simulations. Two types of signalized networks are selected as the benchmarks. The first is a network consisting of two-way streets and left turns are served in a permitted fashion at all intersections, which is common setting for urban transportation networks (denoted TW). The second is also a network consisting of two-way streets but the left turns are prohibited at all intersections (denoted TWL). Previous studies ( 18 , 19 , 21 ) have demonstrated that restricting left turns can improve the mobility at a network level resulting from the decrease in lost time and increase in the intersection capacities. This paper aims to demonstrate that roundabouts can also enhance the network mobility since vehicles do not need to stop (completely) at intersections. Therefore, the second type of signalized network is considered to explore the comparison between these two control strategies. In addition, different network sizes and link lengths are studied to ensure the generalization of the findings.
The rest of this paper is organized as follows. Firstly, analytical estimates are used to compare the performance of networks with roundabouts to those with signalized intersections using a variety of metrics. Next, the simulation tests that are used to confirm these analytical findings are described. Then, the results of the simulation tests are presented. Finally, concluding remarks are provided.
Analytical Investigation
This section compares the influence of three network strategies from the theoretical perspective, which is helpful for the readers to better understand the findings in the microscopic traffic simulation presented in the following section. This section applies macroscopic urban traffic modeling techniques to examine how operational performance and fuel consumption within a network might compare when roundabouts are applied within a network, as opposed to signalized intersections. Three network strategies are considered: (1) TW; (2) TWL; and (3) a network with roundabouts at all intersections (denoted RB). For simplicity and to facilitate the analytical investigation, we assume that in the TW networks that left turns are served using protected phases. This serves as a “best-case,” as the operational performance is expected to be worse if left turns are served using permitted phasing. We specifically focus on comparison of free-flow speed (i.e., average travel speed when the network is uncongested), capacity (i.e., maximum network-wide flow and trip completion rate), and fuel consumption rate (i.e., amount of fuel required per trip). Note that this section is by no means intended to develop an elaborate theory providing precise impact of the three control strategies on these parameters; instead, it serves as a general thought experiment to forecast the impacts and to help explain the simulation results in the following section. To this end, the parameters in the following models were not carefully calibrated. However, all results in this section are new, and they match well with the microsimulation results in the next section.
Free-Flow Speed
To estimate average travel speed in uncongested conditions in the three different network types, two pieces of information are required: average travel distance and average travel time. We assume that the network is well-connected with multiple routing options between all origins and destinations. Under these conditions, average trip length will only change because of restrictions imposed on vehicles at the intersections. In this case, the average trip length for TW networks and RB networks would be similar, since vehicles can make all turning movements at intersections in these network types. Let
The average travel time can be split into two components: travel time spent overcoming distance and travel time spent stopped at intersections. Under uncongested conditions, it is reasonable to assume that vehicles always travel at the speed limit of a link when moving; thus, the former is simply equivalent to the average trip length divided by the speed limit. Assuming that vehicles only stop at intersections, the latter can be estimated as the time spent delayed or slowed down at each intersection. For signalized intersections, this can be estimated easily using queueing diagrams for a given demand. However, for simplicity of calculation, consider a case with extremely light traffic. In this scenario, a vehicle arriving during the green proceeds without incurring any delay; by contrast, a vehicle arriving during the red period would incur the remaining red time as delay. If arrivals to the signal are completely uniform and assuming a two-phase signal with the cycle length (
In a TW network, vehicles would incur additional delay because of the presence of left turns. If served in a permitted manner, vehicles would need to wait for a gap in opposing traffic before proceeding through the intersection. If served in a protected manner, additional phases would be needed to serve left-turning vehicles. We consider this latter case here since it can be readily computed analytically. Assume now that a four-phase signal is required and (for simplicity) twice the green time is allocated for through/right movements as left-turn movements and that the ratio of through/right-turning vehicles to left-turning vehicles is also two. (Note that the green time split between through and left-turn phases would typically be based on the actual fraction of left turns at each intersection, which is simply assumed here. This assumption facilities a simple analytical calculation but does not change the overall outcomes.) In this case, the average delay experienced at each intersection under the same assumptions from the TWL case is approximately equal to
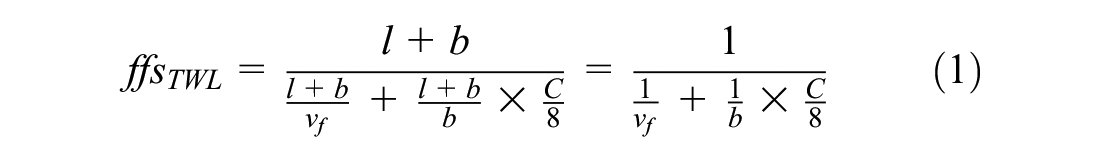
Finally, in a RB network, vehicles would not need to stop at each intersection. However, vehicles need to slow down when traversing the roundabout because of its radius, as well as potentially wait for circulating flow in the roundabout. The latter can be neglected in extremely light traffic; however, we can assume some fixed additional travel time,
Given these calculations, the average free-flow speed in each of the three network types can be expressed as follows:

Interestingly, the results reveal that the average travel speed is independent of the additional travel distance imposed. Note also that TWL networks provide higher free-flow speeds than TW networks, because of the simpler signal timing. Comparing RB networks with TWL and TW networks, the only difference is because of the delay experienced at the intersection. RB networks would provide higher free-flow speeds if the delay experienced at each intersection (
Capacity
The maximum flow allowed per intersection approach in each network type can be computed based on the maximum flow allowable through each intersection, as was done by Gayah and Daganzo ( 18 ). For TW and TWL networks, this is based on the number of lanes allocated to each movement, the saturation flow of each lane, and the proportion of the signal cycle allocated to each lane:

where
The TWL network is the simplest to compute since it requires just a two-phase signal. Assuming that the cycle is allocated to both competing directions evenly, the capacity is as follows:

where
For the TW network, we must assume knowledge of the distribution of lanes allocated to through and left-turning vehicles, as well as the signal timing. Regardless, what is clear is that the capacity of the TW network will be less than that of the TWL network since (1) not all lanes can serve vehicles at the same time; (2) less than half of the cycle will be dedicated to each of the through and left-turning phases; and (3) the saturation flow of left-turning lanes will be less than lanes that serve only through vehicles ( 27 ). Thus, we know that the capacity of the TWL network will greatly exceed that of the TW network.
The RB network requires a different paradigm since there is no signal at the intersection. Interestingly, a roundabout can be treated as a (small) ring road with each intersection approach serving as an on-/off-ramp (
28
). With this in mind, traffic flow on a roundabout should be able to be described by its own MFD that relates the average flow to average density along the ring. Furthermore, it should have its own trip-serving MFD that relates the maximum trip completion rate to density or accumulation of vehicles within the ring; see Daganzo (
29
). Treating the roundabout as a ring road with

where

which is the same as that of the TWL network.
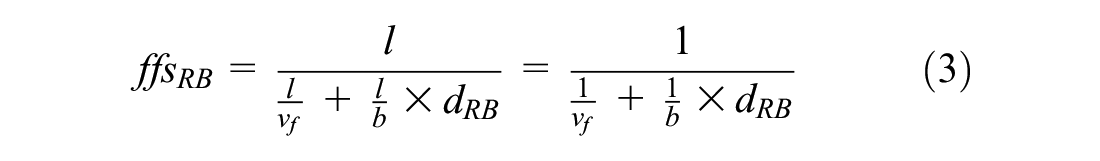
Equation (6) can be used to convert the flow capacities computed for each network type to maximum trip completion. Given knowledge of the average trip length in each network, we see the following:

and

While these values are approximations based on assumptions about network behavior, they generally reveal the following insights:
the flow-moving and trip-serving capacities of the TW network are much lower than those of the TWL and RB networks;
the flow-moving capacities of the TWL and RB networks are approximately equal; and,
the trip-serving capacity of the RB network is larger than that of the TWL network because of the more direct travel routing.
Fuel Consumption
The average fuel consumed per trip can be divided into two components: fuel consumed to overcome distance and fuel consumed during each deceleration/acceleration cycle. The former can be approximated by the product of average trip length and average fuel consumption per distance when moving at free-flow speed,
For the TW and TWL networks, the probability that a vehicle stops at an intersection should be proportional to the fraction of green time associated with each travel direction. For the TWL network, we previously assumed a two-phase signal with half the cycle allocated to each direction. Thus, a vehicle should stop at half of the intersections it travels through. Denoting the average fuel consumed by a vehicle for each stopping maneuver it completed as

For the TW network, a vehicle should stop even more times since vehicles would have a smaller probability of arriving at the intersection during the appropriate signal phase (through or left-turning). For ease of calculation and to provide a lower bound on fuel consumption, assume the same protected signal phasing and timings as was done in the previous section. Under these conditions, the average fuel consumption per trip should be as follows:

Finally, for the RB network, vehicles may never have to stop. However, they would need to at least slow down at each intersection while traversing the roundabout. In doing so, each vehicle would experience some deceleration/acceleration cycle, which would contribute to fuel consumption. Denote the fuel consumed for each deceleration/acceleration cycle as
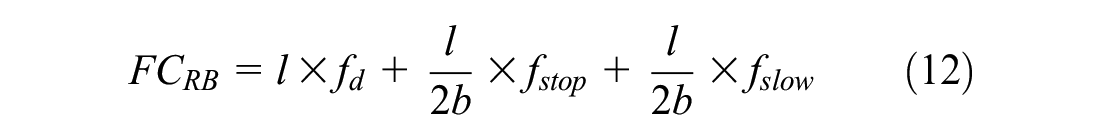
The results suggest that vehicles in TWL networks consume more fuel while overcoming distance than in TW networks, but less because of stopping maneuvers if trips are sufficiently long (i.e.,
Simulation Tests
The analytical examination provides an indication of how macroscopic network parameters might compare between networks controlled with signalized intersections versus roundabouts. Specifically, they reveal the following:
RB networks should have higher free-flow speeds than equivalent TW and TWL networks;
equivalent RB and TWL networks should have similar flow-moving capacities;
RB networks should have larger trip-serving capacities than equivalent TWL networks;
vehicles on TWL and TW networks should consume less fuel per trip than those on RB networks.
However, these analytical insights rely on many simplifying assumptions and do not consider many realistic factors, such as individual vehicle interactions, varying trip lengths, heterogeneous traffic congestion, and other factors. Therefore, microsimulation tests were also performed both to confirm the validity of these analytical insights and to potentially unveil other insights. This section describes the simulation tests that were performed, including the network parameters, traffic demands assumed, and metrics that were obtained.
Network Parameters
Idealized square grid networks were simulated in AIMSUN simulation software ( 32 ) to compare the performance of the different intersection types. While such ideal grids do not exist in practice, this serves as a useful starting point as many urban traffic networks follow a grid-like pattern. Thus, the insights obtained from ideal grids are likely to be generalizable. Previous work in this area has used such grids to obtain both analytical ( 18 , 20 ) and simulation insights ( 21 , 33 ).
Two unique grid sizes were considered as a part of this work: smaller grids (10 × 10) and larger grids (16 × 16). All intersections were either controlled using a signalized intersection that allowed left turns to be served in a permitted fashion (TW) or at which left turns were prohibited (TWL), or with roundabouts (RB). For the signalized intersection, a common 120-s cycle was assumed with no offset between adjacent intersections. The latter assumption was shown to not significantly influence operations on grid networks ( 34 ). A two-phase intersection was used in both cases with the green time evenly split between the two directions (54 s per direction), 3 s yellow time and 3 s all red time. When roundabouts were used, vehicles had to yield at the entrance until sufficient space existed to enter.
Each link was assumed to have either one or two travel lanes in each direction (i.e., two-lane and four-lane networks) with a common speed limit of 40 km/h. Roundabouts with a single lane were used in the two-lane networks, while roundabouts with two travel lanes were used in the four-lane networks. In both cases, the diameter of the roundabout was set to 40 m. The six types of intersections used in this study are shown in Figure 1.
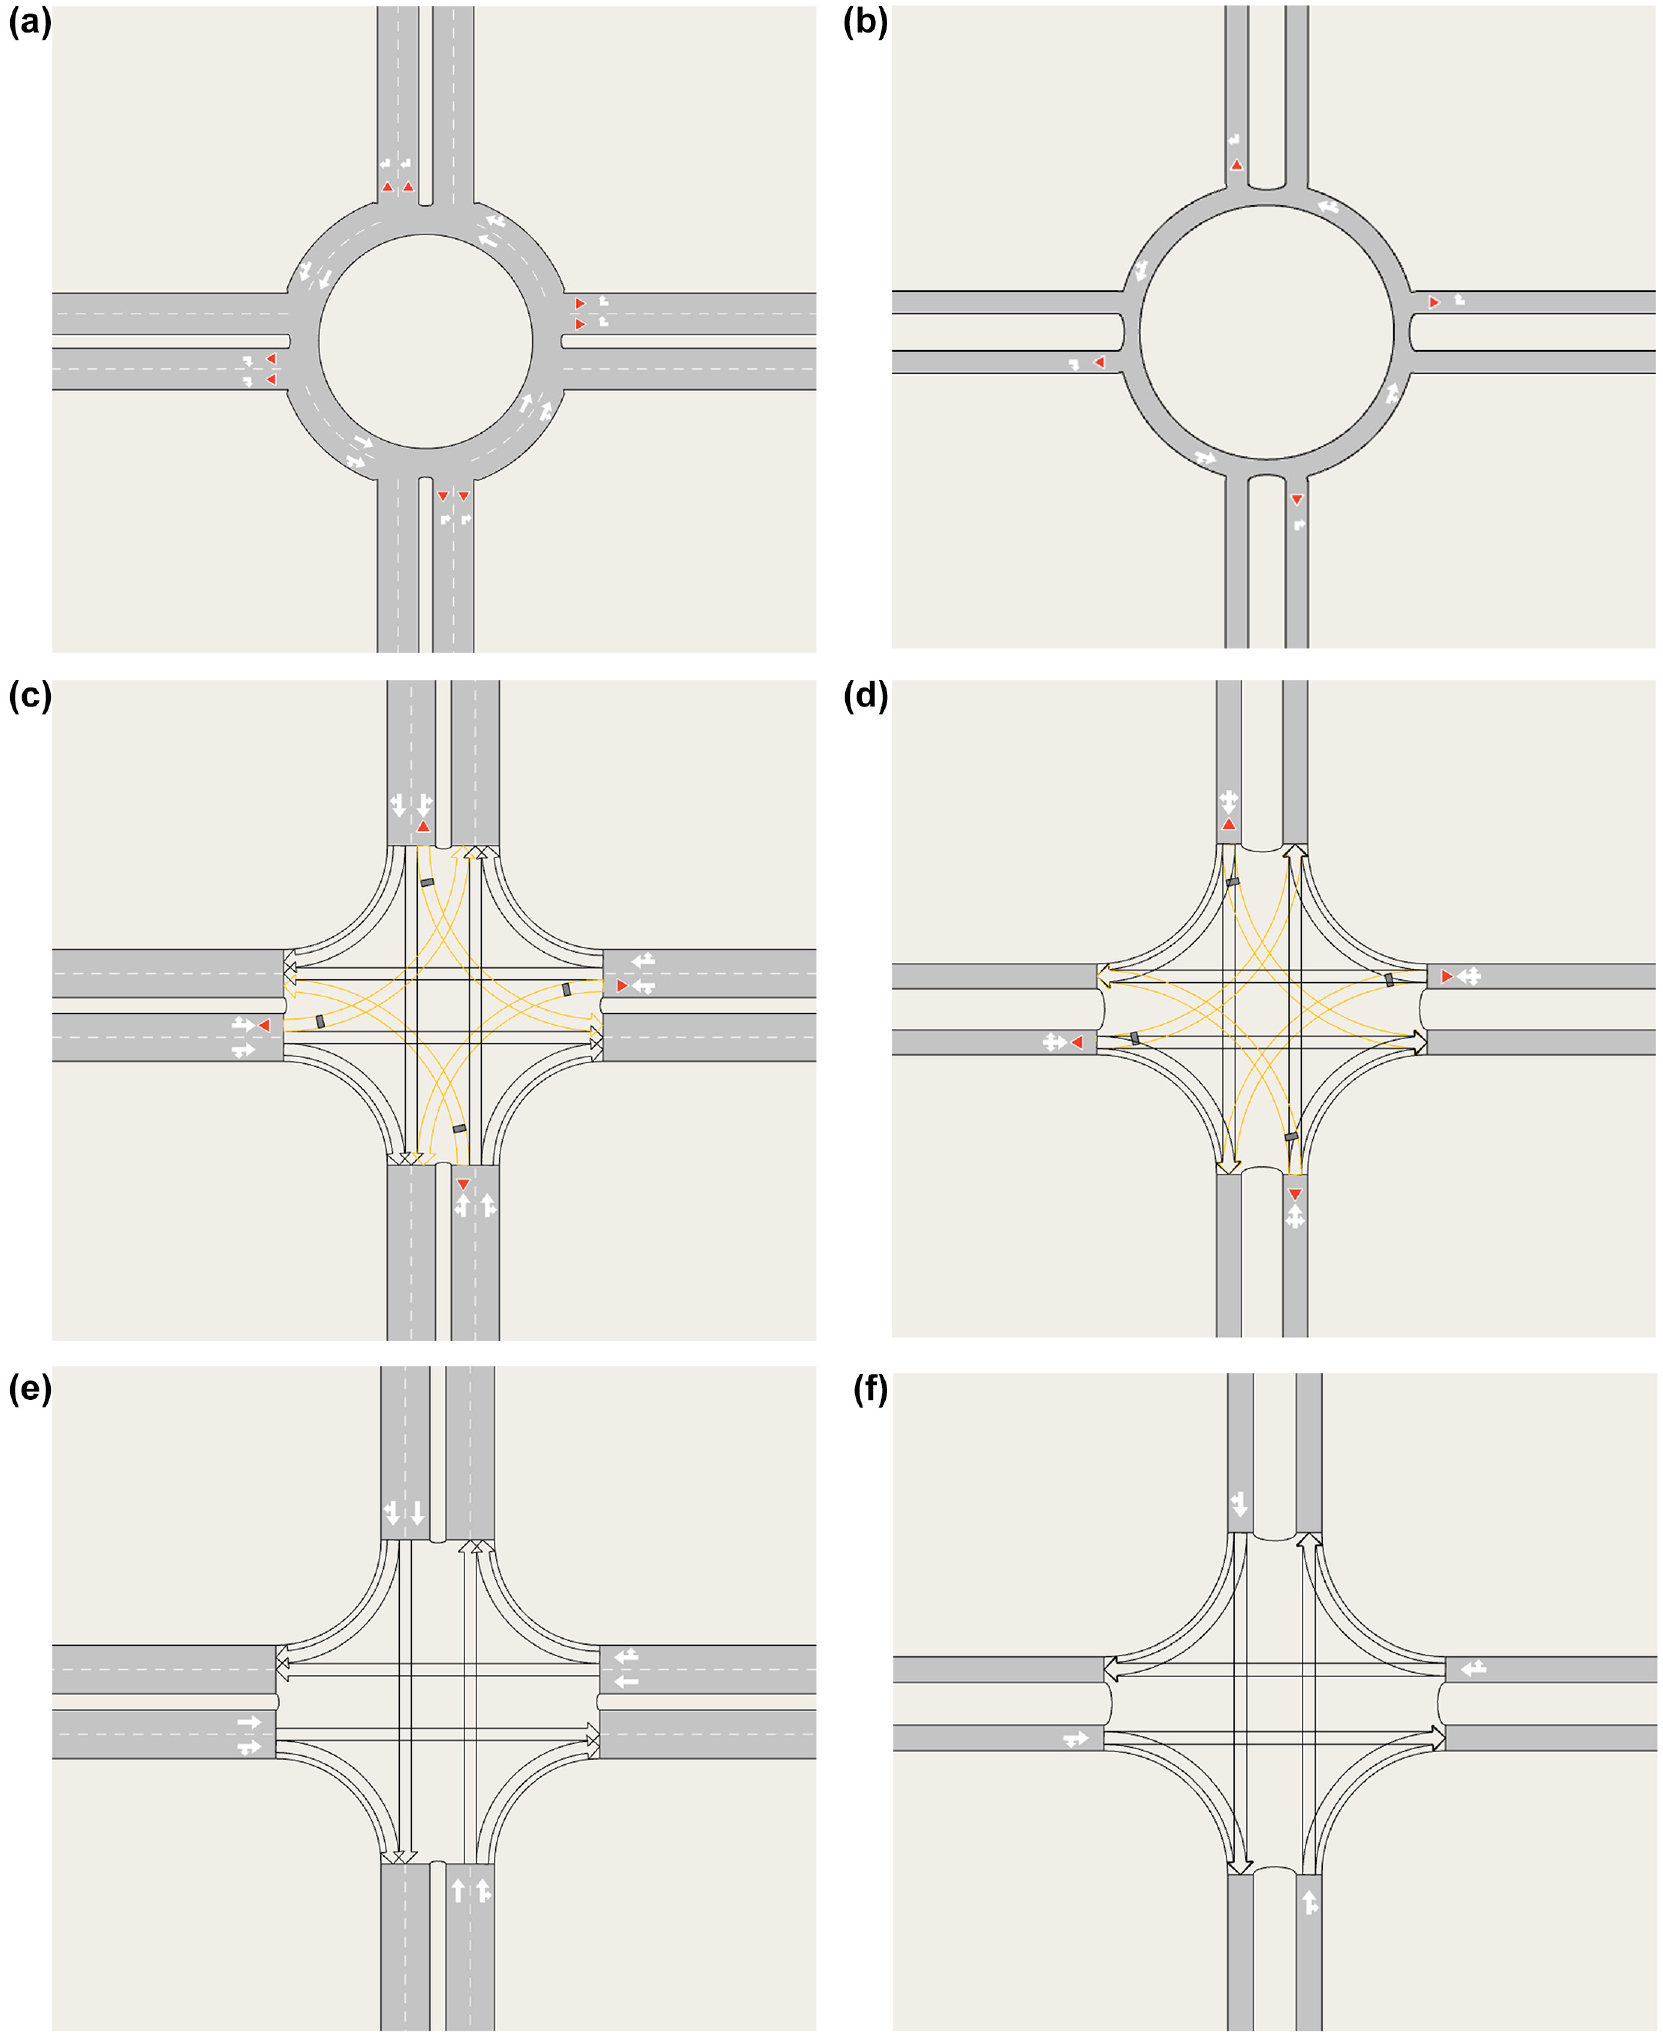
Types of intersections: (a) two-lane roundabout, (b) one-lane roundabout, (c) four-lane signalized intersection allowing left turns in a permitted manner (TW), (d) two-lane TW, (e) four-lane signalized intersection prohibiting left turns (TWL), and (f) two-lane TWL.
Three unique link lengths were also considered in the simulations: 125, 250, and 500 m. These values were selected in relation to the critical block length identified by Laval and Castrillón ( 35 ) to provide results for a range of block lengths, representing short blocks, block lengths near the critical value, and long blocks. Modifying link lengths in this way is also equivalent to modifying cycle lengths, green times, and free-flow speeds, as shown by Laval and Castrillón ( 35 ) and Gayah et al. ( 36 ). Note that these link lengths do not include the “intersection area,” which was equal to the space required to serve the roundabout. Thus, intersection spacing (from the center of one intersection to the center of the adjacent intersection in all networks) was equal to 165, 290, and 540 m for the three link lengths, respectively, which included enough space for the intersection area to roundabouts. Also note that the results are fairly consistent across the three block lengths and thus only the results for the first two lengths are provided in the paper.
Demand Pattern
Origins and destinations were placed at the midblock of each link. A uniform demand pattern was assumed in which each origin generated vehicles at the same rate, and each destination was equally likely for a vehicle to select when generated (except for its origin). While not entirely realistic, such a demand pattern might mimic an urban core with a mix of land uses throughout. It should also provide more uniform congestion in the network, facilitating an upper bound of operational performance for each traffic state observed. The rate of vehicle generation was increased slowly over the course of the simulation period of 3 h to slowly congest the network to observe a range of traffic conditions: uncongested, capacity, congestion, and gridlock.
Vehicles were assumed to route themselves between origins and destinations to minimize their expected travel time. The c-logit routing model in AIMSUN was selected to mimic such a user equilibrium routing condition. In addition, half of the vehicles were assumed to have access to real-time traffic information and be able to update their routes at regular 2-min intervals. Previous work has shown that this helps mitigate localized congestion disturbances and provides a more uniform congestion pattern in the network ( 37 – 39 ).
Metrics
Each combination of network size (10 × 10 or 16 × 16), link length (125 or 250 m), and number of lanes (two or four lanes) was simulated for six random simulation iterations to observe a range of possible outcomes. During each simulation run, data were computed at 5-min aggregation. These data included the following:
average network flow;
average network density;
trip completion rate;
average accumulation;
average fuel consumption.
Average network flow and density were computed as per the generalized definitions of Edie ( 40 ). Trip completion rate was measured as the total number of trips completed during that 5-min interval, scaled to an hourly rate. Average accumulation was estimated as the product of average density and total network length (in lane-km). The latter was obtained directly from the simulation and accounted for both link lengths and intersection areas (including the roundabout travel distance). Total fuel consumption was obtained directly from the AIMSUN simulation software, which uses the Akcelik formula to compute total fuel consumed by each exiting vehicle ( 41 ). All input parameters were set to a “Ford Fiesta”-type vehicle and were provided directly in AIMSUN. This metric was obtained for all vehicles exiting during a given 5-min aggregation interval. The average fuel consumption was then computed by dividing the total fuel consumption for exiting vehicles during a given interval by the total number of vehicles that completed their trip during that interval.
The observed relationship between the average network flow and density was used to estimate the network’s MFD, while the observed relationship between the trip completion rate and average accumulation was used to estimate the network’s NEF.
Simulation Results
This section provides the simulation results for the case of networks with two lanes and four lanes, respectively.
Two-Lane Networks
Figure 2 provides the simulated MFDs for the three different intersection strategies considered. The MFDs all have the expected unimodal shape with free-flow conditions for densities less than about 40 veh/lane-km, capacity between densities of 40 and 70 veh/lane-km, and congestion for densities greater than 70 veh/lane-km. The MFDs are generally well defined in the free-flow branch, but exhibit scatter in the congested regime wherein a range of average flows may be observed at the same density for a given treatment. This scatter is expected because of theoretical and simulation work that attributes the phenomenon to inhomogeneous congestion patterns in congested networks.
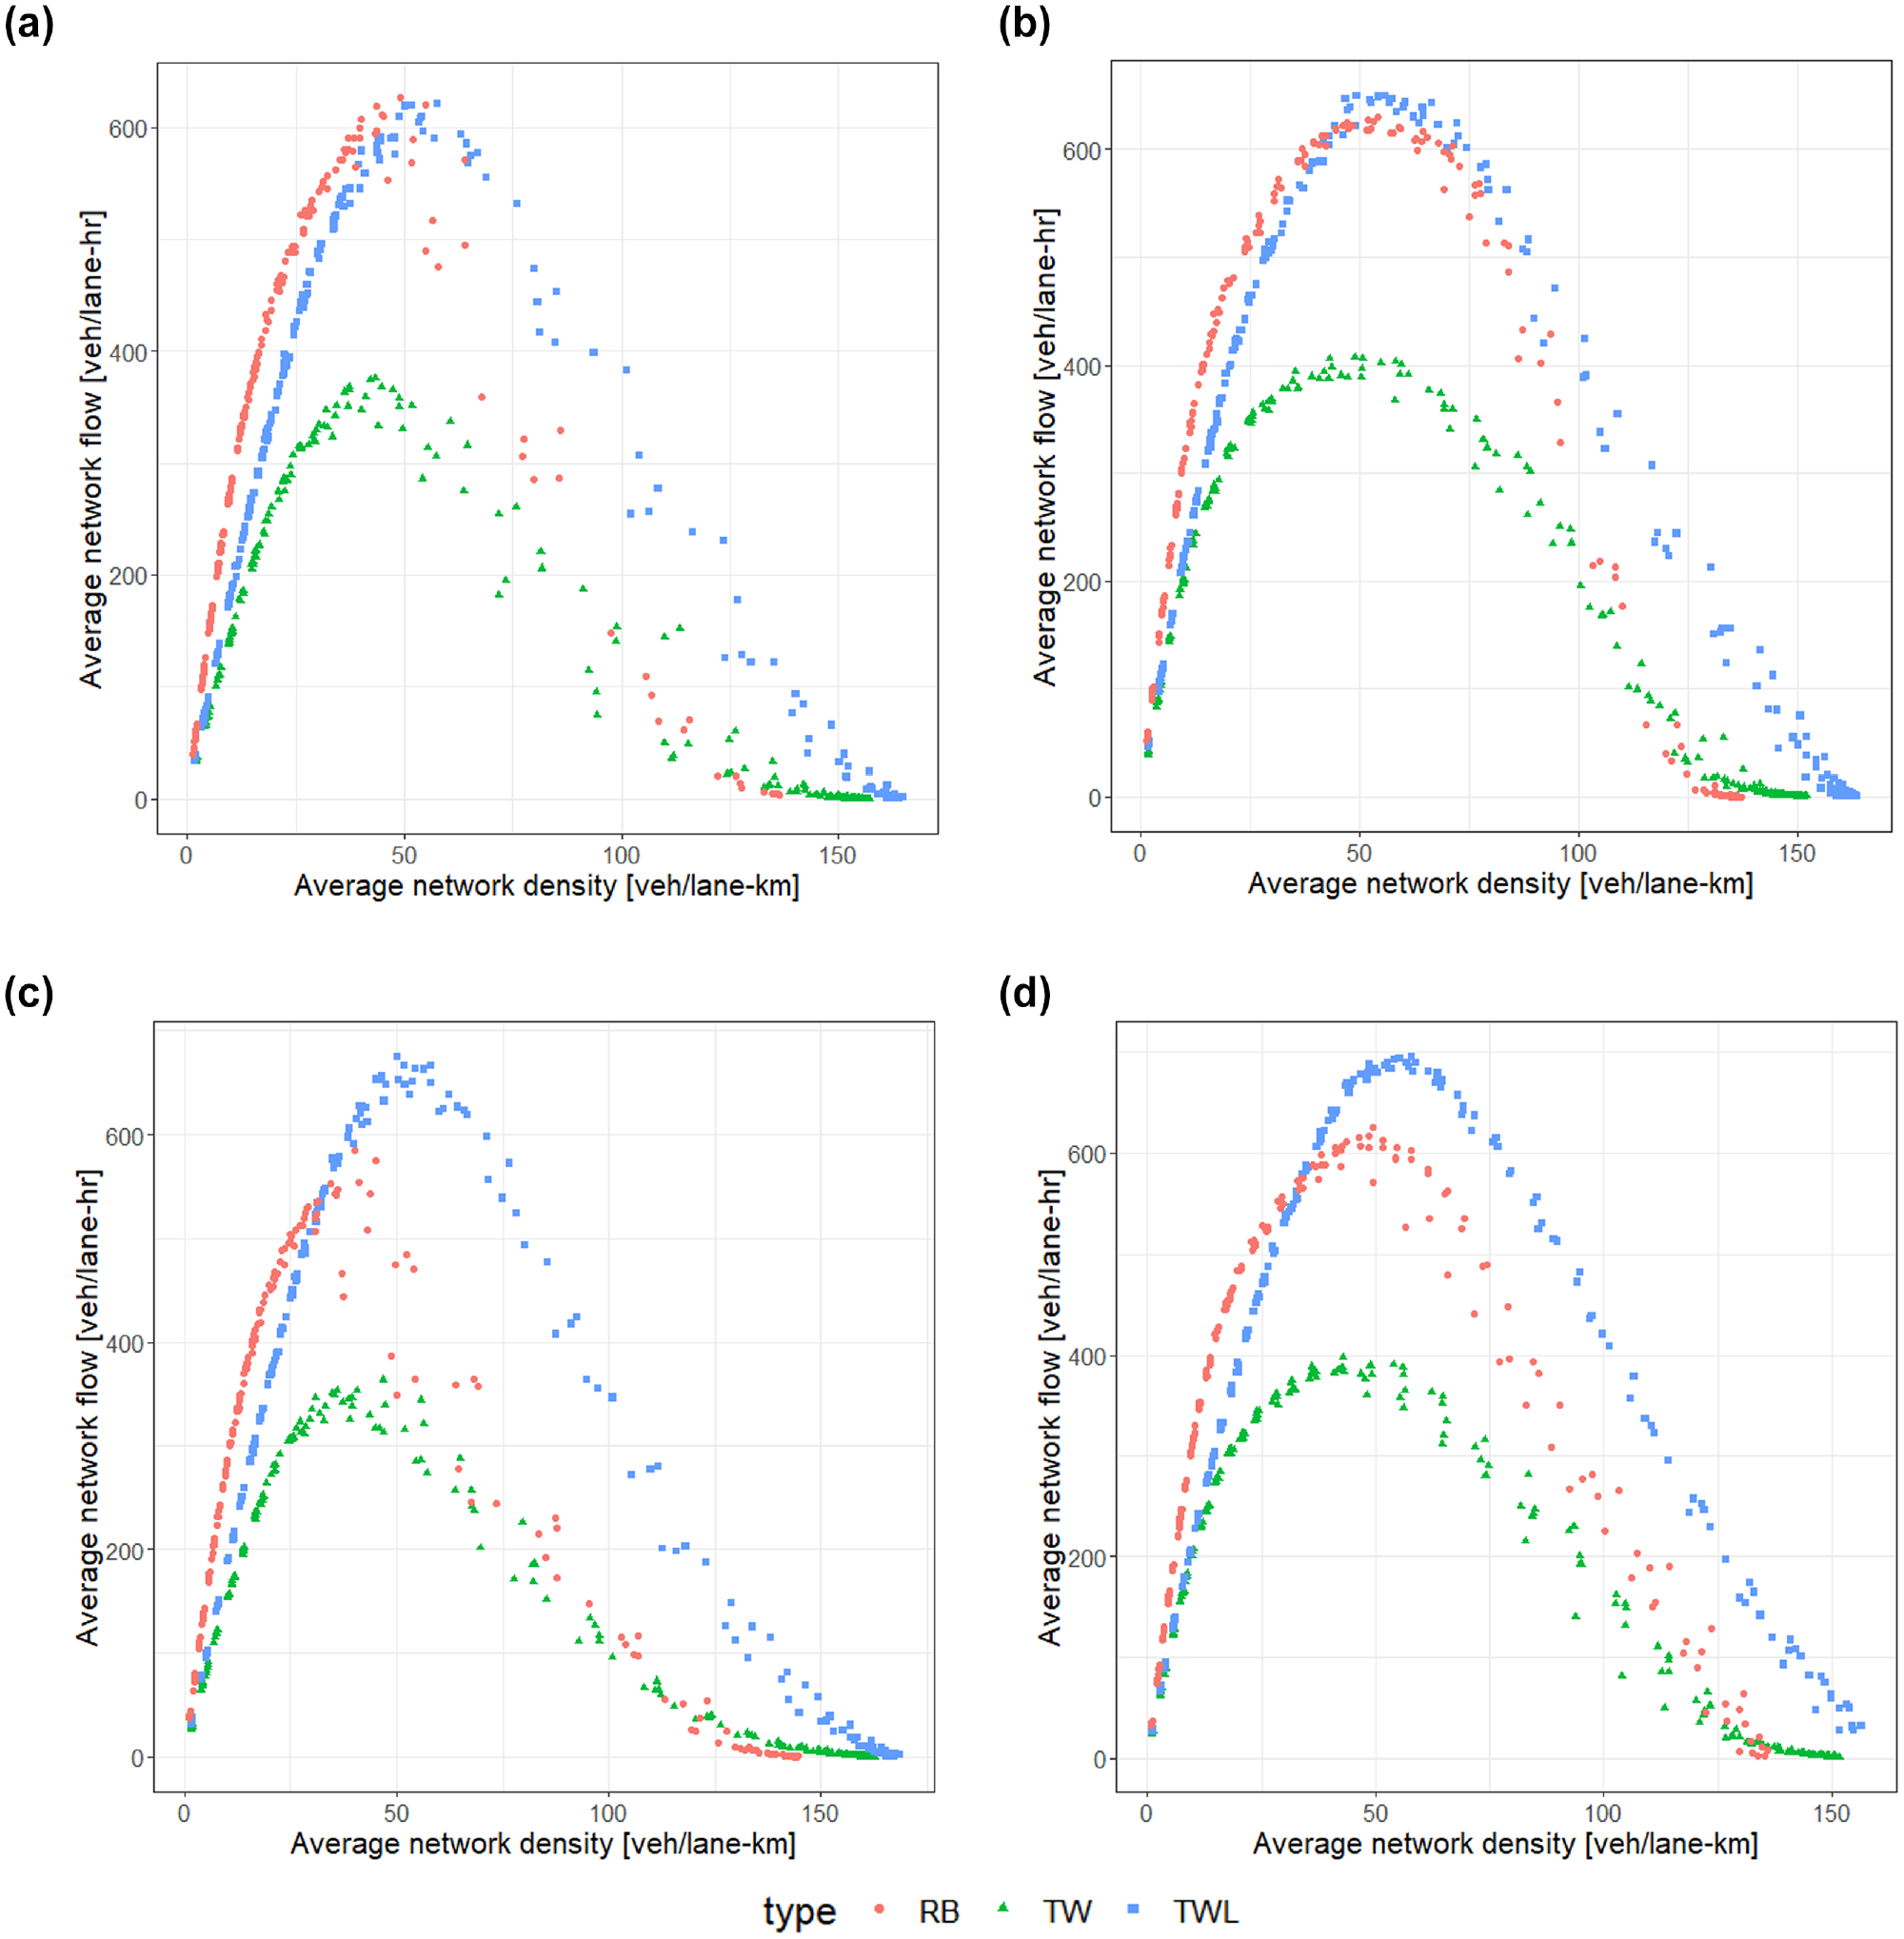
Simulated macroscopic fundamental diagrams (MFDs) for two-lane networks: (a) two lanes, 10 × 10, 125 m blocks, (b) two lanes, 10 × 10, 250 m blocks, (c) two lanes, 16 × 16, 125 m blocks, and (d) two lanes, 16 × 16, 250 m blocks.
The results confirm the general expectations from the analytical investigation. Average speeds in the free-flow regime (denoted by the slope of the increasing branch of the MFDs) are generally higher for the RB networks than the TWL and TW networks, regardless of the network size or block length. Also as expected, the free-flow speed in the TWL network is generally higher than that in the TW network. Further, the TW network has the lowest flow capacities by far, whereas the flow capacities of the RB and TWL networks are much closer in magnitude.
Interestingly, the MFDs of the RB networks exhibit more scatter/variability than those of the TW and TWL networks. This can be attributed to how the roundabouts operate; if a roundabout gets congested, its efficiency may reduce dramatically and thus reduce network capacity. The capacity of the RB network exhibits more variability when block lengths are shorter (125 m) than when they are longer (250 m). This is reasonable, as longer blocks facilitate longer queues. Queue spillbacks from one roundabout to another can block the upstream roundabout entirely. This will completely halt vehicles moving through the intersection (in any direction). Contrast this to networks with signalized intersections: queue spillbacks would only block vehicles from one direction of travel, but may still allow vehicles in the opposing direction to move. This might explain that while it was expected that the RB and TWL networks would have the same flow capacity, the simulated networks reveal that the flow capacity of the RB networks is often near to but smaller than that of the TWL networks.
Figure 3 provides the associated NEFs for the different intersection treatments. As expected from the analytical investigation, the RB and TWL networks provide similar trip completion rates. The TW networks, by contrast, offer trip completion rates that are approximately half of what can be obtained with the RB or TWL intersection control strategies. However, the RB network offers superior trip completion rates compared to the TWL network because of the more direct routing it offers, even when the average maximum flows are lower. The additional trip-serving capacity offered by RB networks diminishes as the networks become larger. This is also as expected, as the impact of the left-turn restrictions does not grow with trip length: it remains at most one block per trip on average. The relative impact across a trip is much smaller in larger networks than in smaller networks. For example, a 10-block trip is around 10% longer with TWL control, whereas a 20-block trip in a TWL network is only 5% longer than would occur without direct routing. On the largest network (16 × 16 with 250 m blocks), the advantage of the RB network over the TWL network decreases and both have similar trip completion rates.
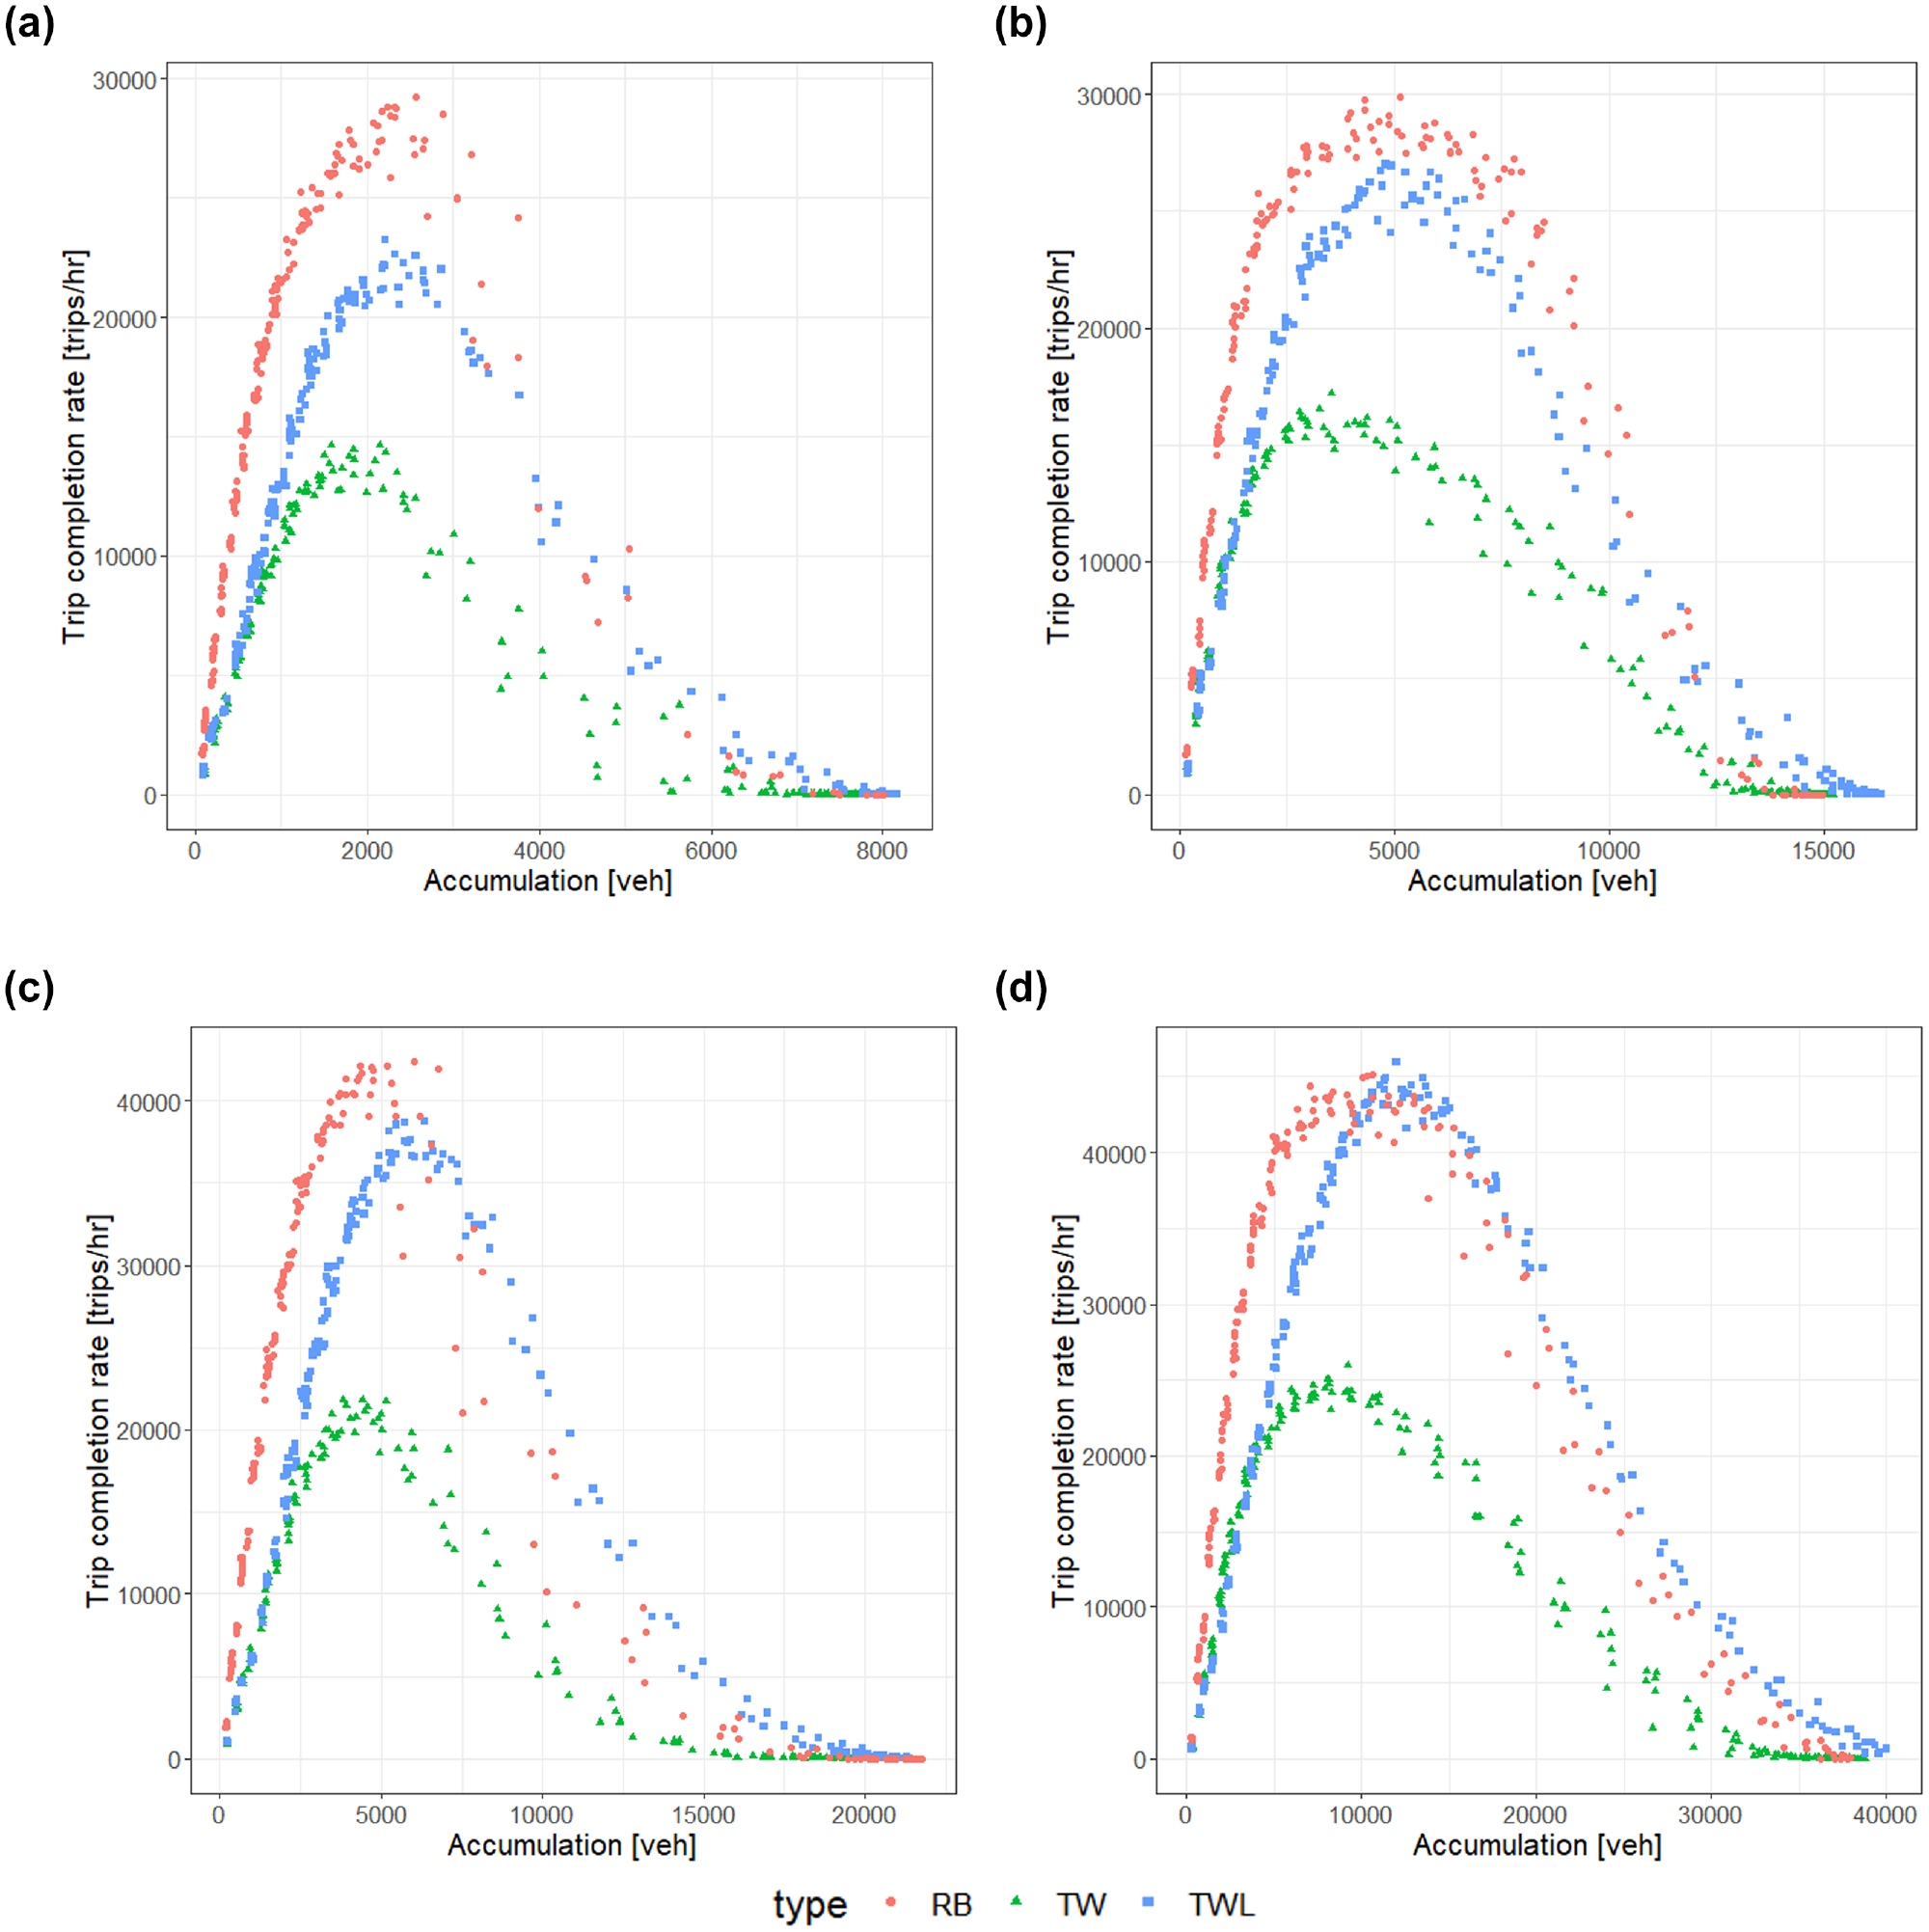
Simulated network exit functions (NEFs) for two-lane networks: (a) two lanes, 10 × 10, 125 m blocks, (b) two lanes, 10 × 10, 250 m blocks, (c) two lanes, 16 × 16, 125 m blocks, and (d) two lanes, 16 × 16, 250 m blocks.
Finally, Figure 4 provides the relationship between the average fuel required per completed trip and trip completion rate. Note that these values are only provided for the free-flow and near-capacity branches of the MFD since fuel consumption behavior is much more unstable and scattered in the congested regime. For a given trip completion rate, higher points indicate that vehicles must expend more fuel to reach their destinations. As expected from the analytical investigation, while the RB networks generally offer higher trip completion rates than the TWL and TW networks, they also require vehicles to expend much more fuel. The primary reason for this is that vehicles in RB networks must perform deceleration/acceleration cycles (either coming to a full stop or slowing down) at every intersection, whereas vehicles in signalized intersections are able to move through some intersections without stopping or slowing down. The difference is greater in larger networks than smaller networks, likely because of the additional travel distance (and thus the number of intersections vehicles must traverse) in larger networks.
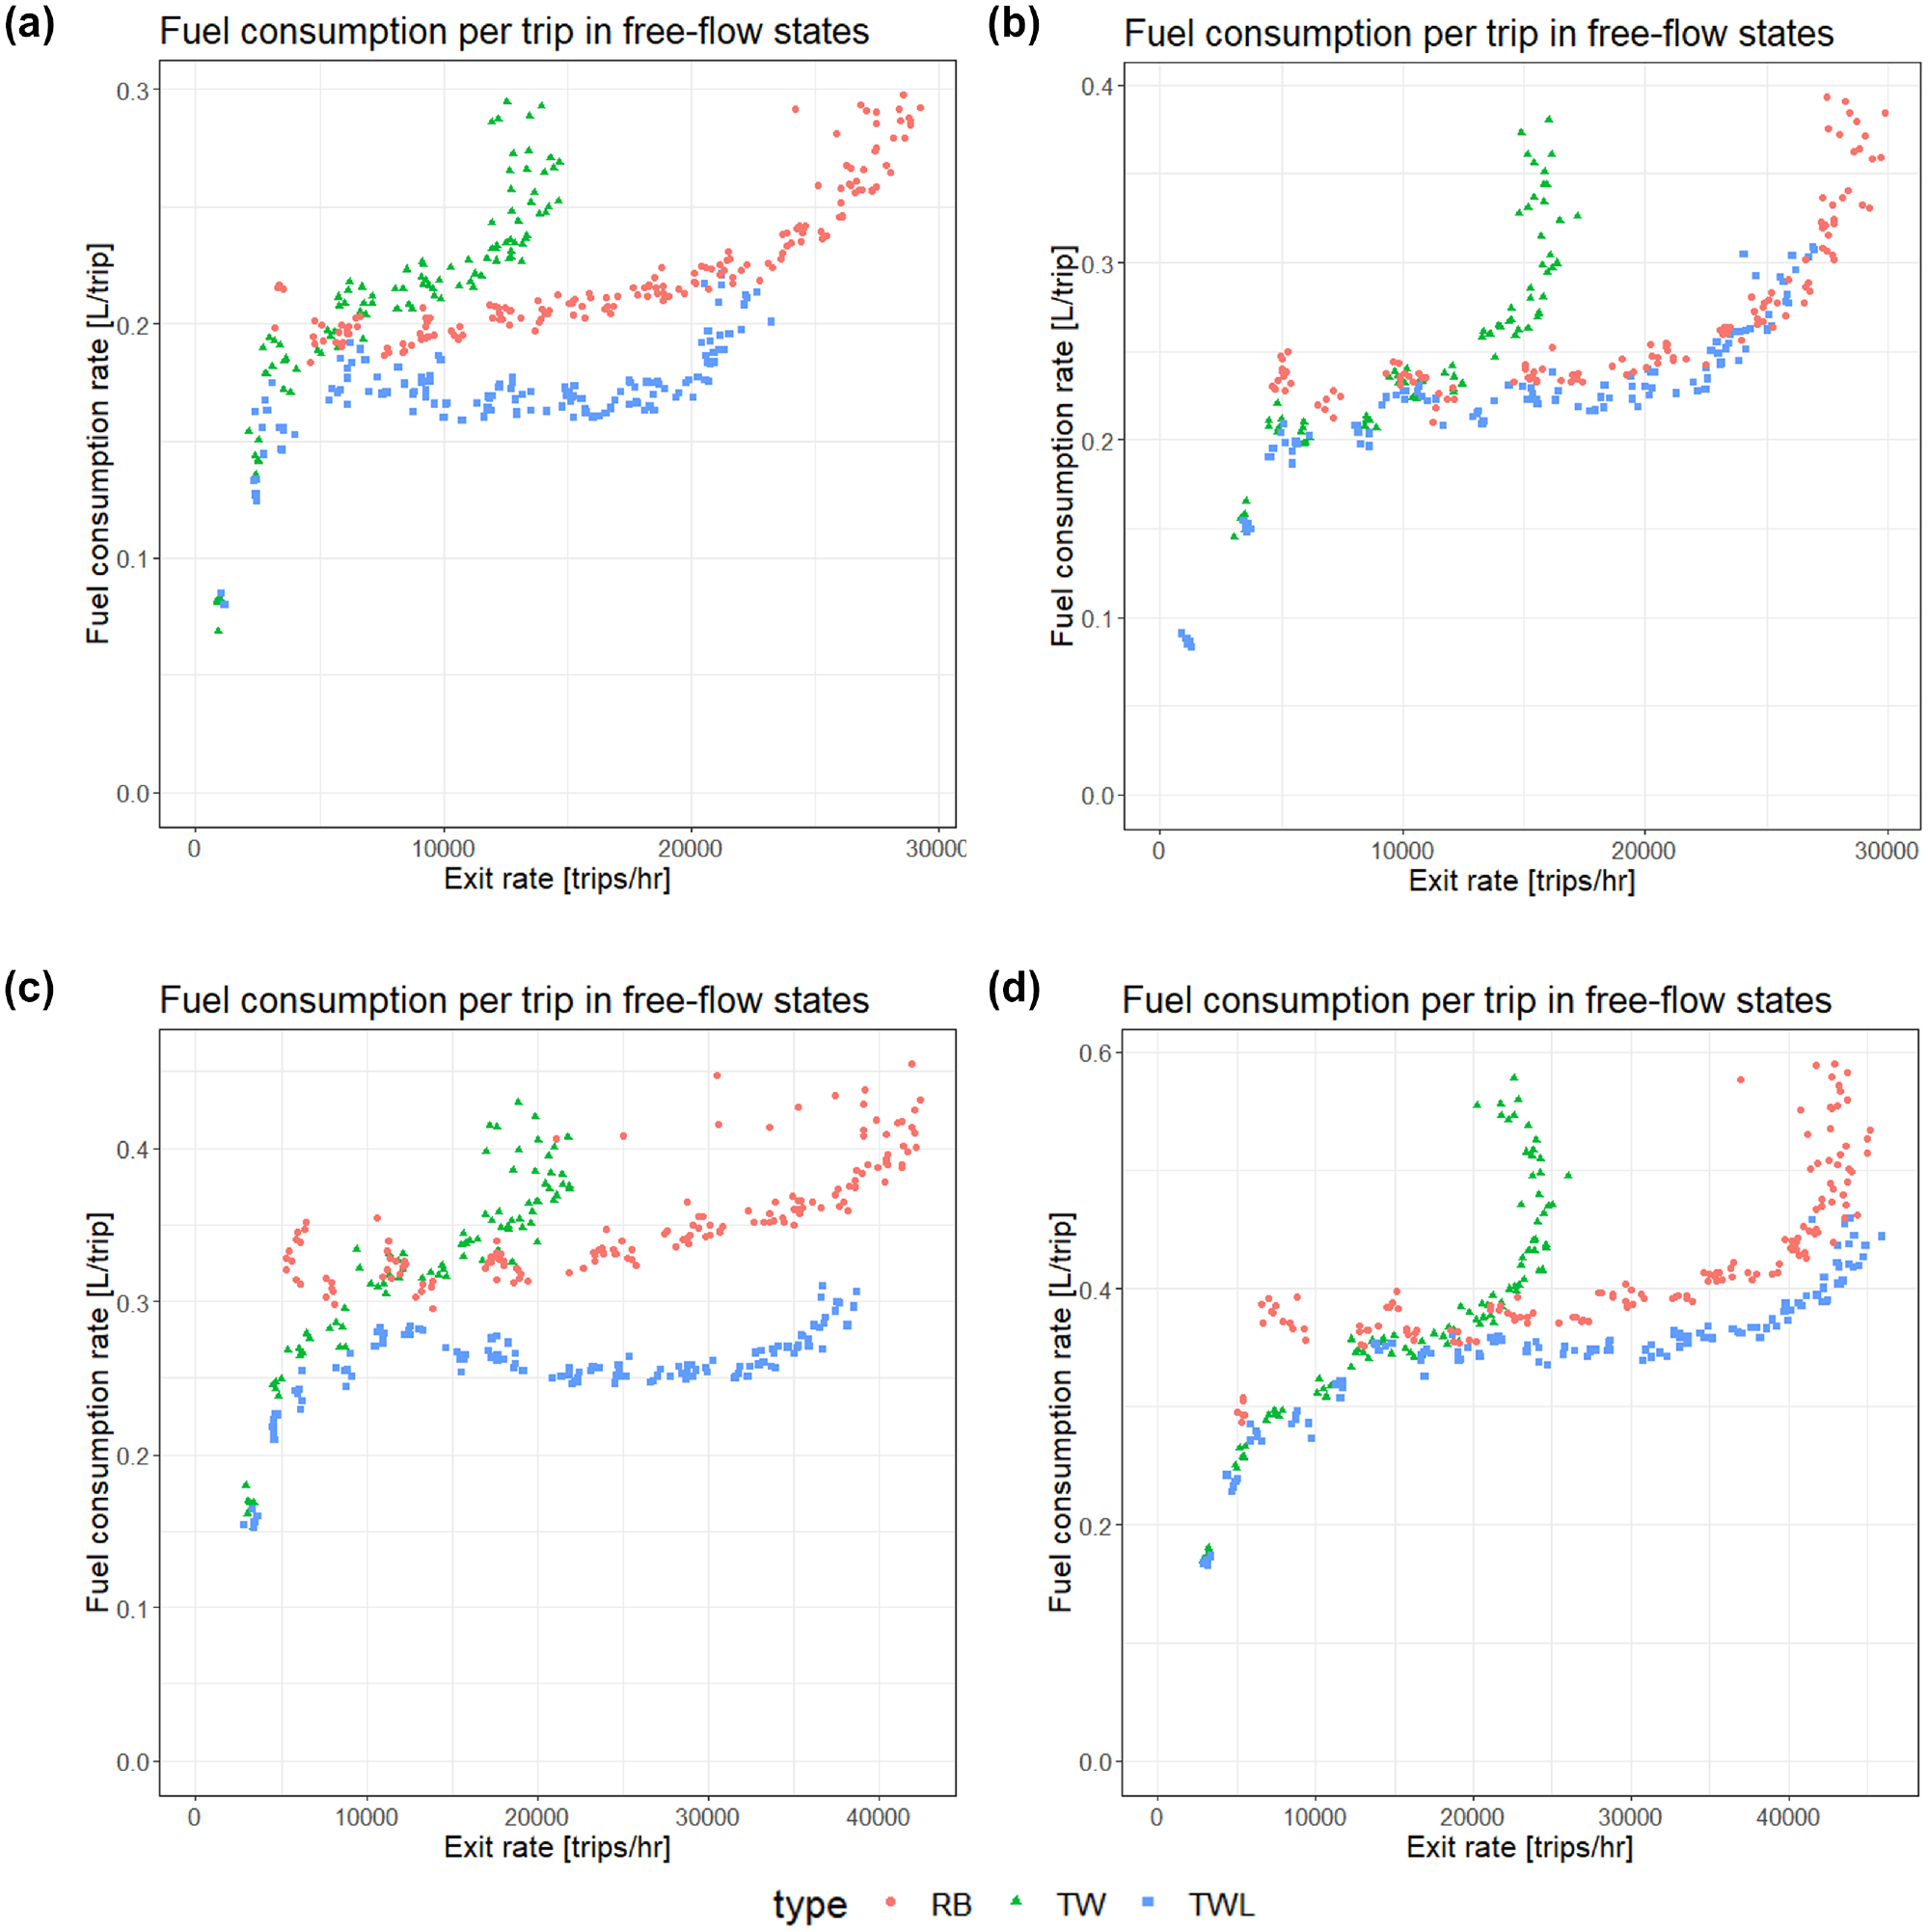
Estimated fuel consumption per trip for two-lane networks: (a) two lanes, 10 × 10, 125 m blocks, (b) two lanes, 10 × 10, 250 m blocks, (c) two lanes, 16 × 16, 125 m blocks, and (d) two lanes, 16 × 16, 250 m blocks.
Four-Lane Networks
The MFDs, NEFs, and fuel consumption plots for four-lane networks are provided in Figures 5–7. Similar to the two-lane networks, RB networks produce relatively high flows at uncongested levels (Figure 5). At low densities, vehicles entering roundabouts likely do not need to yield to other vehicles in the network. In signalized networks, vehicles still may have to stop at low densities when no opposing traffic flows are present because of fixed signal timings. TWL flows improve compared to the RB networks as average trip length increases because of block length and network size, as well. RB network capacities are generally the same for all network sizes tested and about equal to 400 vehicles per hour per lane (vphpl). It is necessary to emphasize that the MFDs show the average flows over all lanes in the network rather than the average flow on the roundabout lanes. Indeed, the capacity of the roundabouts is approximately 1000 vphpl, which is much higher than the average network flow and close to the value given by Rodegerdts et al. ( 3 ). Note that this is much lower than those observed in the two-lane networks (approximately 600 vphpl). This suggests that the two-lane roundabouts required in the four-lane networks perform at lower operational efficiency per lane. While the second roundabout lane increases the total capacity to 800 vehicles per hour (vph) when combining the two lanes, the second lane of the roundabout adds decreasing marginal value to the network when considering the single-lane roundabouts, which experienced a capacity of 600 vph. This less-than-proportional increase in capacity is likely because the merge/diverge points at two-lane roundabouts become more complex than those at one-lane roundabouts. Vehicles needing to use the inner lane of the roundabout must wait for a gap in both the inner and outer lanes before being able to enter the roundabout. This leads to more queuing at the intersection approach, as well as the inner lane being utilized less efficiently than the outer lane of the roundabout. This latter fact was confirmed via the simulations. Because of this, in four-lane networks, the performance of the RB networks is similar to that of the least efficient TW networks. By contrast, the flow capacities of the TWL networks do not suffer from these diminishing marginal returns since all lanes are available for vehicle movement at the signalized intersections.
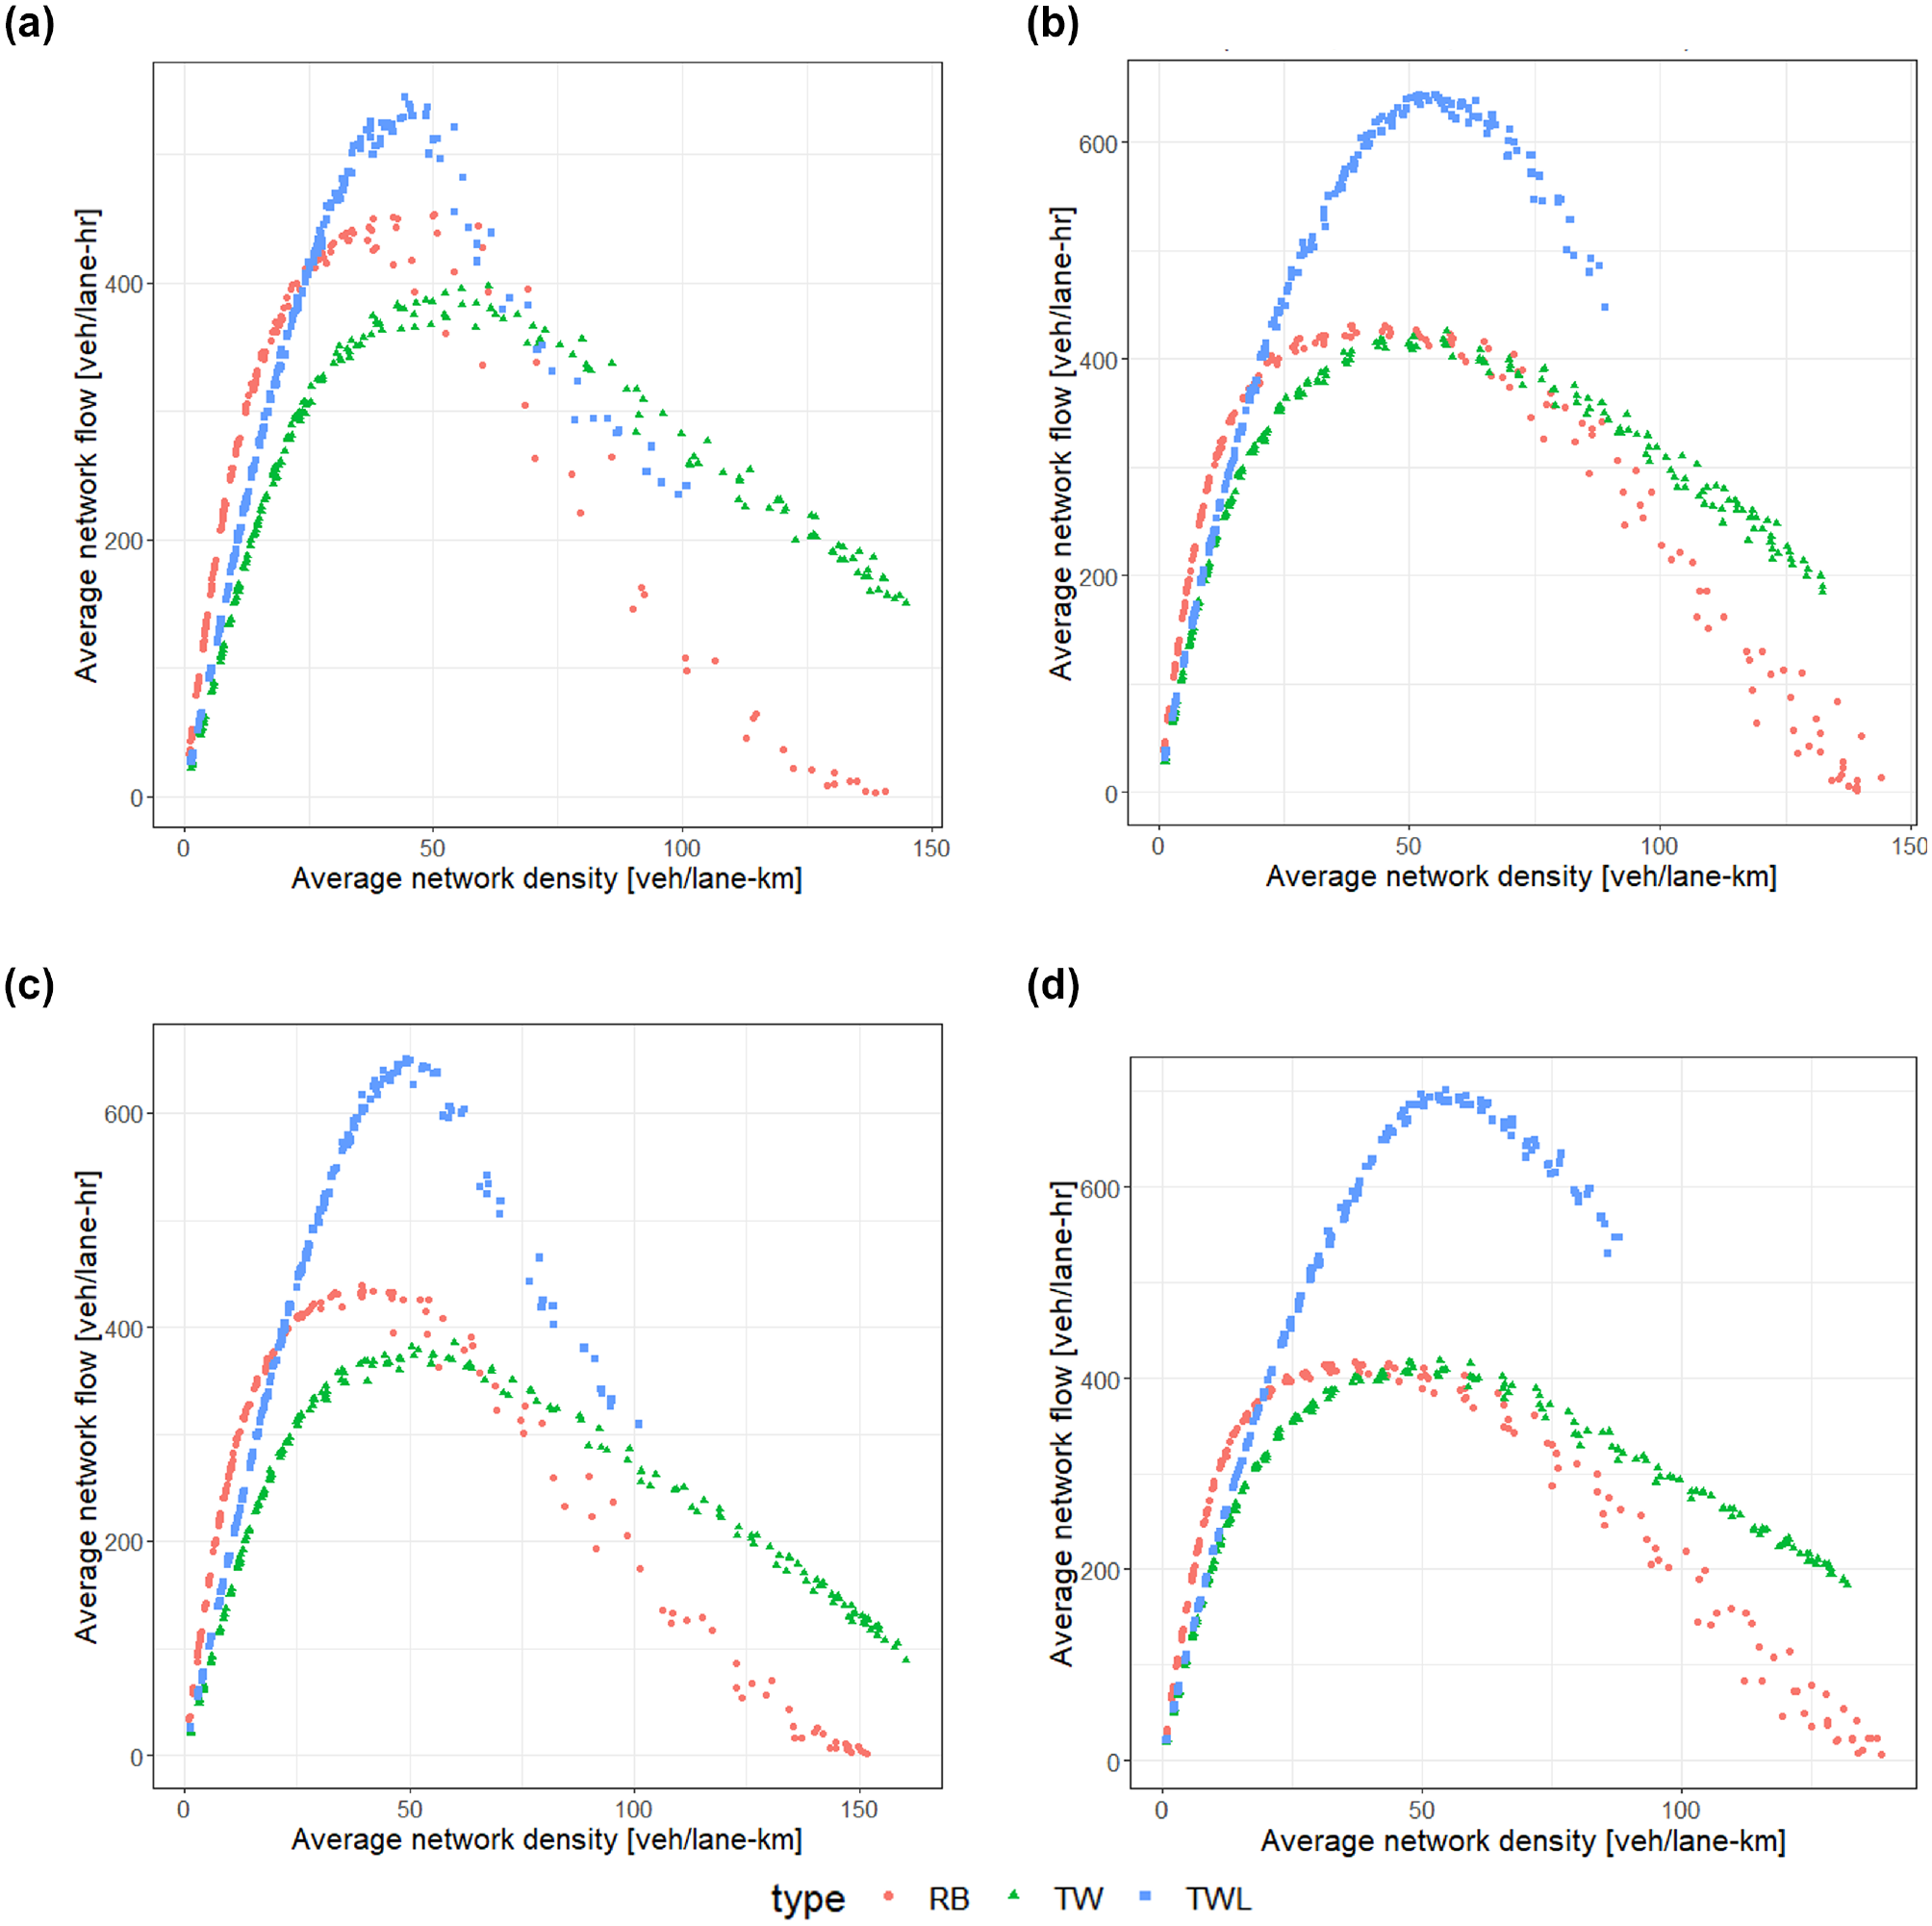
Simulated macroscopic fundamental diagrams (MFDs) for four-lane networks: (a) four lanes, 10 × 10, 125 m blocks, (b) four lanes, 10 × 10, 250 m blocks, (c) four lanes, 16 × 16, 125 m blocks, and (d) four lanes, 16 × 16, 250 m blocks.
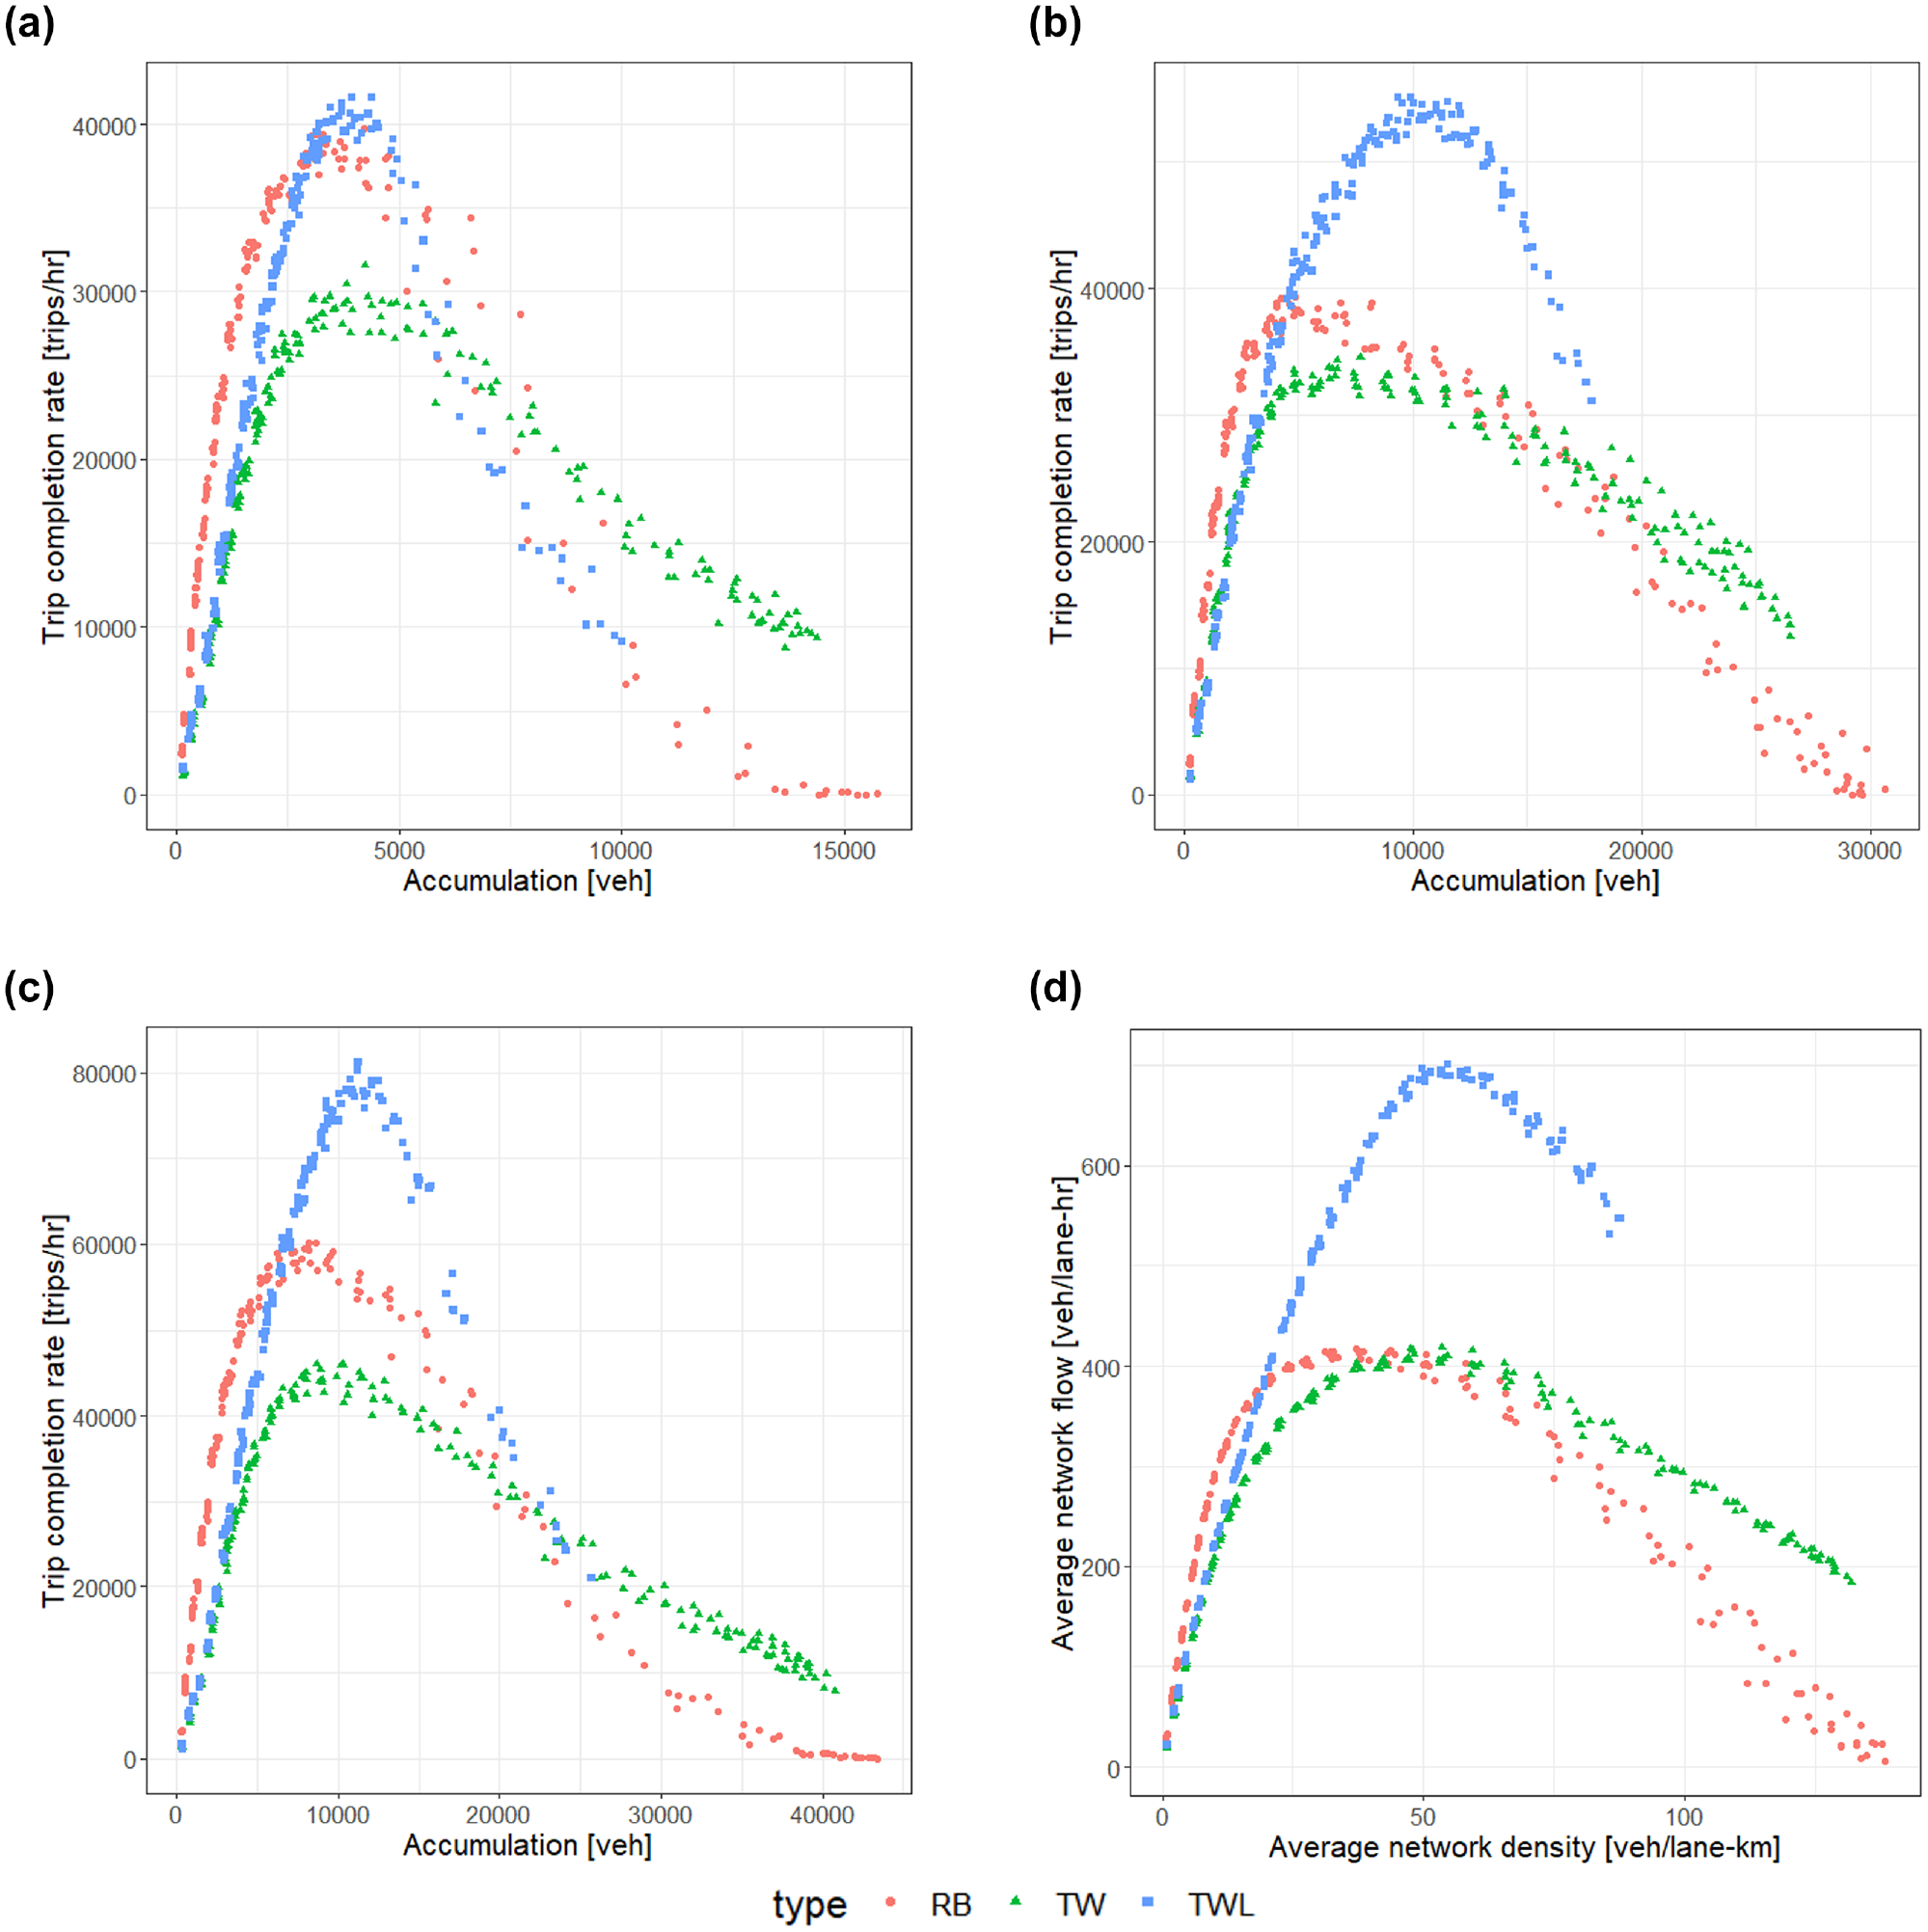
Simulated network exit functions (NEFs) for four-lane networks: (a) four lanes, 10 × 10, 125 m blocks, (b) four lanes, 10 × 10, 250 m blocks, (c) four lanes, 16 × 16, 125 m blocks, and (d) four lanes, 16 × 16, 250 m blocks.
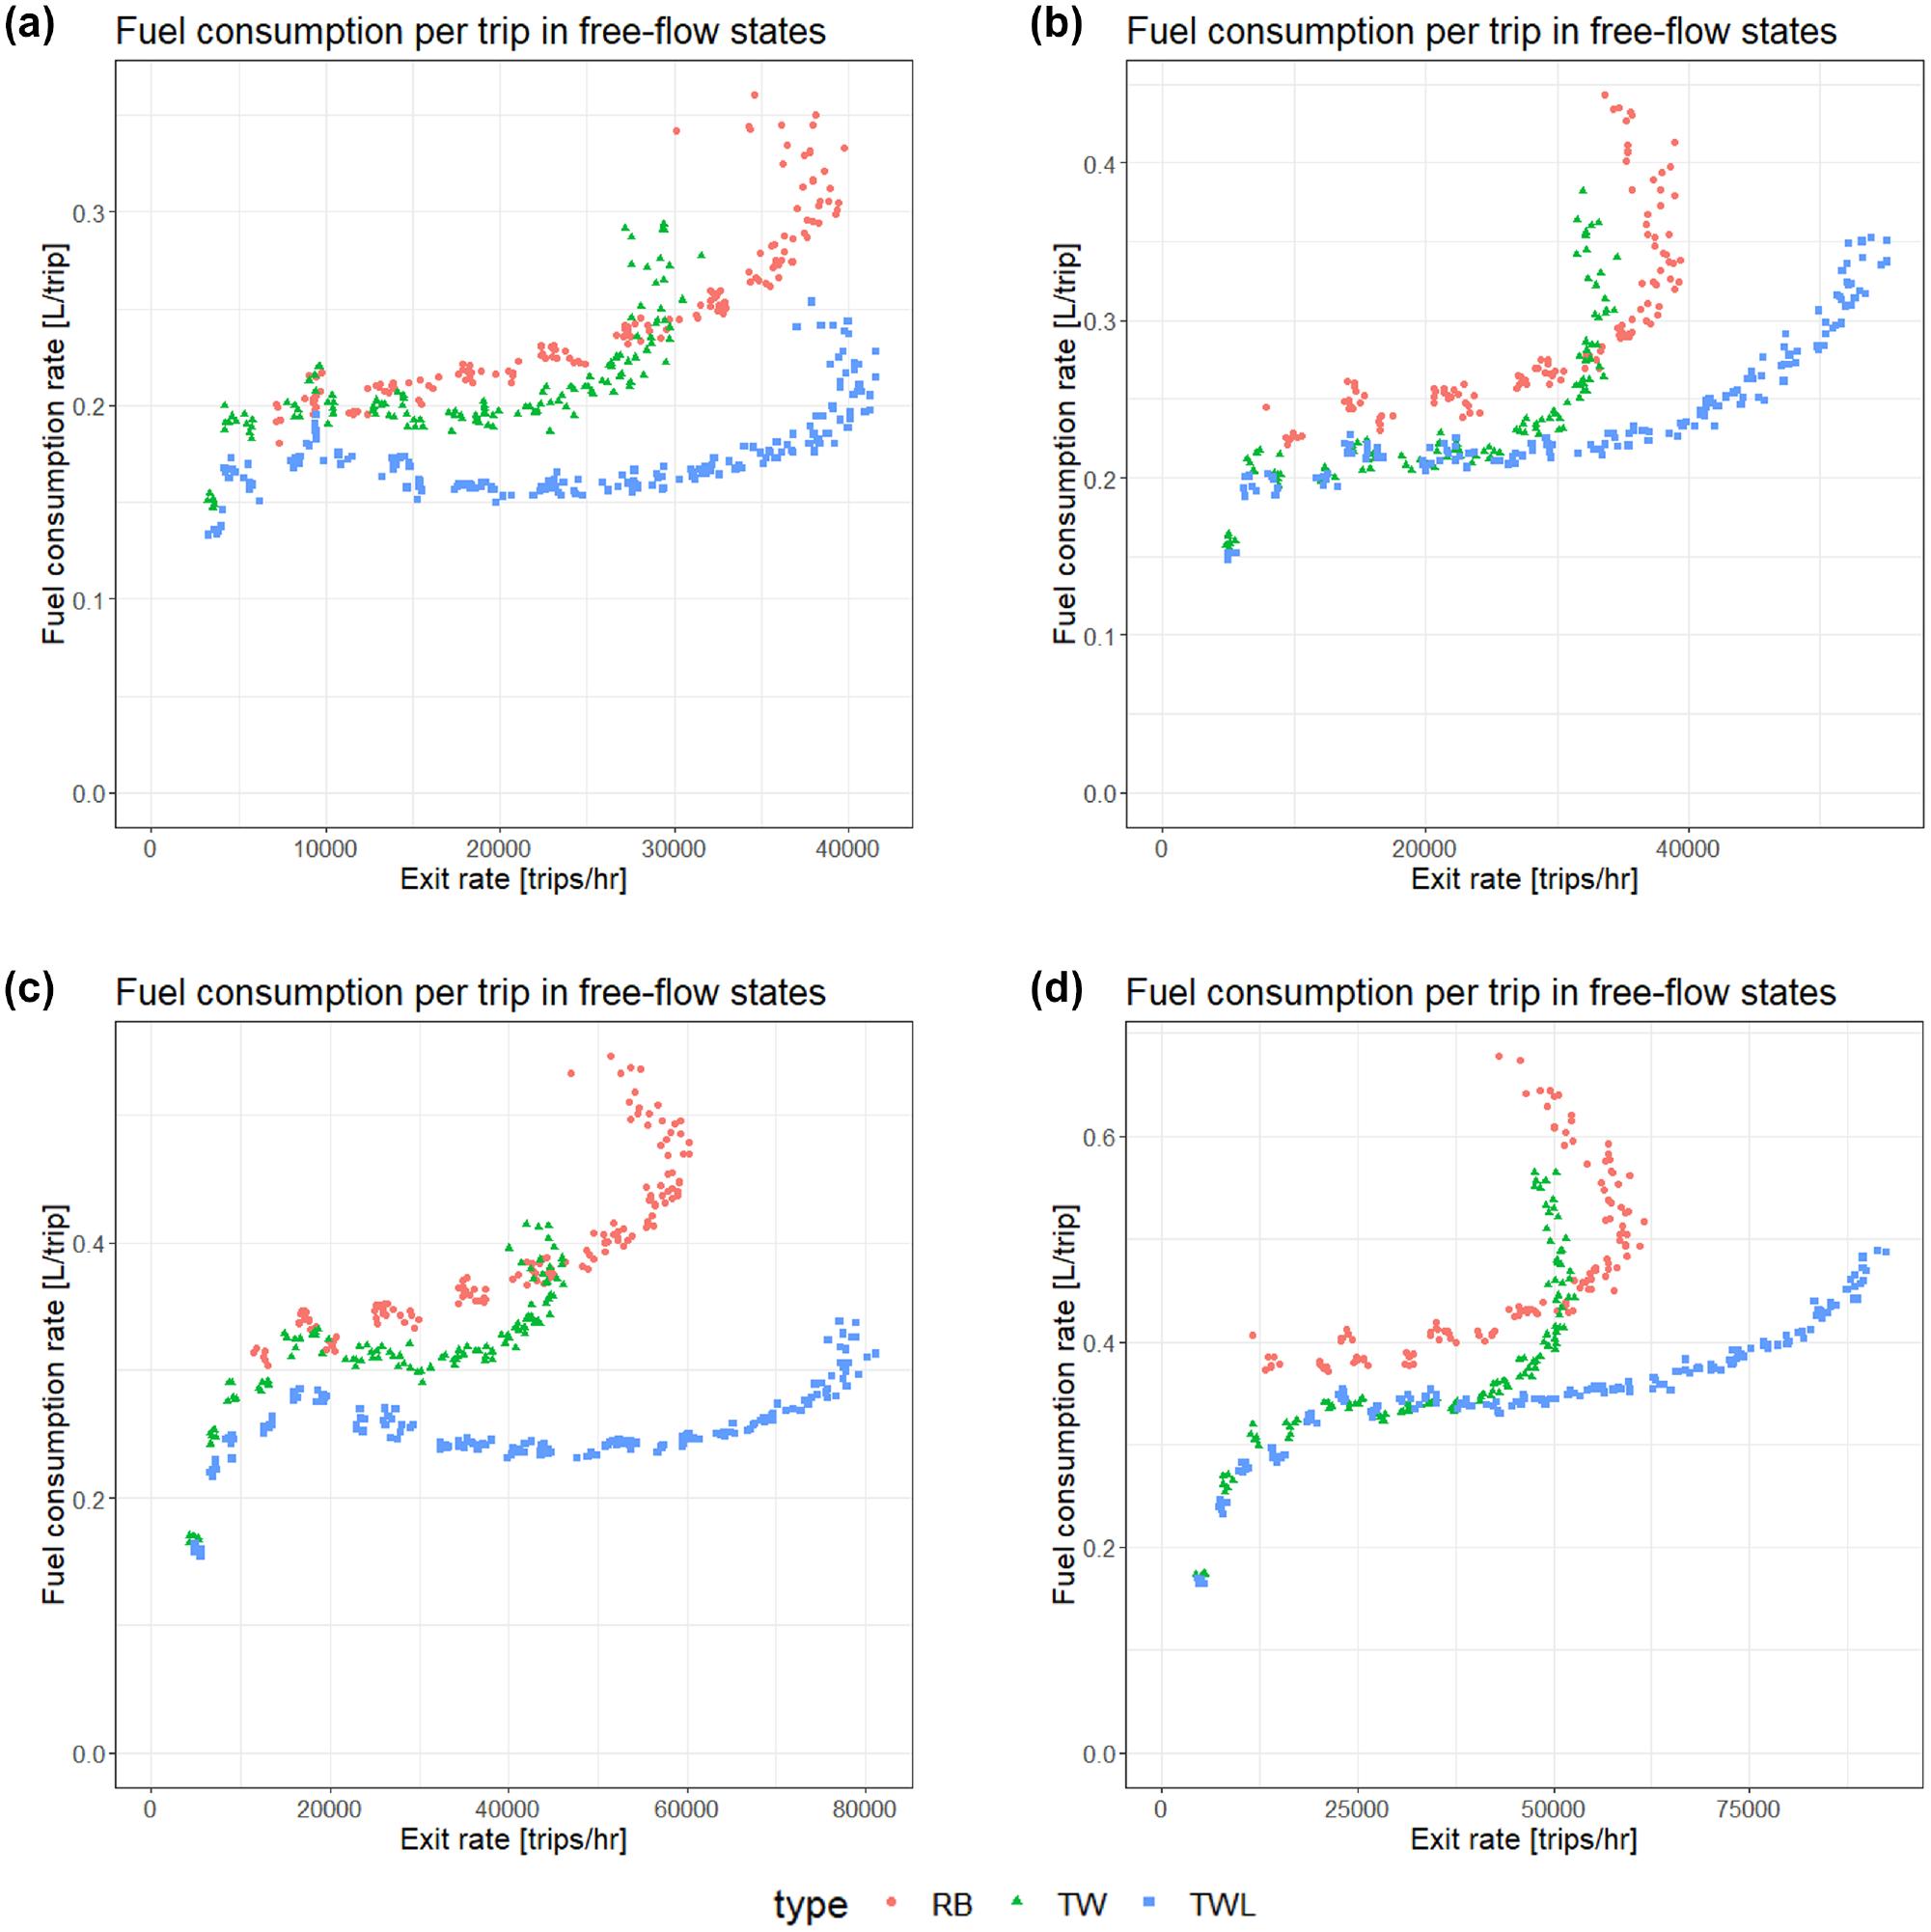
Estimated fuel consumption per trip for four-lane networks: (a) four lanes, 10 × 10, 125 m blocks, (b) four lanes, 10 × 10, 250 m blocks, (c) four lanes, 16 × 16, 125 m blocks, and (d) four lanes, 16 × 16, 250 m blocks.
As in the two-lane case, RB networks still offer higher trip completion rates at uncongested states. In addition, the RB network outperforms the TW network for all configurations until reaching high states of congestion, because of vehicles being able to enter the roundabouts and back up the intersection. However, the maximum trip completion rate of the TWL networks is much higher than that of the RB networks since the former offers higher flow capacities than the latter, even though trips are less direct. The additional trip-serving capacity offered by the TWL network was so large that the TWL networks simply did not gridlock during the simulation tests, while the TW and RB networks did. This suggests that the TWL networks are preferred to move vehicles at the maximum rate possible when multiple lanes are available.
Similar fuel consumption trends were observed in the four-lane networks to the two-lane case. Vehicles must constantly accelerate around and within a roundabout. As a result, the model predicts vehicles will consume more fuel while navigating RB networks compared to signalized networks.
Concluding Remarks
This paper used macroscopic network-wide performance measures to assess the operational performance of roundabouts when broadly applied at intersections within an urban network. The roundabouts were compared to more traditional signalized intersection control both when conflict left turns were allowed and prohibited. An analytical investigation assuming idealized behavior was used to compare network performance with respect to the free-flow speed, maximum flow offered (i.e., flow capacity), maximum rate trips that could be served (i.e., trip-serving capacity), and fuel consumption rate. The findings of the analytical models were then compared via simulation tests of square grid networks in AIMSUN.
The results revealed that networks with roundabouts offer higher free-flow speeds than the other two network types, likely because vehicles do not have to stop at each intersection. The roundabouts also generally outperform networks with signalized intersections that allow left turns at each intersection. Furthermore, single-lane roundabouts applied in networks with a single travel lane in each direction are able to serve vehicles at a higher rate than networks with signalized intersections that prohibit left turns; both network types offer the same flow capacities but the latter forces vehicles to travel longer distances. However, the benefits of roundabouts decrease when applied on multi-lane networks using roundabouts with two travel lanes. In multi-lane roundabouts, the inner lane of the roundabout is used less often, decreasing its impact. In such cases, signalized networks that prohibit left turns vastly outperform networks with roundabouts with respect to both flow capacities and trip-serving capacities. With respect to fuel consumption, the signalized networks can serve the same rate of trips using less fuel than the networks with roundabouts in uncongested and capacity conditions. This is because vehicles must decelerate and accelerate at each roundabout, whereas they may only need to stop at a subset of intersections in signalized networks.
These findings suggest that roundabouts might be useful in specific scenarios, particularly networks with a single travel lane in each direction. Of course, roundabouts require additional space at intersections, which may make them harder to apply in dense urban environments. Nevertheless, the additional travel speeds and capacities offered may make them a useful option, particularly if roundabouts with smaller footprints—micro-roundabouts ( 42 )—can be used. These findings were obtained under idealized assumptions. Future work should confirm that the trends and insights obtained here hold in networks with more realistic features, such as with non-homogeneous structures and with actuated traffic control. However, it should be noted that actuated traffic control was previously shown to have limited network-wide benefits ( 43 , 44 ). In addition, the impact of other roundabout designs, such as the spiral design, is another interesting direction. Furthermore, given the cost and space requirements to implement roundabouts, it may be more practical to only use them at a handful of locations. Methods to determine optimal locations of other treatments—such as in Bayrak and Gayah ( 45 ) and Bayrak et al. ( 46 )—can also be applied to determine the most critical intersections that should be converted to roundabouts to balance between improved operational performance and other factors.
Footnotes
Author Contributions
The authors confirm contribution to the paper as follows: study conception and design: D. Taglieri, V.V. Gayah; data collection: D. Taglieri, V.V. Gayah; analysis and interpretation of results: D. Taglieri, H. Liu, V.V. Gayah; draft manuscript preparation: H. Liu, V.V. Gayah. All authors reviewed the results and approved the final version of the manuscript.
Declaration of Conflicting Interests
The author(s) declared no potential conflicts of interest with respect to the research, authorship, and/or publication of this article.
Funding
The author(s) disclosed receipt of the following financial support for the research, authorship, and/or publication of this article: This research was supported by NSF Grant CMMI-1749200.
Data Accessibility Statement
All data used in this paper were generated by the authors using simulation software as described in the paper. Copies of the simulated data are available on request.