
Abstract
The market for on-demand food delivery (ODFD) has increased considerably, especially during the COVID-19 pandemic. It is crucial for transportation and environmental agencies to understand how ODFD has reshaped the travel patterns of people, affecting vehicle-miles traveled (VMT) as well as pollutant emissions in the transportation system. However, the lack of public data from food delivery companies makes it challenging to quantify the impact of on-demand delivery on the real-world transportation network. In this research, we propose a comprehensive framework to quantify the VMT and emissions incurred by ODFD with three main components: (i) a daily activity generation tool, Comprehensive Econometric Micro-simulator for Daily Activity-travel Patterns, to create a simulation scenario of ODFD behaviors based on a real-world roadway network and population demographics in the City of Riverside, California; (ii) an efficient order dispatching and routing algorithm, adaptive large neighborhood search, to obtain a high quality order dispatching and routing plan; (iii) an emission evaluation model, emission factor (EMFAC), to evaluate pollutant emissions from all dining-related trips. Both short-term and long-term impacts of the COVID-19 pandemic are evaluated. Experimental results show that ODFD has great potential to reduce the dining-related VMT and emissions. The total dining-related VMT in the during-pandemic case decreased by 38% and in the after-pandemic case reduced by 6% to 9%, and the corresponding environmental impacts were reduced accordingly. Meanwhile, emissions reduced significantly with more electric vehicles involved in food delivery. With 100% electric delivery fleet, the ODFD service can save 14% to 22% of emissions after the COVID-19 pandemic.
Keywords
The COVID-19 pandemic has reshaped people’s activity patterns, not only in the way they work, but also the way they shop, eat, and play. According to surveys, most customers switched to online shopping and delivery services because of government requirements of social distancing and personal fears of transmission of the virus ( 1 , 2 ). With regard to the online ordering of cooked food, on-demand food delivery (ODFD) platforms have recently gained prevalence around the world because they benefit both consumers and restaurants by providing contactless, efficient, and convenient online food ordering and offline food delivery services ( 3 ). Especially when self-quarantine and social distancing were required during the COVID-19 pandemic ( 4 ), this service met both the exact needs of restaurant owners for survival of their business and consumer demand for convenient food supplies without generating any personal hygiene concerns. According to Statista, by 2021 ODFD comprised 14% of the total restaurant market in the U.S.A. and it is expected to keep growing steadily in the next few years ( 5 ).
Most recent work on ODFD focuses on optimizing the service quality and developing faster and more efficient algorithms. Liu et al. ( 6 ) presented a Food Delivery Network (FooDNet) in which taxi drivers play both opportunistic and dedicated shared-rider roles in ODFD. Tu et al. ( 7 ) built a dynamic optimization framework to process order collection, solution generation, and sequential delivery decisions in each time window. Zheng et al. ( 8 ) proposed a two-stage fast heuristic to solve the food delivery routing problem, leveraging geographic information to speed up the insertion process. From the algorithm perspective, there are three main approaches: (i) using an exact algorithm, (ii) using local search heuristics, and (iii) using a large neighborhood search. Exact algorithms aim to obtain the global optimal solution but are often limited by the size of the problem, and in some cases even fail to find a feasible solution ( 9 , 10 ). Local search heuristics only make small modifications in each iteration, which may get stuck in a local minima though some of them are integrated with a Tabu search ( 11 ) and simulated annealing framework ( 12 ). Large neighborhood search (LNS) is designed to solve large-scale scenarios by making a large amount of change in each iteration to diversify the solution space ( 13 ). Ropke and Pisinger ( 14 ) combined simulated annealing with LNS and introduced a roulette wheel selection mechanism to select various destroy and repair operators. Their approach, named adaptive large neighborhood search (ALNS), shows great capability in solving the “pick-up and delivery problem with time window” (PDPTW) problem, having been applied in Liu et al. ( 6 ), Tu et al. ( 7 ), and Emeç et al. ( 15 ).
With the unexpected and fast outbreak of the COVID-19 pandemic, most research did not quantify the impact of the pandemic on ODFD demand. There is great uncertainty about the extent to which this fast-growing food delivery service will affect the transportation system and urban environment. On the other hand, little attention has been paid to investigating the environmental challenge and opportunity from the delivery operation perspective. In the literature, the objectives and evaluation metrics of most research to date are minimization of travel distance ( 15 ), order delay ( 7 ), and number of vehicles ( 6 ). To the authors’ best knowledge, no existing research evaluates the environmental impact of ODFD on a large-scale traffic network. In this paper, to fill the gaps, we thus aim to study the effect on vehicle-miles traveled (VMT) and pollutant emissions of ODFD in the context of the COVID-19 pandemic. (In the rest of this paper, we refer to the COVID-19 pandemic which was declared by the World Health Organization early in 2020 as “COVID” for short.)
A comprehensive framework is developed to evaluate the ODFD service from both operational and sustainable perspectives considering the short-term and long-term impact of COVID and it is validated by numerical simulation. As shown in Figure 1, a CEMDAP (Comprehensive Econometric Micro-simulator for Daily Activity-travel Patterns) model, integrating inputs from multiple sources, is utilized to generate high-resolution behaviors and activities. CEMDAP is a micro-simulation implementation of a continuous-time activity-travel modeling system. Given as inputs various socio-demographic data from SynthPoP ( 16 ), land use, and transportation level-of-service attributes from Southern California Association of Governments ( 17 ), the system provides as output the complete daily activity-travel patterns for all individuals of a population ( 18 ). For details about the CEMDAP model, interested readers should refer to Bhat et al. ( 18 ) and Hao et al. ( 19 ). In this research, we mainly focus on dining-out activities. We take reference from existing research and survey results on the impact of COVID on dine-out choices and extract the food delivery demand based on which ODFD orders can be obtained ( 5 ). Driver information is generated according to the order amount and traffic information is extracted from BEAM ( 20 ) to execute driver routing with the real traffic network. The ODFD order dispatching and routing system is based on the ALNS algorithm to solve a large-scale optimization problem efficiently. With the driver routing plan, we can gain the total VMT and each order visiting plan. Finally, the driver planned routes will be used as input of the emission factor (EMFAC) model to exactly quantify the pollutant emissions of delivery drivers. The rest of this paper is organized as follows. In the next section, we will first introduce the ODFD system and formulate a mathematical model to present the food delivery problem. The third section presents the ALNS algorithm in detail. The fourth and fifth sections will show the scenario setup considering COVID and the numerical results analysis with both operational and environmental evaluation metrics, followed by the concluding remarks.
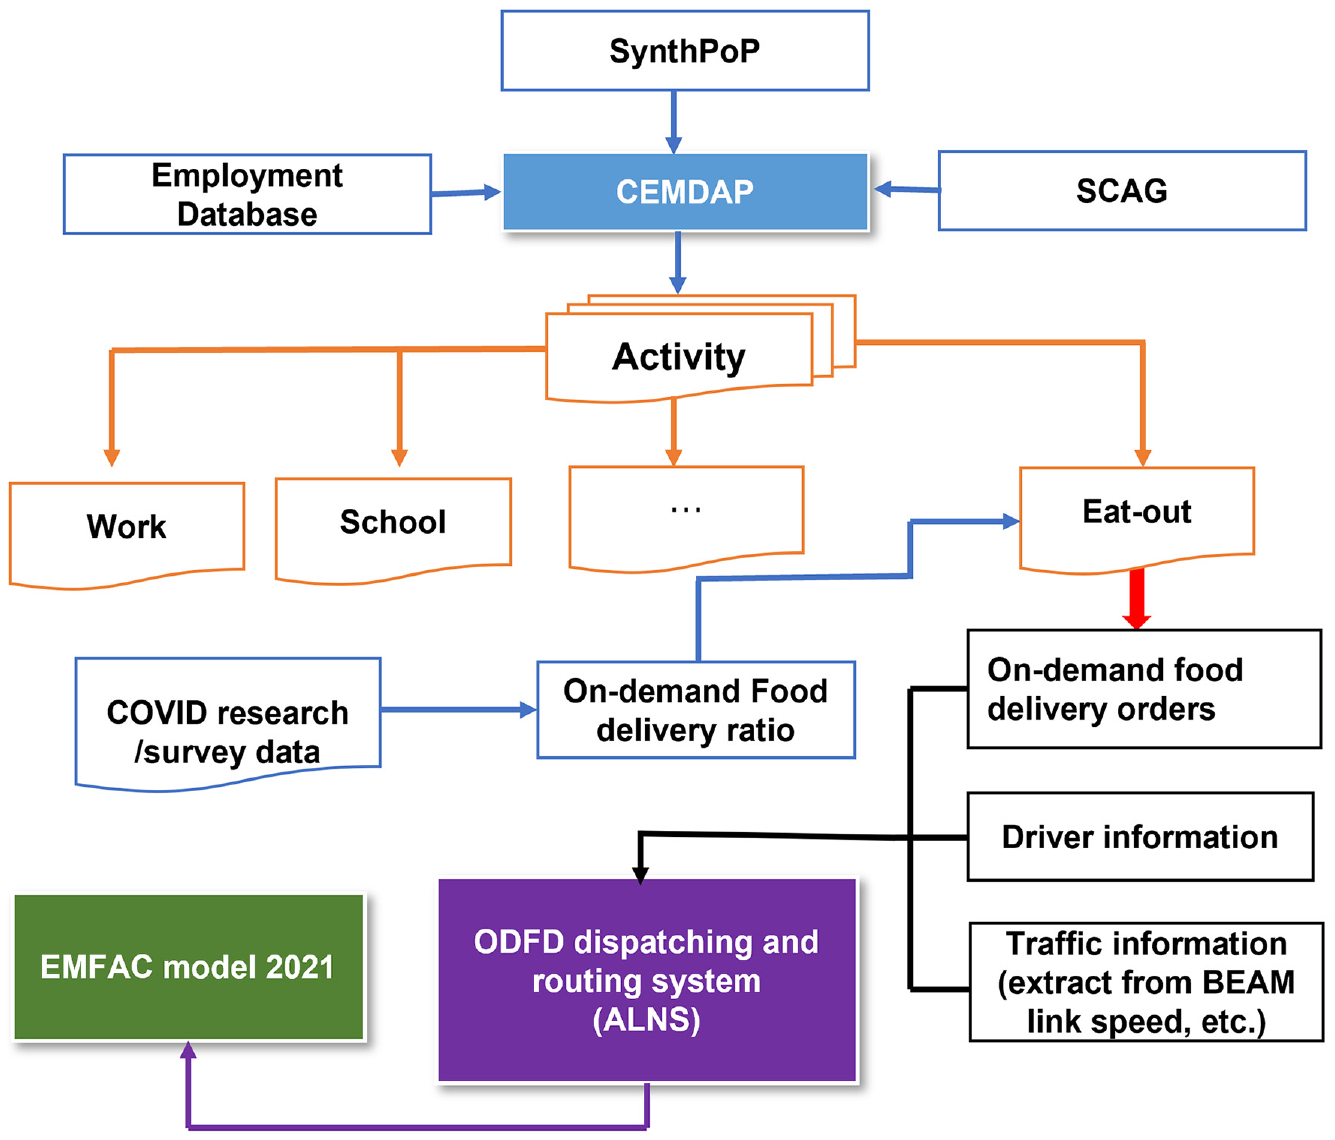
Framework for evaluating vehicle-miles traveled (VMT) and emission impact of on-demand food delivery (ODFD).
Problem Description and Model Formulation
In this section, we present the ODFD problem description and the mathematical modeling. There are four main stakeholders in the ODFD system: customers, restaurants, delivery drivers, and online platform. Each customer places a food order individually. Delivery drivers are a group of local and non-professional drivers who are willing to work temporarily to deliver food orders using their private vehicles. The drivers will log-on to the ODFD platform and provide their availability for work. The ODFD platform will gather information of new orders and active drivers. The goal of ODFD is to dispatch orders to currently available drivers and provide a routing plan simultaneously considering some specific constraints and objectives.
The general ODFD process is illustrated as follows, and the key time stamps associated with one order are shown in Figure 2. In theory, a customer first places one order i at time
Food preparation time
Order click-to-door time
Order expected click-to-door time
Order ready-to-door time
Order delivery delay: the time difference between the expected drop-off time and the actual drop-off time, calculated as
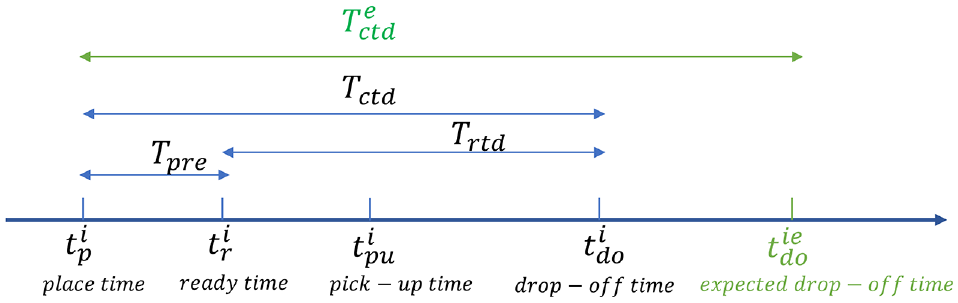
Time record for each order in the on-demand food delivery (ODFD) system.
Figure 3 illustrates an example of ODFD service with six orders. Each order contains the following information: restaurant location (Ri), customer location (Ci), order place time
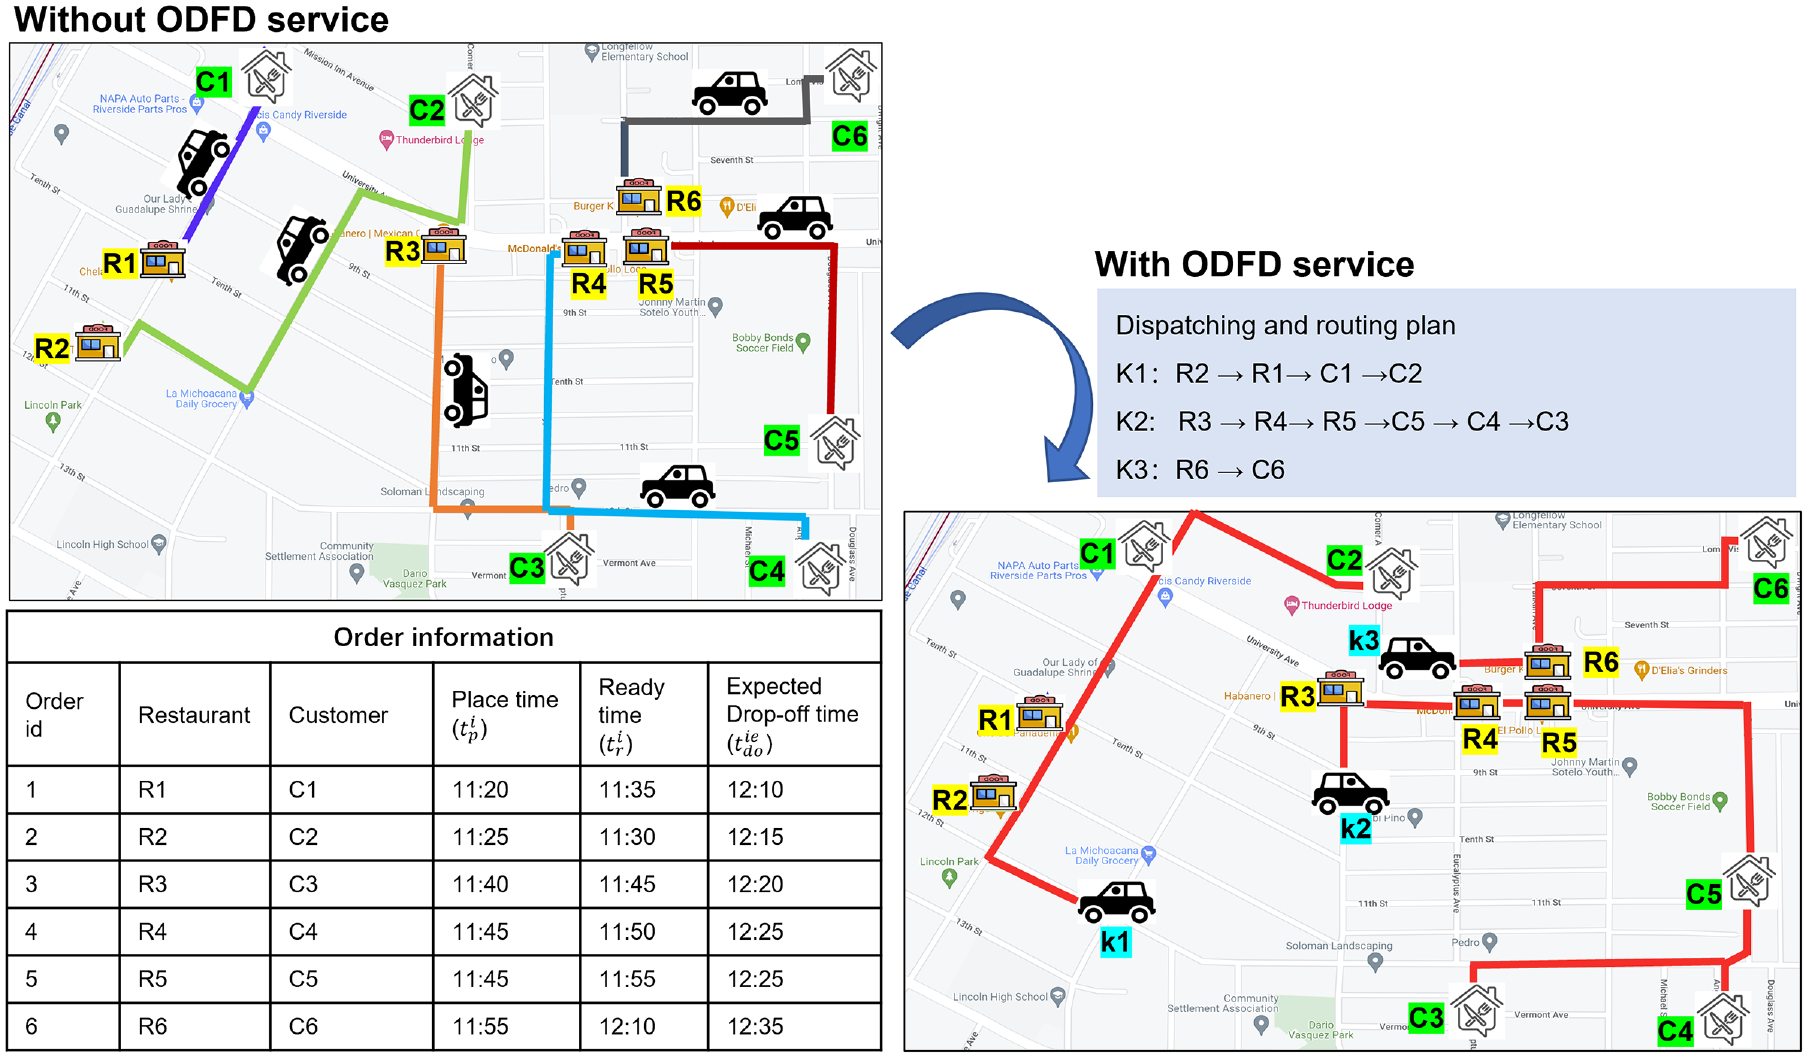
Illustration of on-demand food delivery with six orders, compared with customers traveling to restaurants (left side).
With the above description, in general, the ODFD problem can be formulated as a pick-up and delivery problem with time window (PDPTW) model. Assuming that there are n orders and m drivers in the system, then an undirected graph G = (V, E) can be defined. Node set V can represent the locations of a customer, a restaurant, or a driver. Each arc (E = V × V) represents the movement from one node to another. All parameters and variables are listed in Table 1. Specifically, order i can be defined as 〈i, i+n,
Definition of Variables
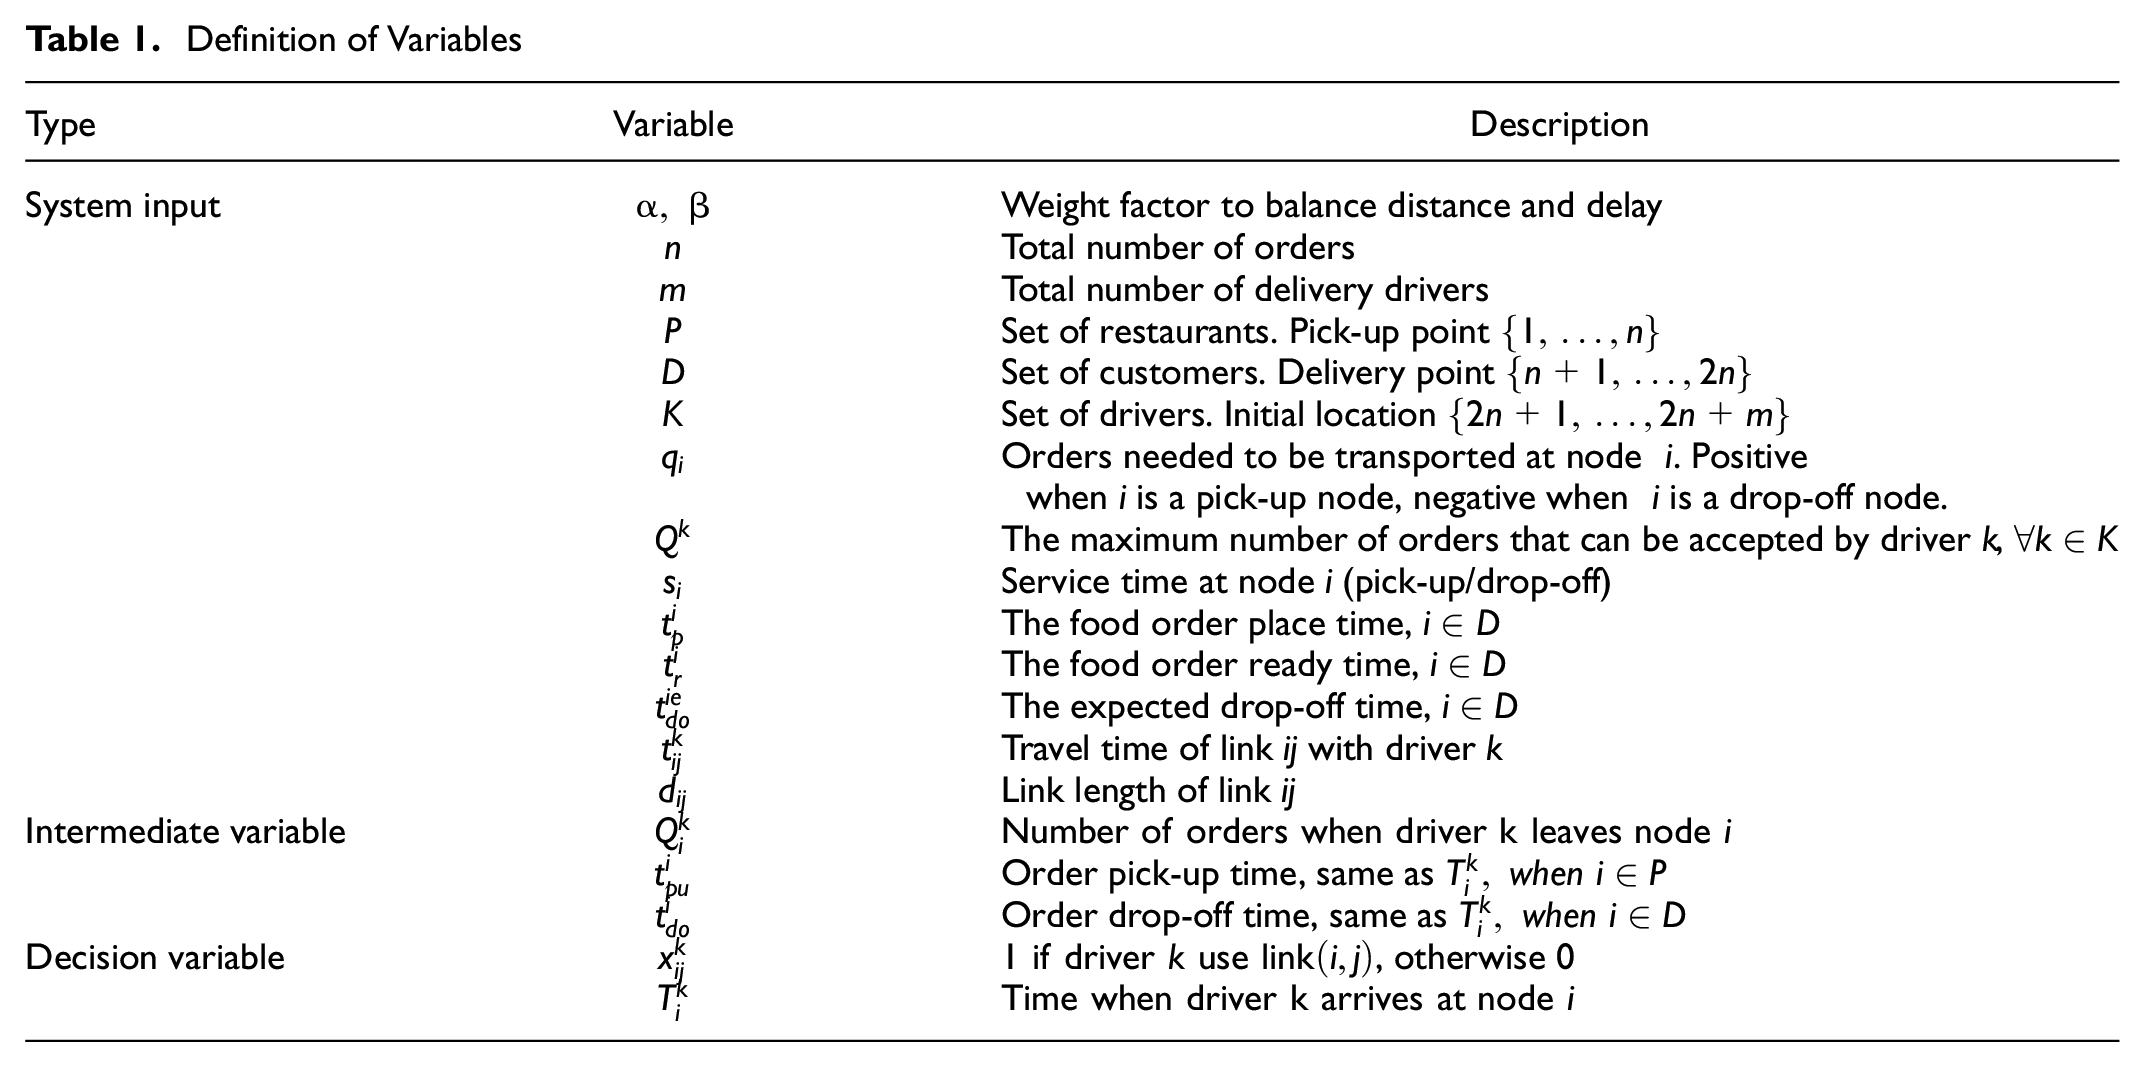
The objective of this problem is to minimize the total travel distance of delivery drivers and total order delay cost. The order delay is defined as the difference between actual drop-off time
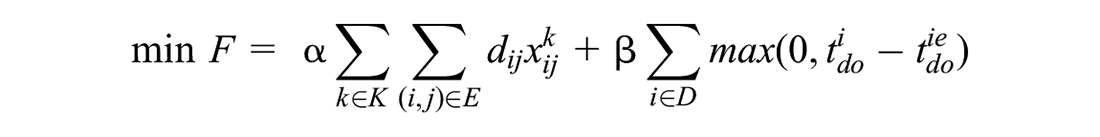
subject to


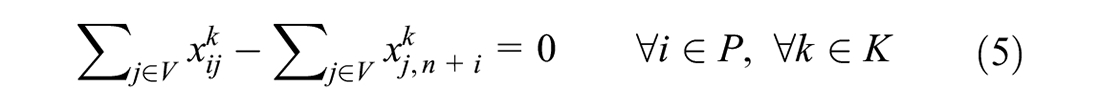


The solution of the ODFD problem is a set of task sequences assigned to multiple drivers. In this problem, the expected drop-off time is defined as the regular expected time of arrival of each order assuming regular traffic and delivery demand level, representing the platform’s commitment as well. Under peak hour conditions, the congested traffic and high demand may cause unavoidable additional delay to the orders. To accommodate this condition, we set time window as a soft constraint in this problem rather than a hard constraint in the general PDPTW model ( 14 ). If the actual drop-off time is later than the expected one, this route is still feasible but a penalty will be recorded in the objective function.
Order Dispatching and Routing Algorithm
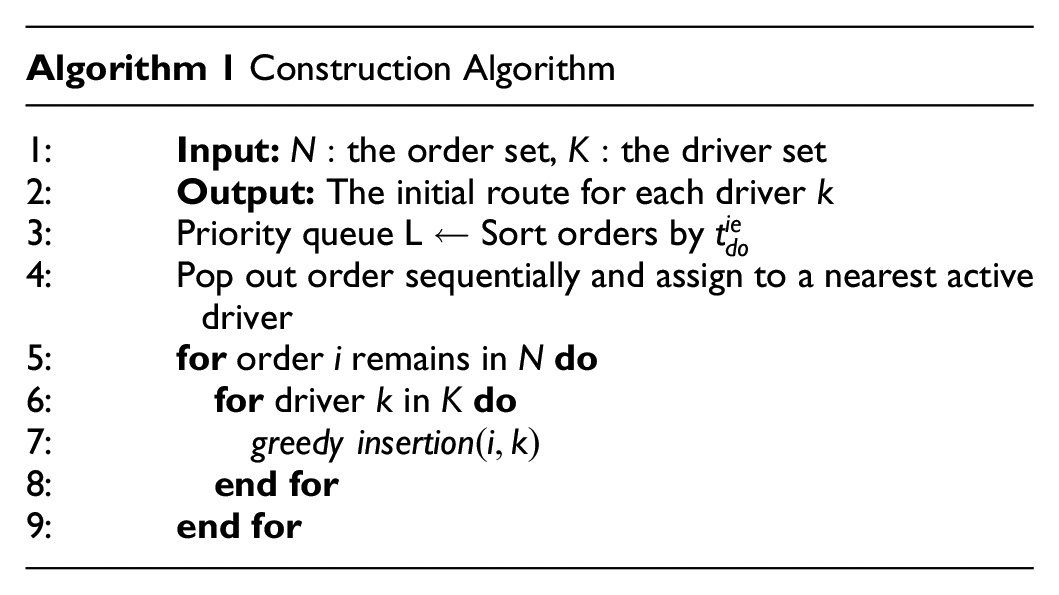
The ODFD problem is a variant of vehicle routing problem (VRP) which is a famous combinatorial optimization problem that possesses non-deterministic polynomial-time hardness. This is because the real-world order routing/dispatching operation involves many continuous variables such as order pick-up time and drop-off time. To solve this problem in a computationally efficient manner, a widely used meta-heuristic is presented in this paper. It consists of two steps. First, we will use a construct algorithm to obtain an initial solution. Thereafter, an ALNS meta-heuristic is applied to further improve the initial solution by minimizing the total cost.
Construction Algorithm
A simple heuristic is proposed to generate the initial solution (shown in algorithm 1). It consists of two steps. (i) Construct the sorted order sequence with regard to expected drop-off time
Adaptive Large Neighborhood Search (ALNS)
Although the initial solution is feasible, it might involve unacceptable delivery delay and inappropriate task sequences. Therefore, we need to further improve the initial solution. In this paper, we utilize the ALNS framework, in which multiple removal and repair operators are selected based on an adaptive selecting mechanism, to diversify and intensify the initial solution then obtain the optimized solution. ALNS can explore a large neighborhood in a structured way, thus it has the potential to escape the local minimum and provide high quality solutions. The details of ALNS are described in the following sub-sections.
Removal Process
First, the current solution is destroyed with one of the following operators. An important parameter in the removal process is the degree of destruction. If only too small a part is destroyed, then it can be difficult to escape a local minimum. If an enormous part is destroyed, then it may require extensive time to construct a new solution. In this paper, a random number b is chosen from
(a) Random removal: This operator randomly selects b tasks to remove to diversify the solution space.
(b) Worst removal: This operator ranks the insertion cost of every order in an increasing order, while introducing a random number
(c) Shaw removal: This operator was first proposed to solve VRP problems based on evaluating the similarity of two locations (
21
). In the ODFD problem, slight modifications are needed since the smallest unit in our problem is an order which consists of two locations. Specially, we calculate the relatedness of two orders with the following equation. The first part is the distance between order i and j including the restaurant’s distance

(d) Distance-based path removal: This operator is designed to remove a route with longest distance. All tasks on this route will be placed into the removed task pool directly.
(e) Delay-based path removal: This operator picks the route with longest total delay, then removes all tasks on that route.
Repair Process
A repair operator is employed to re-insert the removed tasks. In this paper, parallel insertion heuristics is chosen so that multiple routes are built simultaneously. Further, to reduce the computational complexity, we sort orders using the expected drop-off time
(a) Random repair operator: Randomly select a feasible position, then insert the task. Similar to the random removal operator, this operator also perturbs the solution space.
(b) Greedy insertion operator: Greedily insert every task into the best position such that the change of objective function is minimized.
(c) Regret-q insertion operator: The main drawback of greedy insertion is that it might leave the most “expensive” task to the last iteration where we lack flexibility. Regret-q insertion could avoid this situation by incorporating look-ahead information. Let

Adaptive Weighting and Selection Mechanism
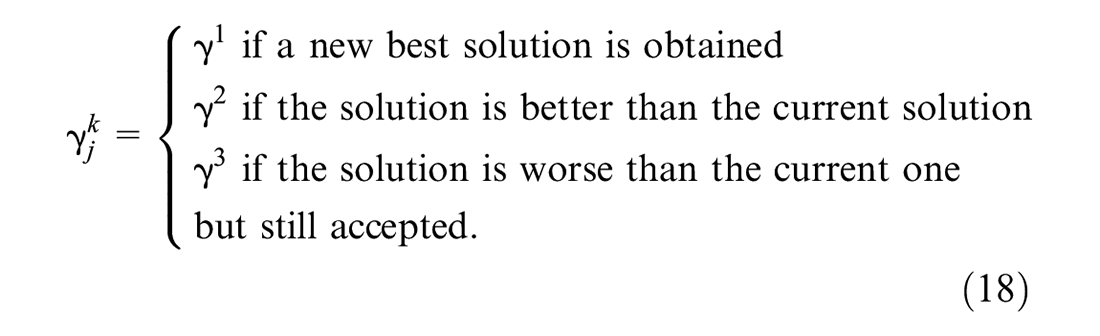
Instead of selecting only one removal and one insertion operator in the entire searching process, ALNS uses all the operators proposed above. In each iteration, one removal and one repair operator are selected independently based on the roulette wheel selection principle. At the beginning, each operator is equally weighted. Weights will be updated after a segment of iterations. Assume that we have n operators and operator i with weight

where the weight of operator i at segment k

Acceptance and Termination Criteria
To avoid becoming trapped in a local minimum, we use simulated annealing strategy to accept a worse solution
EMFAC Model
The EMFAC model is calibrated from the average value of repeated measurements of total emissions per driving cycle. Developed by the California Air Resources Board, the EMFAC model integrates a mobile sources emission model where local-specific emission rate and vehicle activity are combined to generate seasonal or annual emissions for various geographic areas in California ( 22 ). We construct an EMFAC model for the City of Riverside, California, and specify the delivery vehicle to be a gasoline-fueled private vehicle. The following emission rates are obtained (Table 2).
Pollutant Emission Rates From Private Delivery Vehicle Using EMFAC Model ( 22 )
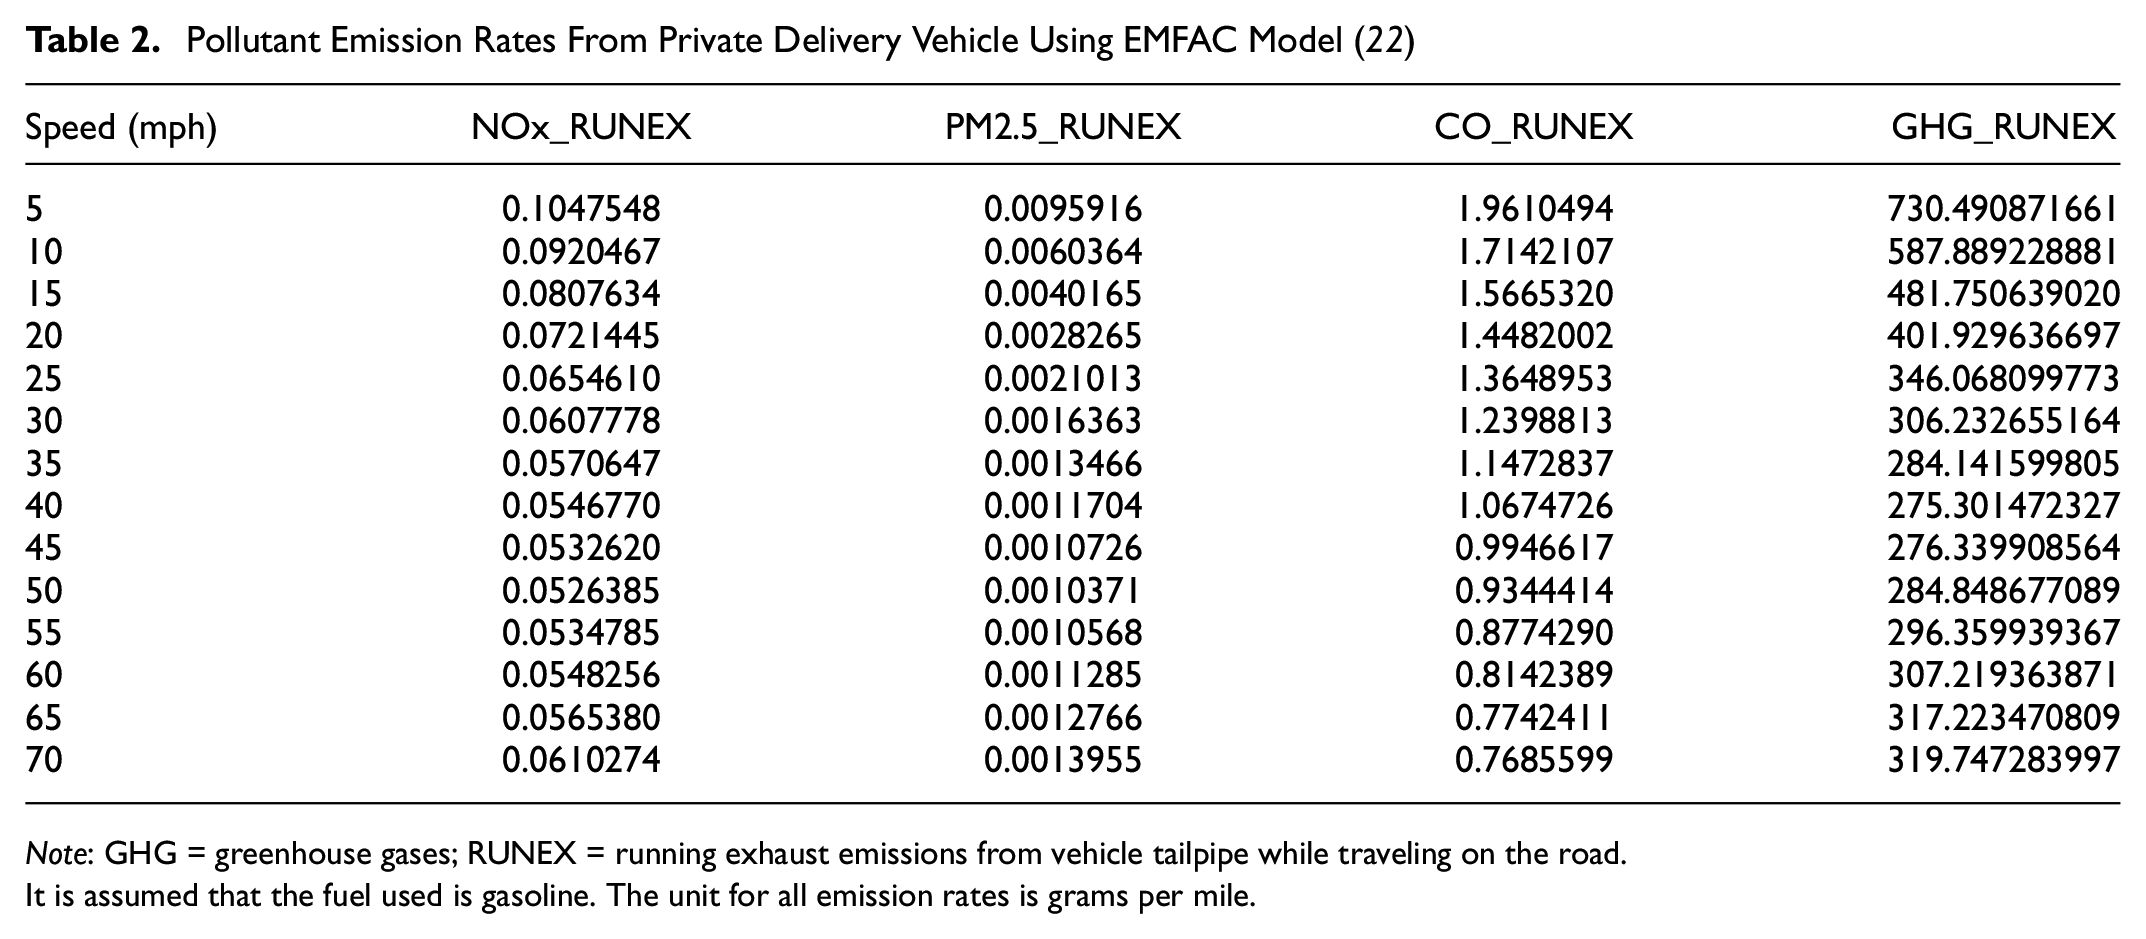
Note: GHG = greenhouse gases; RUNEX = running exhaust emissions from vehicle tailpipe while traveling on the road.
It is assumed that the fuel used is gasoline. The unit for all emission rates is grams per mile.
The EMFAC model provides a convenient way to model area-wide vehicle emission levels which only requires the vehicle travel speed as input. We obtain the link-level travel speed of the City of Riverside and assume that each driver will follow the link speed in the network, thus determining the emission rate of the delivery vehicle per link. With the delivery routing result, we can sum up all emissions link-by-link to evaluate the emission impact. In this research, we evaluate the impact of greenhouse gases (GHG), NOx, CO, and PM2.5.
Scenario Design and Experiment Setup
In this section, we first set up ODFD service scenarios with consideration of the COVID-19 pandemic. A well-calibrated CEMDAP model is first applied to generate eat-out demand in the City of Riverside during the lunch hour, that is, 11:30 a.m. to 12:30 p.m. CEMDAP generates a total of 1,328 eat-out trips. This includes all eat-out options: dine-in, pick-up, or home delivery. We need to decide the home delivery ratio based on the survey data and current research related to COVID.
Before the COVID-19 pandemic, in the U.S. home delivery sales was reported to be 8% of the eat-out market ( 23 ). COVID brought major changes to eat-out behaviors. Some new requirements and strategies, such as social distancing and remote working, resulted in an increasing demand for ODFD services. With regard to the intention to eat out, Tahlyan et al. ( 24 ) studied behavior change in relation to multiple eat-out modes, including dine-in, pick-up, and on-demand delivery during COVID. According to the data analysis of this study, we found that the total eat-out demand reduced by 34% because of regulations and concerns on COVID and more people opted to order food online.
The effect of COVID has evolved with time, with changes in the pandemic condition, public attitudes, and shopping preferences. Many studies have focused on shopping behavior during and after COVID. For example, Wang et al. ( 25 ) showed that the long-term effect of COVID on less essential goods (i.e., takeout food) would be approximately half that of the near-term effects. The long-term impact of COVID on eat-out choice is still under debate. Multiple surveys have explored the change in online shopping behaviors during COVID. One survey by Morgan Stanley exactly focuses on the change in online food delivery penetration share ( 5 ). The main survey result is shown in Figure 4. The black bar shows the prediction result before COVID, and blue bar is the adjusted prediction result considering the short-term and long-term impacts of COVID. With this information, we averaged the ratio over the years 2020 to 2023 to obtain the delivery ratio during COVID. Since the COVID-19 virus has many variants and it effects are still not completely terminated, in this research, we set the expected time for “after COVID” at 2025. Depending on the long-term effects of COVID, we set up two scenarios to discuss the post-COVID food delivery situation. With all the research and survey results, we set up the following experiment scenarios.
Scenario B: Before COVID, the total eat-out demand is unaffected by COVID. The ODFD ratio is 8%.
Scenario D: During COVID, the total eat-out demand shrinks by 34% because of restaurant closures and restrictions. The ODFD ratio increases to 15%.
Scenario A1: After COVID, the total eat-out demand recovers to the before-COVID level. The ODFD ratio is 15% (conservative).
Scenario A2: After COVID, the total eat-out demand recovers to the before-COVID level. The ODFD ratio is 21% (optimistic).
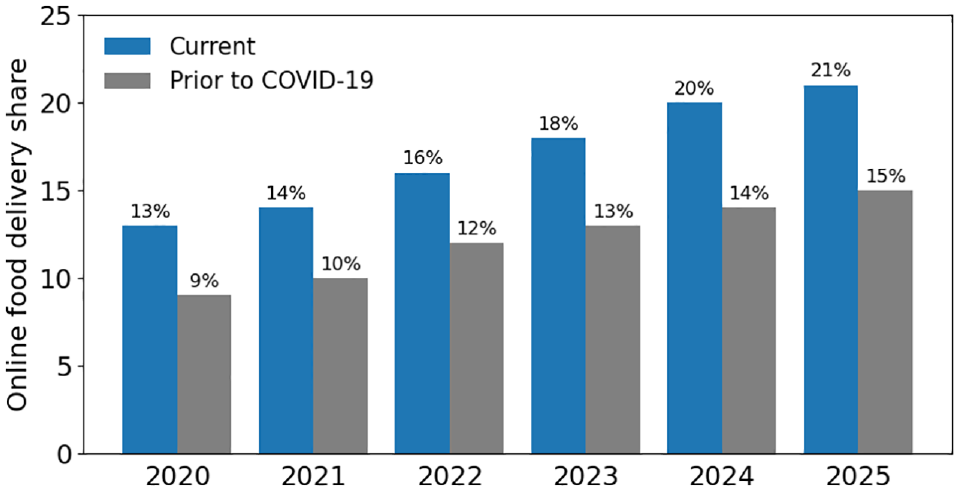
Prediction of online food delivery penetration share in the U.S. ( 24 ).
We sampled from the total eat-out trips according to the scenario settings. As an example, Figure 5 shows the ODFD customer location and restaurant distribution in scenario A2, with a total of 278 orders, scattered in the City of Riverside.
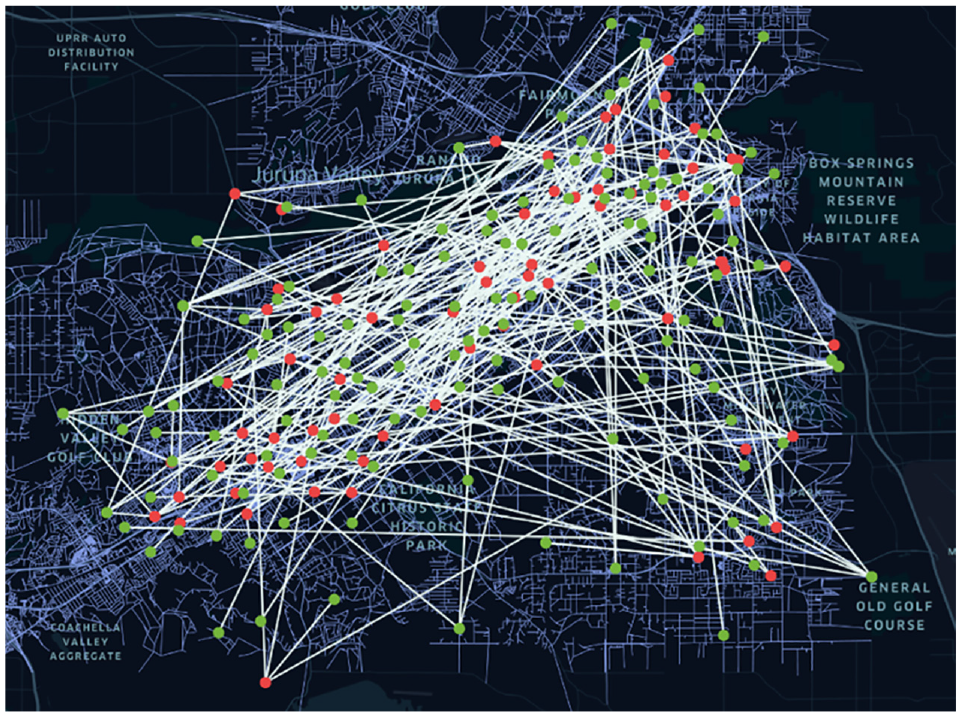
On-demand food delivery orders in case A2. Red point = restaurant, green point = customer location, arc = meal order.
To simulate the ODFD operation, we set up the ODFD scenario as follows. After the customer places one order, the food preparation time is a random number within interval [5, 20], with which we can define the order’s ready time. The expected click-to-door time is 40 min (
26
), indicating the system aims to deliver every food order within 40 min. Each driver needs an extra 1 min to pick up or drop off when they arrive at the restaurant/customer location. Moreover, link travel time is obtained with real-world link length divided by link speed, both of which were extracted from the Riverside BEAM model (
20
). Then we do the routing using the Networkx module (
27
) to obtain the fastest route between any two locations. We first generate drivers’ initial locations around the residential area, assuming that drivers will depart from home to pick up a food order. For drivers with multiple delivery rounds, we assume they will be idle around the last visit location to wait for new orders. The generated driver number is according to the order/driver ratio and is set to five. The driver capacity is 10 orders per trip. In general, food orders will arrive according to time. We set the system to update in every 10 min to dispatch the new arriving orders. Finally, based on multiple experiments, we set the weight
For parameter settings in the ALNS algorithm, we only list the key parameters. Other detailed parameter settings can be found at (
14
). The destruction degree
Experiment Result and Analysis
Performance of ALNS Algorithm
In this part, we first illustrate the performance of the proposed algorithm. We compare with two sets of baselines: (i) iterated greedy algorithm (IG) and (ii) 12 LNS algorithms that combine the previous proposed removal and repair operators. The IG method, proposed in Wang et al. ( 28 ), is based on the local search mechanism to select long delay orders or earlier drop-off orders and then rearrange the delivery routes to minimize total cost. In LNS, a fixed pair of operators will be used repeatedly to improve the solution. The order numbers in scenario B (106 orders) and D (131 orders) are similar and computational complexity is also similar, thus we only choose scenarios D, A1, and A2 to evaluate the algorithm performance. To ensure fair comparison, we apply the same construction algorithm to obtain an initial solution and the same termination criteria. The algorithm performance is summarized in Table 3.
Performance Comparison of Different Algorithms for On-Demand Food Delivery with Three Scenarios
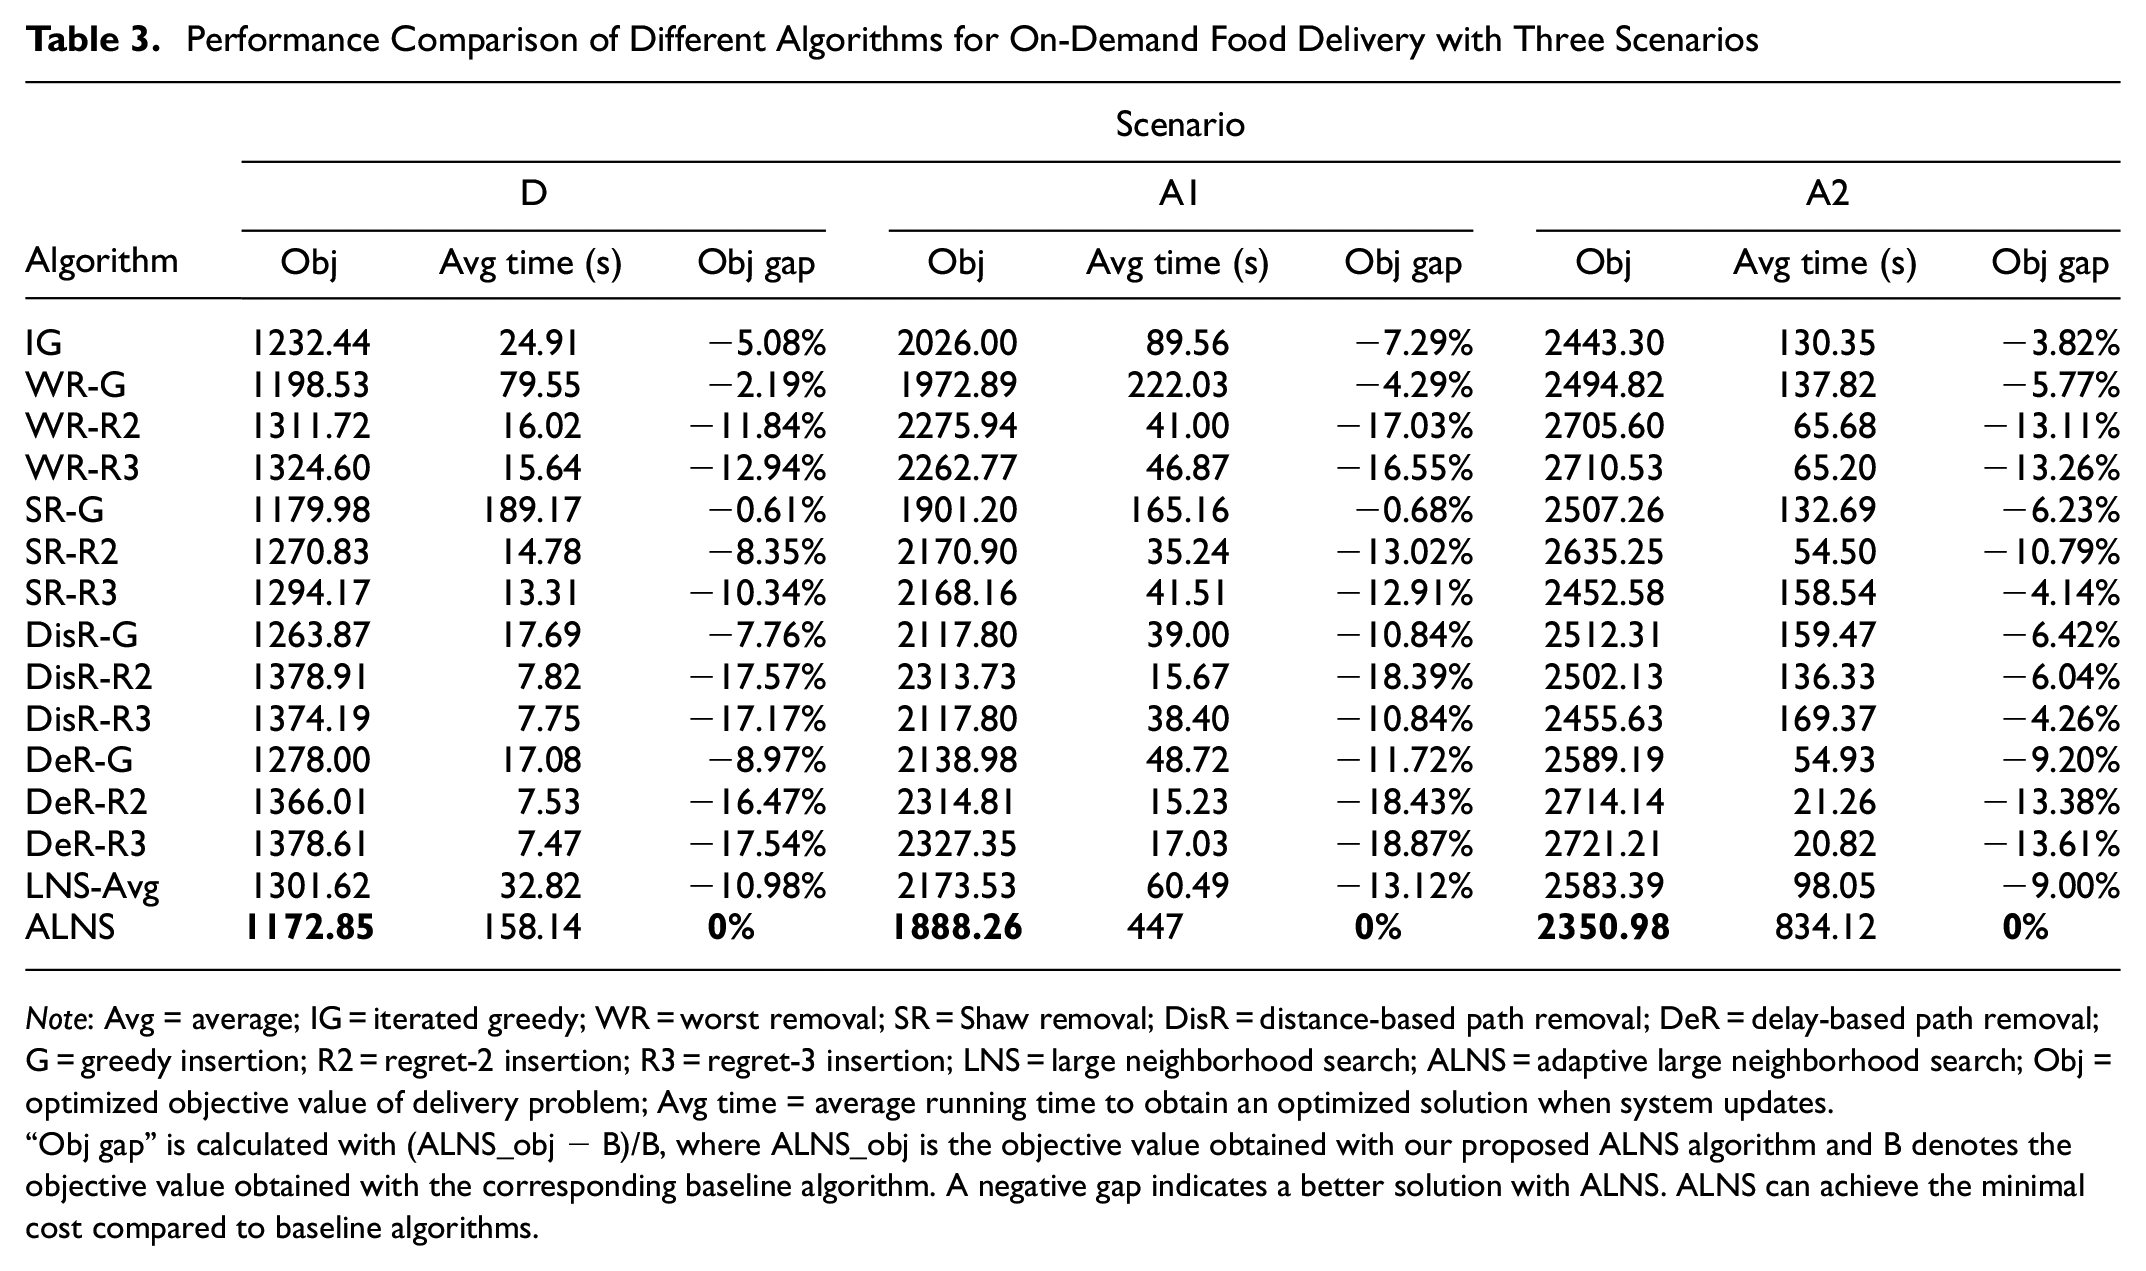
Note: Avg = average; IG = iterated greedy; WR = worst removal; SR = Shaw removal; DisR = distance-based path removal; DeR = delay-based path removal; G = greedy insertion; R2 = regret-2 insertion; R3 = regret-3 insertion; LNS = large neighborhood search; ALNS = adaptive large neighborhood search; Obj = optimized objective value of delivery problem; Avg time = average running time to obtain an optimized solution when system updates.
“Obj gap” is calculated with (ALNS_obj − B)/B, where ALNS_obj is the objective value obtained with our proposed ALNS algorithm and B denotes the objective value obtained with the corresponding baseline algorithm. A negative gap indicates a better solution with ALNS. ALNS can achieve the minimal cost compared to baseline algorithms.
In all three cases, we can note that ALNS outperforms both IG and LNS algorithms in improving the delivery performance. The IG algorithm is mainly based on a local search mechanism which will limit the algorithm to search for a wide range of neighborhoods and can be easily trapped in local minima. With the same termination criterion, the IG algorithm is around 4% worse than the ALNS algorithm. Among the 12 LNS algorithms, we can see that the SR-G operator pair performs best in case D and case A1, which is only 0.7% worse than ALNS, though more computational time is required to achieve such a high quality solution. But in case A2, the SR-G algorithm is 6% worse. This shows the dependency of the LNS algorithm of different cases and the lack of robustness. We then average 12 LNS algorithm performances to obtain the LNS-Avg result and compare it with ALNS performance. This comparison again shows the superiority of the ALNS algorithm. ALNS can perform 9%, 10%, and 13% better in D, A1, and A2 case respectively. Further, we can note that the average running time of ALNS is longer than other algorithms, because ALNS iteratively searches for more potential neighborhoods to escape the local minima. Another reason is that our algorithm is implemented on an ordinary computer and written in the Python script language. In practice, one can consider using parallel or distributed computing and coding in a much faster programming language, such as C++ or Java to further accelerate the computational speed.
Operational Performance Analysis of ODFD Service
We ran our proposed algorithms over all four cases: B, D, A1 and A2. With the obtained order dispatching and routing result, we further look into the operational performance of the ODFD service. In Table 4, we show the general operational performance. Among four cases, the total VMT cost increases because of the rising demand for the ODFD service. From the order delivery delay, we can note that the average delay per order is within 2 min. The average click-to-door time is around 33 min, indicating that on average customers can receive food orders within 33 min after placing the order online, which is acceptable in the real world. Meanwhile, the food freshness can be guaranteed because the average order ready-to-door time is around 20 min.
Operational Performance of the Solution
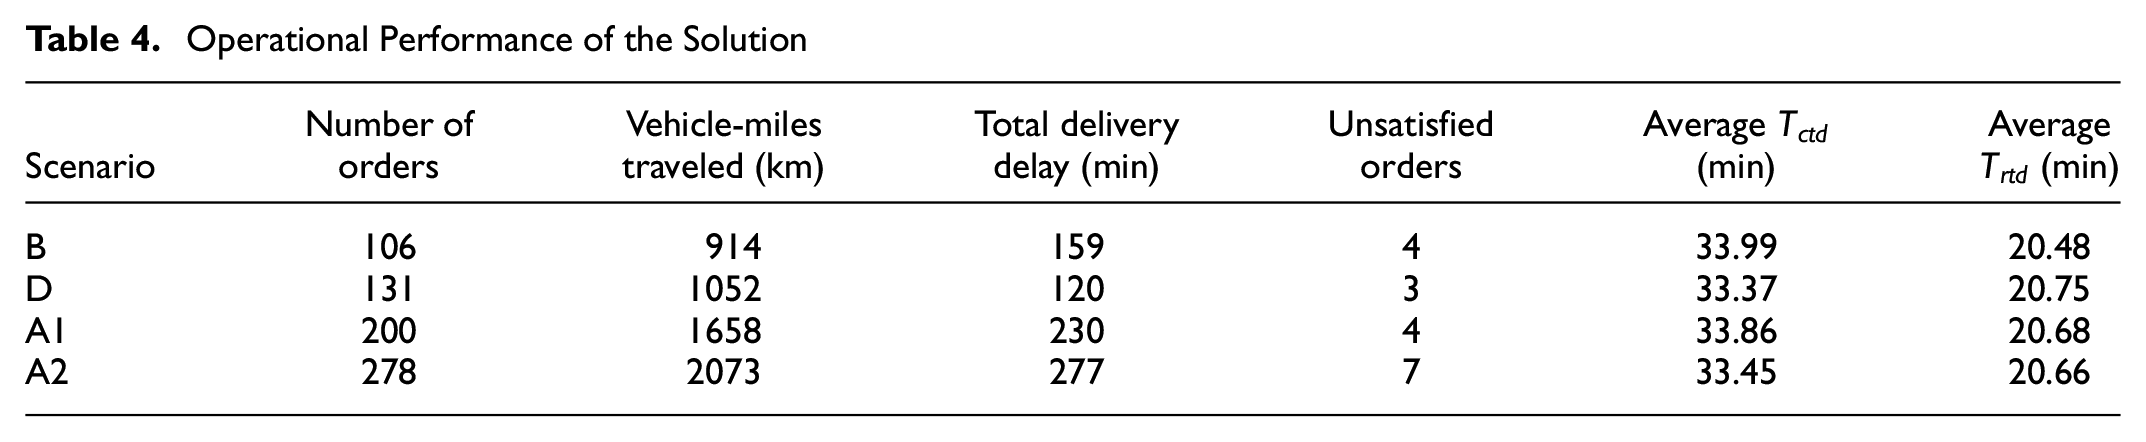
Figure 6 shows the box plot of the click-to-door time and ready-to-door time distribution in detail. The x-axis represents multiple scenarios results and the y-axis is the time unit (minutes). In the experiment setup, we set the expected click-to-door time for all orders at 40 min. Thus, the first threshold indicates whether any delay occurs.
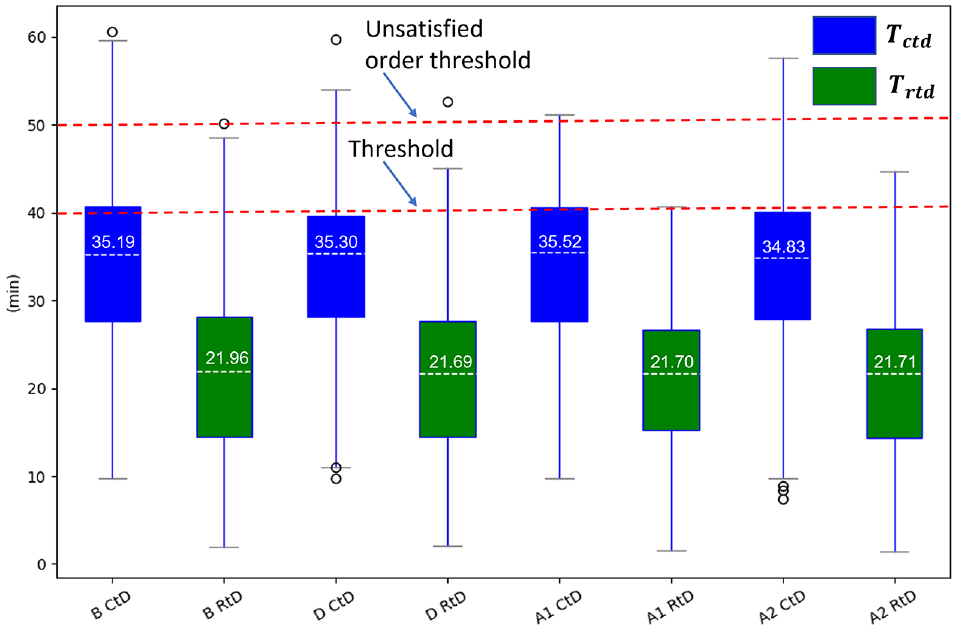
Distribution of click-to-door time and ready-to-door time.
VMT and Emissions Impacts of ODFD
In this section, we quantify the VMT and emissions impacts of all eat-out trips. For ODFD trips, the routing result for a delivery driver is utilized as the input of the EMFAC model to calculate the emission amount. For other eat-out demands, we assume people visit the restaurant either to dine in or take out; these trips are in-person roundtrips between customer and restaurant locations. We use the Networkx module to obtain the fastest route for in-person trips and quantify the corresponding VMT. We then use the EMFAC model to obtain the emissions impact. We combine the impacts of ODFD trips and in-person trips together to evaluate the VMT and emissions impacts under different COVID periods (B, D, A1, and A2). The detailed results are summarized in Table 5. For all four scenarios, the average distance cost for an ODFD order is 7.5 to 8.5 km/order. While for the in-person trips to pick up an order, the distance cost is around 18 km/order. This difference illustrates the superiority of ODFD service to reduce VMT with the optimized solution.
Vehicle-Miles Traveled (VMT) and Emission Impacts of On-Demand Food Delivery (ODFD) in Different Scenarios
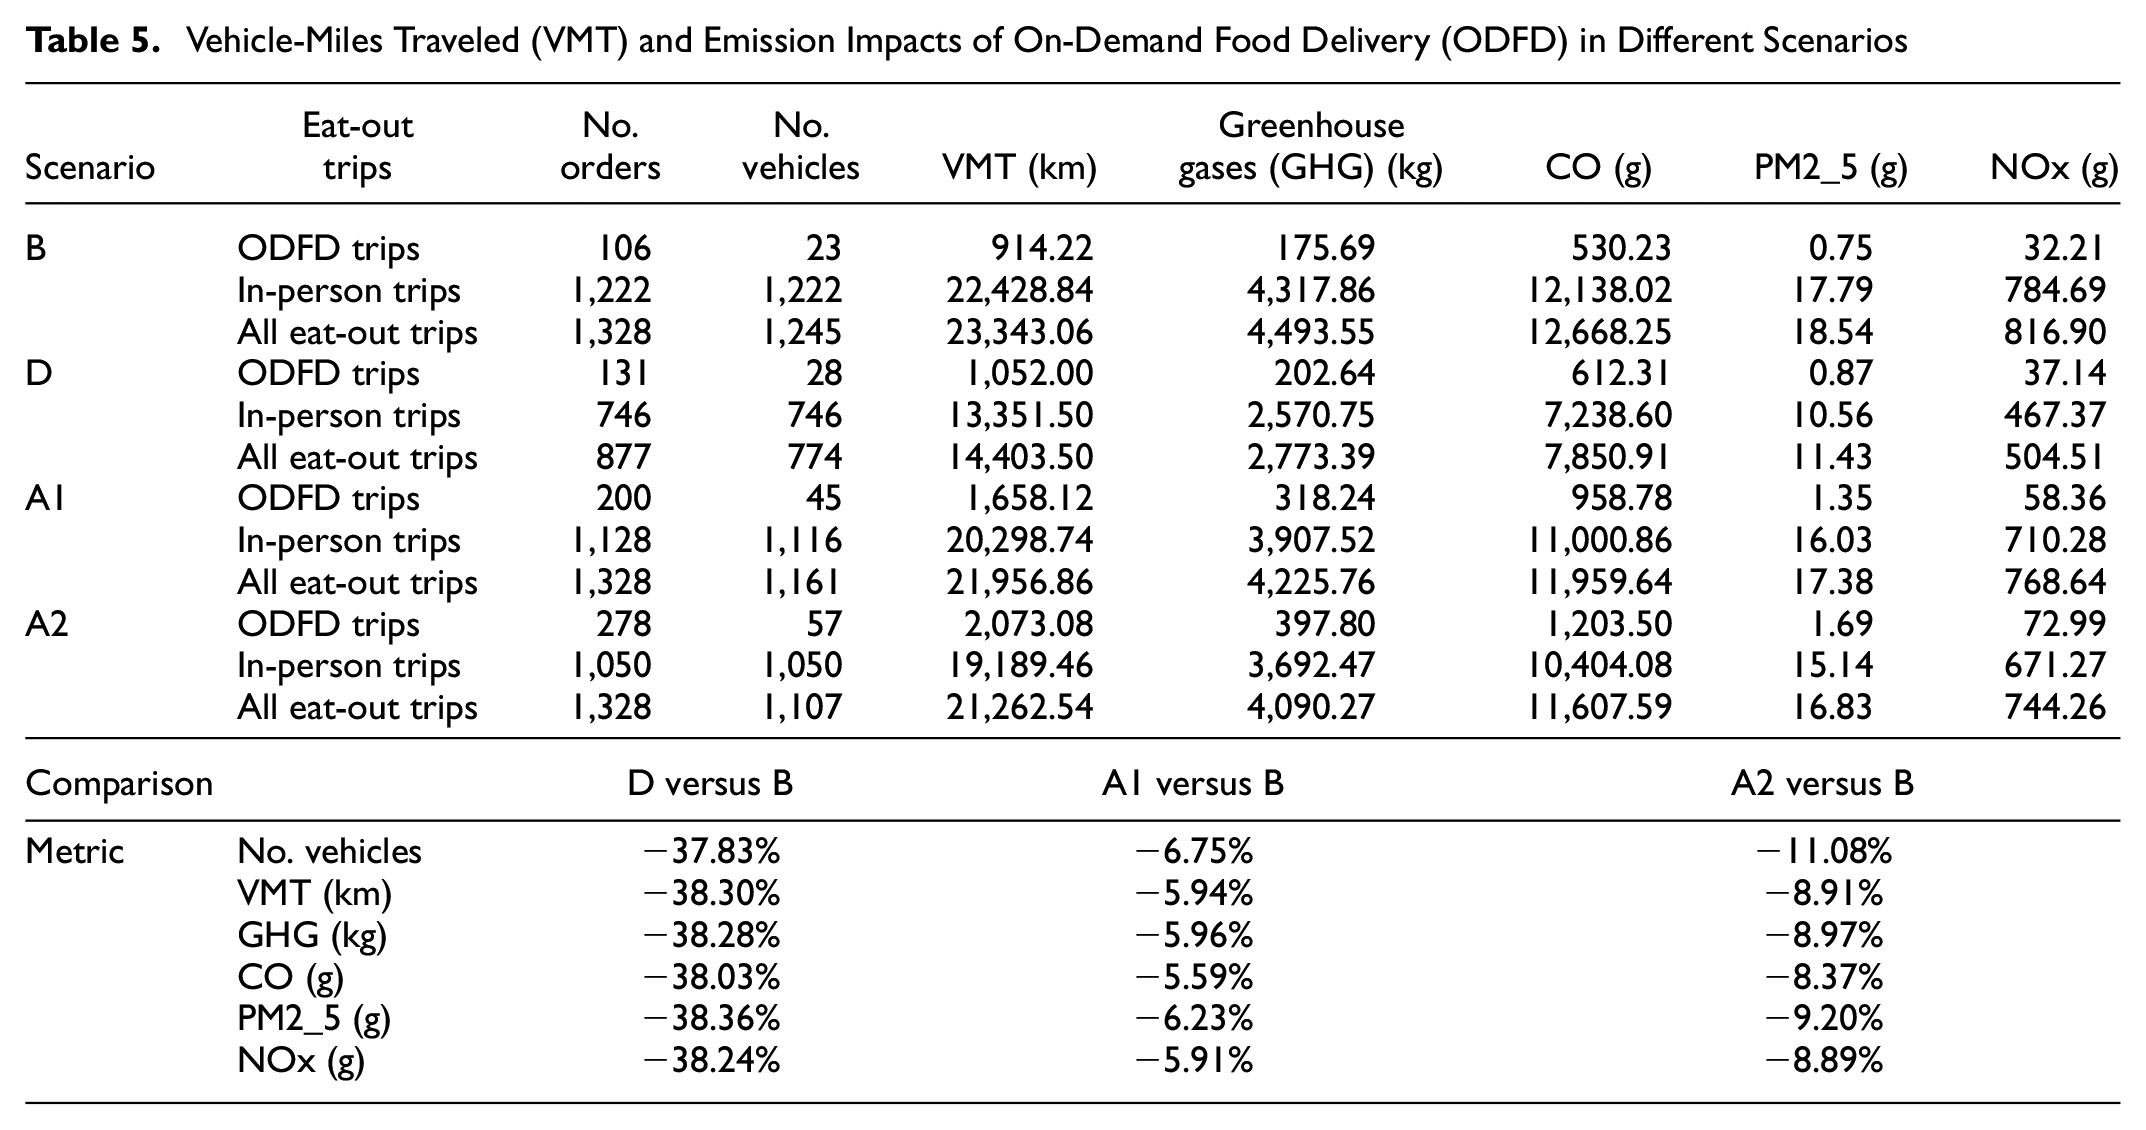
Take case B as the baseline scenario; during COVID the total VMT and emissions all reduced by 38%, including vehicles on the road for the purpose of eating out. This might be explained by the following two reasons. First, the government-imposed lock downs, social distancing requirements, and fear of infection, meant that the eat-out demand reduced drastically, which can undoubtedly reduce the VMT and emissions. Second, more people tended to use the ODFD service as it is a desirable choice for convenient and contactless food delivery under the wide concern of personal health. With the ODFD service, the system can bundle more orders together to pick up most food orders in the commercial zone first then deliver them to the customers sequentially, so one would expect more saving of VMT and emissions.
Meanwhile, the ODFD service may change people’s eat-out behavior in the long term considering the potential change in dining style. When wwe compare case A1 and case A2 with case B, we can note that although the eat-out demand recovers to the before-COVID level, with higher ODFD ratio, the VMT and emissions can still be decreased by around 6% to 9% depending on the future ODFD penetration rate. The dining-related vehicles on road are reduced by 6% to 11% as well. Thus, high penetration rate of ODFD can help reduce VMT in the traffic network and to build an eco-friendly transportation system.
It is also noticed that a similar reduction rate can be found in VMT and pollutant emissions for the same scenario. The main reason is that with EMFAC model, VMT and speed pattern are two key inputs for emission estimation. As the objective function only aims to minimize the VMT, the speed pattern is hard to optimize or influence. Thus, the percentage change in emissions is the same as the percentage change in VMT during different periods. We will introduce the fuel-consumption/emissions into the objective function to avoid this limitation in future research. Another possible reason is that we assume all vehicles to be gasoline fueled. With the homogenous vehicle fleet, VMT saving is proportional to emission savings. If some vehicles are replaced with electric vehicles, then we can expect more emission reduction in the urban context.
To validate this assumption, we introduced electric vehicles (EVs) into the delivery vehicle fleet under multiple penetration rates and calculated the emissions change. EVs are reported to occupy 6% of the private vehicle market share in California ( 29 ). Our baseline scenario is set up as 6% dining-related vehicles being replaced with EVs. Both dine-in and food delivery emissions are reduced proportionally with the EV penetration rate in these two sectors. If dine-in vehicles and delivery vehicles were electrified by the same proportion, then environmental impacts are reduced by the same amount as in the all gasoline vehicle case. To specifically study the benefits of delivery fleet electrification, we conducted a sensitivity analysis by steadily increasing the EV penetration rate only in the delivery fleet and assumed that 94% of in-person trips still use gasoline vehicle. In the real world, in practice, delivery platforms can subsidize EV drivers to increase the EV penetration rate, which can be potentially higher than the total EV penetration rate in the private car market. For example, Uber has already launched a pilot program to subsidize EV drivers with an extra one dollar per order ( 30 ). Taking GHG emissions as an example, we present the results in Figure 7. The result shows that the GHG emissions reduced significantly with higher EV penetration rate. With the same VMT saving as in Table 5, in the during-COVID case, the emissions can be reduced by 45%. In the after-COVID case with 100% EV delivery fleet, the ODFD service can save 14% to 22% of emissions and 6% to 9% of VMT cost. This sensitivity analysis provides evidence to encourage the food delivery platforms to pay attention to the delivery vehicles’ composition and encourage more EV drivers to participate in the delivery process, since delivery fleet electrification can reduce further energy consumption and mitigate negative environmental externalities.
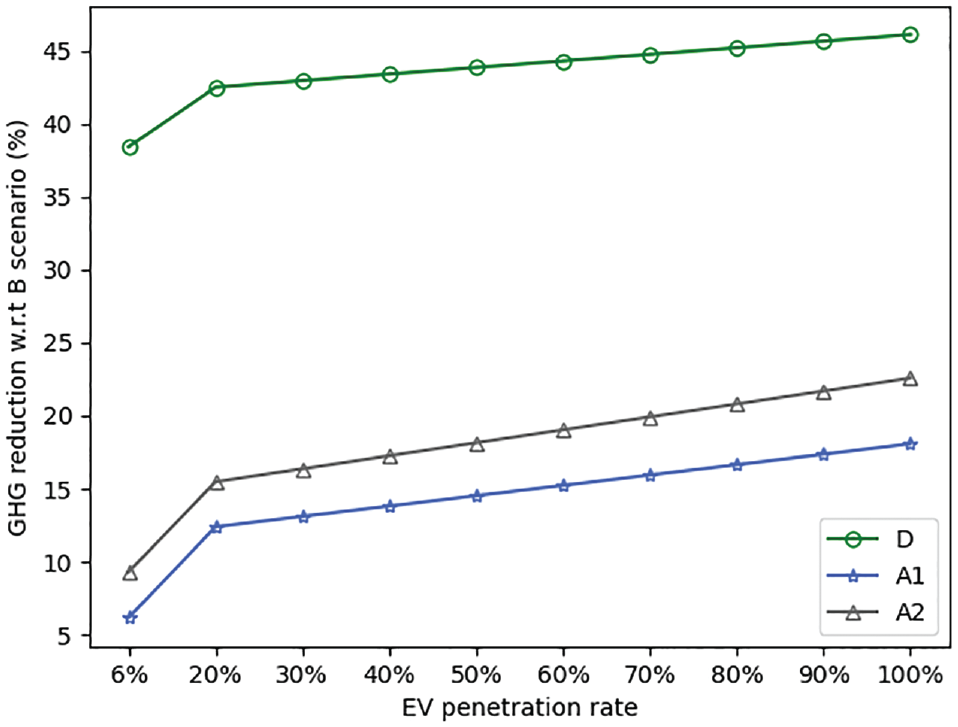
Reduction of greenhouse gas emissions under increasing electric vehicle (EV) penetration rates.
Conclusion
The COVID-19 pandemic has brought major changes to eat-out behaviors and since the start of the pandemic more people tend to order food online. There is great uncertainty about the extent to which this fast-growing food delivery service will affect the transportation system (VMT) and urban environment (pollutant emissions). In this paper, a comprehensive framework is proposed to evaluate the VMT and emissions impact of ODFD services. An effective order dispatching and routing algorithm is implemented to assign order sequences to available drivers. The ALNS outperforms 13 baseline algorithms in obtaining high quality solutions. The operational analysis of the experiment results further shows that ALNS can provide an ODFD solution with fast delivery speed and high standard of food freshness. From the city-wide VMT and emission impact analysis of all dining-related trips through different COVID periods, we can note that the total VMT and pollutant emissions (including GHG, CO, PM2.5, and NOx) all reduced by 38% during COVID and by 6% to 9% in the after-COVID case. With increasing EV ratio of the delivery fleet, the results show that emissions reduced significantly with higher EV penetration rate. With 100% EV delivery fleet, the ODFD service can save 14% to 22% of emissions in the post-COVID context.
This study has potential limitations. First, our evaluation of the VMT and environmental benefits may be optimistic. (i) The VMT and emissions impact are based on the optimized order dispatching and routing result, whereas in the real world this depends on the delivery platform’s operation strategy and optimization objective. (ii) We assume delivery drivers will remain idle at a position to wait for new orders instead of actively moving around to enhance the chance of receiving new delivery tasks, while in practice such deadheading trips might account for a higher amount of total VMT which may offset the environmental benefits of ODFD ( 31 ). Second, our food delivery setup is static without considering the dynamism of order demand and driver resources. This might not exactly represent the real-world delivery process since it is still possible that drivers may be assigned new orders during the delivery round. Finally, because of the limitation of existing research on the impact of COVID on ODFD, we have to take reference from other research and survey results. This might introduce a slight gap since the research area and context are different in our research and other references.
In the future, we will work on improving the model, for example, setting fuel consumption, which is also directly correlated with GHG emissions, as the main objective of the optimization model to investigate the potential of eco-friendly ODFD. Moreover, factors in real-world ODFD operation such as profit, incentives, and compensation for drivers will be considered in the future work. Another interesting research direction is the integration of EVs with ODFD, such as considering EV range limits and access to charging, utilizing EVs to reduce emissions, and optimizing the order dispatching decision with a mixed energy fleet of traditional vehicles and EVs. Finally, this proposed framework and algorithms could be readily employed to solve other on-demand delivery problems, such as groceries and parcels, and evaluate the corresponding impact.
Footnotes
Author Contributions
The authors confirm contribution to the paper as follows: study conception and design: H. Liu, P. Hao, Y. Liao, K. Boriboonsomsin, M. Barth; data collection: H. Liu, P. Hao, Y. Liao; analysis and interpretation of results: H. Liu, P. Hao, Y. liao, K. Boriboonsonsim, M. Barth; draft manuscript preparation: H. Liu, P. Hao. All authors reviewed the results and approved the final version of the manuscript.
Declaration of Conflicting Interests
The author(s) declared no potential conflicts of interest with respect to the research, authorship, and/or publication of this article.
Funding
The author(s) disclosed receipt of the following financial support for the research, authorship, and/or publication of this article: This study is funded by the National Center for Sustainable Transportation (NCST).
The contents of this paper reflect only the views of the authors, who are responsible for the facts and the accuracy of the data presented in the paper.