
Abstract
The number and share of U.S. residents aged 60+ years have increased substantially since 2000, and both are projected to expand further in the years ahead. The mobility patterns of this growing cohort of travelers are consequential and only lightly studied since the COVID-19 pandemic. To better understand the travel patterns of older adults and how they have evolved since the turn of the century broadly, and following the COVID-19 pandemic in particular, this article analyzes national data from the 2001, 2009, 2017, and 2022 iterations of the U.S. National Household Travel Survey. We compare travelers in their 60s, 70s, and above with middle-aged (aged 30–59 years) and younger travelers (aged 5–14 and 15–29 years) across multiple dimensions. We find that trip-making and person-miles of travel have been falling for older and younger travelers for years and declined dramatically following the pandemic. Meanwhile, both trip lengths and driving rates have grown. We find, as well, that older adults are driving later in life over time, and non-driving adults are making fewer trips and traveling fewer miles than those who remain behind the wheel. We also find that the odds of giving up driving because of a medical condition or disability have declined significantly since 2009, controlling for an array of factors associated with travel. The practical and policy implications of reduced trip-making, longer trips, higher rates of driving, and declining driver cessation among older travelers are many, and warrant more attention from transportation analysts and policymakers in the years ahead.
Introduction
Rising life expectancy and falling birth rates across much of the globe point to a substantial absolute and relative expansion of older adults in the years ahead. The U.S. population is older today than ever. Between 1920 and 2020, the population aged 65+ years in the U.S. grew almost five times faster than the population as a whole. Between 2000 and 2010, the 65+ years population grew by 15.1% to 40.3 million people, and between 2010 and 2020, it increased by 16.8% to 55.8 million people ( 1 ).
Older adults, which we define as people aged 60+ years in this research, often exhibit distinct travel patterns, driven by varying employment statuses, access needs, travel preferences, and physical/health constraints, among other factors. Older travelers can face numerous challenges navigating the changes in daily travel that come with aging, including automobile dependence, limited driving abilities, and an age-based technological divide for activities like telehealth, online shopping, and ride-hailing. Research shows that planners and policymakers are often not prepared to support the mobility needs of the growing numbers of older adults. Current proposals to address the varied needs of older travelers tend to focus narrowly on fixed-route public transit, paratransit, and other on-demand transportation services ( 2 ).
Unfortunately, planning for the needs of an aging population has attracted only modest interest from researchers. Just over two percent of all papers published between 1990 and 2021 in the Journal of Planning Literature, the Journal of the American Planning Association, and the Journal of Planning Education and Research addressed aging ( 3 ). This pre-COVID-19-pandemic pattern of tending to ignore older adults’ travel persisted during and following the pandemic. Although older adults are much more likely to become seriously ill or die from a COVID-19 infection and had their travel behavior more affected during the pandemic as a result of efforts to avoid infection, they may be less familiar with and less likely to adopt new technologies that enable them virtual access to needed destinations ( 4 ).
While the pandemic had a profound effect on the travel behavior of all age groups, tech-savvy people in younger age cohorts tended to be better able to replace their trips with telecommuting, online shopping, streaming and gaming, and socializing through social media platforms.
Given this, our research examines how travel by older adults has evolved in recent years and whether the COVID-19 pandemic arrested or accelerated the trends described above. Specifically, we ask: 1) How are travel behaviors of older adults similar to or different from those in younger cohorts since 2000? and 2) What do these patterns and trends imply for transportation policy in the years ahead? We address these questions by analyzing the travel behavior of older adults vis-a-vis younger adults in 2001, 2009 (amidst the Great Recession), 2017, and 2022 (early post-pandemic) iterations of the U.S. National Household Travel Survey.
Previous Research
Travel Needs, Challenges, and Behaviors of Older Adults
The travel needs, challenges, and behaviors of older adults are influenced by myriad factors, including health, safety, accessibility, financial constraints, and technology use. Physical and health constraints, such as mobility impairments, reduced physical strength, slower reaction times, and chronic health conditions, can limit older travelers’ options. Sensory impairments, including vision or hearing loss, can make navigating transportation systems more difficult. Driving cessation can limit or eliminate access to essential destinations, particularly for those living in suburban and rural areas where walking to most destinations is impractical and public transit service is sparse. Safety concerns, such as fear of crashes, falls, and crime, can deter older adults from traveling, especially via public transportation or walking ( 5 ). While specialized transportation services for older or disabled travelers are available in most places, the demand for these services often far exceeds supply, making them, effectively, an unreliable option for many travelers. Financial constraints caused by fixed incomes or limited assets can restrict ownership of private vehicles and use of taxis or ride-hailing services; the latter of which can also be impeded by unfamiliarity or discomfort with information and communications technologies (ICT), such as mobile phones or internet services, which are needed for ride-hail booking and navigation ( 6 ). The living arrangements of older adults and their residential locations also affect travel. Research points to both barriers and reluctance by older adults to 1) downsize their housing as their space needs change, or 2) move from suburbs and rural areas where they have spent much of their lives to more pedestrian- and transit-friendly urban areas ( 7 ). Regardless, communities viewed by many planners as most favorable to and accommodating of older travelers’ needs tend to be in more densely populated urban areas. Research has shown that seniors living in high-density residential areas near high-quality transit service with many mixed-use (e.g., commercial and residential) developments have a higher chance of both staying employed and voluntarily foregoing driving compared with older travelers living in newer suburban developments ( 8 ). Further, while it appears that drivers may be holding on to licenses longer over time, many older travelers voluntarily limit their driving as they age, such as by avoiding driving in inclement weather, at night, or to unfamiliar destinations. Older urban dwellers are also more likely to limit their driving than suburban drivers, presumably because they have more mobility options ( 9 ).
Unfortunately, large numbers of older residents in the U.S. live in areas lacking proximity to essential services and amenities. In 2019, 22 percent of those aged 65+ years lived in rural areas, compared with just 15 percent of the total population. People aged 65+ years also comprised 18 percent of rural populations but only 14 percent of urban populations. Studies find significant challenges to travelers aged 65+ years living in rural areas, including their access to quality in-home and community-based healthcare services. Compared with equivalently sized urban facilities, rural healthcare facilities more often lack appropriate staffing and are less likely to compensate with telehealth services because of internet connectivity challenges in some rural areas. Informal caregivers, another solution to the dearth of rural elder care coverage, often cite transportation challenges as a barrier to supporting vulnerable older community members ( 10 ). When older adults live in more automobile-oriented neighborhoods, some may compensate for transportation challenges by continuing to drive later in life. Not surprisingly in the largely auto-oriented U.S., studies have shown that licensure among older adults positively correlates with their mobility. Older adults with medical conditions or those living in low-income families also experience the most notable declines in everyday mobility after they abandon the wheel ( 11 ).
How and whether their travel needs are met affect the quality of life of older adults. For instance, research finds that older travelers who can drive alone or reach destinations less than 20 kilometers away from their residence are significantly more satisfied with their everyday mobility. Conversely, the primary indicators of dissatisfaction are encountering difficulties while driving or walking and fear of falling ( 12 ). Older travelers who cannot drive make significantly fewer trips than their driving counterparts. Though non-driving older adults sometimes ask family and friends for rides, many do not have anyone to call on when in need. One study finds that about a third of their older, non-driving participants reported not having someone who could regularly drive them to necessary destinations ( 13 ).
There is relatively little research on how the travel patterns of older adults have changed over time as succeeding generations transition into older cohorts. Schouten et al. examined longitudinal health and retirement data and found evidence that younger cohorts of older travelers are less likely to limit or stop driving than older travelers in previous generations ( 14 ). Another study analyzing 2001 and 2017 NHTS data found that older drivers with medical conditions in 2017 reported a lower likelihood of wanting to stop driving, limit their travel, or request rides from others than similarly situated drivers in 2001. However, these older drivers were more likely to take a bus than drive a car in 2017 compared with 2001, regardless of medical condition ( 15 ).
The COVID-19 Pandemic and Travel
While the COVID-19 pandemic caused dramatic shifts in activity participation and travel behavior for everyone, many of the notable trends emerging post-pandemic, including declining personal travel and longer trip distances, had come about before the sudden expansion of virtual activities in response to the 2020 public health crisis. Morris et al. analyzed American Time Use Survey data from 2003 to 2019 and found that daily time spent traveling and out-of-home activities dropped by around 0.3 and 2.4 minutes annually, respectively, resulting in a difference of five fewer daily minutes spent traveling and 38 fewer daily minutes spent out of home over that 16-year pre-pandemic period. All else equal, older travelers were even more likely to spend less time outside of home and on travel to and from out-of-home activities ( 16 ).
During the pandemic, the trend away from out-of-home activities and personal travel accelerated dramatically—though the vast majority of the research to date does not explicitly consider older travelers. Coming out of the pandemic, people spent substantially more time on in-home activities and less time on out-of-home activities. People are working, streaming, gaming, and using ICT at home more than ever, which has transformed daily travel. People are also working later in life more than ever, which may be enabled, in part, by the substantial shift toward working from home ( 17 ). While only 4.7 percent of people who worked did so from home pre-pandemic, a whopping 32.2 percent did so in the second year of the pandemic. Even today, working remotely, at least part-time, remains significantly elevated ( 18 ).
Research on working from home has generally found that, all else equal, older workers are more likely than younger workers to work remotely. This is important for this study because longer trip distances when people do travel is another travel behavior trend that appears to be persisting post-pandemic. A study in Texas found that recent increases in home-based teleworking are associated with longer one-way commute distances of at least 1.7 miles ( 19 ). Similarly, data on Silicon Valley in the San Francisco Bay Area also found a shift toward longer travel distances and elevated driving because of home relocations during the pandemic ( 20 ). So, as teleworking becomes more widespread for many workers, including older workers, this may mean longer commutes and greater car dependency when they do need to go into the workplace. Even while older adults are less likely to be in the workforce because of health conditions or retirement, substantial numbers of older adults still report to work.
These changes may extend beyond work trips. Shopping trips, for instance, appear to be increasingly replaced by e-commerce. While the rate of replacement of this behavior change has fluctuated throughout the pandemic, a negative correlation between in-person shopping and online shopping frequency remains, despite a drop from the initial peak at the height of COVID-19. For example, one post-pandemic study found that online shopping reduces the likelihood of in-person shopping by 20.7 percent ( 21 ). Despite lower frequencies of online shopping, older travelers are the fastest-growing group of online shoppers, which could result in more drastic shifts in travel behavior for this age demographic than previously anticipated ( 22 ). Additionally, these changes in shopping behaviors may manifest differently across geographic regions. Online shopping could facilitate a larger decline in trips for older shoppers in urban areas than in rural areas, as the latter likely drive for many more trips than the former. Evaluations of ICT use by older adults generally support this theory. On the other hand, research suggests that older rural travelers are more likely to use ICT to replace in-person social and recreational trips than their metropolitan counterparts ( 23 ).
Beyond changes in trip-making, some scholars have reported a surge in car ownership emerging from the pandemic. A Boston-based study found that residential location changes further away from the central urban core during the pandemic resulted in changes in car ownership and more frequent car use in the fall of 2021 ( 24 ). A significant share of older adults are likely to retire or move into areas with lower-quality transit offerings or areas conducive to driving ( 25 , 26 ).
In sum, research on pandemic and post-pandemic personal travel often does not separately consider older travelers, with a few notable exceptions cited here. Given this overview of previous research on the travel behavior patterns and trends of older adults and on post-pandemic travel behavior broadly, we turn now to the data and methods we use to examine the travel behavior trends of older travelers vis-a-vis middle-aged and young travelers in the U.S. since 2001 broadly, and coming out of the pandemic in particular.
Data and Methodology
For this research, we analyzed the National Household Travel Survey (NHTS), which is conducted periodically by the U.S. Federal Highway Administration (FHWA). Since 1969, the FHWA has conducted nine rounds of data collection every six years or so, consisting of outreach to a representative set of households about all the trips taken by all household members (other than very young children in most years) on a designated survey day. The research summarized in this paper focuses on the travel behavior patterns and trends of older adults aged 60+ years over the first two-plus decades of the 21st century by analyzing data from the 2001, 2009, 2017, and 2022 iterations of the NHTS, with a particular focus on the early post-pandemic travel patterns revealed in the 2022 data.
The variables of interest for this study include average daily number of trips, daily person-miles of travel (PMT), average trip length, driver and driver cessation status, changes in ridesharing, travel limitations because of a medical condition or disability, and age. The age cohorts we establish for this study are 5–14, 15–29, 30–59, 60–69, 70–79, and 80+ years; we base this on how existing travel behavior literature generally segments people by age, controlling for appropriate sample sizes for analysis. Since the NHTS for years 2009, 2017, and 2022 did not collect information for youths aged <5 years, we leave out all respondents aged <5 years in the 2001 data for consistency with subsequent rounds of data collection. Moreover, travelers aged <5 years generally lack autonomy over how and when they travel, in contrast with the other age groups considered. Age cohorts over 59 years are classified as older travelers, aged 30–59 years are classified as middle-aged travelers, and aged 5–29 years are classified as young travelers. We occasionally split younger travelers into groups of 5–14 and 15–29 years to account for age-based factors, such as age minimums for driver licensing.
We report on weighted data to account for potential sampling bias and to present population-level estimates in our descriptive figures, but we use unweighted data to estimate a binary logistic regression model on the factors associated with giving up a driver’s license because of a medical condition or disability. We intentionally omit people with undefined travel distances across trips and/or who traveled more than 200 miles on the survey day to limit our analysis to examining people’s everyday travel behavior only. All figures have error bars showing the margin of error at the 95% confidence interval. As the 2022 NHTS did not include replicate weights to compare the same error calculation method across NHTS iterations, these confidence intervals do not use replicate weights, so the standard errors for the figures displaying trip-level behavior with regard to trip miles and number of trips may be slightly larger than indicated here.
While NHTS data over time allow us to analyze the travel behavior trends of people in various age cohorts, there are some limitations of the data. The sample size, in particular, has not remained consistent over the years. The 2022 NHTS has a much smaller sample size than previous survey iterations. The 2022 NHTS reports on the travel of 16,996 individuals, compared with 160,758 for 2001, 308,901 for 2009, and 264,234 for 2017. The FHWA indicated that the smaller sample is because of new efforts to conduct more frequent data collection for the NHTS by narrowing the window between cycles from 5–8 years to every 2 years for more regular updates ( 27 ).
The FHWA has issued a compatibility report about the evolution of survey methods in the 2022 NHTS. While we do not believe this directly affects our results, the report cautions that the 2022 data lack representation of older adults housed in institutional facilities outside of individual households, such as nursing homes and long-term care facilities, because of the sample methodology of the NHTS. Additionally, the 2022 NHTS has a different weighting scheme than previous NHTS iterations to correct for those in group homes. Thus, our study does not equivalently represent the experience of older adults in group homes who may face more travel constraints than their counterparts in the types of households surveyed in the NHTS ( 27 ).
Further, the relatively small sample size for 2022 generally precludes cross-tabulating or interacting age with other demographic variables of interest, such as gender and race/ethnicity. Therefore, we only included a limited number of variables in our logistic regression analysis and sought to be cautious in interpreting our results, particularly with respect to the modest 2022 survey sample size, and we encourage readers to do the same.
Results
Both the number and share of older adults have grown significantly since the early 2000s. The NHTS estimate of adults aged 60+ years grew a remarkable 73 percent from 43,920,303 in 2001 to 76,077,556 in 2022. Adults aged 60+ years comprised just 17 percent of the U.S. population in 2001, but 25 percent by 2022. By comparison, children and young adults aged 5–29 years comprised 37 percent of the population in 2001, but this share dropped to 33 percent in 2022. The U.S., in other words, is “graying.”
We turn first to an examination of overall travel trends among older adults in the U.S. vis-a-vis younger cohorts of travelers between 2001 and 2022, followed by a more focused examination of driving and driving cessation trends among older adults over the same period.
Trends in Older Travelers and their Travel Patterns since 2001
Figure 1 shows four notable trends in daily person trips per capita by age group for each of the four survey years. First, it shows a remarkable decline in trip-making in every age group for nearly every survey year. Second, it shows a truly dramatic decline in trip-making coming out of the COVID-19 pandemic for every age group. All told, trip-making for travelers in their 60s fell by 38.3 percent between 2001 and 2022; the decline was 36.7 percent for those in their 70s, and 38.4 percent for travelers aged 80+ years. Third, the figure shows that, while older adults do tend to make fewer trips than middle-aged adults, the differences between middle-aged and older adult trip-making are relatively, and perhaps surprisingly, modest. And fourth, while trip-making by older adults declines with age, as one would expect, these declines since the millennium are relatively modest as well.
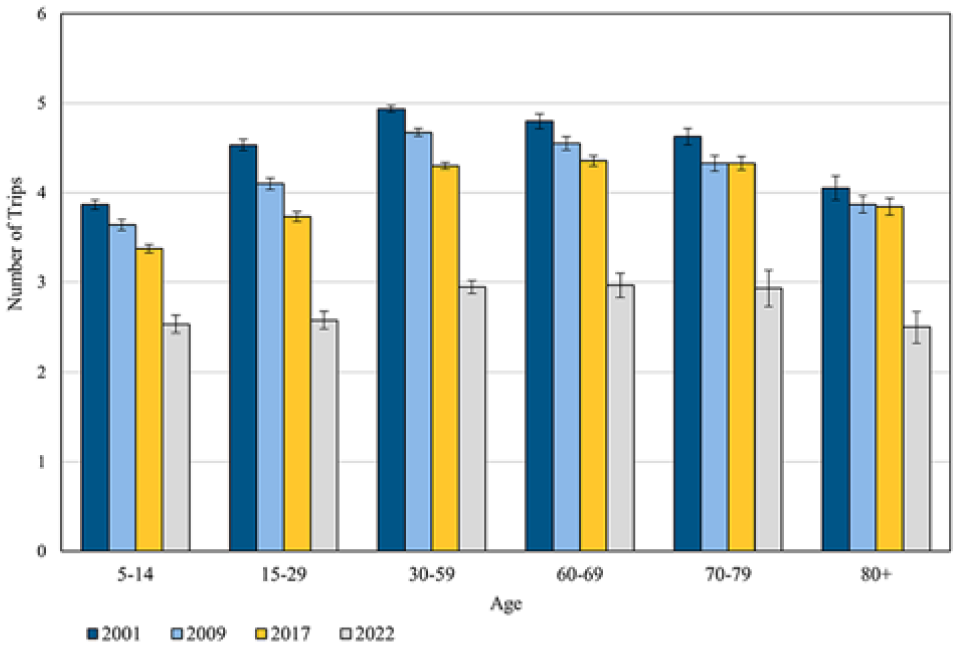
Average daily person trips per capita by age group in the U.S.—2001 to 2022.
Figure 2 shows the trends in daily person-miles of travel (PMT) over the same periods for the same age groups. There is a clear downward trend in daily PMT per capita for every survey year and every age group between 5 and 69 years, albeit the downward slope in PMT is not as steep as the decline in trips, which suggests that person-trips, on average, have got longer over time even as they have become fewer. The PMT trends for travelers aged 70 years and up, however, are roughly stable across the 2001, 2009, and 2017 survey years, which bucks the downward PMT trends we see in all the younger age cohorts. Following the pandemic, however, PMT appears to be notably down across all age cohorts, including among those aged 60+ years—though we cannot say this with confidence for the youngest (<15 years) and oldest (80+ years) age groups. Travelers aged 60+ years (in all three older age groups) traveled 28.2 miles per day on average before the pandemic in 2017, but this figure dropped by 23 percent to 21.8 miles per day in 2022. Among older travelers, the steepest PMT decline between 2017 and 2022 was among those aged 70–79 years, whose daily PMT fell by 7.3 miles.
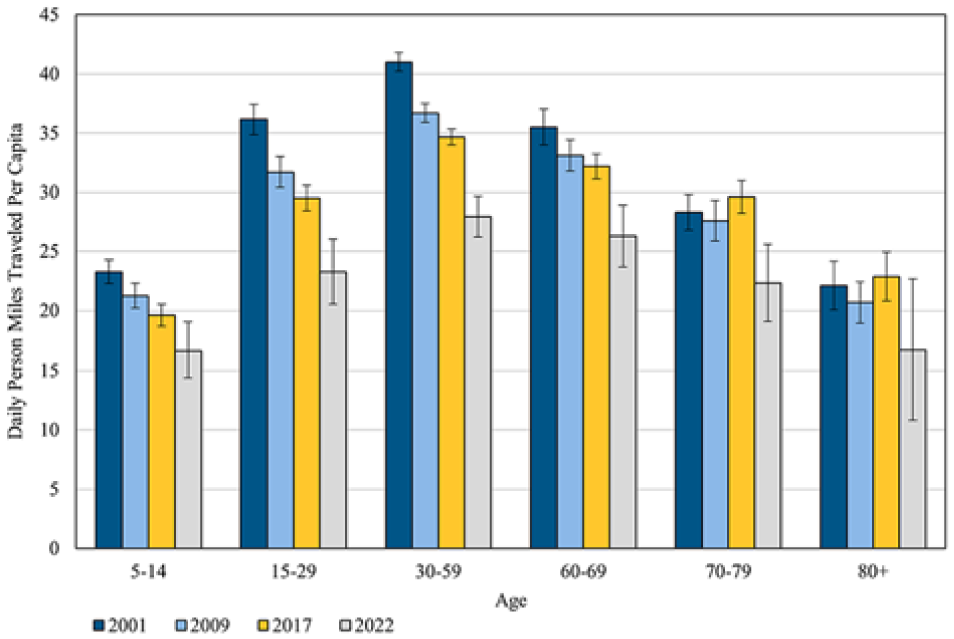
Average daily person-miles of travel per capita by age group in the U.S.—2001 to 2022.
Given that trip-making declined more steeply than PMT between 2001 and 2022, Figure 3 shows that, indeed, trip distances have been getting longer for all age cohorts across most (though not all) of the survey years. Between 2001 and 2017, average trip distances for all but the two oldest cohorts were relatively flat. By contrast, the average trip distances for travelers aged 70+ years appear to increase each survey year, though we cannot say this with confidence, given the overlapping error bars. What we can say with confidence is that average trip distances in 2022 were up significantly for middle-aged travelers and those in their 60s, though they appear to be up for every other age cohort as well. Finally, Figure 4 shows that the pattern of older travelers taking shorter trips than younger and middle-aged travelers has been waning over time. In 2001, travelers aged 60+ years took trips that were 1.2 miles shorter, on average; by 2022, that gap had narrowed to a half mile.
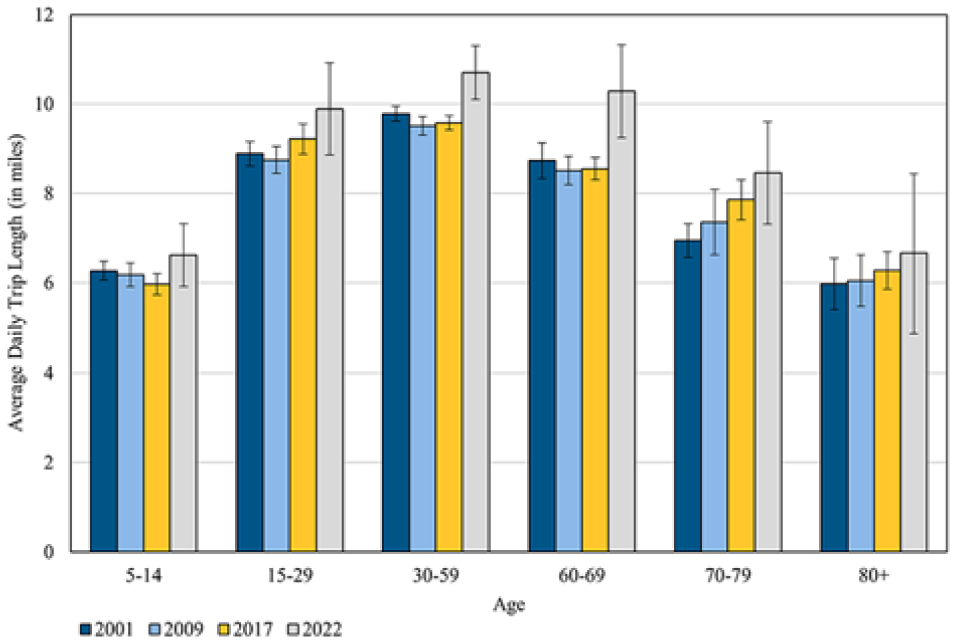
Average daily person trip length by age group in the U.S.—2001 to 2022.
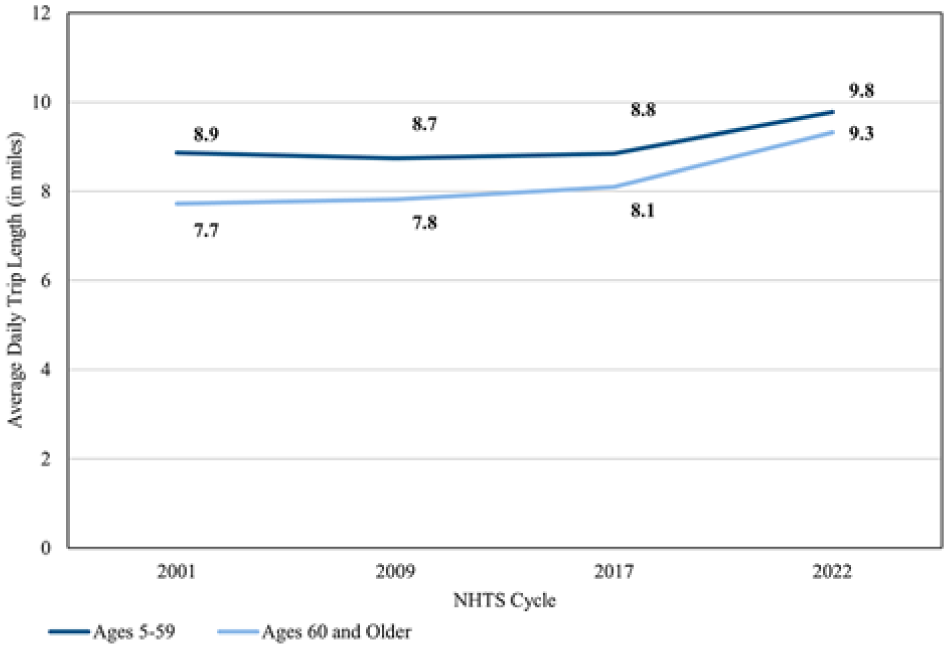
Trends in average trip length for younger/middle-aged and older travelers over time.
Figure 5 shows trip-making rates across various types of travelers aged 60+ years. First, we note that since most travelers aged 60+ years reported that they were drivers in all four survey years, the number of daily trips for all those aged 60+ years and for drivers aged 60+ years is quite similar. Second, data from the three pre-pandemic survey years can explain one potential motivation for why many older drivers appear to continue driving for as long as possible: travelers aged 60+ years who no longer drive average more than one trip per day less than drivers aged 60+ years. Third, older travelers who no longer drive, request rides from others, or report being limited in their mobility, all appear to make fewer trips than drivers in all years. And fourth, the pandemic appears to have been a great equalizer among those aged 60+ years, though not in a good way: while trip-making was down for older travelers in all circumstances, drivers aged 60+ years cut their trip-making by far the most in 2022, so that the gap among the different types of older travelers are at a more similar, and much lower, level post-pandemic.
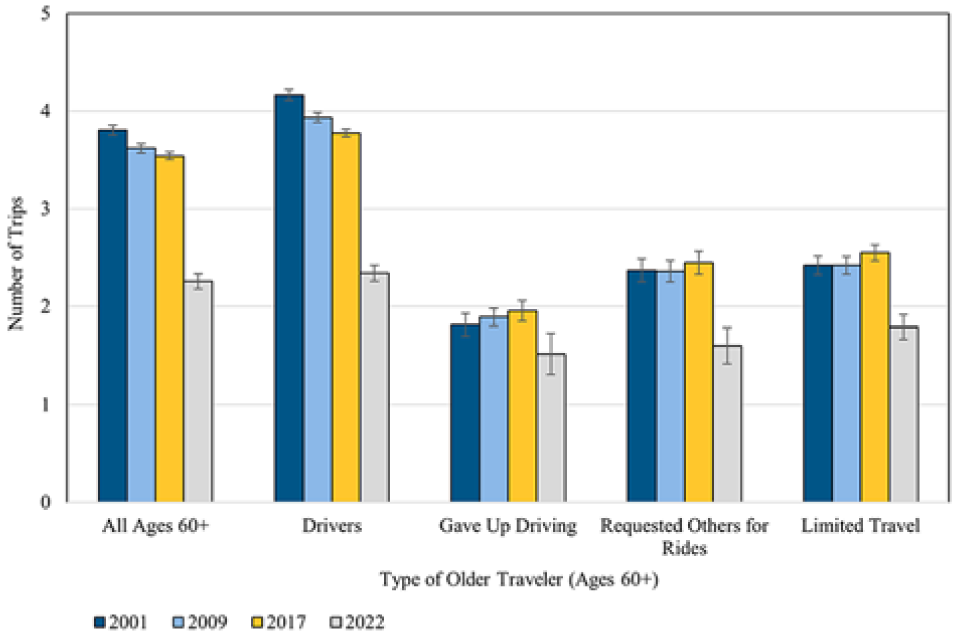
Average daily person trips by older adult traveler type in the U.S.—2001 to 2022.
Finally, Figure 6 shows that, while trip-making is down, average trip distances are up over time for all travelers aged 60+ years and for drivers aged 60+ years, particularly following the pandemic. Notably, this pattern of increasing trip lengths over time appears to be exactly reversed for those who gave up driving, requested rides from others, or limited their travel because of a medical condition or disability. With but one minor exception, the average trip length for each of the three types of limited travelers appeared to contract for each of the four survey years (though the high margin of error for those unable to drive in our sample render these data suggestive and not conclusive). Over 2017 and 2022, older drivers had an average trip distance of 8.9 miles, whereas the average trip distance across the other three groups for 2017 and 2022 was around 5.8 miles.
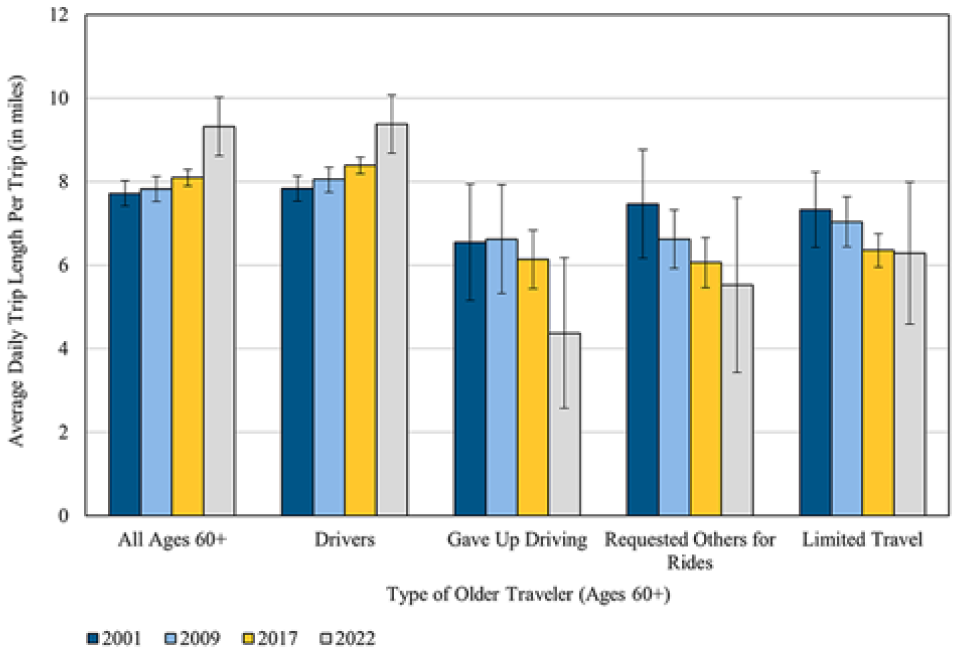
Average daily trip length by older adult traveler type in the U.S.—2001 to 2022.
Trends in Older Drivers and Driving since 2001
Given the pervasiveness of private vehicle travel in the U.S., when younger travelers begin driving and when older travelers cease driving significantly influence travel behavior. The data indicate that both of these critical travel milestones have tended to shift later in life over time. In 2001, 90 percent of travelers aged 15–59 years reported that they were drivers; this figure fell slightly to 87 percent in 2022. By contrast, the percentage of travelers aged 60+ years who were drivers jumped from 82 percent to 90 percent between 2001 and 2022. Figure 7 shows that, overall, the percentage of people aged 60+ years self-identifying as drivers appears to have grown over the last few iterations of the NHTS, especially for those in their 70s and 80s, while the opposite is true for travelers aged 15–29 years.
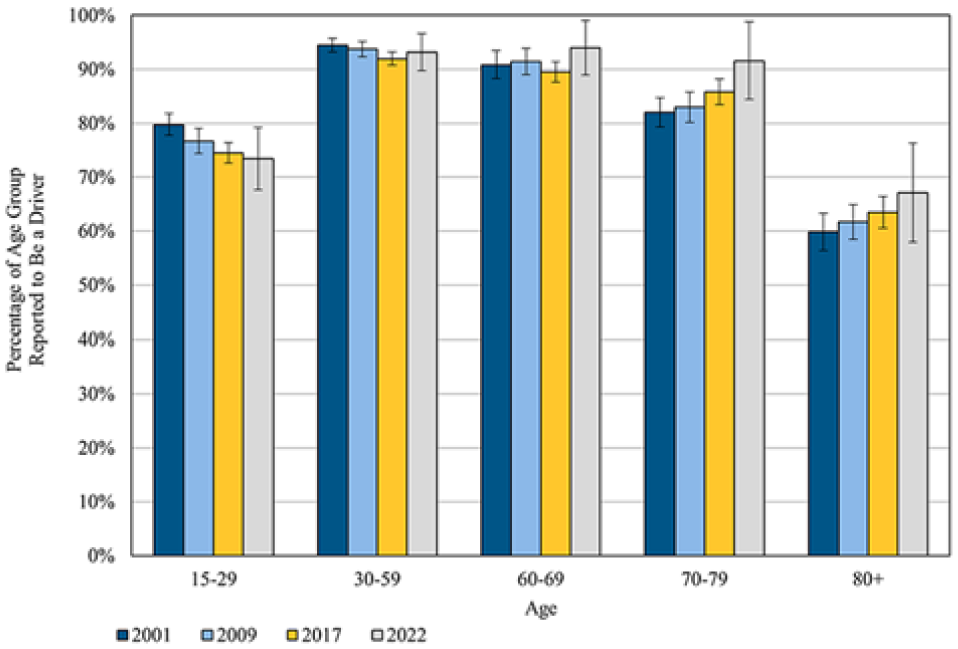
Drivers by age group in the U.S.—2001 to 2022.
Figure 8 shows similar trends in the share of those requesting a ride from others because of a medical condition or disability. For each survey year, the frequency with which rides were requested from others increased with age, though the slopes of those requests across age cohorts varied substantially across survey years. From 2009 to 2017 and from 2017 to 2022, the frequency of ride requests because of medical condition or disability fell for all age groups, except for those aged 80+ years. For older travelers, this likely reflects, at least in part, decreasing driving cessation rates among older drivers over time. Figure 9 shows that ride requests among travelers aged 60+ years declined from 12.7 percent in 2009 to just 4.9 percent in 2022. Even among people in their 80s, the share of those who requested rides dropped from 32.2 percent in 2017 to 21.8 percent in 2022.
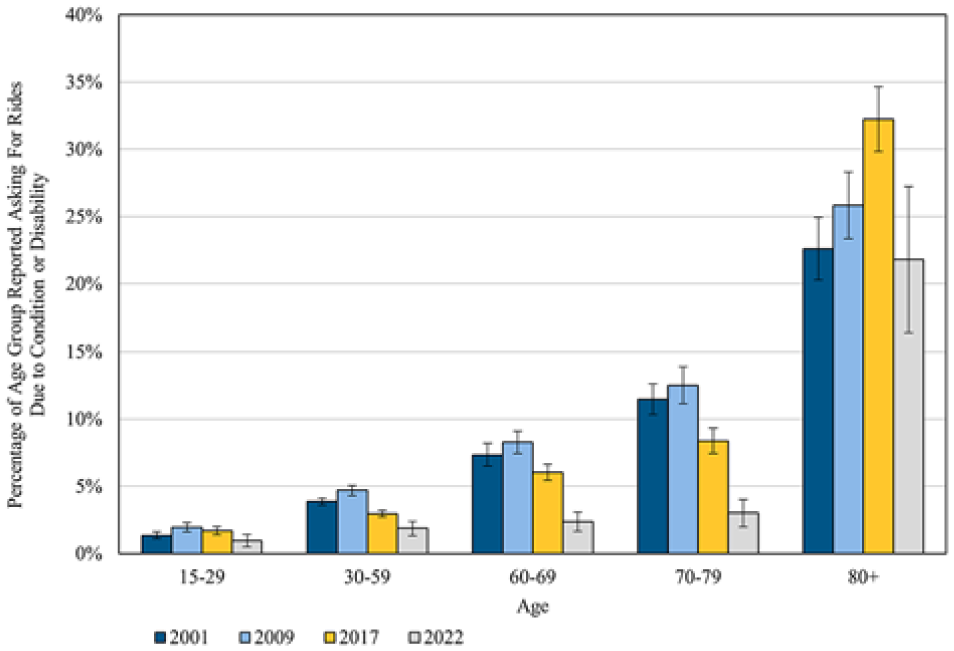
Requesting rides from others by age group in the U.S.—2001 to 2022.
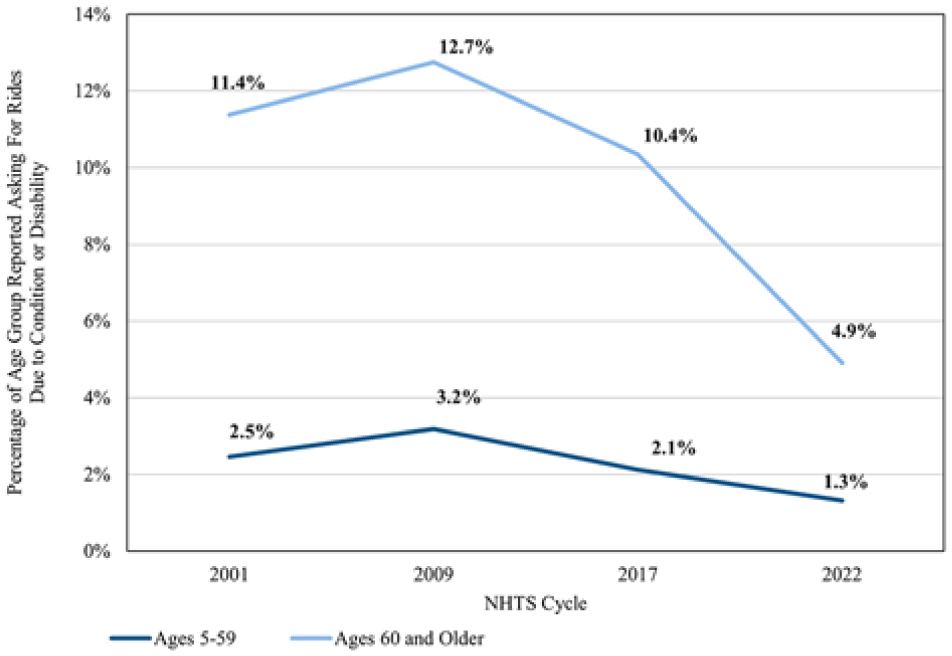
Trends in requesting others for a ride for younger/middle-aged and older travelers over time.
Figures 10 and 11 display the share of respondents who reported limiting their travel because of a medical condition or disability by age group. For travelers aged 15–29, 30–59, 60–69, and 70–79 years, the share of those reporting such travel limitations declined from 2009 to 2017, and again from 2017 to 2022. It appears that, by 2022, older travelers, who in years past were limiting travel in their 60s or 70s, were now much more likely to do so in their 80s or older. Figure 11 also shows that, while 18.7 percent of travelers aged 60+ years reported limiting their travel because of a medical condition or disability in 2009, only 11.6 percent did so in 2022.
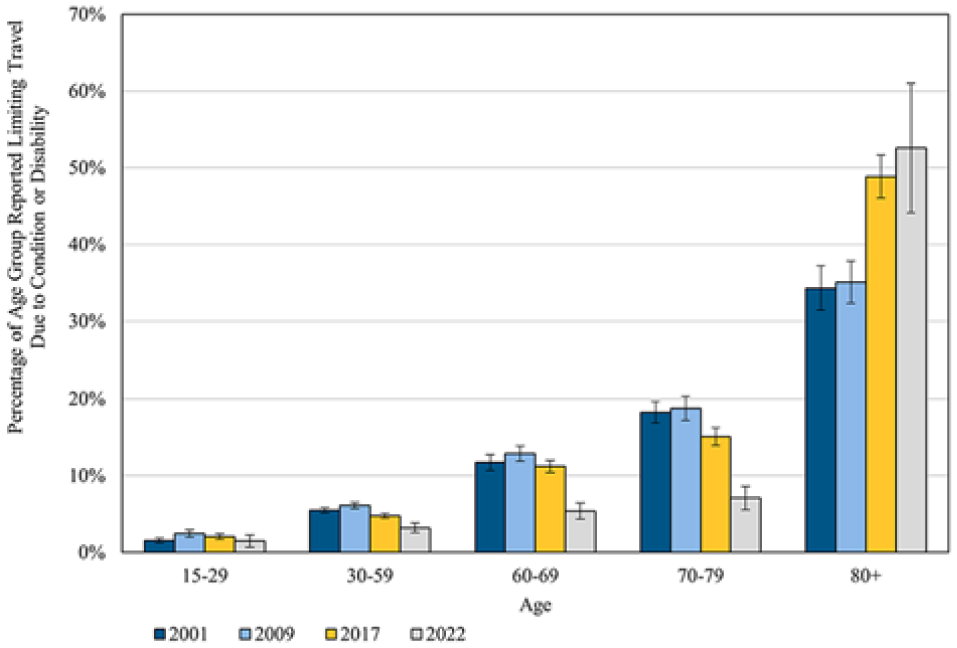
Limiting travel by age group in the U.S.—2001 to 2022.
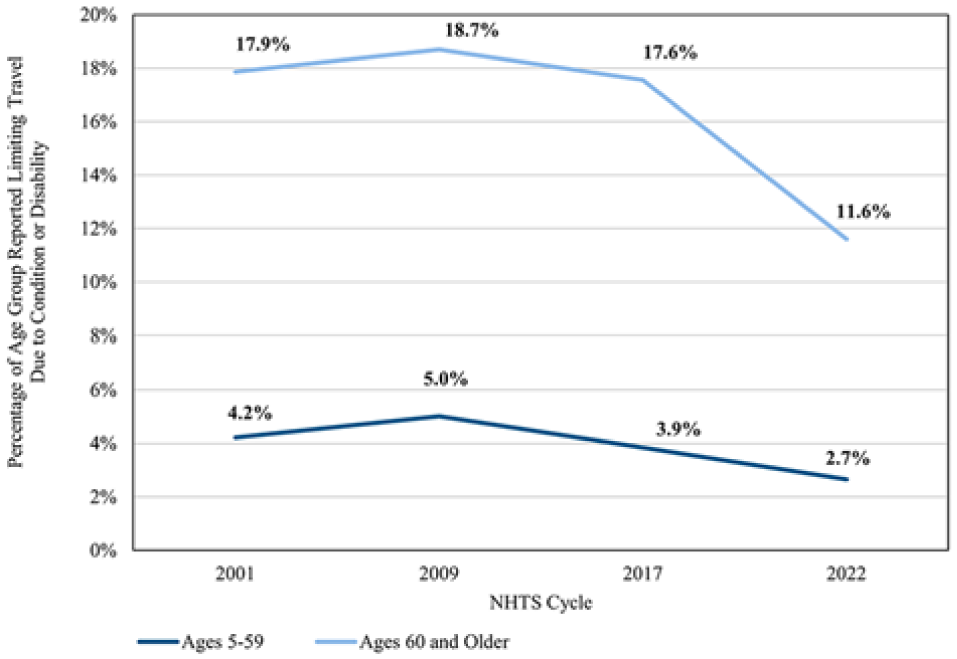
Trends in limiting travel for younger/middle-aged and older travelers over time.
Figure 12 shows that driver cessation because of a medical condition or disability, while not common, occurs in all age cohorts, though the incidence increases substantially with age. Note that the relative frequency of driver cessation for those aged 15–79 years shifts across the four survey years in very similar patterns over time. The rates of giving up driving because of a medical condition or disability increased between 2001 and 2009 (during the Great Recession); they decreased between 2009 and 2017; and then decreased markedly between 2017 and 2022. In particular, the rates of driving cessation fell significantly for adults in their 60s and 70s following the pandemic. In 2009, 5.3 percent of all travelers aged 60–79 years reported giving up driving because of a medical condition or disability, but by 2022, this figure had dropped to 1.7 percent. By contrast, travelers aged 80+ years increased rates of driving cessation across most of the four survey years, which suggests that lower rates of driving cessation over time among drivers in their 60s and 70s have resulted in higher rates of driving cessation by the many more older drivers in their 80s over time. We examine this question further below.
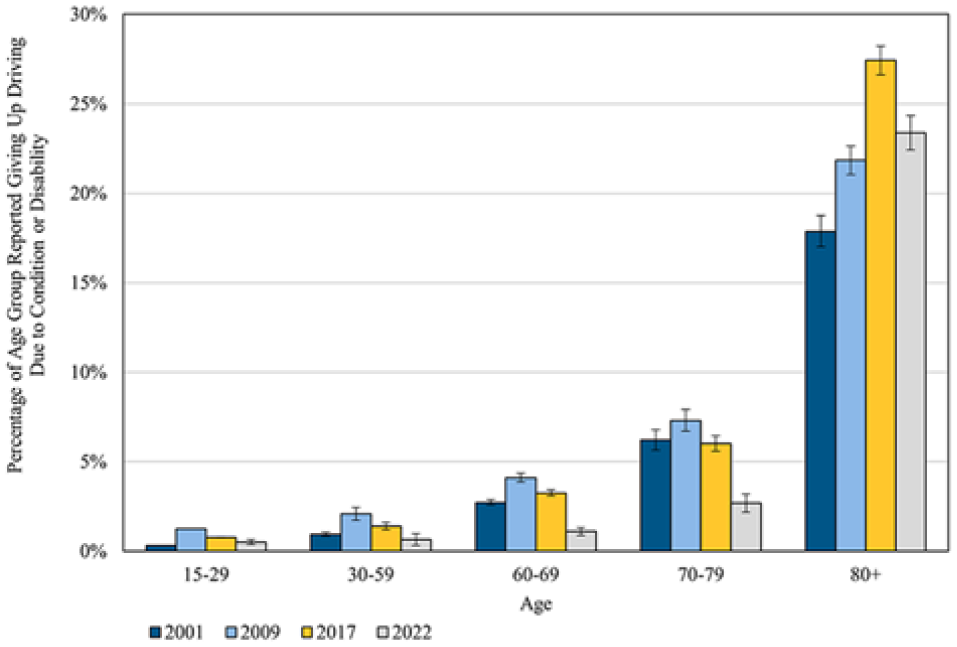
Driver cessation rates by age group in the U.S.—2001 to 2022.
Figure 13 shows the weighted cumulative percentages of those at each age in our weighted sample who reported having given up driving because of a medical condition in each of the four NHTS iterations. In 2009, younger respondents were more likely to have given up driving than in the other survey years, perhaps related to much higher levels of unemployment during the Great Recession, as being employed is likely a strong motivator to continue driving for those with medical conditions and disabilities that make driving difficult. In the economic boom times of 2001 and 2017, younger travelers were similarly less likely to report having given up driving than in 2009. By contrast, travelers aged from 15 to 79 years were far less likely to report having given up driving in 2022 compared with previous years. To put it in another way, the age by which 30 percent of the sample reported having given up driving was 52 years in 2001, 46 years in 2009, 56 years in 2017, and 59 years in 2022. Similarly, the age by which 70 percent of the sample had ceased driving was 78 years in 2001, 73 years in 2009, 77 years in 2017, and 83 years in 2022.
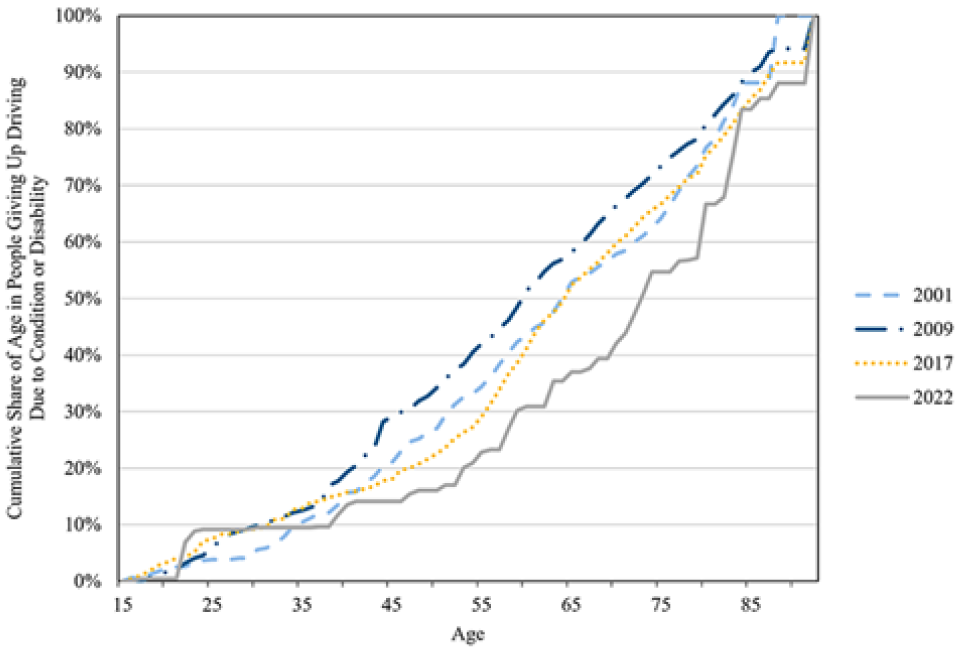
Trends in giving up driving for younger/middle-aged and older travelers over time.
To better understand what factors may help to explain these older driving cessation ages over time, we estimated a binary logistic regression model of our unweighted data with an array of demographic, household, and locational variables to examine their associations with giving up a driver’s license because of a medical condition or disability. A table with the full model results is available in the Appendix.
Figure 14 displays a forest plot of independent variables. All records for a particular binary attribute are coded as dummy variables: “1” if the record corresponds to that attribute (e.g., if an individual is employed, we code them as “1” for “employed,” and we categorize “sex” as “0” for female and “1” for male, and so on). We combine some of the race and ethnicity variables, which vary across four NHTS iterations, to create a single, consistent race-ethnicity variable across all years. The log odds for each independent variable in the model are displayed in Figure 14; they indicate whether the variable has a positive or negative association with giving up driving because of a medical condition or disability.
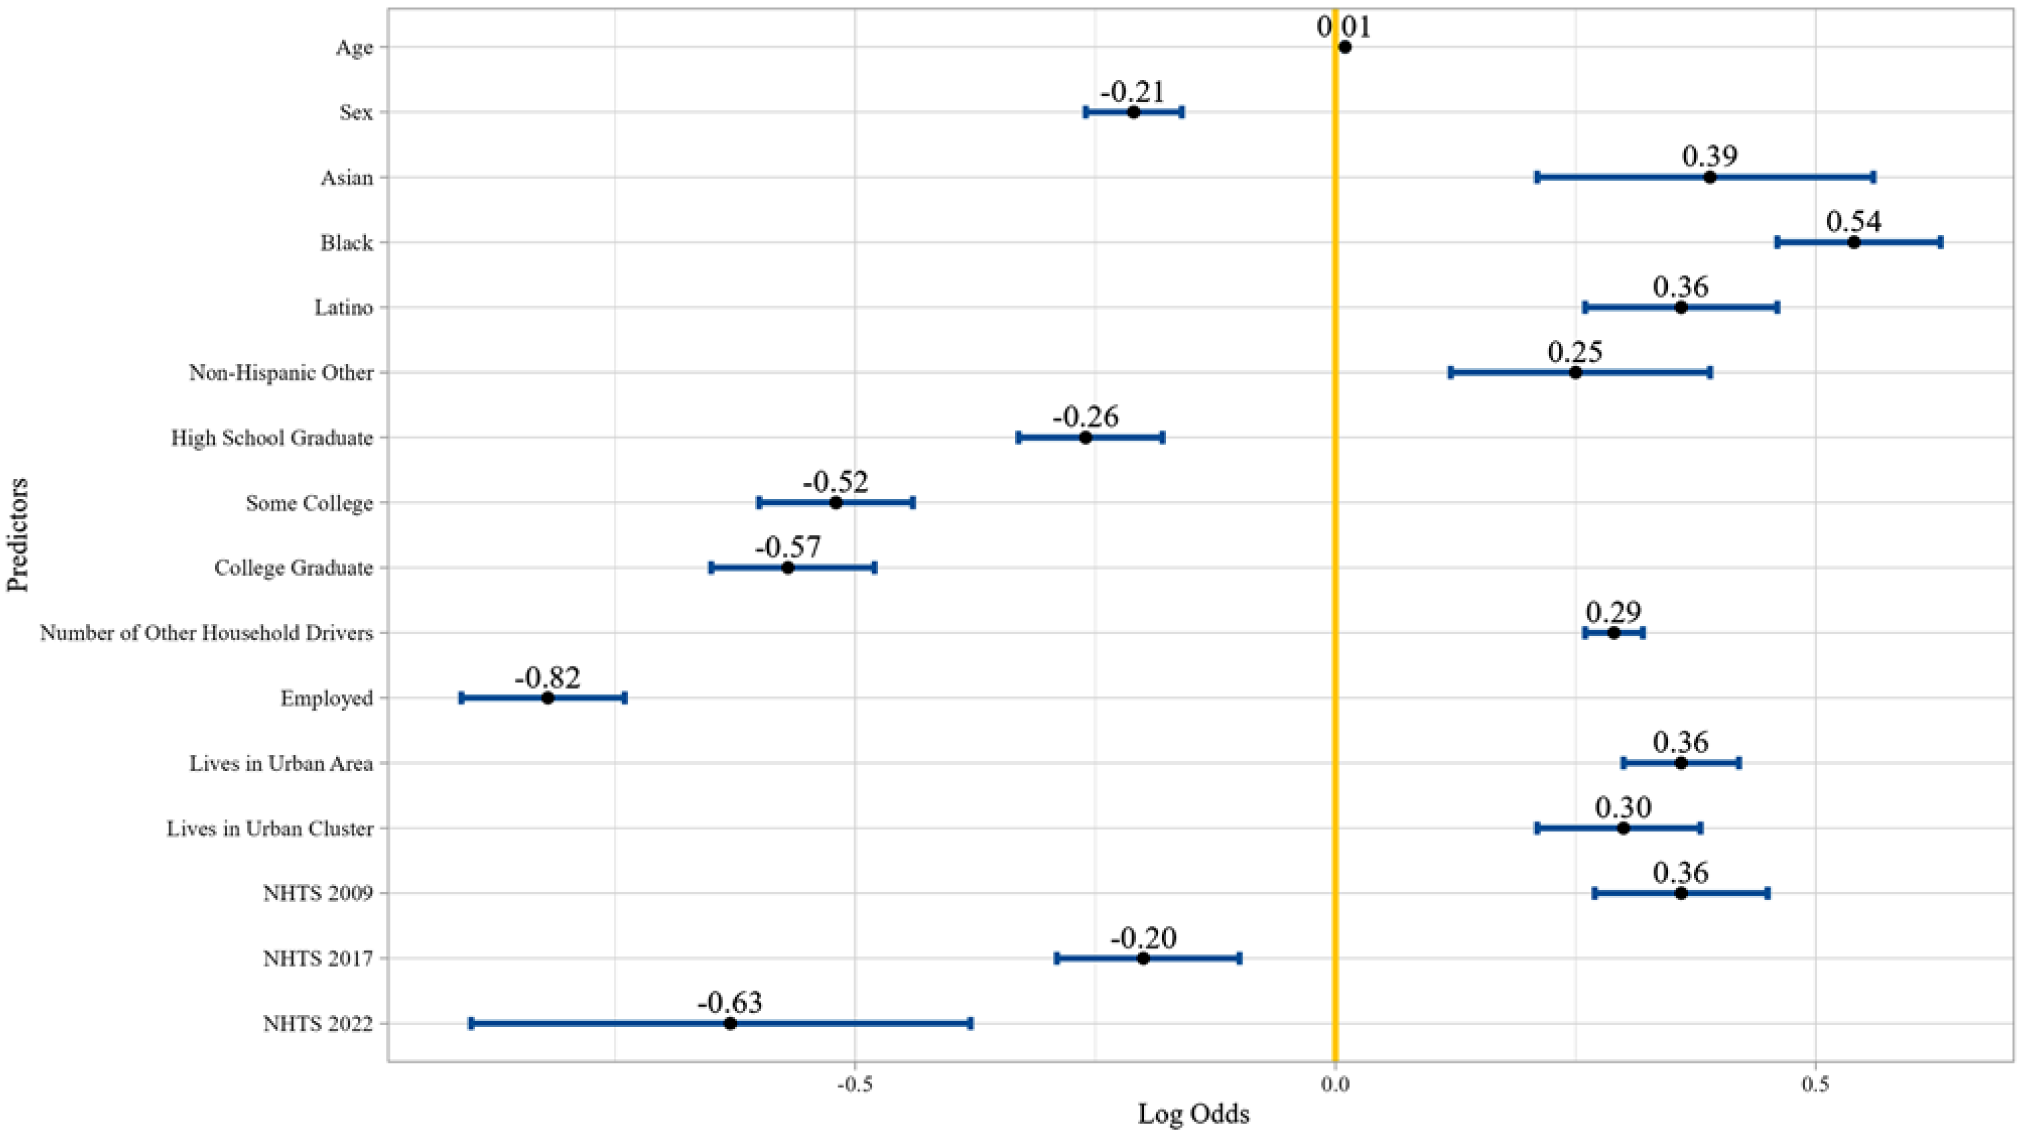
Forest plot of model results of predictors for giving up driving because of a medical condition or disability.
The log odds for Asian, Black, Latino, and Non-Hispanic Other respondents are all relative to people identifying as Non-Hispanic White. The log odds for high school graduates, some college, and college graduates are all relative to those who did not graduate from high school. The log odds for those living in an urban area or an urban cluster are both relative to those living outside of an urban area. The log odds for NHTS years 2009, 2017, and 2022 are all relative to respondents in the 2001 NHTS. Again, the full model results are in the digital appendix to this article.
First, and as expected, the change in log odds of giving up driving is +0.01 for every additional year of age, all else equal. Second, and also as expected, respondents in 2009 were more likely to have given up driving relative to 2001 (perhaps due to the Great Recession), while respondents in both 2017 and 2022 were less likely to have given up driving relative to 2001, all else equal. These two findings in concert suggest that the observed shift in driving cessation to later in life in recent years is not simply because of the aging of the U.S. population over time.
Figure 14 also shows that, all else equal, being male, employed, or having more formal education decreases the odds of having given up driving because of a medical condition or disability. Conversely, being a person of color, sharing a household with other drivers, and living in a household located in an urban area are all associated with increased odds of having given up driving because of a medical condition or disability. These relationships all operate intuitively and as expected. More education is highly correlated with income, which is in turn highly correlated with life expectancy. There are also consistent health disparities in the U.S. whereby people of color, on average, endure worse health outcomes ( 28 , 29 ). Similarly, being employed is correlated with the absence of disabilities that preclude driving. And finally, residing in an urban area and with other licensed drivers are likely to reduce the opportunity cost of giving up driving, thereby easing such a transition for many former drivers ( 8 ).
Discussion and Conclusion
This article is somewhat unique among studies of older travelers in that ( 1 ) it is a repeated cross-sectional analysis of data spanning more than 2 decades and ( 2 ) it explicitly considers post-pandemic travel behavior. This focus on older travelers is important because fully a quarter of the U.S. population was aged 60+ years in 2022, and that share is expected to grow in the years ahead.
We have shown that older travelers in the U.S. are relatively mobile vis-a-vis middle-aged and younger travelers. Daily trip-making for those in their 60s, 70s, and even 80s and older are only modestly below middle-aged travelers and comparable to older teens and young adults. Moreover, differences in average trip lengths between those aged <60 years and 60+ years have contracted gradually over time, making the average trip lengths between these two groups remarkably similar as both shifted toward taking fewer but longer trips. For a younger traveler with access to a car, longer average trip lengths may not pose substantial concerns or barriers to everyday mobility; however, the findings from this analysis, as well in several of the papers discussed in our literature review, have shown that a heavy reliance on driving may be more burdensome for some older travelers who are likely to experience greater driving challenges as they age.
Despite the comparatively high levels of mobility among older travelers, out-of-home trip-making has been falling since at least 2001 for both younger and older age cohorts, and these falling trip rates have accelerated since the pandemic. While trip rates are down, average trip distances are up, which is likely to increase dependence on driving and decrease the relative utility of travel by foot and public transit. Although the trend away from out-of-home travel applies to both younger and older travelers, its effect on older travelers may be more consequential. Not only did trip-making by travelers aged 60+ years decline more sharply since 2017 than for other age groups, but older adults as a group also faced significantly heightened risks of loneliness and social isolation as a result ( 30 ). A Tennessee study addressing social isolation and loneliness among adults aged 62 to 74 years discovered that resource-related barriers to aging-in-place, such as transportation challenges preventing visits to the doctor, were significantly correlated with higher odds of social isolation ( 31 ). Indeed, the shift during the pandemic toward ICT use for healthcare, shopping, social interactions, and so forth, has helped many older adults who are able to use these technologies, but not all older adults can use them. They are also often an inadequate substitute for the many essential in-person activities that require travel.
We have also shown that most older travelers today drive and continue to do so later and later in life over time. The share of older adults who give up their licenses in the 60s and 70s has fallen over time, while the share of drivers who give up their licenses in the 80s or later is going up. Both our descriptive analysis and logistic regression model that controls for a wide array of factors associated with driving show that travelers are increasingly hanging on to their driver’s licenses. Ultimately, the reasons for continuing to drive later in life are myriad ( 14 ). Some of those discussed in the literature include: people are living longer and are physically and cognitively healthy later in life, on average; today’s older adults are more likely to have been driving their entire adult lives compared with previous generations and thus are more likely to treat it as second nature; increasingly common vehicle technologies such as back-up cameras, lane departure warnings, collision avoidance systems, and so on, increasingly support safer driving among inexperienced, tired, and older drivers ( 32 , 33 ). Community and social factors likely influence driving by older adults as well. Our model results show that the absence of household-level chauffeuring decreases the odds that travelers give up driving because of a medical condition or disability. Alternatively, culturally based support systems can increase the mobility of older adults without requiring them to drive. For example, older Latino/a travelers may frequently rely on family or community-based chauffeuring when they are unable to drive ( 34 ).
Aside from, or perhaps because of, the rising number and share of older travelers driving themselves to destinations, we have also shown that more older travelers are relying less on others to drive them places over time. Indeed, the mobility consequences faced by those who depend on others for rides, who gave up driving, or who report that their travel is limited by a medical condition or disability are substantial: they make fewer trips and travel shorter distances, on average, compared with older drivers. Automated vehicles (AVs) may help to alleviate those disparities, as the literature suggests that vehicle automation supports self-determined travel and can enhance safety on the road for drivers and non-drivers alike ( 35 ). Research on older travelers who have been exposed to vehicle automation has found that older drivers’ trust and perceived safety of AVs increase after exposure to a simple simulator. Exposure to an AV shuttle has also shown that older travelers’ perception of the usefulness of the technology to facilitate regular activities increased ( 36 ). However, the benefits of AV-enabled access are almost certain to flow first to more affluent older travelers before trickling down to lower-income older adults.
While living in more densely developed urban environments with many destinations within walking distance and frequent public transit service can help non-driving older adults reach needed destinations, the share of U.S. residents, older and otherwise, who live in auto-oriented suburbs continues to increase over time ( 37 ). Although driving in suburbs and rural areas is less cognitively taxing than driving in urban areas, living in such auto-centric places also increases the mobility consequences of giving up driving, as it is harder to get around by other means, and this discourages older travelers from forgoing the driver’s seat ( 9 , 38 ). Indeed, after controlling for a wide array of factors associated with travel, our model results indicate that people residing in urban areas are more likely to discontinue driving because of a medical condition or disability than those residing elsewhere, all else equal. This comports with previous research showing that at least some travelers who continue to drive later in life may feel they have no choice ( 39 ). Given this, providing more residential and mobility alternatives (e.g., by foot or ridehail) is likely warranted to improve mobility for those who cannot—or would prefer not to—drive. For example, Toronto’s HomeShare Program was found to reduce the risk of social isolation for older adults who prefer to age in place. The program matches older adults with university students and has reduced economic and social exclusion risk for both younger and older participants ( 40 , 41 ).
Increasing housing and commercial development densities in urban and suburban areas can increase the availability of multi-unit housing for both older and younger residents, support housing affordability, and put more destinations within walking and transit distance of residents. Previous research has found that older adults who do not drive are more likely to be employed when they live in places with high transit access ( 8 ). Pre-pandemic data on older travelers in the Puget Sound region found a positive relationship between housing density and trip frequency—and the strength of this relationship increased between 2006 and 2014 ( 42 ). Other research has found that older travelers who live in dense, pedestrian- and transit-friendly neighborhoods are more likely to give up driving; unfortunately, very few older adults relocate to such urban neighborhoods ( 9 ). One reason for this could be a supply shortfall of high-density senior housing compared with the demand, especially for those requiring social housing who often endure long periods on waitlists ( 43 ). Otherwise, even for older travelers living in urban areas that have frequent transit service to nearby destinations, they may experience barriers to its use depending on the accessibility of the transit vehicles, stops, and stations ( 44 ).
To conclude, we have shown that older travelers in the U.S. are going out much less over time, particularly since the pandemic, but are much more likely to drive later and later in life when they do. So, as the U.S. continues to “gray,” understanding the motivations of and constraints on the growing numbers of older adults who are making substantially fewer trips post-pandemic, and driving more when they do venture out, is essential to ensuring adequate, safe, and reliable mobility for older adults in the years ahead.
Supplemental Material
sj-docx-1-trr-10.1177_03611981251365905 – Supplemental material for The Evolving Travel and Driving Behaviors of Older U.S. Travelers in the 21st Century
Supplemental material, sj-docx-1-trr-10.1177_03611981251365905 for The Evolving Travel and Driving Behaviors of Older U.S. Travelers in the 21st Century by Phoebe Chiu, Yu Hong Hwang, Fariba Siddiq and Brian D. Taylor in Transportation Research Record
Footnotes
Acknowledgements
The authors are grateful for the support of Andy Fung for his invaluable assistance in collaborating and consulting on this project through conception, data analysis, and interpretation of the findings. This project would not be possible without funding from the State of California through the University of California Institute of Transportation Studies’ Resilient and Innovative Mobility Initiative, and the authors are grateful for this support.
Author Contributions
The authors confirm contribution to the paper as follows: study conception and design: P. Chiu, B. Taylor; data collection: P. Chiu, Y. Hwang, F. Siddiq; analysis and interpretation of results: P. Chiu, B. Taylor, Y. Hwang, F. Siddiq; draft manuscript preparation: P. Chiu, B. Taylor, F. Siddiq, Y. Hwang. All authors reviewed the results and approved the final version of the manuscript.
Declaration of Conflicting Interests
The authors declared no potential conflicts of interest with respect to the research, authorship, and/or publication of this article.
Funding
The authors disclosed receipt of the following financial support for the research, authorship, and/or publication of this article: This project received funding from the State of California through the University of California Institute of Transportation Studies’ Resilient and Innovative Mobility Initiative. The grant reference number is UC-ITS-2024-43-34B.
Supplemental Material
Supplemental material for this article is available online.
References
Supplementary Material
Please find the following supplemental material available below.
For Open Access articles published under a Creative Commons License, all supplemental material carries the same license as the article it is associated with.
For non-Open Access articles published, all supplemental material carries a non-exclusive license, and permission requests for re-use of supplemental material or any part of supplemental material shall be sent directly to the copyright owner as specified in the copyright notice associated with the article.