
Abstract
The rising on-demand food-delivery (ODFD) industry has raised road safety concerns because of the often aggressive and risky driving behavior among ODFD drivers, especially those on motorcycles. This study aims to characterize their aggressive and risky driving behavior with respect to microscopic kinematic characteristics and vehicular interactions. We employed traffic videos collected by unmanned aerial vehicles at two intersections in Taipei, Taiwan, with a 0.1 s time resolution. We extracted vehicular trajectory data using artificial intelligence-based video recognition algorithms to obtain microscopic kinematic variables. We compared microscopic traffic flow characteristics (i.e., speed, lateral velocity, and acceleration) and microscopic interactions (i.e., weaving maneuver frequency, safety gap, and time-to-collision) presented by ODFD and non-ODFD drivers. In addition, we compared the difference in their driving behaviors between non-meal-peak hours and meal-peak hours, hypothetically caused by the platform-employed incentive program. We found that, compared to non-ODFD drivers, ODFD drivers could be more likely to perform aggressive and risky driving, indicated by their faster longitudinal and lateral speed, harsher acceleration/deceleration, more frequent weaving maneuvers, shorter safety gaps, and shorter time-to-collision. Also, their aggressive and risky driving behavior could more likely occur during meal-peak hours. To our knowledge, this research is the first study using naturalistic traffic data to investigate the revealed driving behavior of ODFD drivers, contributing to kinematic/quantitative understandings of ODFD drivers’ aggressive and risky driving. Based on these findings, policymakers and platform companies can prescribe countermeasures and devise training programs to improve public road safety and the occupational safety of ODFD drivers, a vulnerable occupational group emerging worldwide.
Keywords
The rising on-demand food-delivery (ODFD) sector in the gig economy has raised global concerns about public road safety because of the often aggressive and risky driving behavior among ODFD drivers, especially those on motorcycles ( 1 – 4 ). The gig economy is emerging across the globe, as a new economic system where digital platforms connect independent contractors with customers to perform task-based work ( 5 ), with platforms such as Uber and Deliveroo penetrating over 500 cities ( 6 ). Further accelerated by the COVID-19 pandemic, the ODFD sector in the gig economy is particularly prosperous, with its global economic value exceeding US$ 17 billion by 2018 and expected to double over the following five years ( 7 ), leading to a worldwide call to investigate the health effects of the gig economy and the occupational health of gig workers ( 8 , 9 ). Unlike other gig drivers in the transportation sector in the gig economy (e.g., Uber and Lyft drivers), ODFD drivers are directly exposed to road safety risks as they often use bicycles (in most western cities) or motorcycles (in most Asian cities) ( 3 ). Among these two modes of transportation, motorcycles have been increasingly employed by ODFD drivers to increase delivery efficiency and, therefore, income. This has caused safety concerns where motorcycles are already popular, for example, Taiwan ( 10 ) and Greece ( 11 ), as well as where motorcycles were not originally popular, for example, Australia ( 12 ) and the U.K. ( 4 ). Despite these safety concerns, very few studies have examined the increased occupational road injury among ODFD drivers on motorcycles, revealing a considerable gap remaining unfilled in the literature ( 3 ).
This has resulted in notably greater risks in motorcycle-dominant places, such as Taiwan and other Asian developing countries, where the motorcycle ODFD industry is prosperous. In Taiwan, commuters heavily rely on motorcycles, as indicated by its very high motorcycle ownership and ridership, with more than half of the population owning a motorcycle and motorcycles dominating the modal share at 48% ( 13 , 14 ). The habitual mode preference has facilitated the popularity of the motorcycle ODFD industry in Taiwan. The two largest motorcycle ODFD platforms in Taiwan (i.e., Foodpanda and Uber Eats) collectively have had over 110,000 cooperative stores and annual revenues of approximately NT$3 billion in 2020 ( 15 ). About 100,000 people in Taiwan have devoted themselves to the motorcycle ODFD industry as of now, which has increased from 45,000 people in 2020 ( 16 ). However, since motorcycle usage is linked to higher accident rates than car usage ( 17 ), as well as eight times higher injury rates and 35 times higher fatality rates (per vehicle mile traveled) ( 18 ), the prosperous motorcycle ODFD industry has raised safety concerns in Taiwan ( 10 ). In 2021, Taipei, Taiwan, saw 32,110 road accidents, of which 22,692 involved non-ODFD motorcyclists and 2155 involved ODFD motorcyclists. Up to 90% of the road accidents involving ODFD motorcyclists were caused by aggressive and risky driving, for example, speeding, being inattentive to front vehicles, improper lane-changing, not yielding to other vehicles, and unsafe following distances ( 19 ).
In the past, most studies employed interview or ethnographic data to examine ODFD drivers’ aggressive and risky driving behaviors and the potential risk factors, for example, the platform-employed business model. In the U.K., interview-based research showed that, compared to non-ODFD drivers, ODFD drivers more frequently reported being involved in collision events with vehicles damaged and people injured ( 20 ). In Athens, Greece, ODFD drivers more likely admitted conducting risky driving behaviors, for example, red-light running, unsafe lane splitting, and driving in pedestrian zones ( 11 ). In China, some studies employed self-administered questionnaires or surveys and found that risky driving behaviors among ODFD drivers include riding on road sections without the right of way, speeding, mobile phone use while riding, and aggressive riding, such as weaving through traffic, frequently overtaking, approaching congested intersections carelessly, frequently and repeatedly honking, and tailgating ( 21 , 22 ). Some other qualitative studies went further to investigate whether ODFD drivers’ aggressive driving behaviors are regulated by the platform-employed business model. For example, interview-based research by Christie and Ward ( 4 , 20 ) noted that, during meal-peak hours or in poor weather conditions, the platform would temporarily increase pay rates, which incentivizes ODFD drivers to carry unstable and heavy loads and drive in dangerous conditions (e.g., wet and icy roads) for higher pay. Relatedly, an ethnographic work done by Sun ( 23 ) pointed out two characteristics in the daily work experiences among ODFD drivers, that is, temporality and gamification. While temporality represents a hectic tempo in their daily work life, where they often run immediately once receiving an order to avoid negative ratings from the platform and customers, gamification means that only through keeping good performance (e.g., on-time delivery) can ODFD drivers guarantee the chance of having next orders assigned to themselves ( 23 , 24 ). This business model not only shapes the daily work life of ODFD drivers, but most importantly, also might account for their aggressive and risky driving behavior.
The current literature lacks field-based research that collects naturalistic data in real-world traffic settings and characterizes revealed, not stated, driving behavior of ODFD drivers. The studies mentioned above primarily focused on ODFD drivers’ stated experiences and, therefore, could generate findings that deviate from their actual behavior ( 25 ). Two exceptions are the studies done by Wang et al. ( 26 ) and Oviedo-Trespalacios et al. ( 27 ), who both used roadside observations to examine ODFD drivers’ aggressive and risky behaviors, such as mobile phone use, helmet-wearing, and red-light running. Although such methods allowed for a categorical characterization of ODFD drivers’ maneuvers (e.g., whether one ran a red light or violated a traffic rule), data collected from human observations by standing at the roadside were limited to subjective maneuver recognition. Thus, vehicular interaction analyses requiring kinematic measurements, such as speed difference, spatial gaps, temporal gaps, and time-to-collision (TTC), cannot be conducted. Moreover, the relatively small data size generated from the roadside observation method could offer limited generalizability. Further, these two studies focused only on electric and conventional bicycles, which are slower and relatively less dangerous, as opposed to gasoline-powered motorcycles. To our knowledge, few current studies have focused on ODFD drivers using motorcycles and examined their aggressive driving behaviors as represented by microscopic kinematic characteristics.
To this end, we used traffic videos collected by unmanned aerial vehicles (UAVs) and extracted vehicular trajectory data using artificial intelligence (AI)-based video recognition algorithms to obtain various microscopic kinematic variables. We characterized the potentially greater aggressiveness of ODFD drivers, via three types of analyses: (i) microscopic kinematic characteristics, (ii) weaving maneuvers, and (iii) vehicle-following behavior. Microscopic traffic flow characteristics, including speed, lateral velocity, and acceleration, of ODFD and non-ODFD drivers were compared. Microscopic interactions were quantified by weaving maneuvers, safety gaps, and the TTC of two vehicles. Where appropriate, descriptive statistics and statistical tests were used to ascertain the differences in driving behavior between ODFD drivers and other vehicle drivers. In addition, we analyzed the difference in ODFD drivers’ aggressive and risky driving (i.e., weaving maneuvers and vehicle-following behavior) between non-meal-peak hours and meal-peak hours, hypothetically caused by the platform-employed incentive program. Based on the field-based traffic data, this research builds empirical evidence on the ODFD drivers’ aggressive and risky driving behavior, complementing the current literature that mostly collected data via interviews, questionnaires, and roadside observations.
The structure of this paper is organized as follows: after this introduction, the section on data and methods is provided in the second part, followed by analyses of ODFD drivers’ aggressiveness in the third and fourth sections. In the last section, conclusions are drawn.
Data and Methods
Data Collection
We used the UAV video and trajectory data from Wen et al. ( 28 ). The data were collected at two road intersections in Taipei, Taiwan, one from Guangfu North Road and Jiankang Road (hereafter Intersection I) and the other from Dongxin Street and Civic Boulevard (hereafter Intersection II) (Table 1). Each intersection has two video clips of about 15 min, and the total data points are 1,800,472 vehicle observations extracted at a frequency of 0.1 s. The four video clips were denoted as clips A and B for Intersection I and clips C and D for Intersection II.
Videography Data Collection Site, Date, and Recorded Time
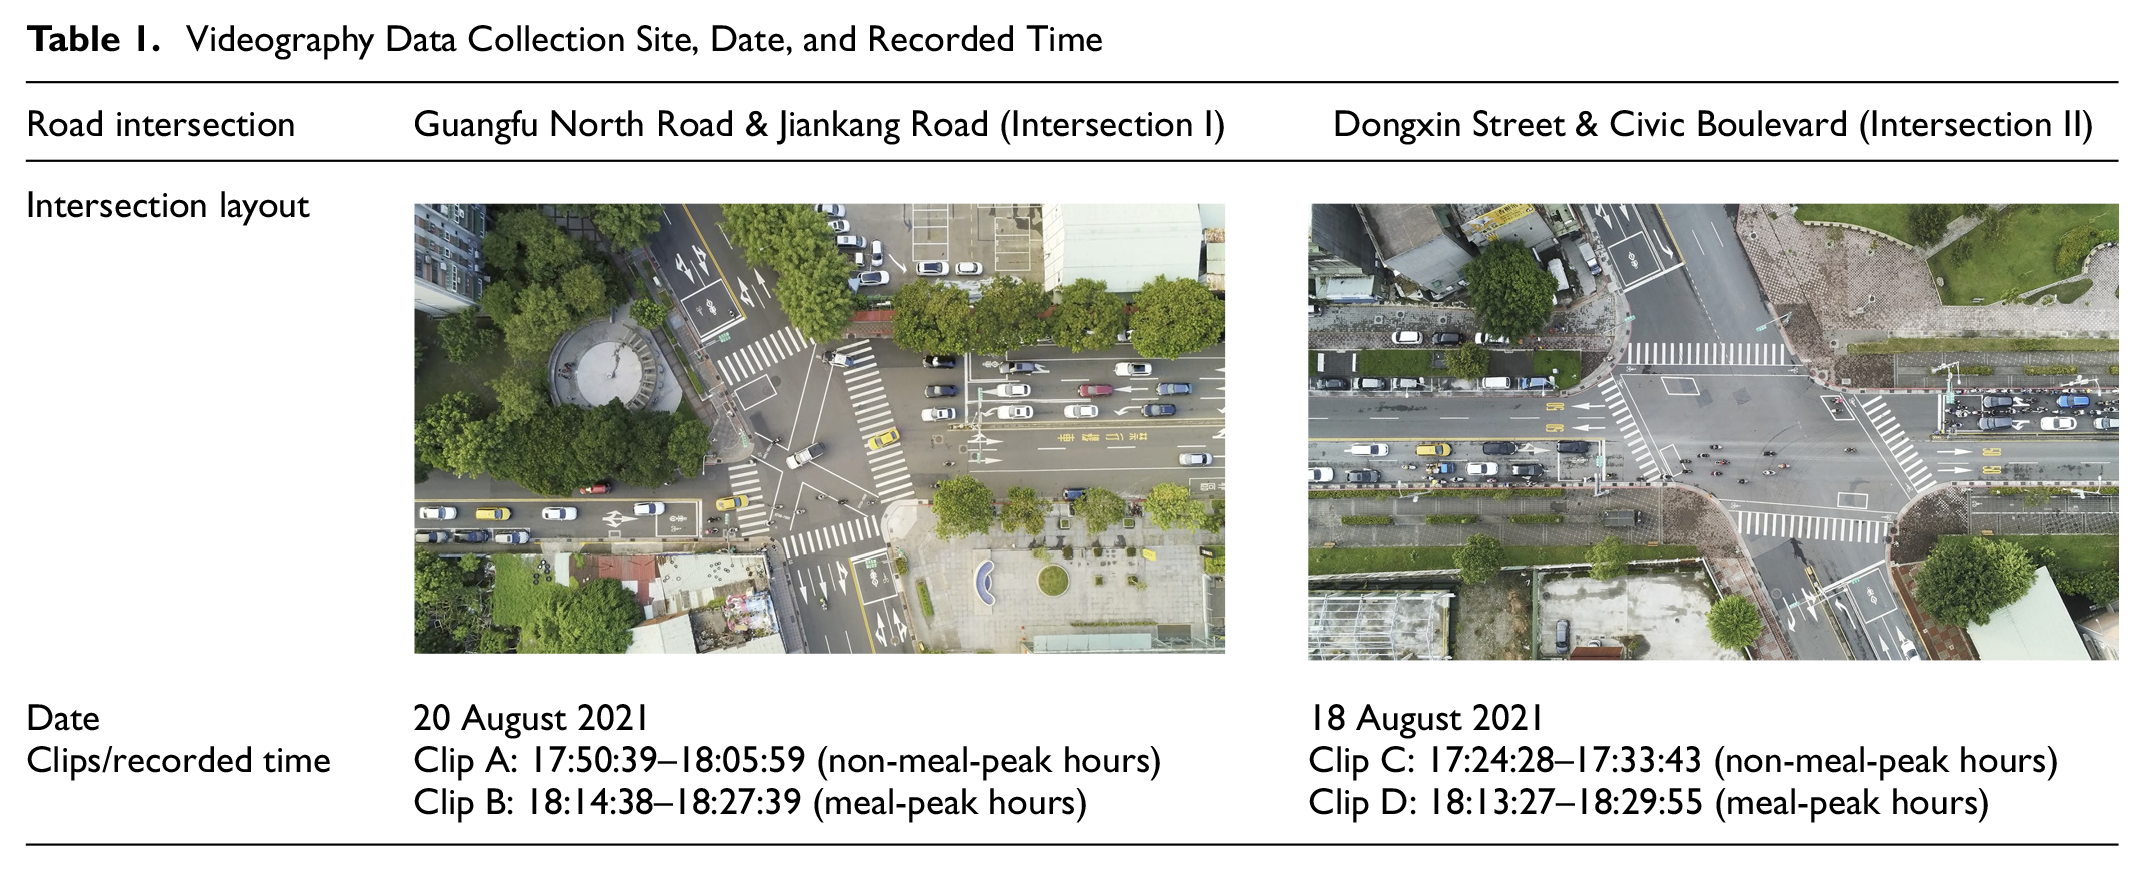
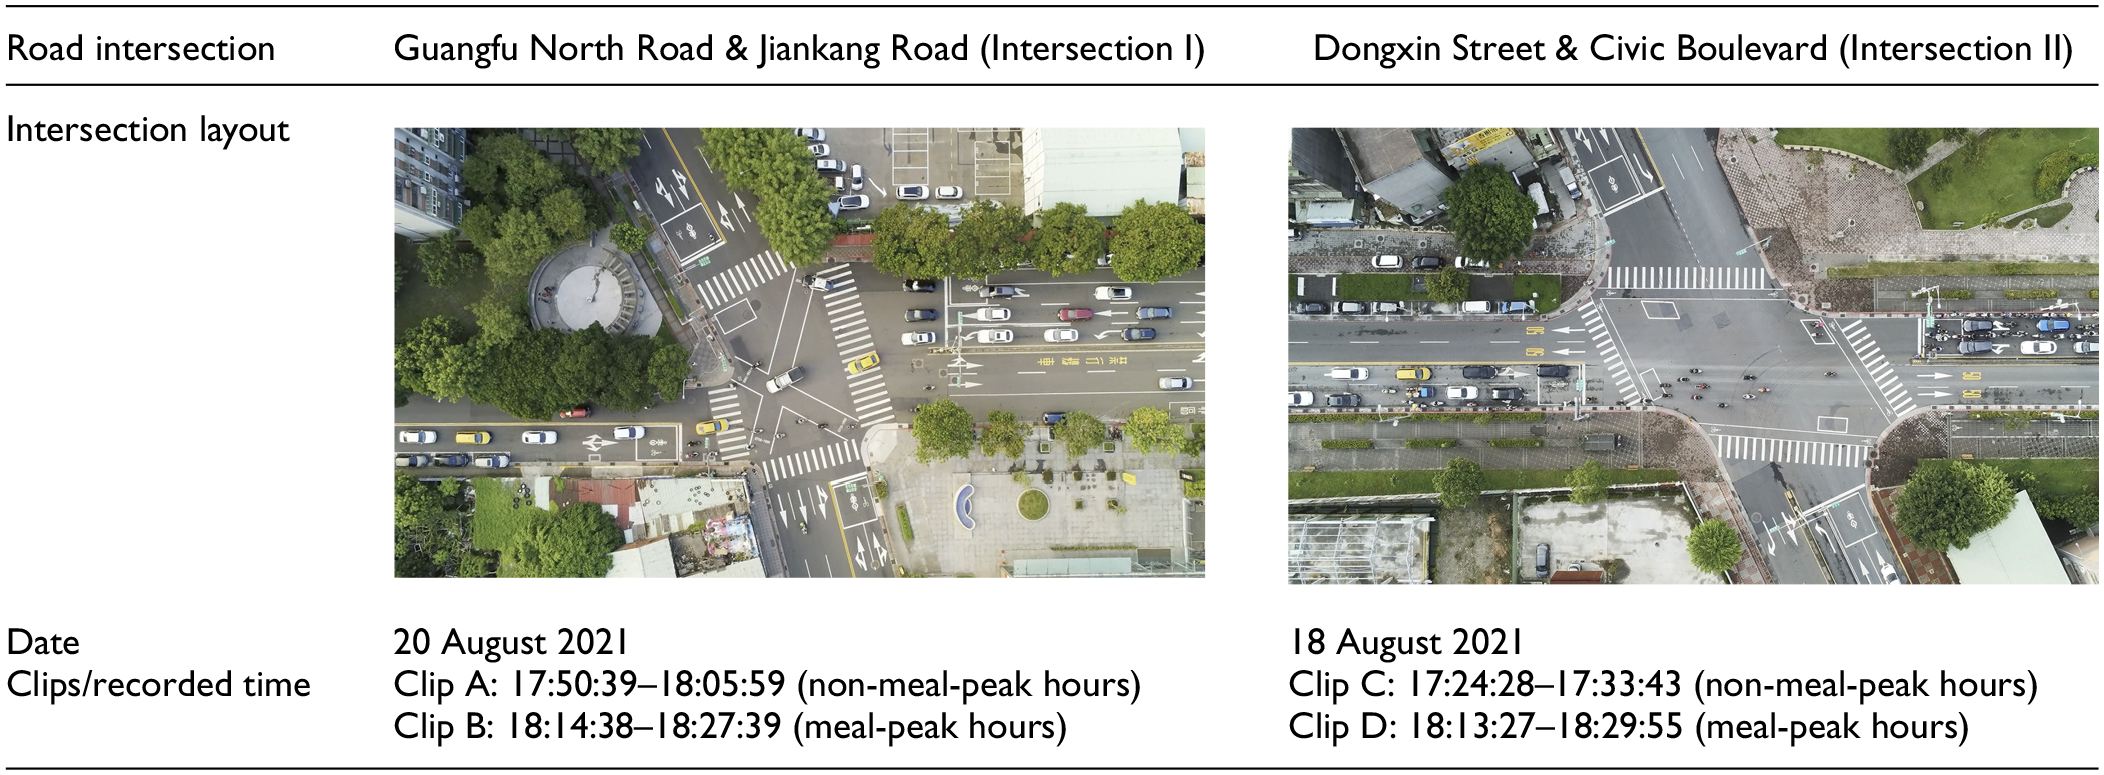
Taiwan has a very high motorcycle density, and the efficient ODFD service relies on motorcycle delivery. However, ODFD motorcyclists’ road safety is a concern ( 10 ). We selected intersections for data collection because motorcyclists were exposed to higher road risks at signalized intersections ( 29 ), with more than half of the traffic accidents in Taipei occurring at road intersections ( 19 ). Indeed, the two sites selected in this study have been identified as accident-prone intersections ( 28 ).
All the videography data were collected over bright summer evenings with good visibility on 20 August (Intersection I) and 18 August 2021 (Intersection II). We focused on afternoon peak hours, the busiest time for ODFD services ( 22 ). Furthermore, aggressive driving is generally a concern in peak hour traffic ( 30 , 31 ), and one-third of the traffic accidents occurring between 8:00 and 24:00 in Taipei were concentrated between 16:00 and 20:00 ( 19 ). To evaluate the influence of the incentive program on the driving behavior of ODFD motorcyclists, we further divided the data into non-meal-peak hours and meal-peak hours. According to Wang et al. ( 26 ), the number of ODFD orders significantly surges from 17:30 until 19:30. Also, as a conventional practice in the Taiwanese culture, people in Taiwan often have dinner after around 18:00. Accordingly, the video data were categorized into two groups: (1) those with time spans mainly before 18:00 (non-meal-peak hours) and (2) those after 18:00 (meal-peak hours), during which the platform-employed incentive program would potentially occur. Therefore, as shown in Table 1, clips A and C are considered as non-meal-peak hours, while clips B and D are meal-peak hours. By comparing the data from the two video clips at the same road intersection, the differences in driving behaviors of ODFD motorcyclists caused by the incentive program were analyzed.
The general traffic characteristics during peak hours in Taipei are briefly described. Similar to cities in other Asian developing countries, Taipei has mixed traffic dominated by motorcycles that, compared with passenger cars, occupy a smaller size in the road space and can easily perform quick lateral movements. Taipei is ranked 40th of the most congested city in the world, with a 35% congestion level (meaning that a 30-min trip will take 35% more time than it would during uncongested conditions) ( 32 ). From a macroscopic perspective, average motorcycle speed decreases during peak hours when the traffic becomes saturated, and the average motorcycle speed is higher than that of cars during peak hours, since motorcycles do not follow conventional lane discipline ( 33 ). From a microscopic perspective, during peak hours, motorcyclists in Taiwan were found to keep shorter longitudinal and lateral spacings than cars ( 33 ). This is also because motorcycles can filter through traffic and accept a much smaller lateral spacing than cars.
Data Processing
We processed the videography data in two main steps. Firstly, the four video clips were processed using AI-based video recognition software developed by Wen et al. ( 28 ) (Figure 1, a and b ). The software was developed to analyze UAV-assisted videography data with computer vision techniques. In essence, the software can detect and track objects at each timestep in a video. It can then offer raw data variables, such as timestep and vehicle ID, dimensions (i.e., width and length), and position, from which advanced vehicular information can be drawn. In this study, the software was used to generate variables including vehicle type (i.e., car, motorcycle, bus, etc.), intersection-in (the link in which a vehicle entered the intersection), intersection-out (the link in which a vehicle left the intersection), instantaneous speed, moving angle, and vehicle coordinates (e.g., central front end x, central front end y, right rear end x, right rear end y, etc.).
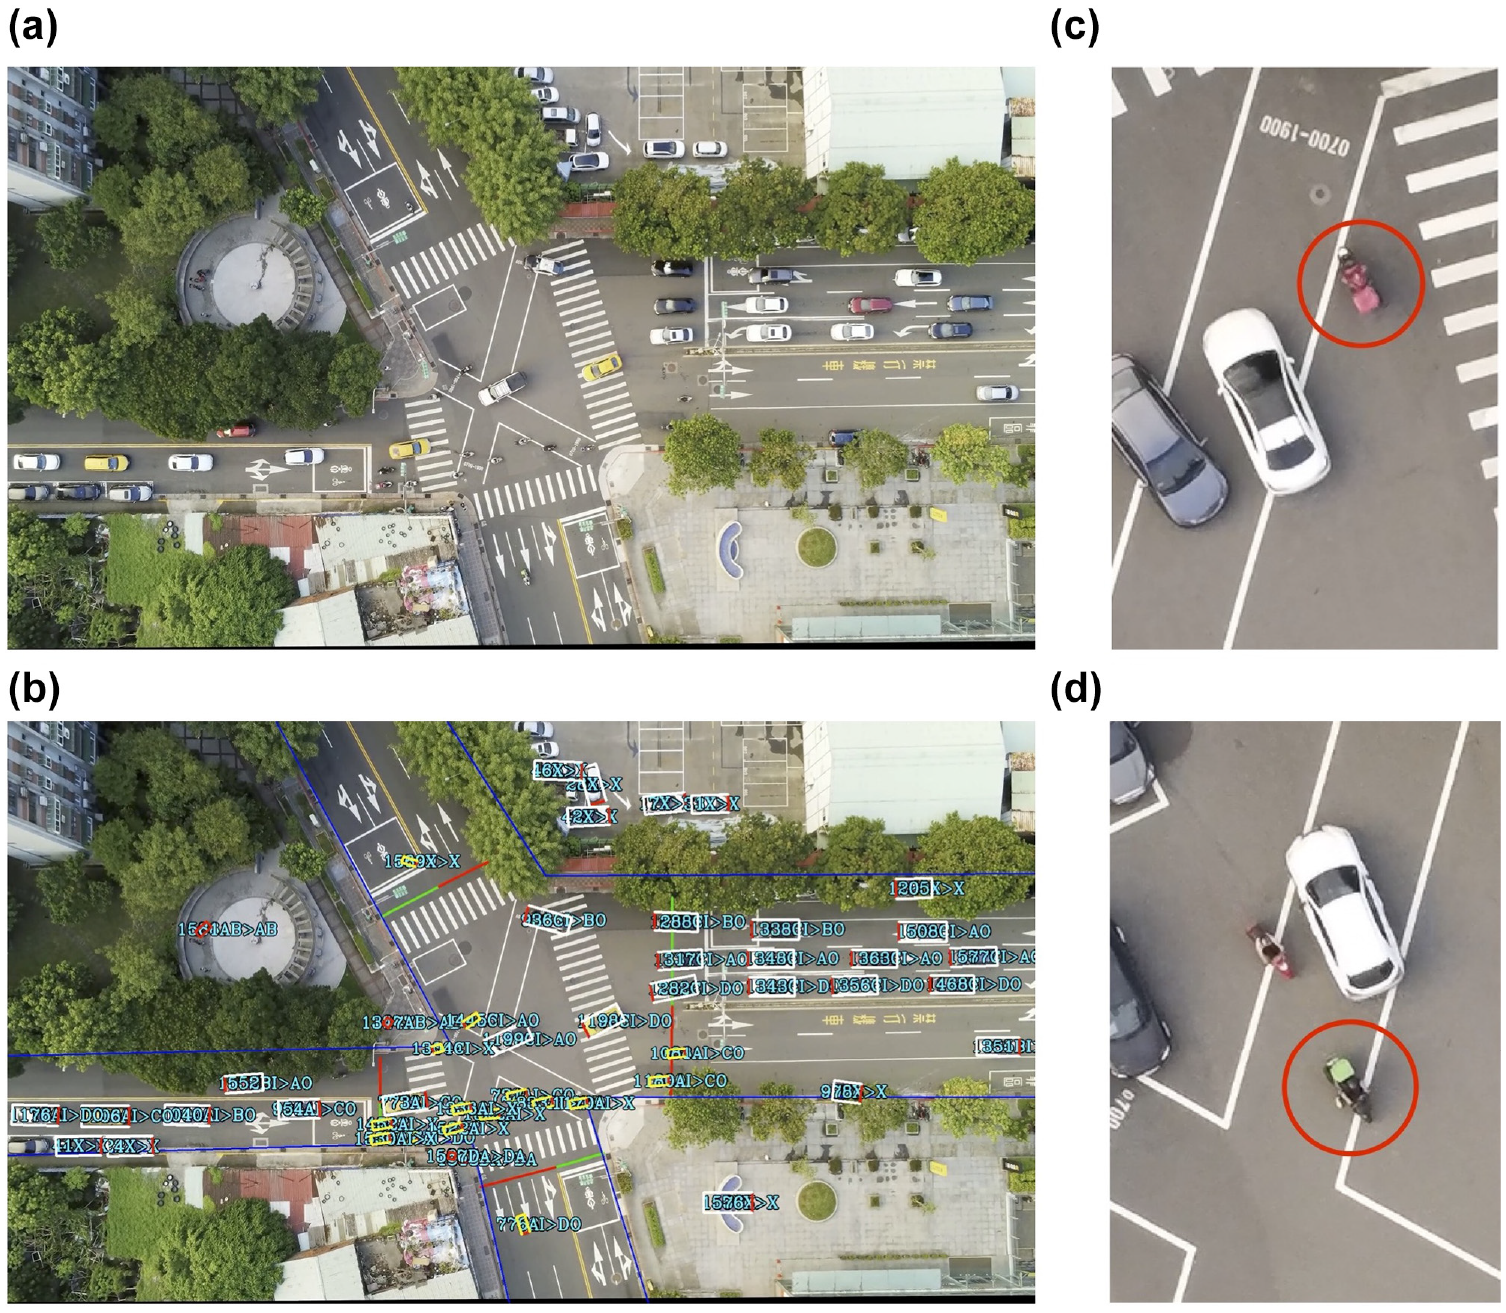
Screenshots of the vehicle trajectory playback: (a) original footage, (b) processed footage, (c) Foodpanda driver, and (d) Uber Eats driver.
Secondly, to identify whether a motorcycle driver is an ODFD motorcyclist, we manually extracted this categorical variable from video footage by identifying whether one carries a delivery box. The two largest ODFD platforms in Taiwan are Foodpanda and Uber Eats ( 10 ), both of which require their contractors to carry luminous pink boxes (Foodpanda) and bright green boxes (Uber Eats) during ODFD tasks, respectively, which can be easily identified in the video clips (see Figure 1, c and d ). We accordingly classified vehicles into three types, that is, car, non-ODFD motorcycle, and ODFD motorcycle. It should be noted that almost all the ODFD tasks in Taiwan are performed by motorcyclists, that is, there are nearly no ODFD car drivers or ODFD bicyclists in Taiwan. Thus, in this study, three types of drivers of interest were referred to: car drivers, non-ODFD motorcyclists, and ODFD motorcyclists. Moreover, we made an assumption that all the ODFD motorcyclists identified in this study were on duty. This assumption is reasonable because, when waiting for orders, most ODFD drivers would be staying in the public space of a community for resting and socializing ( 34 ), and also because idling on the road does not make economic sense. This could be even more of a common practice of ODFD motorcyclists in Taiwan. It is widely seen that ODFD motorcyclists rest in convenience stores, particularly in summer (when the data were collected) since they can avoid the hot and humid weather and enjoy the air-conditioned spaces in convenience stores.
Data Analysis
This study characterizes aggressive and risky driving behaviors through three analyses, namely (i) microscopic kinematic characteristics, (ii) weaving maneuvers, and (iii) vehicle-following behavior. For all these three analyses, we mainly considered moving vehicles (i.e., those with speed > 0 m/s) which account for 78% of the total sample size (i.e., 1,398,385 data points). In analyzing microscopic kinematic characteristics, we considered all three types of drivers, that is, car drivers, non-ODFD motorcyclists, and ODFD motorcyclists. In analyzing weaving maneuvers and vehicle-following behavior, we exclusively focused on the two types of motorcyclists (i.e., excluding car drivers). While the analyses of microscopic kinematic characteristics and weaving maneuvers were based on data with a time resolution of 0.1 s, the analysis of vehicle-following behavior was based on data with a time resolution of 1 s.
Analysis of Microscopic Kinematic Characteristics
In analyzing microscopic kinematic characteristics, we derived descriptive statistics of speed, lateral velocity, and acceleration, since they have been widely employed in the literature on aggressive and risky driving ( 35 , 36 ). In this analysis, each data point represents a set of microscopic kinematic variables, that is, instantaneous speed, acceleration, and lateral velocity at 0.1 s time resolution. Since analyzing microscopic kinematic characteristics often involves cut-off points (e.g., speed > 0 m/s), we did not use the mean for analysis. Also, microscopic kinematic data would have extreme values that could distort and significantly increase the mean. Therefore, we instead reported the median to describe the central tendency of speed and lateral velocity, and we accordingly used the Mann–Whitney test to ascertain the differences. We acknowledge that the data collected in intersection traffic during peak hours in a congested city, Taipei, Taiwan, would inherently involve low-speed traffic flow, and that traffic accidents tend to be more serious when at high speed. However, we note that low-speed road accidents can occur, especially at a road intersection where a sufficiently low approach speed is required by a driver to respond to a pre-collision situation ( 37 ), and any speed difference, although small, can increase the propensities of collisions. Further, although low-speed traffic accidents could be non-fatal, they may pose significant threats to human well-being, for example, sustained neck pain, especially for motorcyclists who are not protected by a car frame and are directly exposed to the external road space ( 38 , 39 ).
To evaluate aggressiveness in acceleration behavior, we employed two statistics, that is, standard deviation and kurtosis, as well as advanced data visualization techniques (i.e., letter-value plots). Subject standard deviation represents how accelerations (and decelerations) are dispersed across each driver group (i.e., car drivers, ODFD motorcyclists, and non-ODFD motorcyclists). A high standard deviation means harsher accelerations and decelerations. On the other hand, subject kurtosis measures the peakedness or tailedness of distribution and describes the ratio of the core relative to tails. A low kurtosis value means a smaller ratio of core relative to tails and, thus, represents a distribution shaped with a lower peak and heavier tails. With respect to acceleration, a low kurtosis value means that more data points lie outside the distribution core, which suggests an unsteady pattern of acceleration/deceleration. Since a harsh and unsteady pattern of acceleration/deceleration can represent aggressive driving ( 40 ), we employed these two statistics to evaluate aggressiveness in driving behavior.
To substantiate our findings, we further employed letter-value plots (also known as boxen plots) and conventional box plots to visualize acceleration data, unlike the conventional practice in data visualization with the use of kernel density estimation (KDE) plots in the transportation field. We selected this data visualization technique because letter-value plots can better describe tail behavior and are considered more appropriate for describing large datasets ( 41 ). Letter-value plots replace the whiskers in traditional box plots (i.e., the range of a box plot delimited by the largest value, the upper whisker, and the smallest value, the lower whisker, that are not considered as outliers) with a variable number of letter values (i.e., a set of order statistics, such as quartiles). This can address the shortcomings of traditional box plots in describing tail behavior and large datasets. Also, unlike KDE plots, letter-value plots “remain true to the spirit of boxplots by displaying only actual observations from the sample and remain free of tuning parameters” ( 41 ). We did not use KDE plots for acceleration characteristics also based on the following reasons. The acceleration distribution of traffic flow at intersections would inherently involve many acceleration values around zero, making the distribution “peak” extremely high and the visualization quality poor. We also cannot make logarithmic transformations of acceleration distributions to visually lower the peak because the distributions involve negative values (i.e., decelerations). Therefore, in visualizing our findings about microscopic kinematic characteristics, we employed KDE plots and histograms for speed and lateral velocity but used letter-value plots, combined with traditional box plots, for acceleration.
Analysis of Weaving Maneuvers
We analyzed weaving maneuvers because weaving through traffic is commonly considered aggressive and risky by the public ( 42 ) and motorcyclists themselves ( 43 ). Following Lee et al. ( 44 ), we defined a weaving maneuver in this study as when a vehicle k, which is at the side (either left-hand or right-hand side) of another vehicle v at time = T, was behind the vehicle v at any time points in the past 5 s (Figure 2a). In this definition, the behindness is strictly defined by whether the central front end of vehicle k was located between the virtual range formed by the lines extended from the rear right end and rear left end of the leading vehicle v. It should be noted that we assumed a buffer distance of 0.5 m to enlarge the virtual range because motorcycles do not strictly follow traditional lane discipline and can travel alongside or weave by another vehicle in the same lane ( 45 ). To operationalize this analysis on the weaving maneuver, we derived weaving maneuver frequencies (i.e., how many weaving maneuvers were performed) and employed the chi-square test to compare weaving maneuver frequencies by driver group (i.e., ODFD versus non-ODFD motorcyclists) and by time (i.e., non-meal-peak hours and meal-peak hours). In addition, we examined whether ODFD motorcyclists would tend to perform rightward weaving maneuvers, which are considered more dangerous as compared to leftward weaving maneuvers ( 46 ). For this analysis, instead of using the variable, how many weaving maneuvers were performed, we derived another variable, whether a driver has performed weaving maneuvers at least once, through which to evaluate the tendency of a driver toward moving in a certain direction (i.e., leftward of rightward) in weaving behaviors.
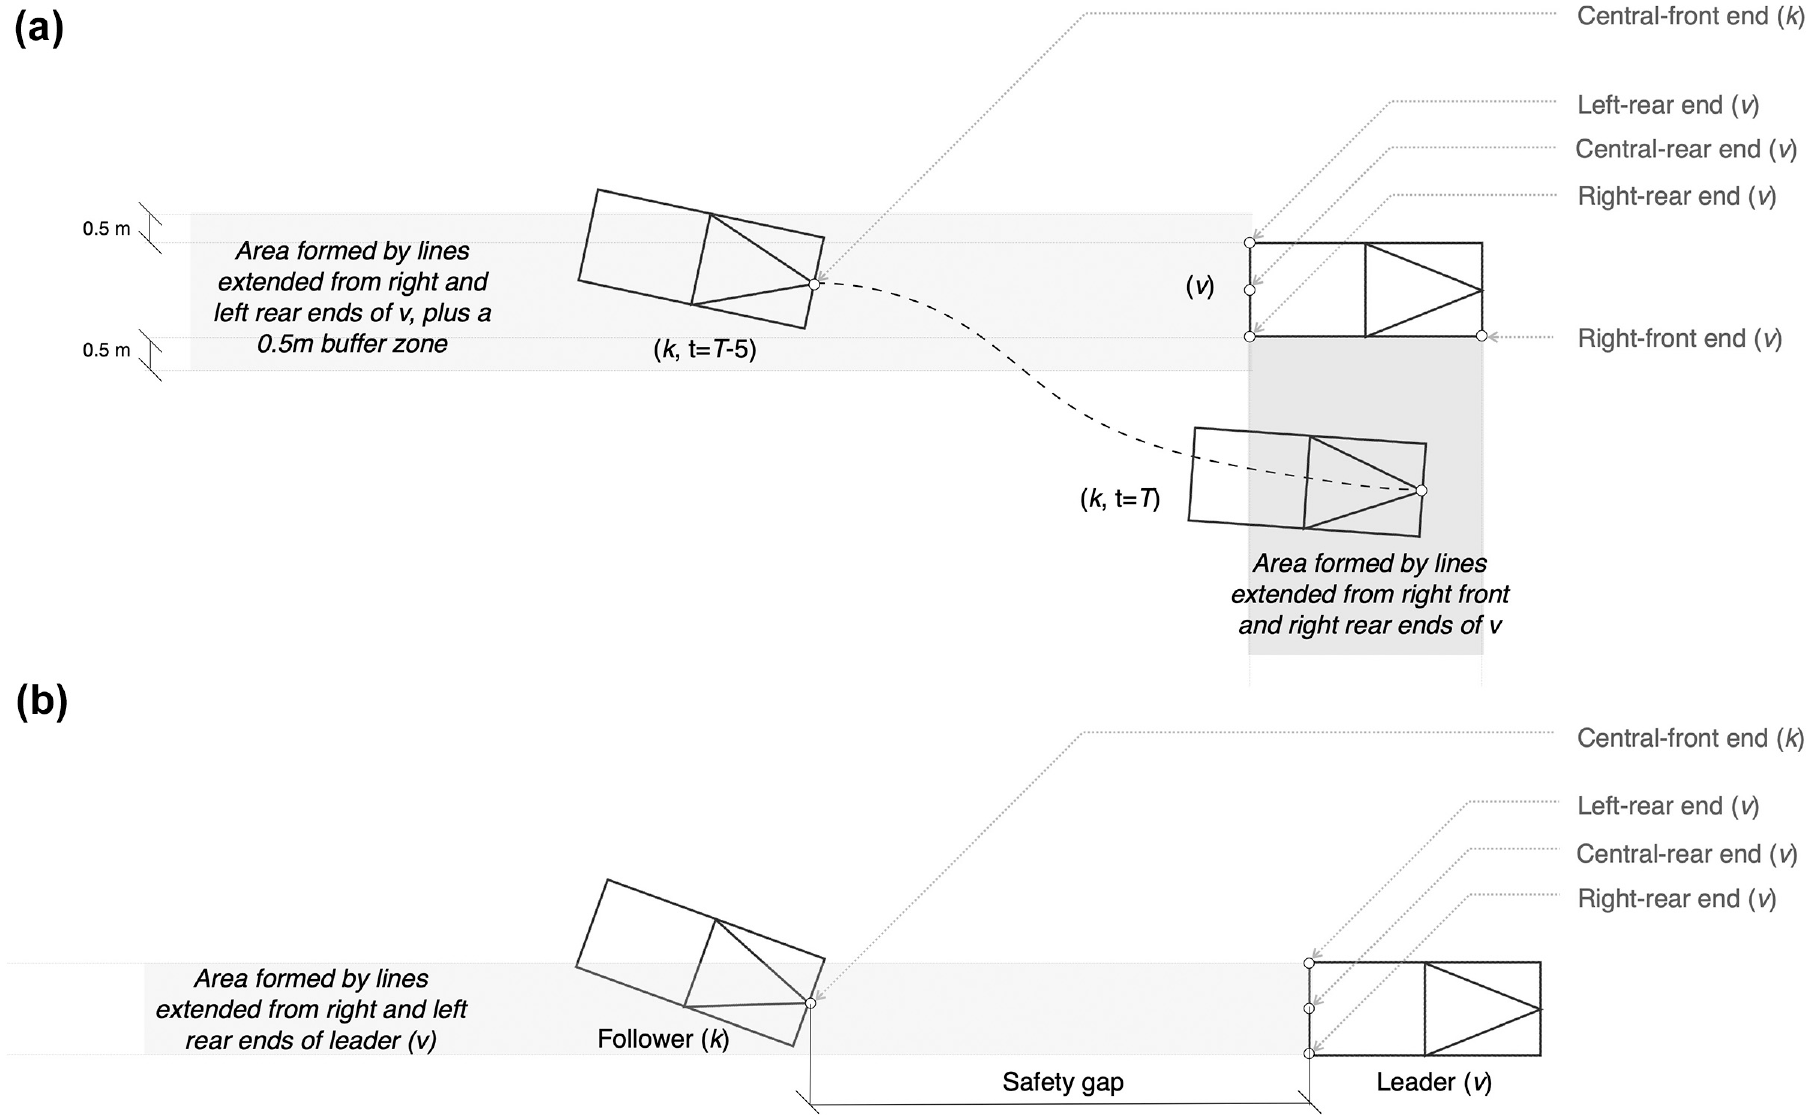
Schematic definitions of the following–leading relationship and weaving maneuver: (a) weaving maneuver (example for rightward) and (b) following–leading relationship and safety gap.
Analysis of Vehicle-Following Behavior
In analyzing vehicle-following behavior, we employed two indicators of aggressive and risky driving, that is, safety gap and TTC. A shorter safety gap represents a higher level of aggressiveness in driving ( 47 ), as evidenced at road intersections during peak hours ( 48 ). A shorter TTC, on the other hand, indicates higher occurrences of dangerous conditions ( 49 ). When employed to describe traffic flow in the low travel speed range (<14 m/s), TTC tends to be steady and suitable for evaluating road safety, especially on urban roads ( 49 ). In this study, we consider a safety gap as intentionally maintained by one driver and, thus, an indicator of one’s aggressiveness. We deem TTC as a measure for road accident risk as a result of the safety gap and speed difference between a following vehicle and its leading vehicle.
To operationalize the analysis, we calculated the safety gap and TTC in the following–leading relationships. Similar to the definition of behindness mentioned above, we define a following–leading relationship as follows: when a subject vehicle (k) has its central front end between a virtual range formed by the lines extended from the right rear end and left rear end of another vehicle (v) (Figure 2b). Then, following Lee et al. ( 50 ), we define the safety gap as the longitudinal space distance between the central front end of a subject vehicle (k) and the central rear end of its leading vehicle (v) (Figure 2b). On the other hand, TTC is defined as the time span left before v and k collide, provided no evasive action is taken ( 51 ). Thus, we derived TTC by dividing the safety gap by the speed difference between vehicles v and k. In analyzing the safety gap and TTC, we reported the subject median and used the Mann–Whitney test to statistically ascertain the differences in the safety gap and TTC between ODFD and non-ODFD motorcyclists, and between meal-peak hours and non-meal-peak hours.
To sum up this section, for each analysis, the time resolution, measure and statistical methods employed, and driver groups examined are summarized in Table 2. Generally, aggressiveness is represented by higher speed, higher rightward velocity, higher absolute leftward velocity, higher standard deviation and lower kurtosis of acceleration distribution, higher weaving frequency, shorter safety gap, and shorter TTC.
Summary of Data, Variables, and Statistical Tests Employed in Each of the Three Analyses
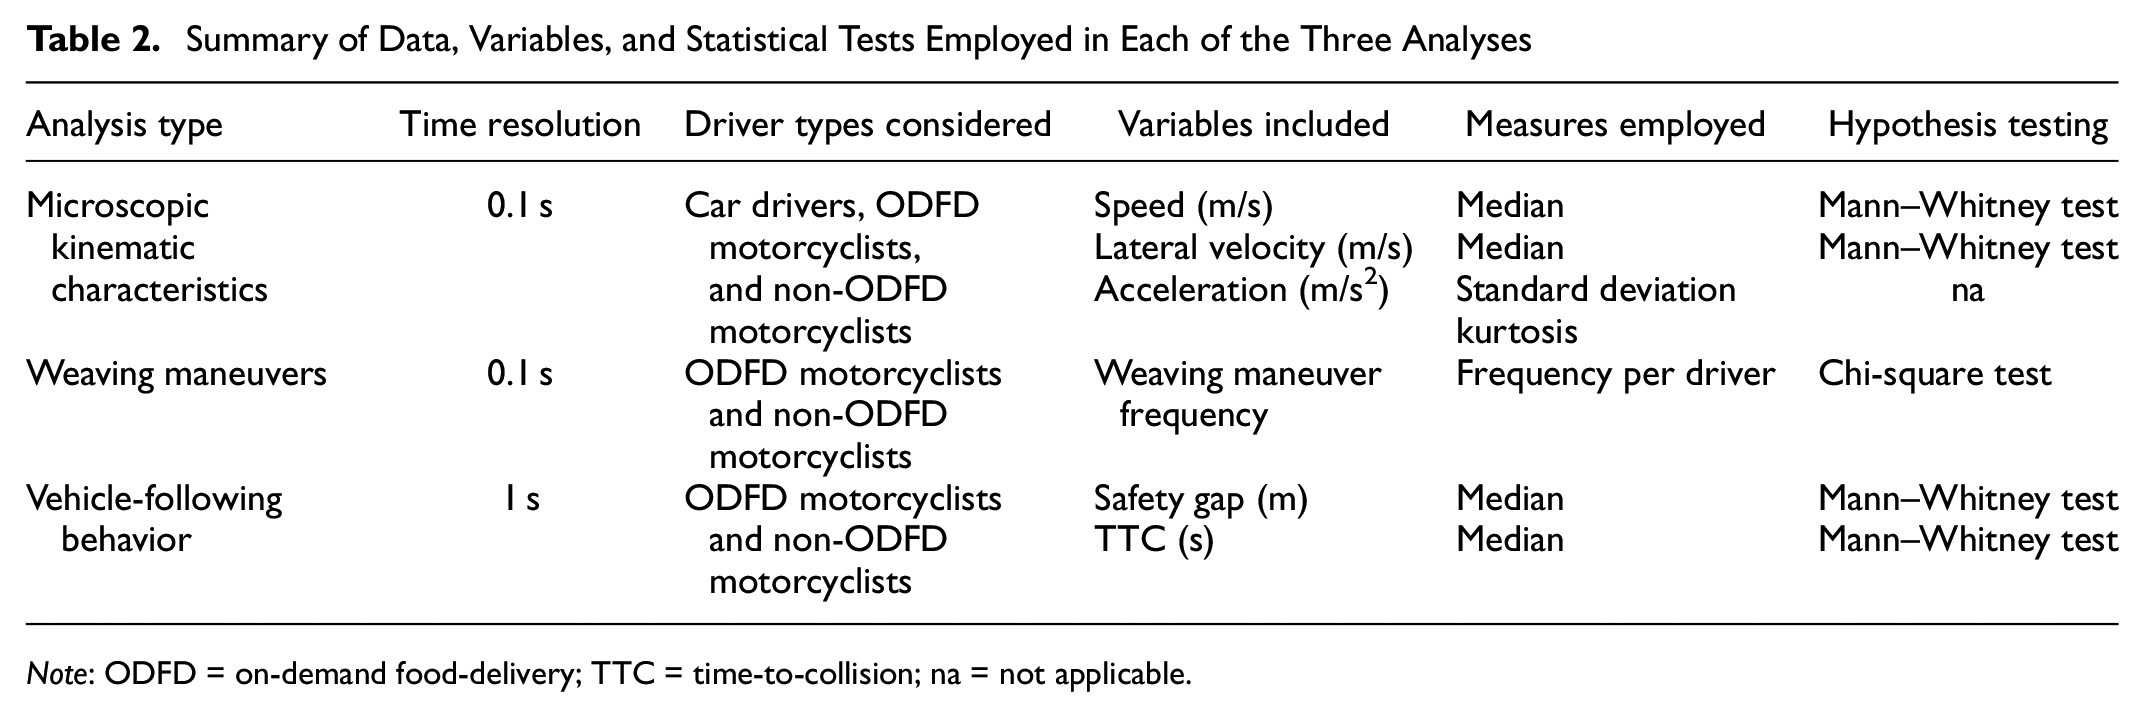
Note: ODFD = on-demand food-delivery; TTC = time-to-collision; na = not applicable.
Aggressiveness Presented by Microscopic Kinematic Characteristics
A summary of statistics of microscopic kinematic characteristics, including speed, lateral velocity, and acceleration, is shown in Table 3. All the statistics were calculated based on moving traffic (with speed > 0 m/s). In the table, in each column (i.e., each statistic of the microscopic kinematic characteristics), the cells are shaded in a three-level grayscale ramp for each video clip. The value in each darker cell represents a faster speed, a higher lateral velocity, or a harsher acceleration/deceleration pattern and, thus, potentially greater aggressiveness. Below, we present our findings and provide a discussion.
Summary of Statistics of Microscopic Kinematic Characteristics
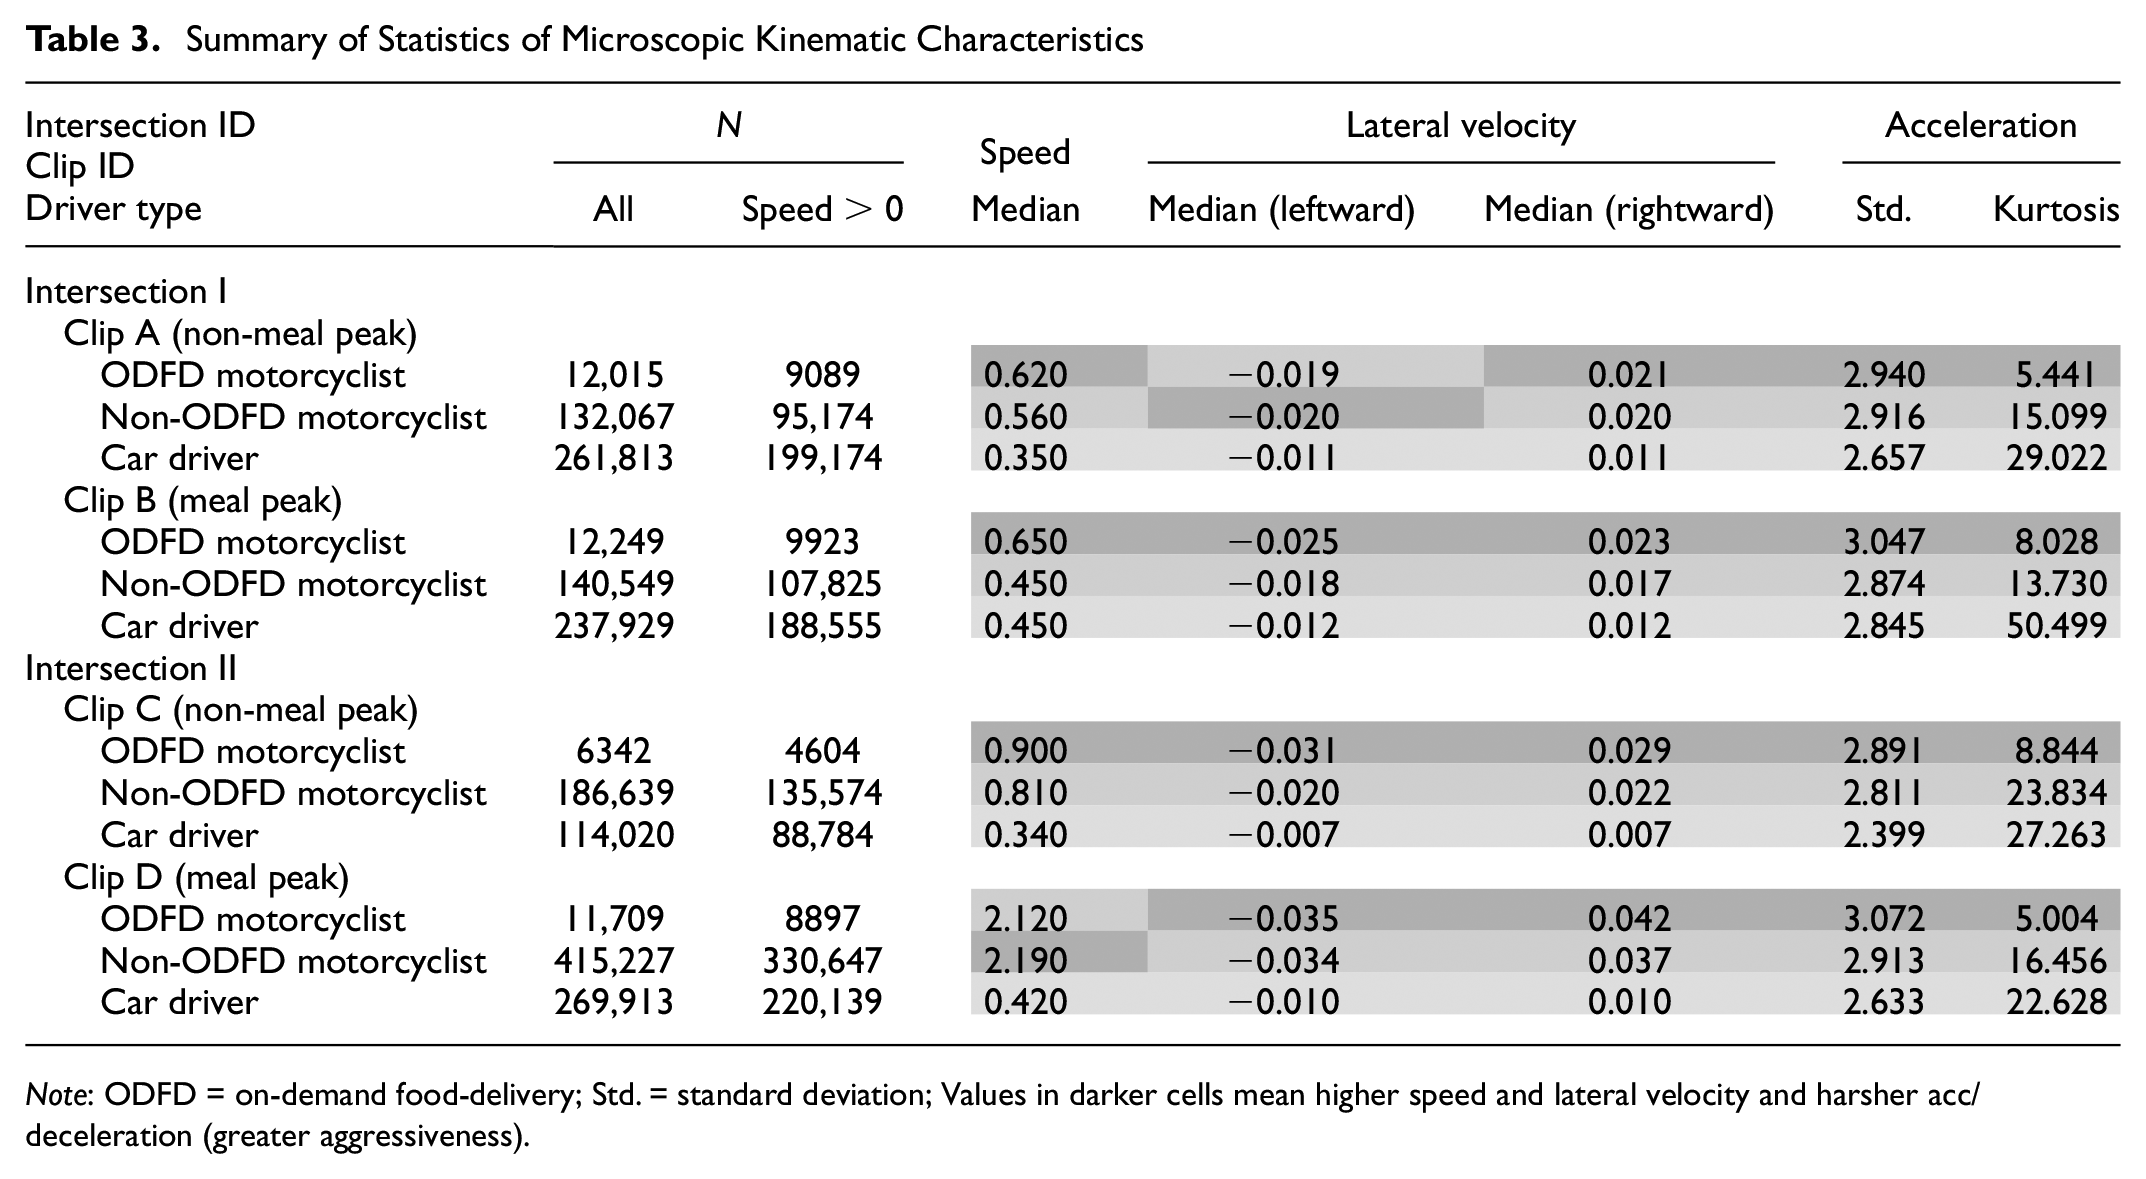
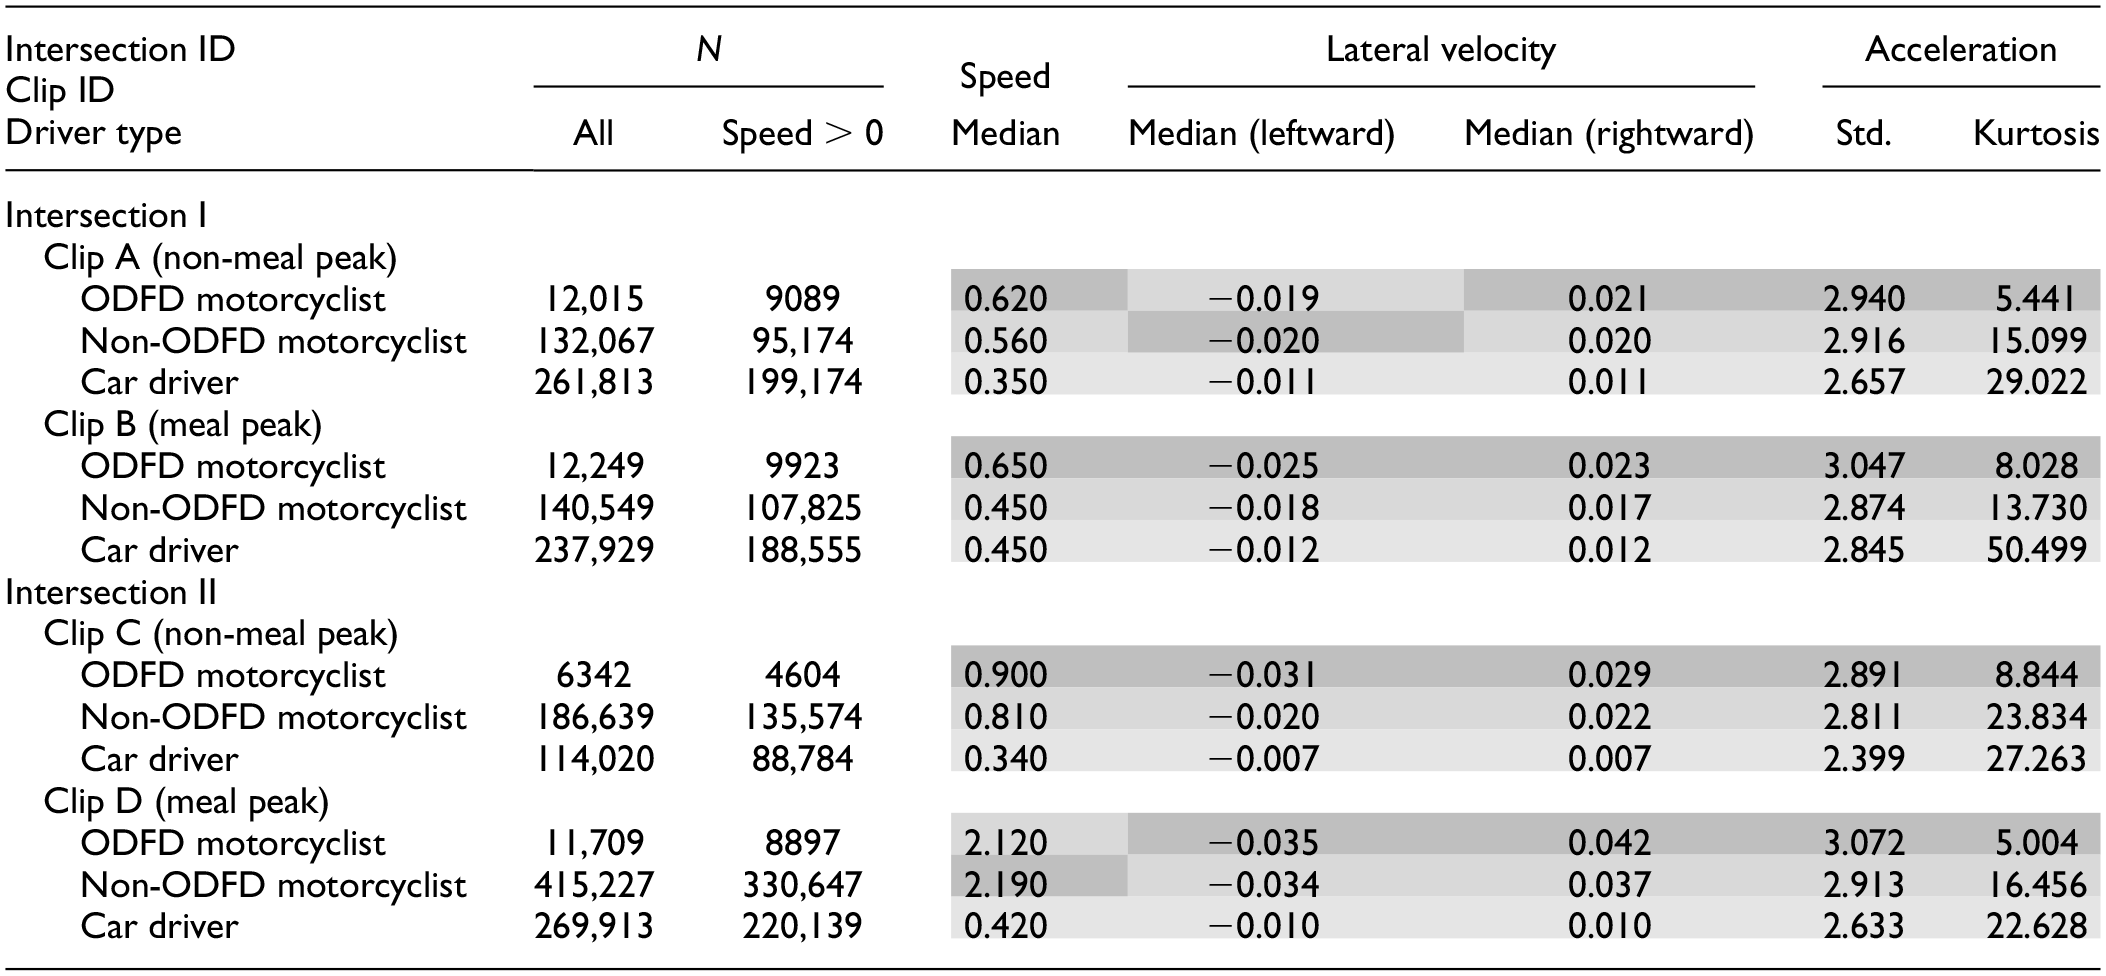
Note: ODFD = on-demand food-delivery; Std. = standard deviation; Values in darker cells mean higher speed and lateral velocity and harsher acc/deceleration (greater aggressiveness).
Median Speed and Lateral Velocity
In general, with respect to speed and lateral velocity, ODFD and non-ODFD motorcyclists were both faster than car drivers, and ODFD motorcyclists were faster than non-ODFD motorcyclists (Table 3). Below, in reporting our findings about median speed and lateral velocity, we first compare motorcyclists against car drivers, and then ODFD motorcyclists against non-ODFD motorcyclists.
When moving (speed > 0 m/s), motorcyclists were faster than car drivers. The Mann–Whitney test shows that both ODFD and non-ODFD motorcyclists had significantly higher median speeds than car drivers (p < 0.001). Among motorcyclists, ODFD motorcyclists had higher median speeds than non-ODFD motorcyclists did, suggesting that an average ODFD motorcyclist could tend to drive faster than an average non-ODFD motorcyclist. The Mann–Whitney test indicates that the differences in median speed between ODFD and non-ODFD motorcyclists are all statistically significant (p < 0.001) for all the video clips, except for clip D. However, for clip D, the significance level of the speed difference between ODFD (2.120 m/s) and non-ODFD (2.190 m/s) motorcyclists is relatively low (p = 0.016).
The speed distributions of all three types of drivers are shown in Figure 3. In the figure, heavier tails can be observed in the speed distributions of ODFD motorcyclists, compared to the tails in the speed distributions of non-ODFD motorcyclists and car drivers. This could mean that faster-moving drivers are more frequently observed among ODFD motorcyclists than among the other two driver groups.
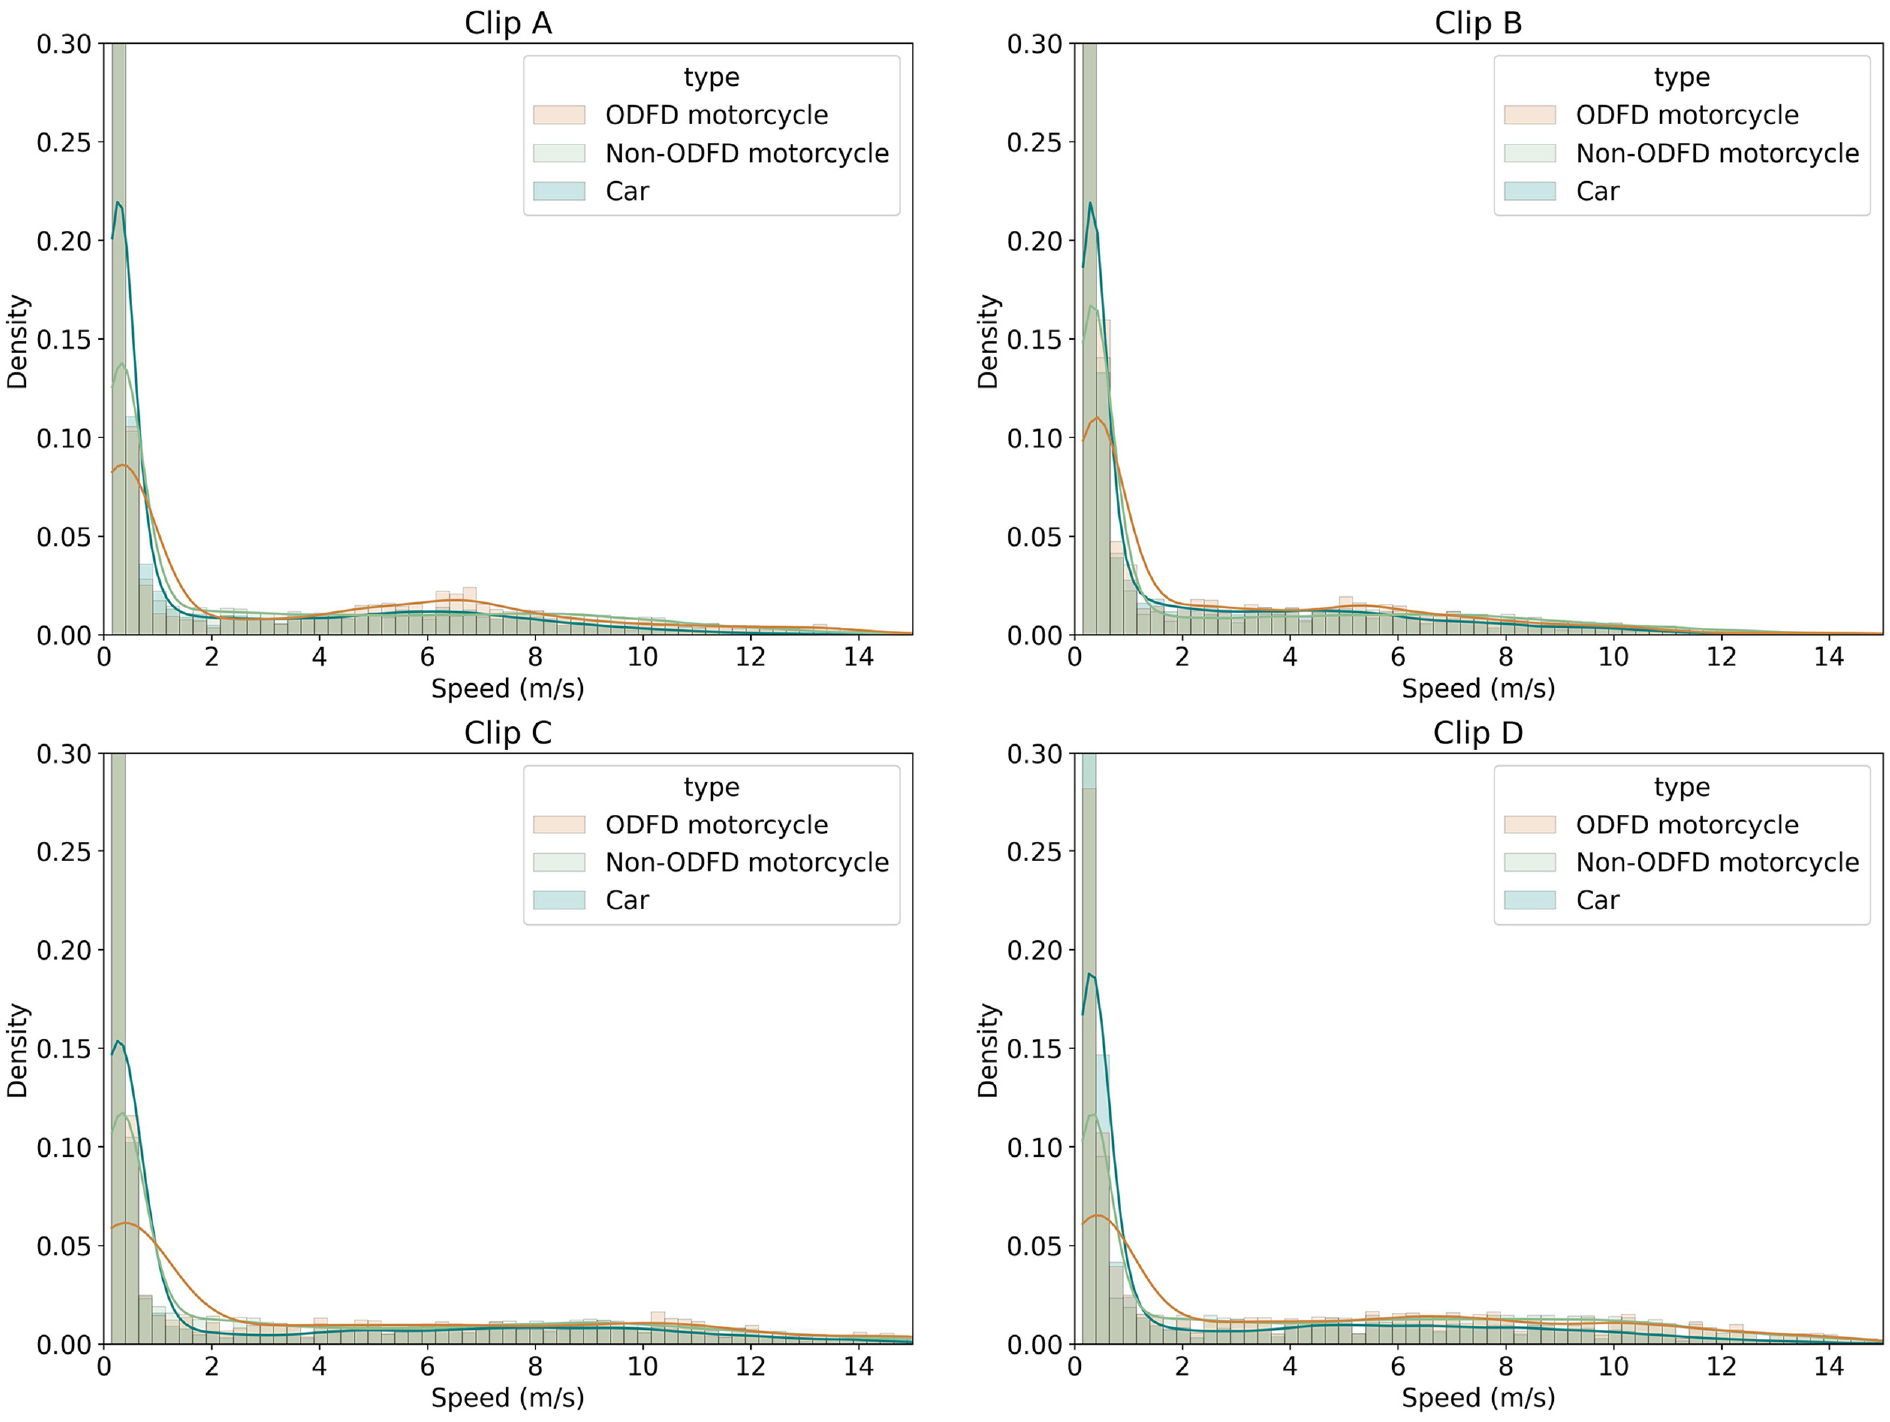
Histograms and kernel density estimation plots for speed distribution by driver type and video clip.
With respect to lateral movement, generally, both ODFD and non-ODFD motorcyclists were also faster than car drivers, and ODFD motorcyclists were faster than non-ODFD motorcyclists. For both rightward and leftward movements, the differences in median lateral velocity between motorcyclists (both ODFD and non-ODFD) and car drivers are statistically significant (p < 0.001). Among motorcyclists, the differences in median lateral velocity between ODFD and non-ODFD drivers are all statistically significant (p < 0.05), except for the leftward movements in clips A (p = 0.101) and D (p = 0.176). This suggests that ODFD motorcyclists always had faster rightward movements, yet only sometimes had faster leftward movements, than non-ODFD motorcyclists.
The lateral velocity distributions for all three driver groups are shown in Figure 4. In the figure, heavier tails can be observed in the lateral velocity distributions of ODFD motorcyclists, compared to those of non-ODFD motorcyclists and car drivers. This could mean that ODFD motorcyclists presented faster lateral movements (both rightward and leftward) than non-ODFD motorcyclists and car drivers.
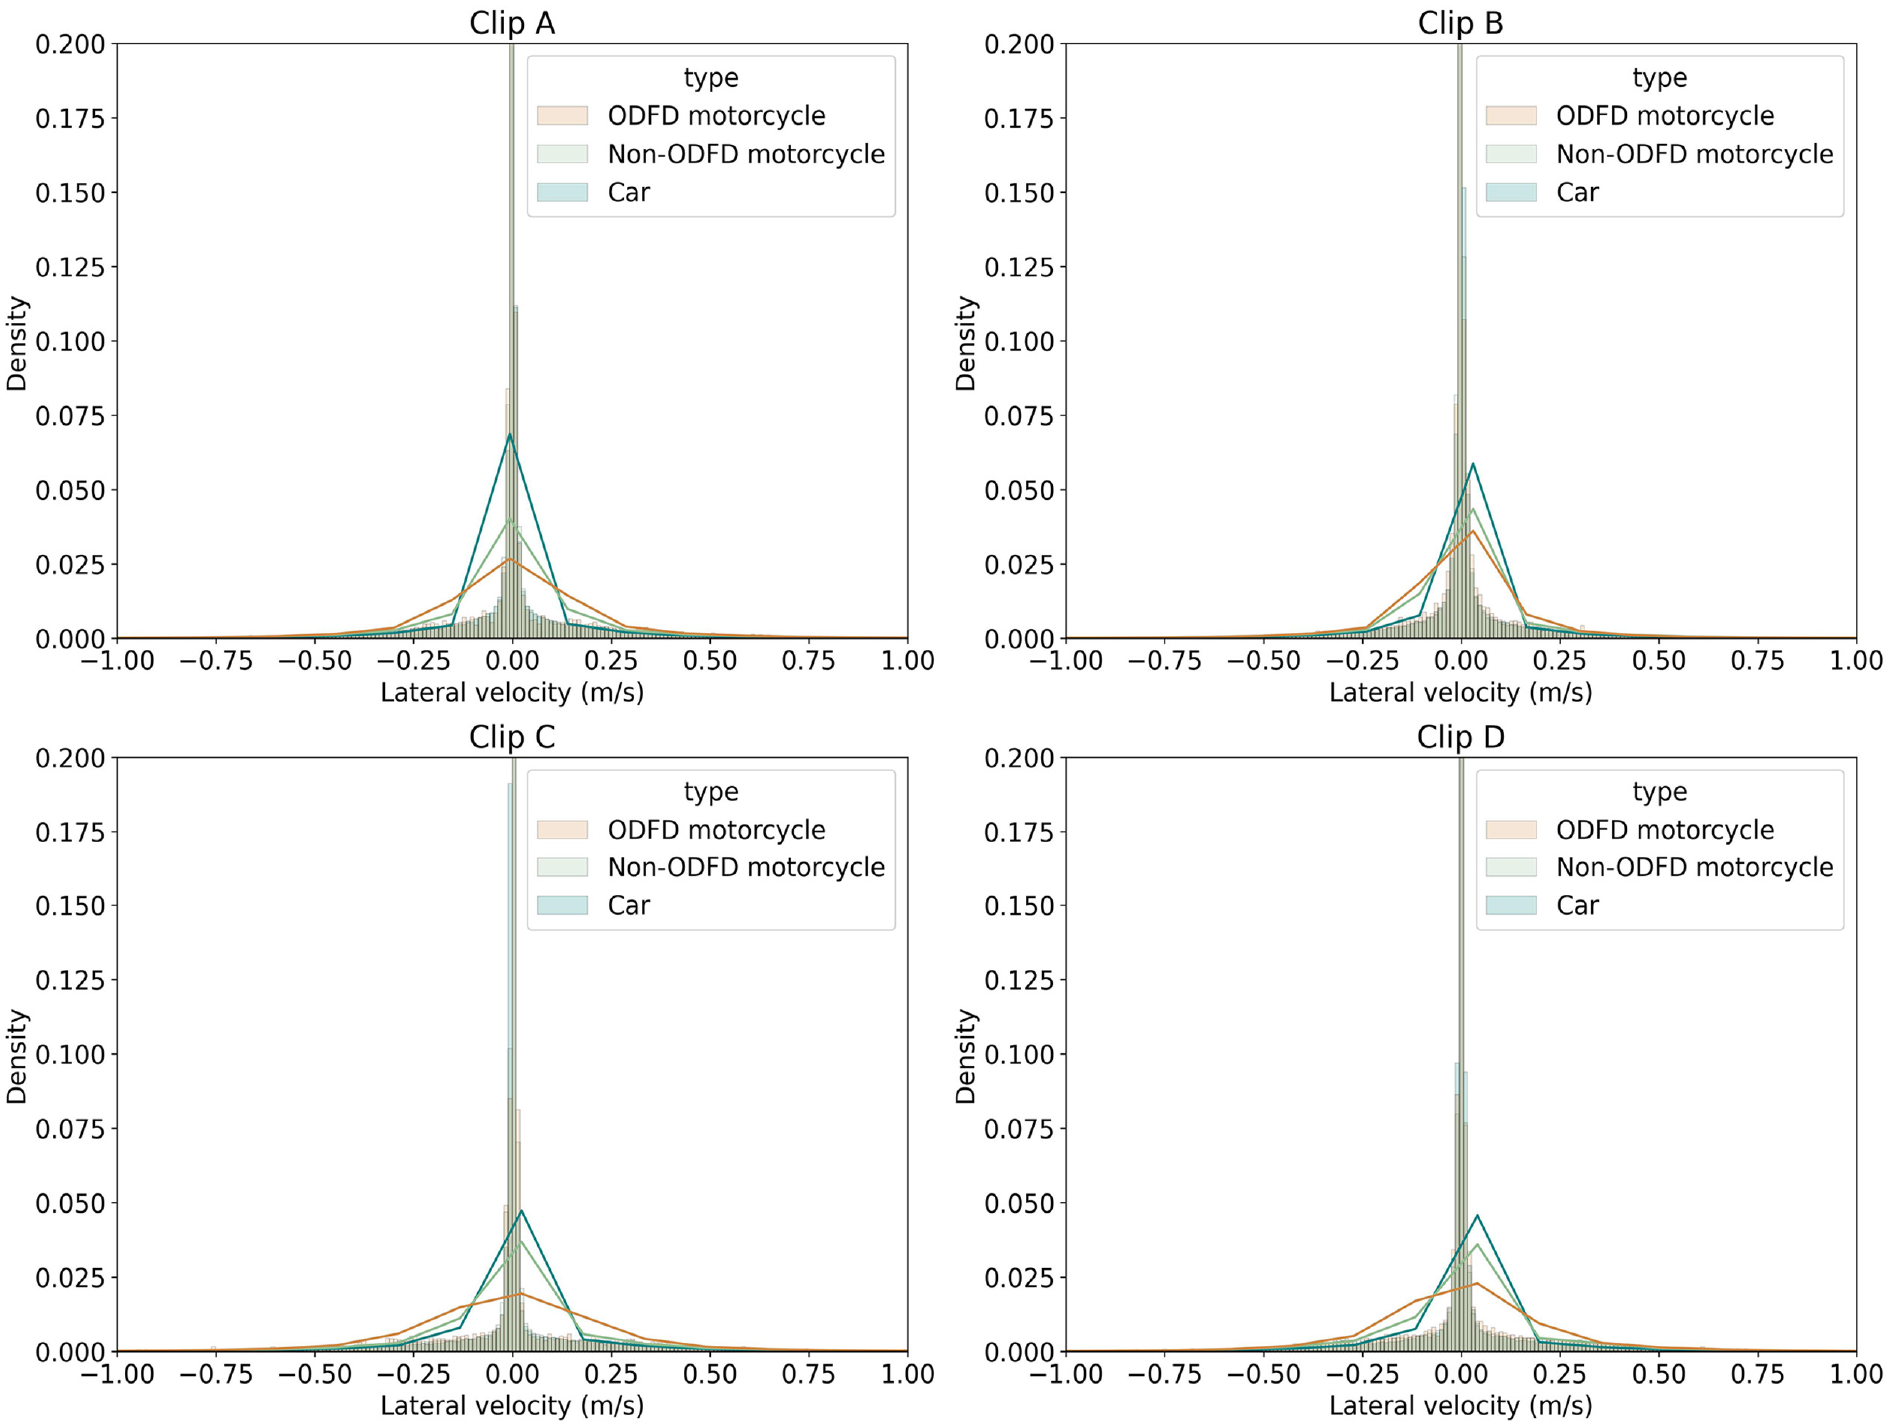
Histograms and kernel density estimation plots for lateral velocity distribution by driver type and video clip.
Below, we discuss the three main findings about speed and lateral velocity. Firstly, motorcyclists were always faster than car drivers in both longitudinal and lateral movements. This is expected since motorcycles can move relatively more freely as they normally do not follow conventional lane discipline, especially in intersection traffic during peak hours in mixed flow composed of motorcycles and automobiles. Compared to a car driver, whose movement is relatively more constrained within a traffic lane, a motorcyclist occupies less road space, can ride with another peer motorcyclist within the same traffic lane, and can also perform lateral movement more easily and even undertake weaving maneuvers. This finding is along the same lines as those in the current literature on mixed traffic composed of motorcycles and automobiles ( 33 , 45 , 50 ).
Secondly, ODFD motorcyclists could be more aggressive than non-ODFD motorcyclists as their speed and lateral movement were both faster. Although we acknowledge that the shapes of speed distributions presented above are potentially linked to stop-and-go traffic at signalized intersections during peak hours, which would involve a slower traffic flow, the significant speed difference between ODFD and non-ODFD motorcyclists suggests that the former move comparatively faster than the latter, even when they use the same mode of transportation. This can raise road safety concerns since speed differences, albeit small, can introduce road risks, especially in intersection traffic where a sufficiently low approach speed is required ( 37 ). Also, an aggressive driver tends to present a faster longitudinal speed ( 40 ) and higher lateral speed ( 31 ). From this perspective, ODFD motorcyclists could be more likely to be aggressive drivers.
Lastly, ODFD motorcyclists show consistently faster rightward movements, yet only sometimes faster leftward movements, suggesting that their driving behavior might be riskier. This is because a lateral movement is often a preparatory step for a motorcyclist to perform a weaving maneuver, and a weaving maneuver on a rightward curve is often considered more dangerous (than on a leftward curve) ( 46 ). This will be further discussed later in the next section.
Standard Deviation and Kurtosis of Acceleration Distribution
Generally, car drivers presented acceleration distributions with lower standard deviations and higher kurtosis values, compared with motorcyclists. Among the two types of motorcyclists, ODFD motorcyclists presented acceleration distributions with higher standard deviations and lower kurtosis values (Table 3). We visualize the acceleration distributions of three types of drivers using letter-value plots and conventional box plots (Figure 5). From the box plots in the figure, it can be observed that car drivers have narrower whisker ranges, followed by non-ODFD motorcyclists and ODFD motorcyclists. The wider whiskers of ODFD motorcyclists echo the findings about the higher standard deviations of their acceleration distributions. Moreover, from the letter-value plots in the figure, it can be observed that, for car drivers, the majority of acceleration values lie within the narrower whiskers (i.e., cores of distributions). That is, the acceleration distributions of car drivers are tall and thin, which is represented by the high kurtosis values. On the other hand, for ODFD motorcyclists, relatively few acceleration/deceleration values lie within the wider whisker ranges (as represented by the low kurtosis values). In other words, relatively more ODFD motorcyclists applied harsher accelerations and decelerations, as indicated by the fatter tails and shorter peaks.
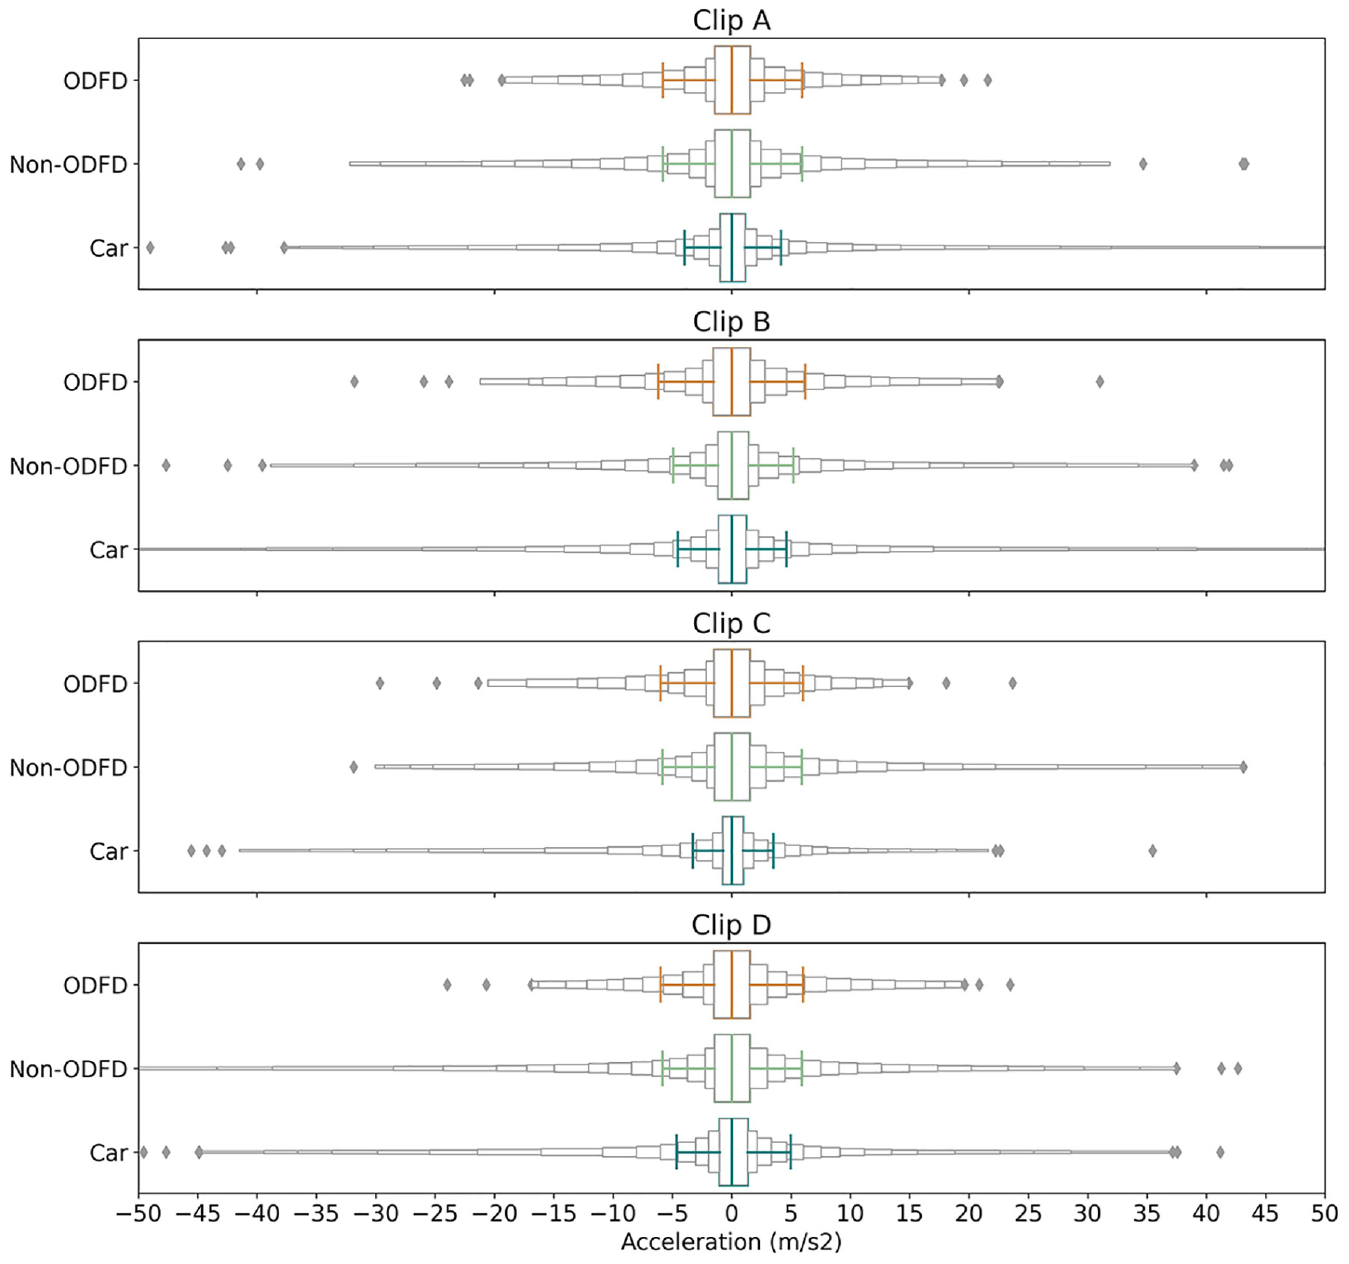
Letter-value plots and box plots for acceleration distribution by driver type and video clip.
The lower standard deviations and higher kurtosis values of acceleration distributions for car drivers are again expected. This is because a car driver at a signalized road intersection during peak hours would often demonstrate stop-and-go patterns, which inherently involve many mild accelerations and decelerations and thus increase the kurtosis values of acceleration distributions. However, using the same mode of transportation (i.e., motorcycle), ODFD motorcyclists presented a different acceleration pattern than non-ODFD motorcyclists did. Since aggressive drivers tend to present harsher acceleration ( 40 ), this study concludes that ODFD motorcyclists could be more likely to drive aggressively, as compared to non-ODFD motorcyclists.
Aggressiveness Presented in Microscopic Vehicular Interactions
This section presents our analyses of weaving maneuvers and vehicle-following behavior, focusing exclusively on motorcyclists. For weaving maneuvers, we derived an indicator, weaving maneuver frequency, by capturing vehicles that performed weaving maneuvers and then employed the chi-square test to ascertain the difference in weaving frequency between ODFD and non-ODFD motorcyclists. As for vehicle-following behavior, we employed the Mann–Whitney test to investigate the differences in median safety gaps and TTC between ODFD and non-ODFD motorcyclists.
In addition, we examined whether the weaving maneuver frequency and vehicle-following behaviors of ODFD motorcyclists changed between non-meal-peak hours (i.e., clips A and B) and meal-peak hours (i.e., clips C and D). Below, to highlight the potential influence of the incentive program during meal-peak hours, we first make comparisons between ODFD and non-ODFD motorcyclists in a road intersection-wise way and, then, in a video clip-wise way. Whereas the former simply compares the difference in driving behavior between ODFD and non-ODFD motorcyclists, the latter highlights the “difference in differences,” that is, the difference in driving behavior between ODFD and non-ODFD motorcyclists across two types of hours (meal-peak hours versus non-meal-peak hours).
Weaving Maneuvers
In total, 4574 motorcyclists (162 ODFD and 4412 non-ODFD) were observed over the data collection period, and 893 weaving maneuvers were identified. Generally, ODFD motorcyclists performed weaving maneuvers more frequently than non-ODFD motorcyclists (Table 4). On average, ODFD motorcyclists undertook 0.307 and 0.446 weaving maneuvers per driver at Intersections I and II, respectively. On the other hand, non-ODFD motorcyclists performed 0.099 and 0.235 weaving maneuvers per driver at Intersections I and II, respectively. The differences in weaving maneuver frequency at the two intersections between ODFD and non-ODFD motorcyclists are both statistically significant (p < 0.001).
Road Intersection-Wise Comparison of Weaving Maneuver Frequencies Between On-Demand Food-Delivery (ODFD) and Non-ODFD Motorcyclists
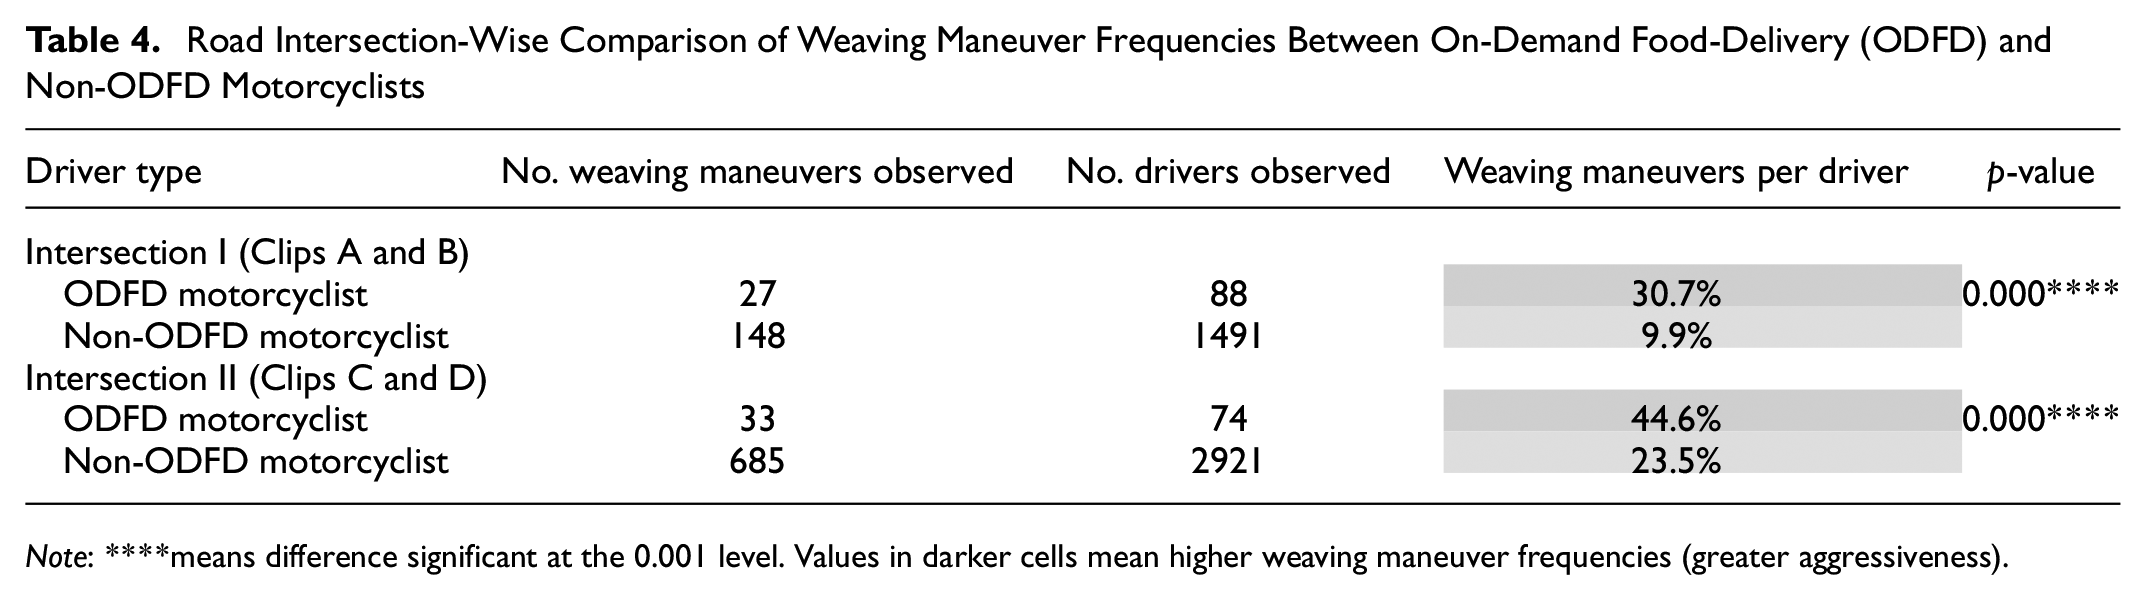
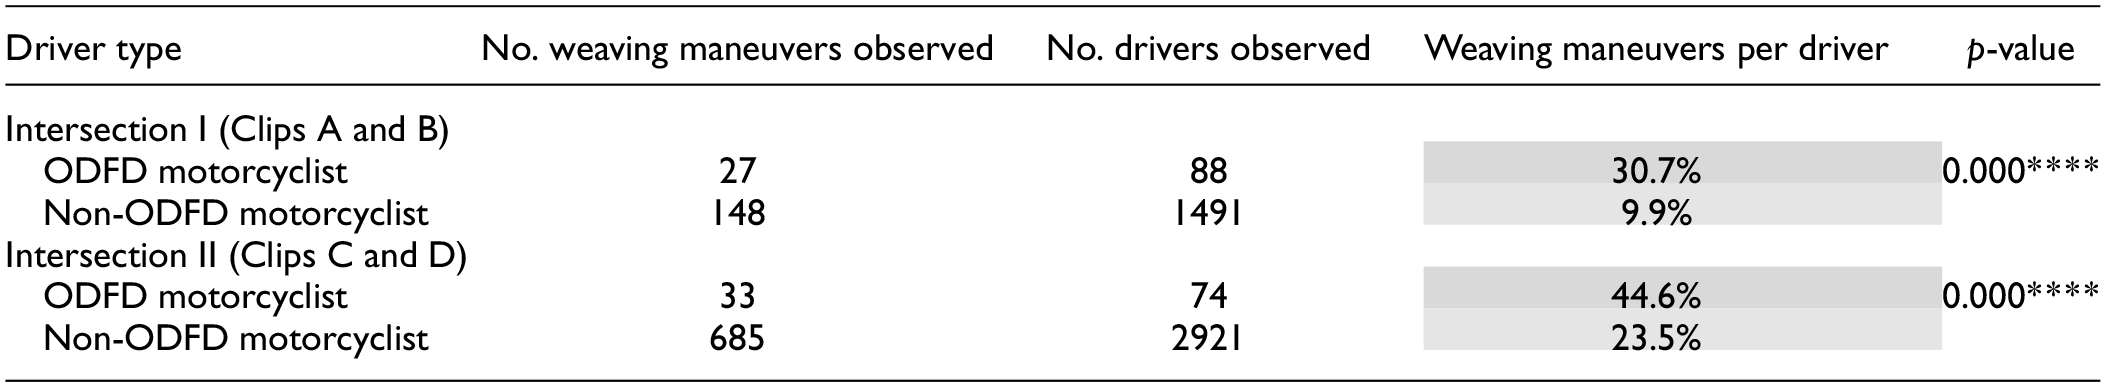
Note: ****means difference significant at the 0.001 level. Values in darker cells mean higher weaving maneuver frequencies (greater aggressiveness).
However, when stratifying by video clip, we found that the above conclusions only strictly hold for meal-peak hours (clips B and D). As shown in Table 5, the differences in weaving maneuver frequency between ODFD and non-ODFD motorcyclists are not statistically significant for non-meal-peak hours, that is, clips A (p = 0.213) and C (p = 0.951). Conversely, for meal-peak hours (clips B and D), the differences become statistically significant (p < 0.001), meaning that ODFD drivers could perform significantly more weaving maneuvers than non-ODFD drivers, particularly during meal-peak hours.
Video Clip-Wise Comparison of Weaving Maneuver Frequencies Between On-Demand Food-Delivery (ODFD) and Non-ODFD Motorcyclists
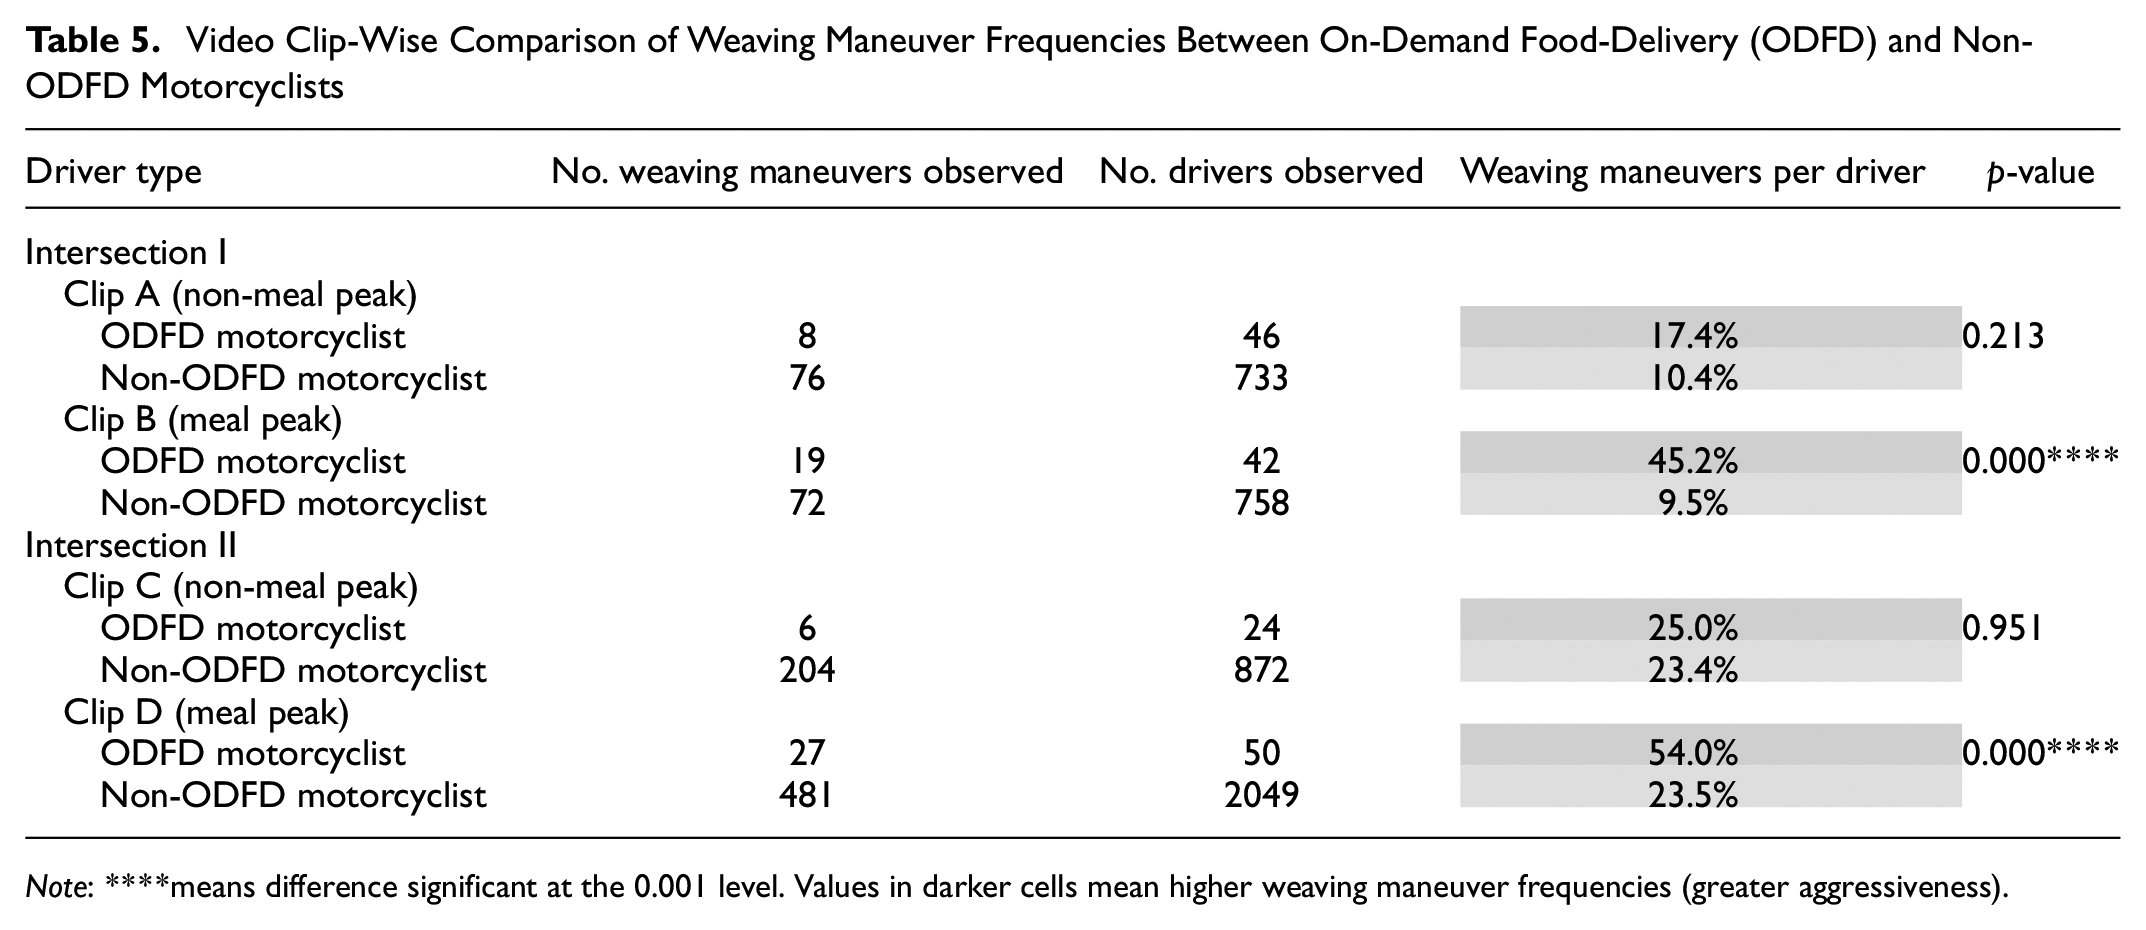
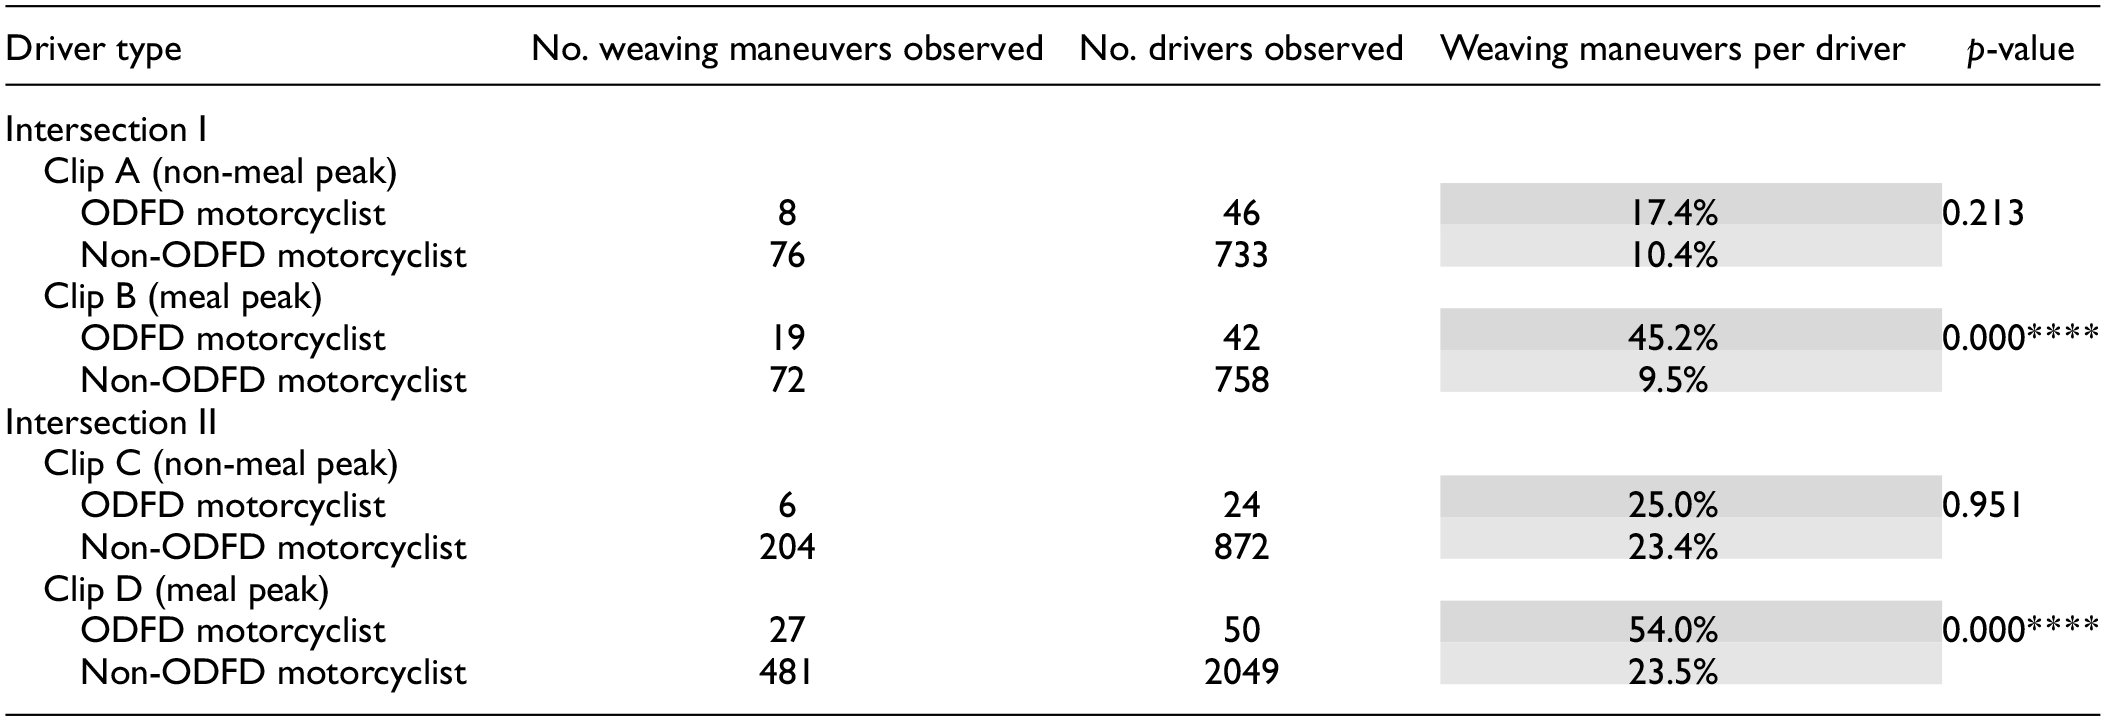
Note: ****means difference significant at the 0.001 level. Values in darker cells mean higher weaving maneuver frequencies (greater aggressiveness).
Furthermore, ODFD motorcyclists could lean toward performing rightward weaving maneuvers, rather than leftward weaving maneuvers. As shown in Table 6, the chi-square test shows that the differences in rightward weaving maneuver frequency between ODFD and non-ODFD motorcyclists are statistically significant for both clips B (p < 0.000) and D (p = 0.016). However, for leftward weaving maneuvers, the differences are less statistically significant for clips B (p = 0.004) and D (p = 0.082).
Comparison of Moving Direction of Weaving Maneuvers Between On-Demand Food-Delivery (ODFD) and Non-ODFD Motorcyclists
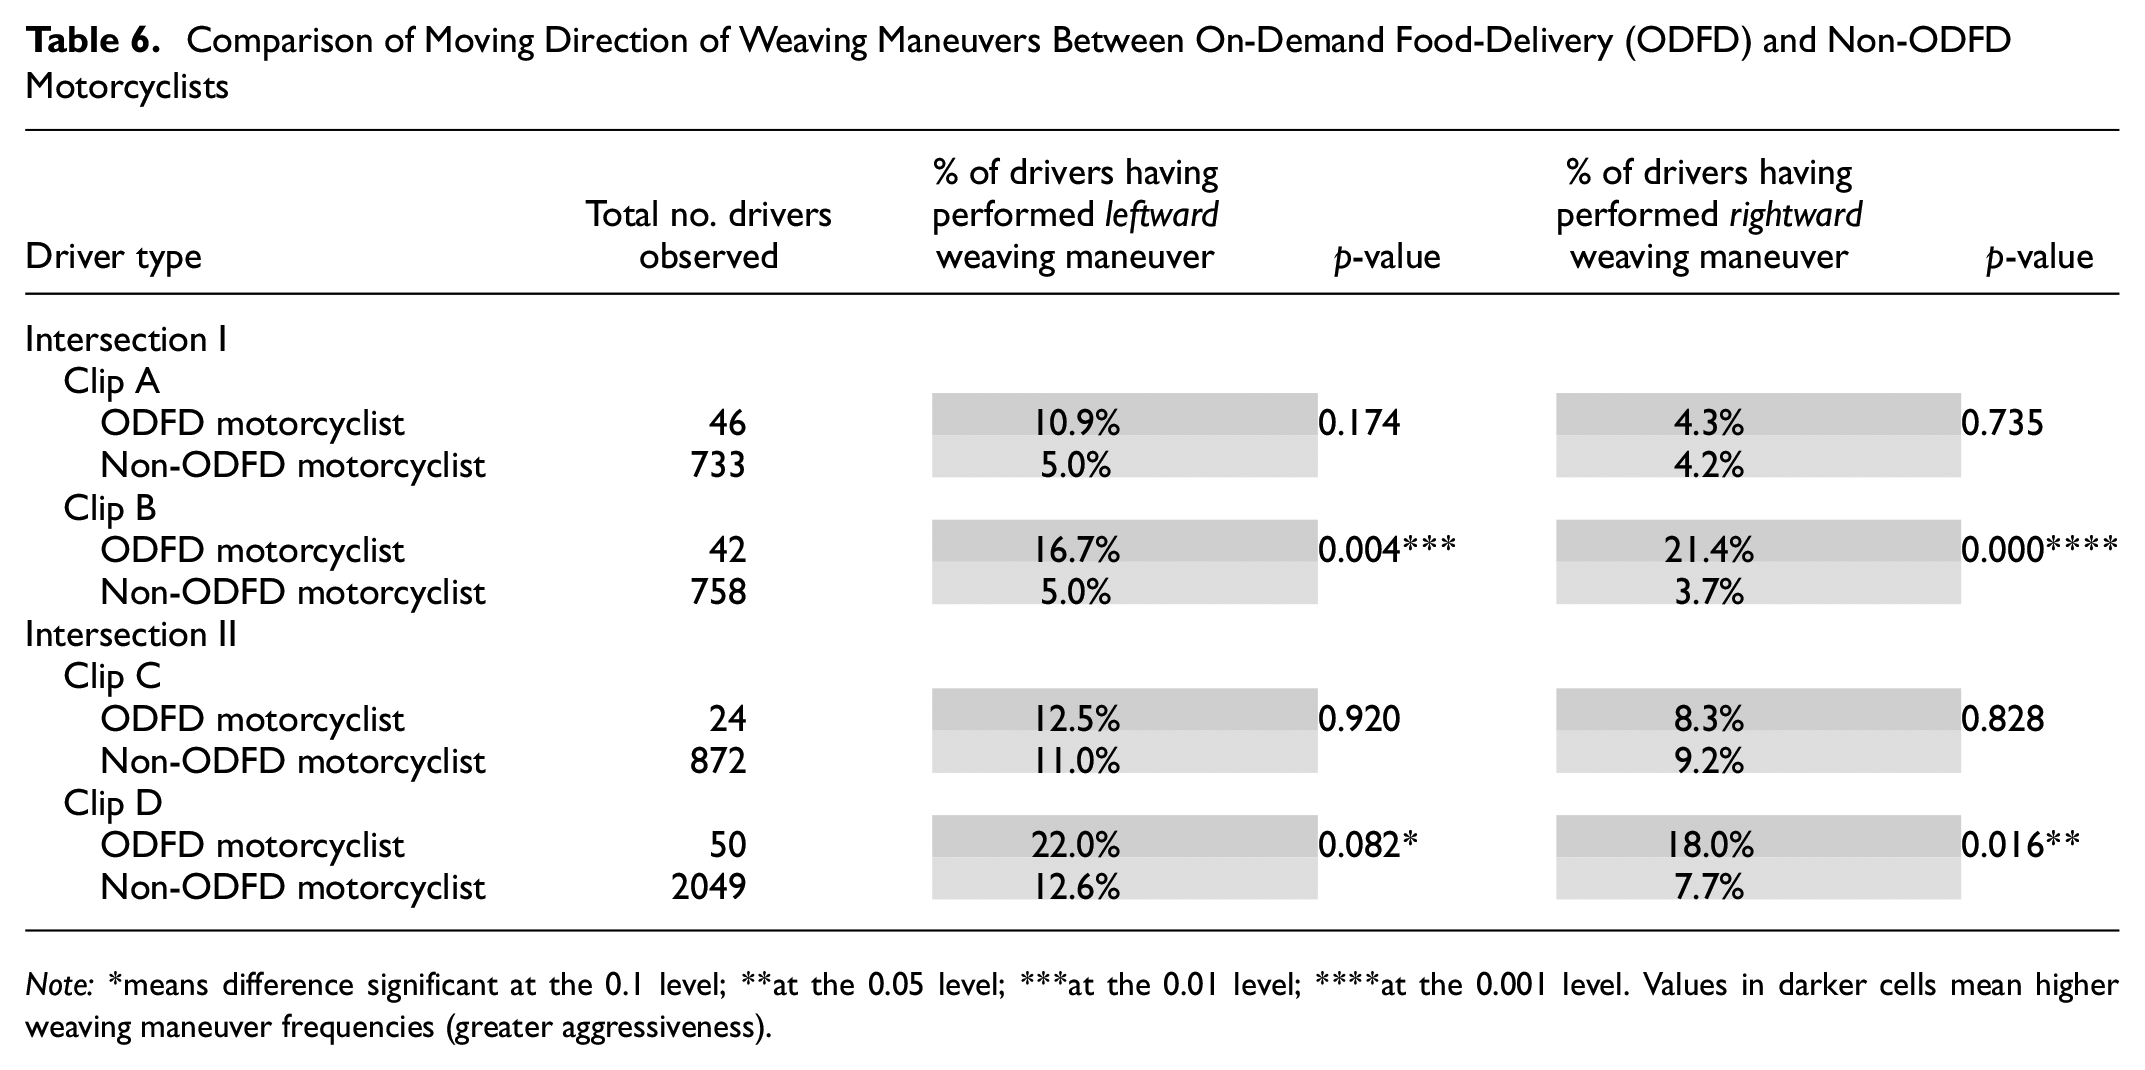
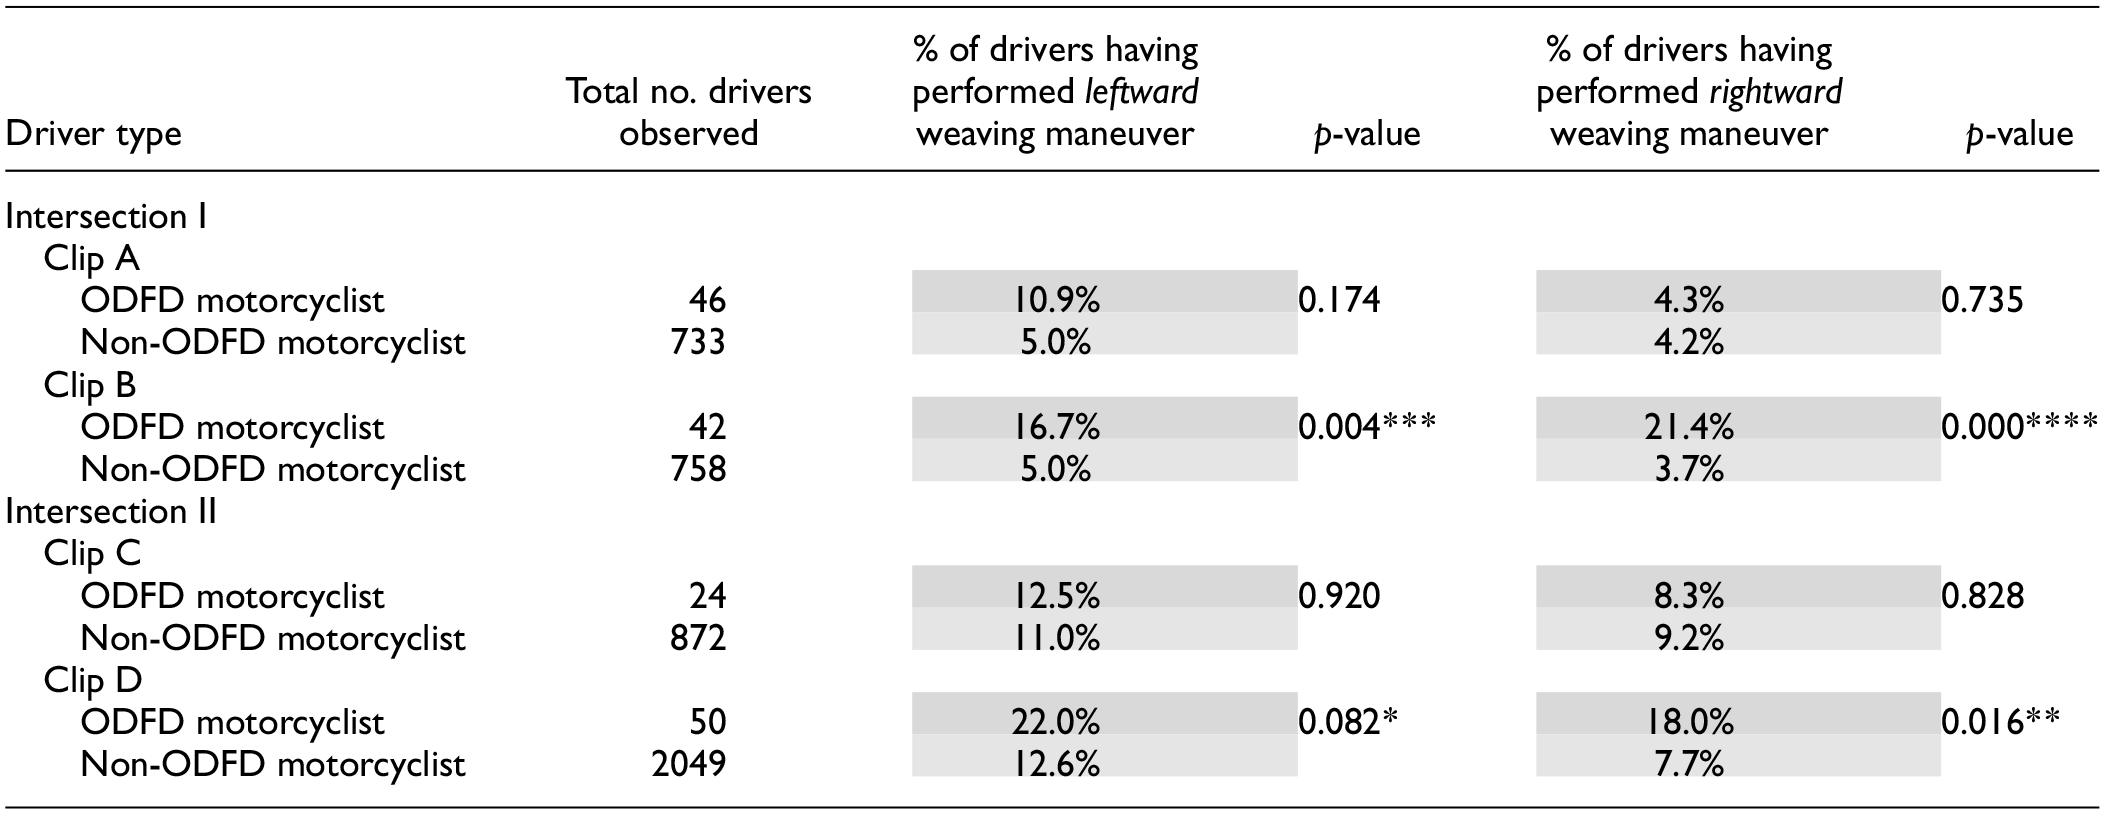
Note:*means difference significant at the 0.1 level; **at the 0.05 level; ***at the 0.01 level; ****at the 0.001 level. Values in darker cells mean higher weaving maneuver frequencies (greater aggressiveness).
To conclude the analysis of weaving maneuvers, we highlight three findings. Firstly, ODFD motorcyclists can perform more aggressive and risky driving behaviors, as represented by higher frequencies of weaving maneuvers. Secondly, they could be more aggressive during meal-peak hours when the incentive program potentially occurs. Thirdly, during meal-peak hours, ODFD motorcyclists could have a stronger tendency to perform weaving maneuvers on right-hand curves, which are deemed more dangerous ( 46 ).
Vehicle-Following Behavior
In total, 11,984 following–leading relationships were identified over the data collection period. Among them, ODFD motorcyclists generally maintained shorter safety gaps and presented shorter TTC than non-ODFD motorcyclists. As shown in Table 7, the differences in median safety gaps at the two intersections are both statistically significant. At Intersection I, ODFD motorcyclists had a median safety gap of 1.630 m, which was shorter than the 2.092 m maintained by non-ODFD motorcyclists (p < 0.001), while at Intersection II, ODFD motorcyclists had a median safety gap of 3.512 m, shorter than the 6.316 m of non-ODFD motorcyclists (p = 0.002). With respect to TTC, at Intersection I, the median TTC presented by ODFD motorcyclists (2.925 s) was shorter than that by non-ODFD motorcyclists (3.744 s), and the difference is statistically significant (p = 0.003). On the other hand, at Intersection II, the TTC presented by ODFD motorcyclists (3.929 s) was slightly greater than that of non-ODFD motorcyclists (3.887 s), but the difference is not statistically significant (p = 0.108).
Road Intersection-Wise Comparison of Median Safety Gap and Time-to-Collision (TTC) Between On-Demand Food-Delivery (ODFD) and Non-ODFD Motorcyclists
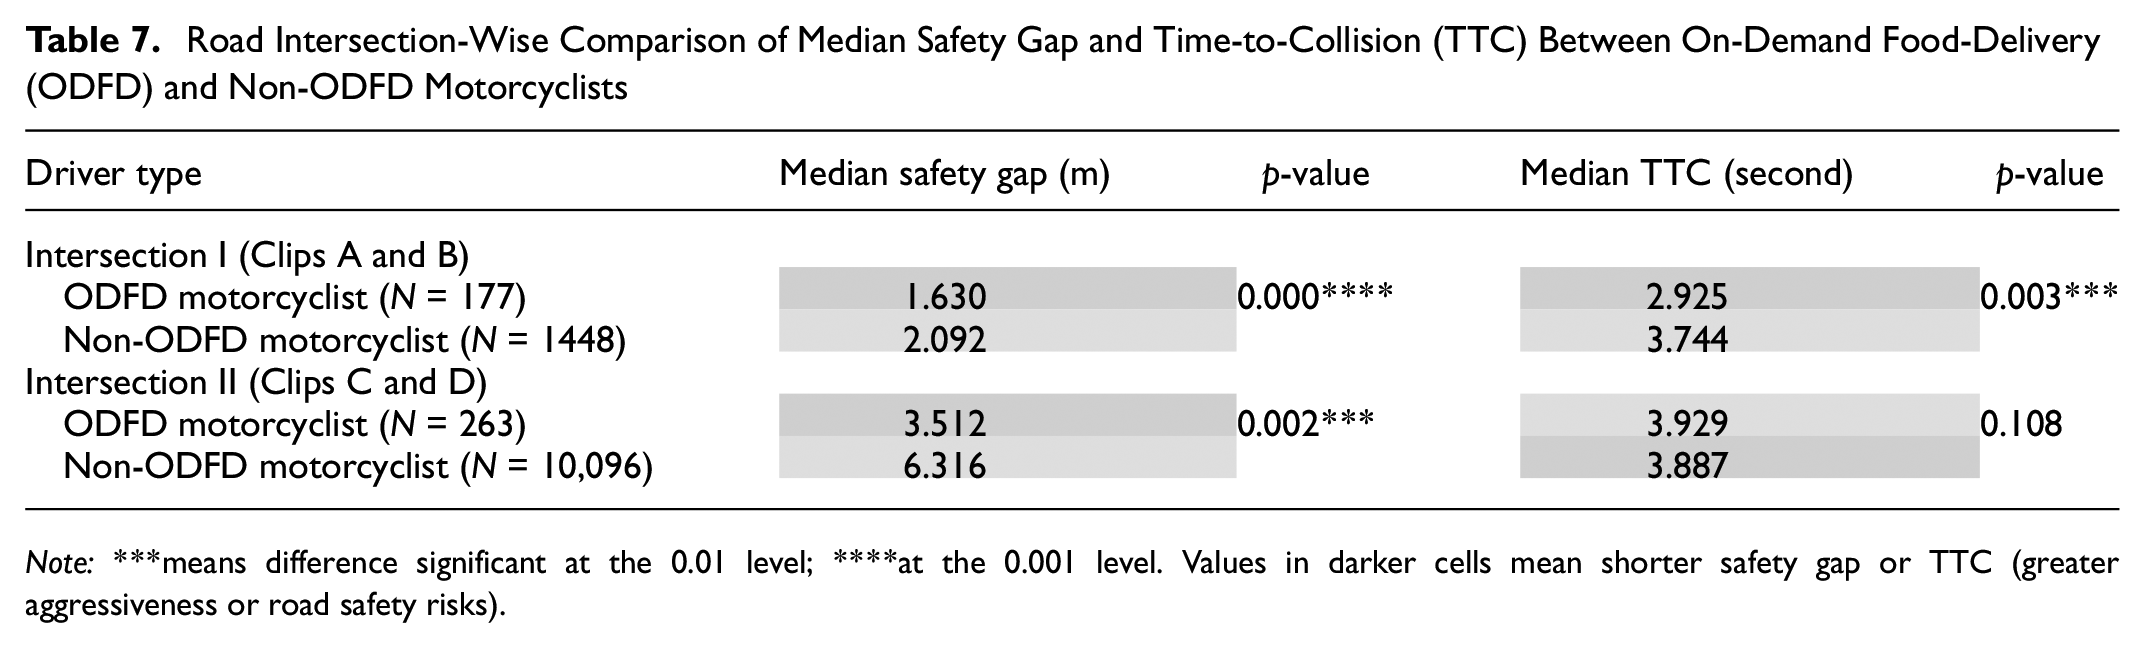
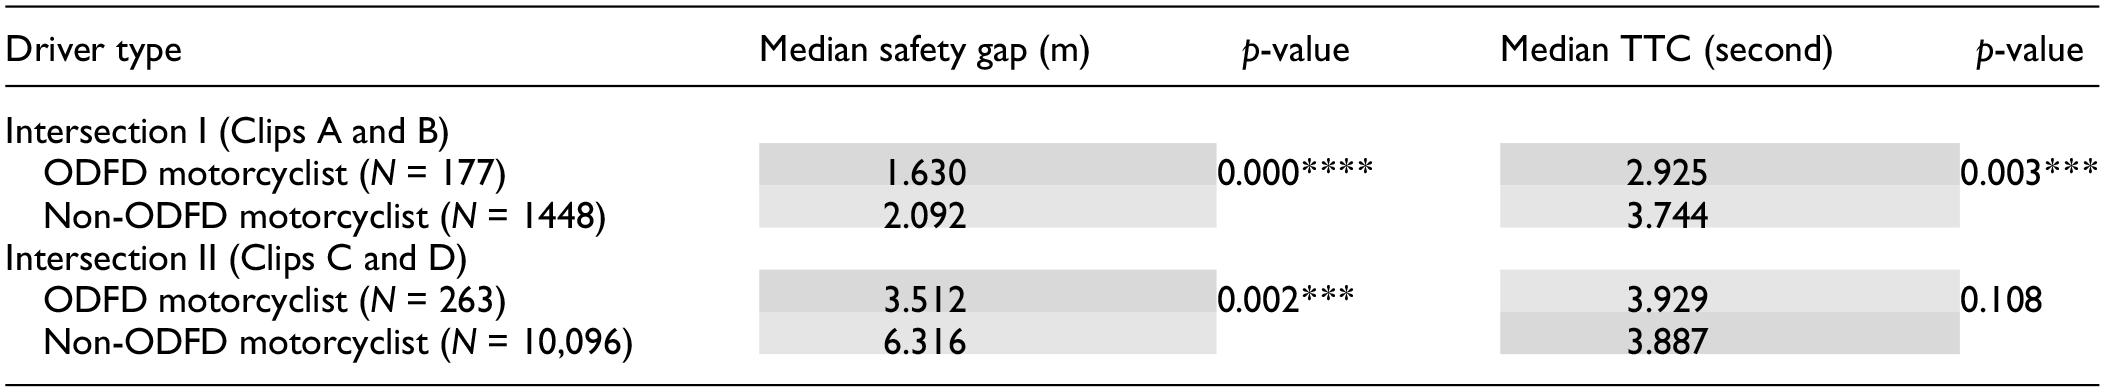
Note:***means difference significant at the 0.01 level; ****at the 0.001 level. Values in darker cells mean shorter safety gap or TTC (greater aggressiveness or road safety risks).
Based on the video clip-wise analysis (Table 8), the differences in the median safety gap and TTC during meal-peak hours are all statistically significant. For each clip, the median safety gap maintained by ODFD motorcyclists was shorter than that of non-ODFD motorcyclists, but only the differences during meal-peak hours are statistically significant, that is, clip B (p = 0.000) and clip D (p = 0.005). It should, however, be noted that during non-meal-peak hours, while ODFD drivers did not present statistically significantly shorter safety gaps in clip C (p = 0.111), they did so in clip A (p = 0.041).
Video Clip-Wise Comparison of Median Safety Gap and Time-to-Collision (TTC) Between On-Demand Food-Delivery (ODFD) and Non-ODFD motorcyclists
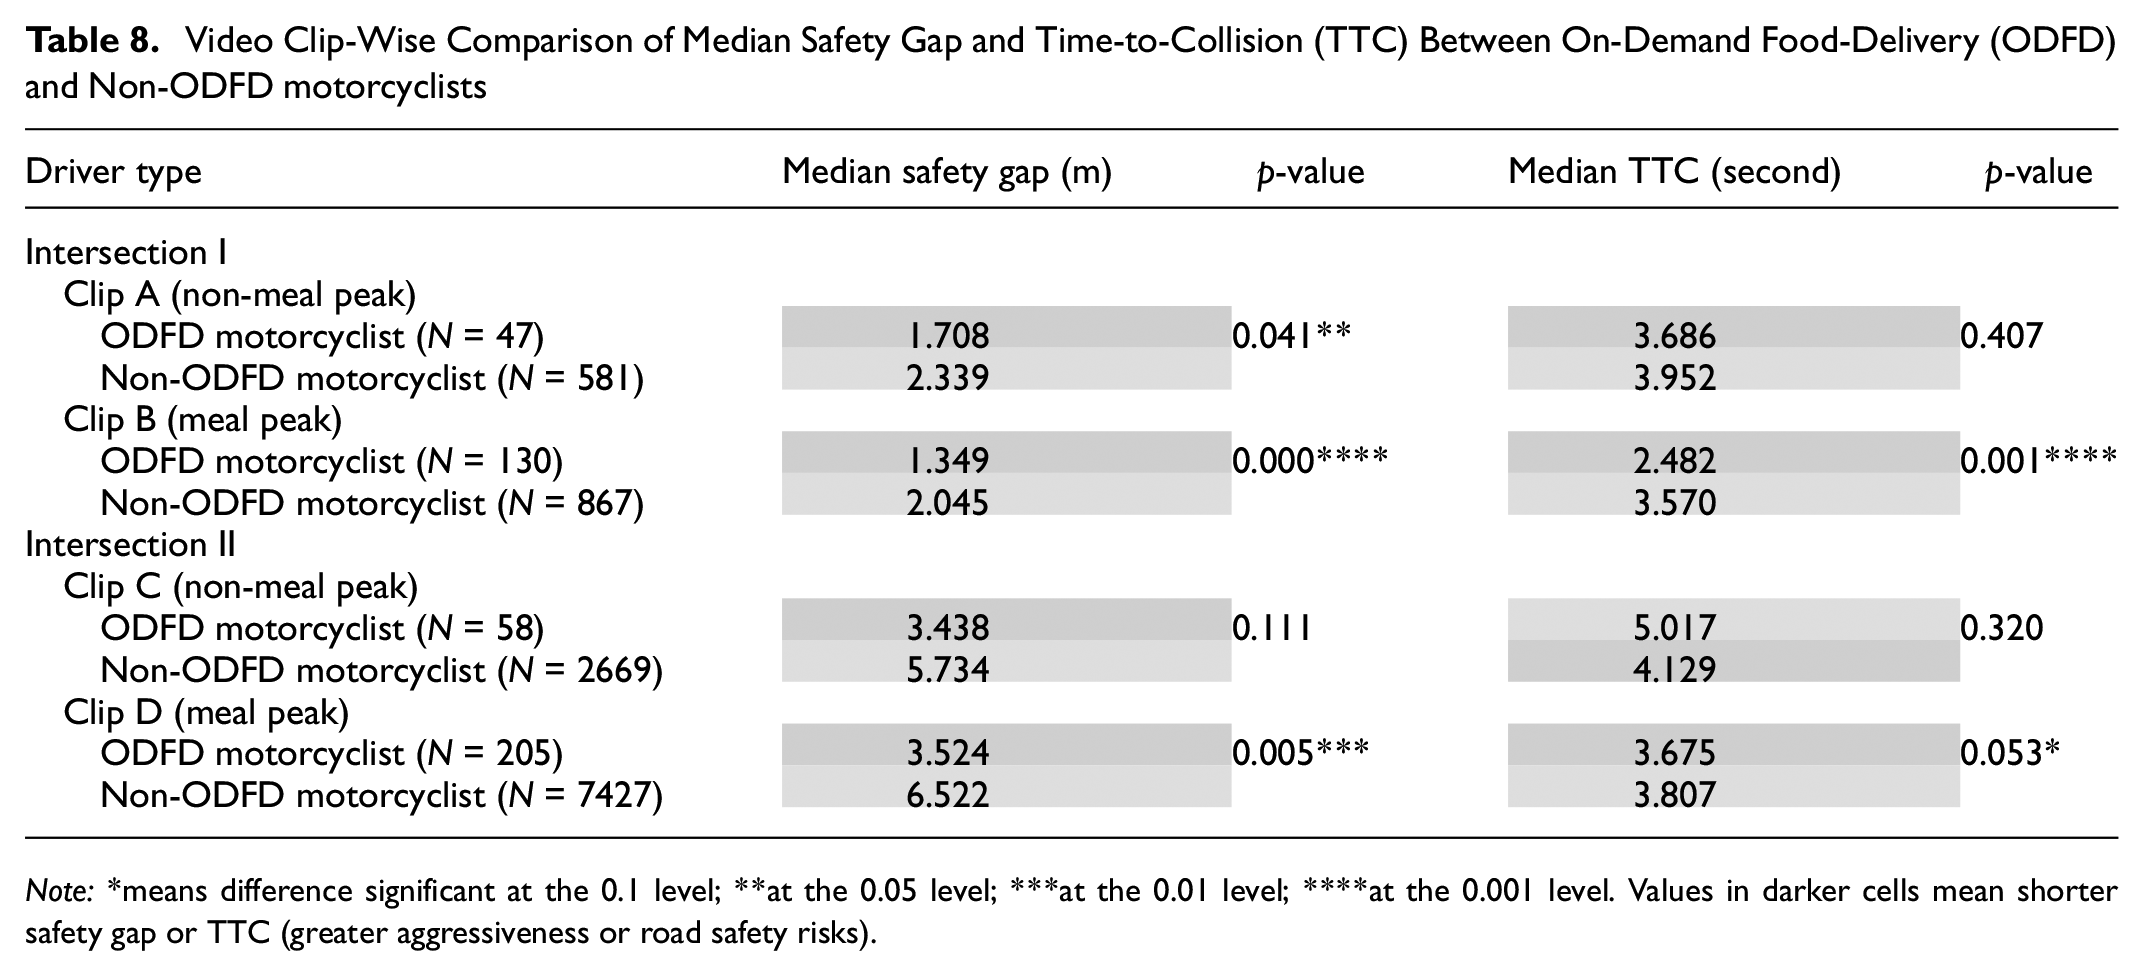
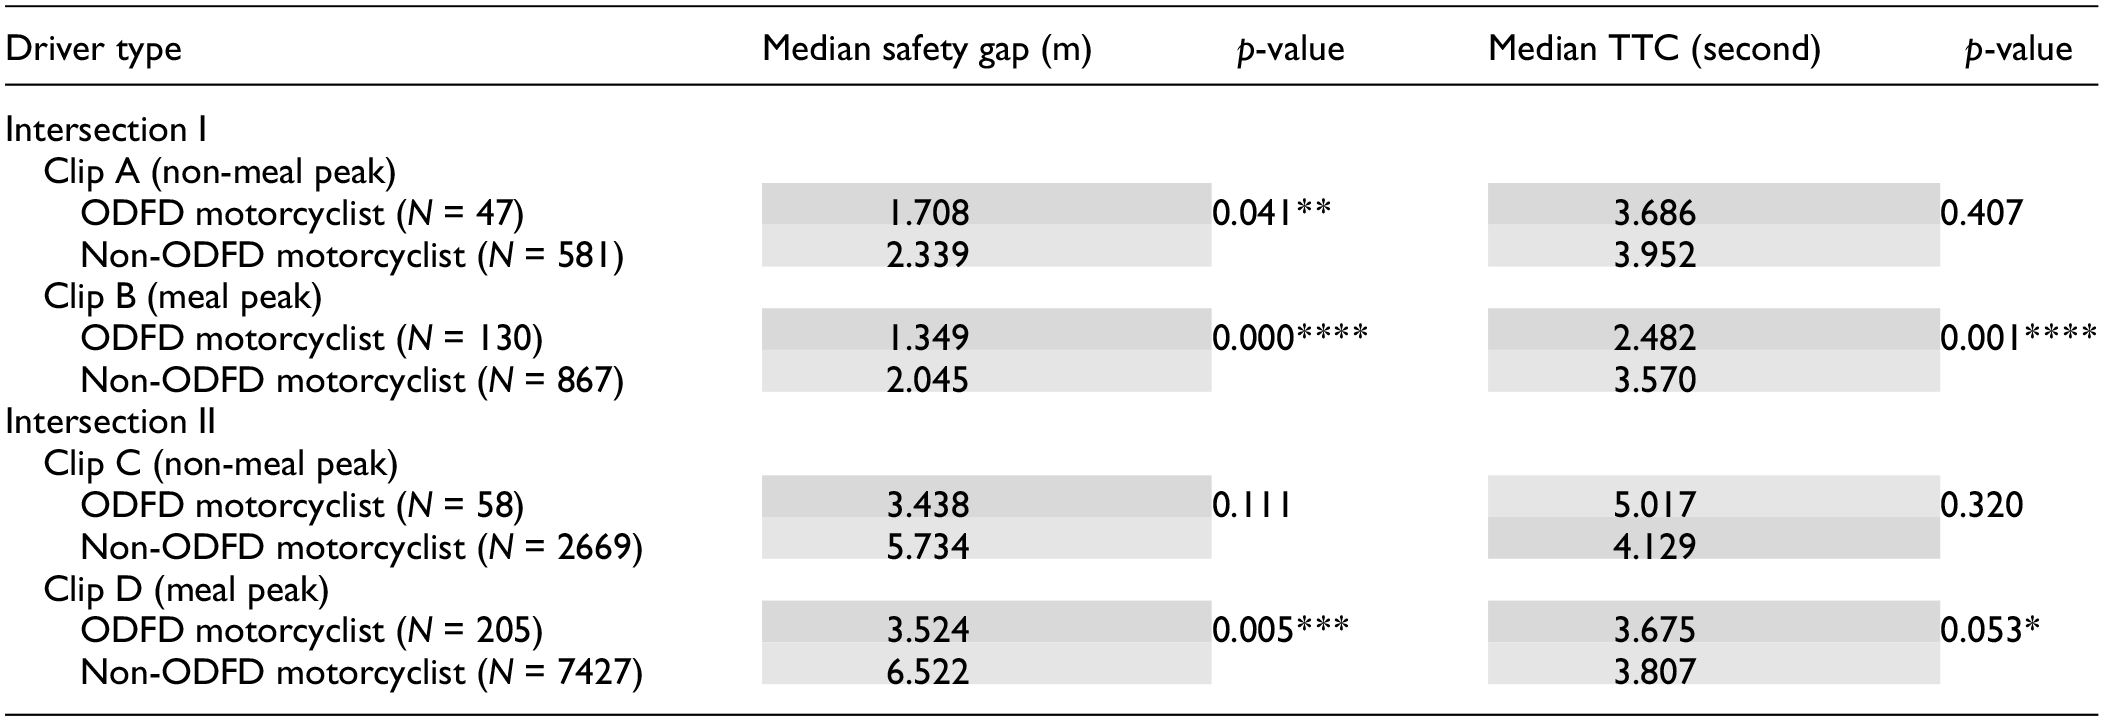
Note:*means difference significant at the 0.1 level; **at the 0.05 level; ***at the 0.01 level; ****at the 0.001 level. Values in darker cells mean shorter safety gap or TTC (greater aggressiveness or road safety risks).
With respect to TTC, the findings also suggest a tendency among ODFD motorcyclists toward presenting shorter TTC during meal-peak hours. At Intersection I, the differences between ODFD and non-ODFD motorcyclists are statistically significant in clip B (p = 0.001), but not in clip A (p = 0.407). Similarly, at Intersection II, the differences between ODFD and non-ODFD motorcyclists are statistically significant in clip D (p = 0.053), but not in clip C (p = 0.320).
Similar to the findings on the analysis of weaving maneuvers, ODFD motorcyclists could generally present greater aggressiveness (as indicated by shorter safety gaps and TTC), especially during meal-peak hours. We found that ODFD motorcyclists generally maintained shorter safety gaps and presented TTC than non-ODFD motorcyclists. Since a shorter safety gap can mean greater aggressiveness ( 48 ), this research concludes that ODFD motorcyclists can be more aggressive than non-ODFD motorcyclists. Also, they can become even more aggressive during meal-peak hours when the incentive program potentially occurs, echoing the previous research based on qualitative data ( 4 , 20 , 23 ). As for TTC, although a shorter TTC cannot directly translate into greater aggressiveness because it is not intentionally maintained by a driver, a shorter TTC represents a relatively greater road safety risk ( 49 ). This suggests that ODFD motorcyclists’ driving behaviors can be riskier.
Conclusions
This research aims to employ naturalistic traffic data to empirically characterize the aggressive driving behaviors among ODFD motorcyclists, a vulnerable occupational group emerging in the gig economy across the globe. We conducted three types of analyses: (i) microscopic kinematic characteristics, (ii) weaving maneuvers, and (iii) vehicle-following behavior. By analyzing and comparing microscopic kinematic characteristics and vehicular interactions among different driver groups in Taiwan, we fill a research gap in the current body of literature, where field-based evidence is scarcely present. To our knowledge, this research is the first study using naturalistic traffic data to investigate the road safety and driving behavior of ODFD motorcyclists.
With a large, fine-resolution traffic dataset, we found that ODFD drivers can at times be more aggressive than other driver groups, in line with the current literature. Yet, we further show that ODFD drivers present more aggressiveness during meal-peak hours, potentially because they tend to be incentivized by temporary pay rate surging and strive to complete their jobs in time to increase earnings and avoid negative ratings from the customers and the gig platform companies.
This research provides three major contributions. Firstly, this research is a timely response to the road safety issues emerging in the gig economy. As globally evidenced amid the COVID-19 pandemic, the ODFD industry is prosperous and could continue to grow in the post-pandemic era. Since motorcycle-based gig services are rapidly developing globally, our findings grounded in a motorcycle-dominant city in Taiwan could inform policymaking for other cities that might see motorcycle-based ODFD and other relevant gig services. Secondly, we employed innovative data collection and processing methods and gathered fine-resolution two-dimensional naturalist traffic trajectory data, enabling the analysis of motorcyclist behaviors on a two-dimensional basis. Otherwise, the effects of subtle lateral movement without lane-changing could have been hardly examined, but they are fundamental in investigating motorcyclists’ driving behavior because of the weak lane disciplines. Thirdly, policy implications can be drawn from this research by regulative bodies. For example, the local government can regulate how platform companies employ incentive programs that ensure enough labor supply in the ODFD market, yet at the cost of public and occupational road safety. The platform companies are also urged to develop safety training programs to instruct their contractor drivers in smooth and safe driving.
Some future research directions are recommended. Firstly, further work can gather videography data in link traffic, supplementing our findings based on intersection traffic. This can help capture aggressive behaviors in relatively free-flow traffic, where one can observe more weaving maneuver events, as well as other aggressive behaviors not covered in this research (e.g., speeding, driving in undesignated zones, tailgating, filtering, and splitting). This is critical, as examining a wide array of aggressive driving behaviors can help policymakers to incorporate different countermeasures. Secondly, future work can employ different data collection methods to characterize in detail aggressive behaviors and their causes. For example, future research can recruit motorcyclists to carry wearable Global Positioning System (GPS) sensors (to collect GPS coordinates) and accelerometers (to collect kinematic characteristics). Compared to aerial videography data, these on-the-ground data can capture more nuanced and detailed causes of aggressive driving behaviors. Another example is to ascertain the exact timings when the incentive program initiates during the data collection period, although it can be technically difficult because of the dynamic nature of algorithm-adjusted pay rates. Thirdly, further work can include more diverse research sites to enrich the geographical representation in the body of relevant literature. Although this research, grounded in Taiwan, could draw conclusions generalizable to places with motorcycle-dense mixed traffic, for example, Southeast Asian cities, places with different traffic conditions may however present different findings, thus requiring further investigations based in other locales. Finally, future research can categorize ODFD drivers by platform, given that its research location has platform companies operating in different business models. For example, in China, whereas Meituan takeout and Eleme adopt dynamic pricing strategies, Baidu takeout employs a static pricing strategy ( 52 ). As the business models employed by gig platforms could be increasingly diversified, it is critical to analyze the impacts of different business strategies on the driving behaviors and road safety of ODFD drivers, a vulnerable occupational group emerging worldwide.
Footnotes
Acknowledgements
We would like to thank the Institute of Transportation, The Ministry of Transportation and Communications (MOTC), Taiwan, for permitting us to utilize UAV aerial videos and data in this research. The data were sourced from the project “Application Scenarios and Pilot Run of Vehicle and Pedestrian Traffic Flow Information Using UAV Aerial Videography,” conducted by the Institute of Transportation in 2021–2023.
Author Contributions
The authors confirm contribution to the paper as follows: study conception and design: C.-K. Hsu, T.-C. Lee; data collection: K.I. Wong; analysis and interpretation of results: C.-K. Hsu, T.-C. Lee, K.I. Wong; draft manuscript preparation: C.-K. Hsu. All authors reviewed the results and approved the final version of the manuscript.
Declaration of Conflicting Interests
The author(s) declared no potential conflicts of interest with respect to the research, authorship, and/or publication of this article.
Funding
The author(s) received no financial support for the research, authorship, and/or publication of this article.