
Abstract
Understanding the impacts of different driving conditions on truck speed is critical to the development and maintenance of resilient highway freight transportation systems. This study attempts to evaluate the combined impact of road weather, travel lane, vehicle type, and truck payload conditions on drivers’ speed choice by modelling speed distributions as normal distributions. Two data analytics, a regression-based approach (RBA) and a central limit theorem (CLT)-based approach (CBA), are adapted to model context-specific speed distributions. The regression-based approach models population-level speed distributions by considering samples of individual speed data, whereas the CBA uses sampling distributions produced according to the CLT. A holistic approach is proposed to identify overall vehicle-specific collision risks imposed by different road-weather conditions, based on the speed distribution parameters estimated. Implications of the study results pertaining to the trucking industry are threefold. First, adapting different data analytics leads to different study results; yet, the CBA is recommended to model speed distributions. Second, truck speeds are significantly affected by the presence of adverse road-weather conditions, yet marginally varied under different loading conditions. Third, overall, tractor–trailer combinations (TTCs) entail high collision risks, particularly when transporting a freight load under adverse road-weather conditions. The study results would be useful to policymakers, particularly for effective speed management in extremely cold regions. Trucking companies may use the study results to identify the least risk-posing road-weather conditions to deploy safe freight transport operations. The resulting speed distribution models are also useful as input to calibrate traffic micro-simulation models.
Keywords
Adverse road weather is often perceived as a risk to highway freight transportation systems ( 1 ) for several reasons. For example, maneuvering freight transport trucks (“trucks” hereafter) in winter storms can be challenging because of their vehicle characteristics ( 2 ) such as size, weight, structure, and vehicle performance attributes (e.g., braking, acceleration, off-tracking). Although truck drivers are compelled to drive slow under inclement road-weather conditions, it is hypothesized that drivers’ speed choice is dictated by (i) prevailing road-weather ( 3 – 7 ), (ii) vehicle type (3, 4, 6–8), (iii) travel lane ( 3 , 8 ), and (iv) personal traits such as mood and driving experience. ( 9 ). Payload hauled—the mass of commodity hauled by a truck ( 10 )—is perceived as a safety concern by truck drivers ( 11 ) and thus may also affect truck drivers’ speed choice. For example, a truck driver driving an empty single-unit truck may choose to drive at 120 km/h in a dry-pavement shoulder lane, while the same driver may reduce speed to 80 km/h when driving a loaded multi-trailer truck (L-MTTs) on an icy-pavement median lane. In fact, speed choice is idiosyncratic, and each driver representing the population of truck drivers may therefore select a unique speed from a pool of context-specific speeds. Such divergent speed choices may increase within- and across-lane speed variation, which are well acknowledged crash precursors associated with increased crash potential ( 12 ). Thus, understanding the impact of different factors on truck drivers’ speed choice is critical in establishing resilient freight transportation systems, particularly in extremely cold regions.
While the choice of speed is intuitive under certain settings, the combined effect of several speed-decisive factors (e.g., road-weather conditions, truck type, truck payload, and travel lane) on truck drivers’ speed choice can be comprehensive. In fact, speed data can be highly variable as they represent interactions of many factors ( 8 ). Advanced automated traffic-data-collection techniques practiced today (e.g., loop detectors) enable reliable collection of vehicle-by-vehicle speed data ( 13 ), leading to large speed data sets. Accordingly, modelling population-level speed distributions is recommended in exploring the impacts of different driving conditions on drivers’ speed choice to effectively identify speed patterns present in such versatile and large speed data sets ( 5 ). Although several data analytics exist to model population-level speed distributions (“speed distributions” hereafter), the modelling results may be influenced by (i) the analysis approach and (ii) data-treatment methods (e.g., definition of sample) adapted. Thus, we identify the need to evaluate the suitability of different statistical inference techniques to explore the impacts of different driving externalities, such as prevailing road-weather conditions and vehicle type, on drivers’ speed.
In this work, we intend to study drivers’ speed choice under four driving conditions: road weather, vehicle type, truck payload, and travel lane. The aforementioned driving conditions are referred to as speed-decisive factors hereafter. First, we hypothesize that the speed choice of the population of drivers is dependent on the speed-decisive factors. Second, we assume that an increased within- and across-lane speed differential leads to higher collision potential within and across lanes. This paper focuses on four research questions (i) What is the combined impact of road-weather, vehicle type, truck payload, and travel lane on drivers’ speed choice? (ii) Does the data analytic approach adapted influence desired speed distribution parameters? (iii) To what level are trucks vulnerable under adverse road-weather conditions? (iv) Which speed-decisive factors increase collision potential for trucks? These four research questions are addressed by three study objectives: (i) to model desired speed distributions under different combinations of road-weather, vehicle type, truck payload, and travel lane conditions, (ii) to investigate the variability of modelling speed distributions based on different data analytics, and (iii) to propose a holistic approach to identify vehicle-specific collision risks imposed under different road-weather conditions based on the distributions of within- and across-lane speed differentials.
Traffic and road-weather data collected on an uncongested segment of highway 16 located west of Edmonton, Canada, are used to model desired speed (“speed” hereafter) distributions. The speed distributions are modelled as normal distributions characterized by (i) mean (
RBA: In the RBA, a set of multiple linear regression models are developed to model speed distribution parameters
CBA: The CBA, as proposed by Yasanthi et al. (
5
), attempts to model
A unified approach is proposed to identify vehicle-specific collision risks under different road-weather conditions based on the speed distribution parameters
Background and Literature Review
Several past studies have modelled drivers’ speed choice as a function of different speed-decisive factors ( 3 – 8 ). For instance, by developing free-speed distributions, Hoogendoorn ( 8 ) revealed that trucks travel faster in the median lane; yet, they travel much slower than passenger cars regardless of the travel lane. Aggregating passenger cars and trucks resulted in asymmetry in the speed distribution for the median lane developed by Hoogendoorn ( 8 ), emphasizing the impact of vehicle class on speed distributions. Speed distributions produced by Catbagan and Nakamura ( 6 ) revealed that road-weather conditions have significant impacts on heavy vehicles’ speed, especially while following similar heavy vehicles. Adverse pavements, such as slippery road surface conditions resulting from weather events ( 3 , 4 ), and snow ( 3 , 6 , 7 ) were found to have significant impacts on truck speed. While Yasanthi et al. ( 5 ) stresses on the significant impact of the combined effect of adverse pavement, and precipitation conditions on speed, they concluded that time of the day or atmospheric temperature do not significantly influence speed distribution parameters. While estimating the impacts of different road-weather conditions on speed, only a limited number of studies ( 3 , 5 , 7 ) used road-weather information systems (RWIS) to collect road-weather data nearby to traffic-data-collection devices.
Past literature ( 14 – 16 ) also identified road grade—the ratio of rise (or drop) in the vertical distance to the horizontal distance—as a significant factor among different roadway geometric characteristics affecting speed. For instance, Hamdar et al. ( 14 ) showed that, for passenger cars, the impacts of the presence of frequent changes in road grade may be more severe than the impacts of adverse road-weather conditions. By evaluating the impact of road grade on free-flow speeds, Chen et al. ( 15 ) concluded that road grade is negatively associated with drivers’ speed choice. In fact, the impacts of upslope segments (i.e., positive slopes) on drivers’ speed choice were deemed more influential than that of downslope segments ( 15 ). Further, it is documented that drivers tend to reduce speed ahead of vertical curves with short sight distances ( 16 ).
The intensity of speed reductions resulting from different driving conditions seem to vary among past studies. For example, when compared with normal road- weather, Yasanthi et al. ( 5 ) estimated a speed reduction factor of 2.68% for vehicles travelling on wet pavements in daytime under heavy snow, and a temperature of 5°C, while the Highway Capacity Manual ( 17 ) recommends a speed reduction factor of 16% for comparable road-weather conditions. While such differences are predominantly attributed to adapting different data analytics ( 5 ), some authors argue that the number of speed-decisive factors considered in each study may also cause such controversies ( 3 ). We recognize that adapting different data treatment methods to study drivers’ speed choice may also limit each study to a confined analysis level. For example, using descriptive statistics to explain drivers’ speed choice under different road-weather conditions ( 17 ) conveys sample-specific observations. Although popular, regression modelling with individual vehicle speeds as a dependent variable is deemed controversial in modelling the impacts of different driving conditions on speed for several reasons ( 5 ). For example, it is argued that some drivers may not perceive adverse road-weather as a substantial hazard-risk ( 17 ); thus, the average speed reductions suggested by regression models’ estimates might not reasonably reflect the impact of road-weather conditions on the speed choice of such drivers ( 3 , 5 ). To address such issues, past studies have suggested comparing speed distributions under different driving conditions ( 5 , 6 , 8 ) rather than apprehending the impacts of different driving conditions on speed based on average speed reductions suggested by regression models’ estimates. Literature suggests several approaches to estimate speed distribution parameters ( 5 – 7 ). For example, Hoogendoorn ( 8 ) and Catbagan and Nakamura ( 6 ) used Kaplan–Meier estimation to model lane- and vehicle-specific desired speed distributions; yet, application of this methodology is restrained under limited sampling conditions because of a high standard error associated with small samples ( 6 ). Moreover, speed distributions developed by Hoogendoorn ( 8 ) and Catbagan and Nakamura ( 6 ) do not infer population parameters. In contrast, Yasanthi et al. ( 5 ) proposed a methodology to estimate population-level speed distribution parameters based on the CLT and MVUE regardless of the sampling condition. Yet, it is important to note that findings of Yasanthi et al. ( 5 ) are controlled for the impact of traffic conditions and vehicle type.
Despite controversial conclusions about road-weather-specific speed reduction factors, most past studies ( 3 – 8 ) support the hypothesis that all speed-decisive factors prompt speed variation to some extent. It is well documented that travelling at speeds significantly different from the average traffic speed increases crash involvement ( 12 , 18 , 19 ). This is rather intuitive because high speed differentials trigger passing maneuvers, particularly for fast drivers who are willing to trade off safety for lesser travel times. By comparing speed distribution parameters under adverse and normal road-weather conditions, Yasanthi et al. ( 5 ) identified combinations of road-weather conditions with high crash severity and high crash exposure for shoulder lane traffic. Yet, across-lane speed differential was not considered as an indication of intensified safety risks. It is important to note that understanding differences between within- and across-lane collision risks considering different vehicle types and road-weather conditions is crucial ( 12 , 19 , 20 ), particularly in weather-responsive speed management.
Figure 1 presents a summary of the reviewed literature and the research gaps identified. First, literature on the extent of the impact of different road-weather conditions on speed is less consistent. Although evaluating road-weather-specific speed distributions is recommended in apprehending road-weather-specific speed choice ( 5 , 6 , 8 ), past literature does not provide a conclusive reference to the most appropriate data-analytics approach (e.g., RBA versus CBA) and data treatment method (e.g., definition of a sample), leading to the second research gap. Third, to the best of our knowledge, the combined impact of road-weather, travel lane, truck type (single- versus multi-trailer), and payload conditions (empty versus loaded) on truck speed has not been studied. Fourth, past literature partially addresses the problem of identifying crash-indicative road-weather conditions when collision statistics are not available. To fill the first three research gaps, we intend to evaluate the combined impact of road-weather, travel lane, vehicle type (focusing on different truck types), and truck payload conditions on speed distribution parameters using (i) RBA and (ii) CBA, with a unique definition of the sample used in each approach. We believe that modelling speed distributions under different driving conditions provides a deeper insight to drivers’ speed choice, rather than estimating average speed reductions under different driving conditions. The fourth research gap is addressed by proposing a holistic approach to identify road-weather conditions with escalated collision risks for different vehicle types based on both within- and across-lane speed differentials.
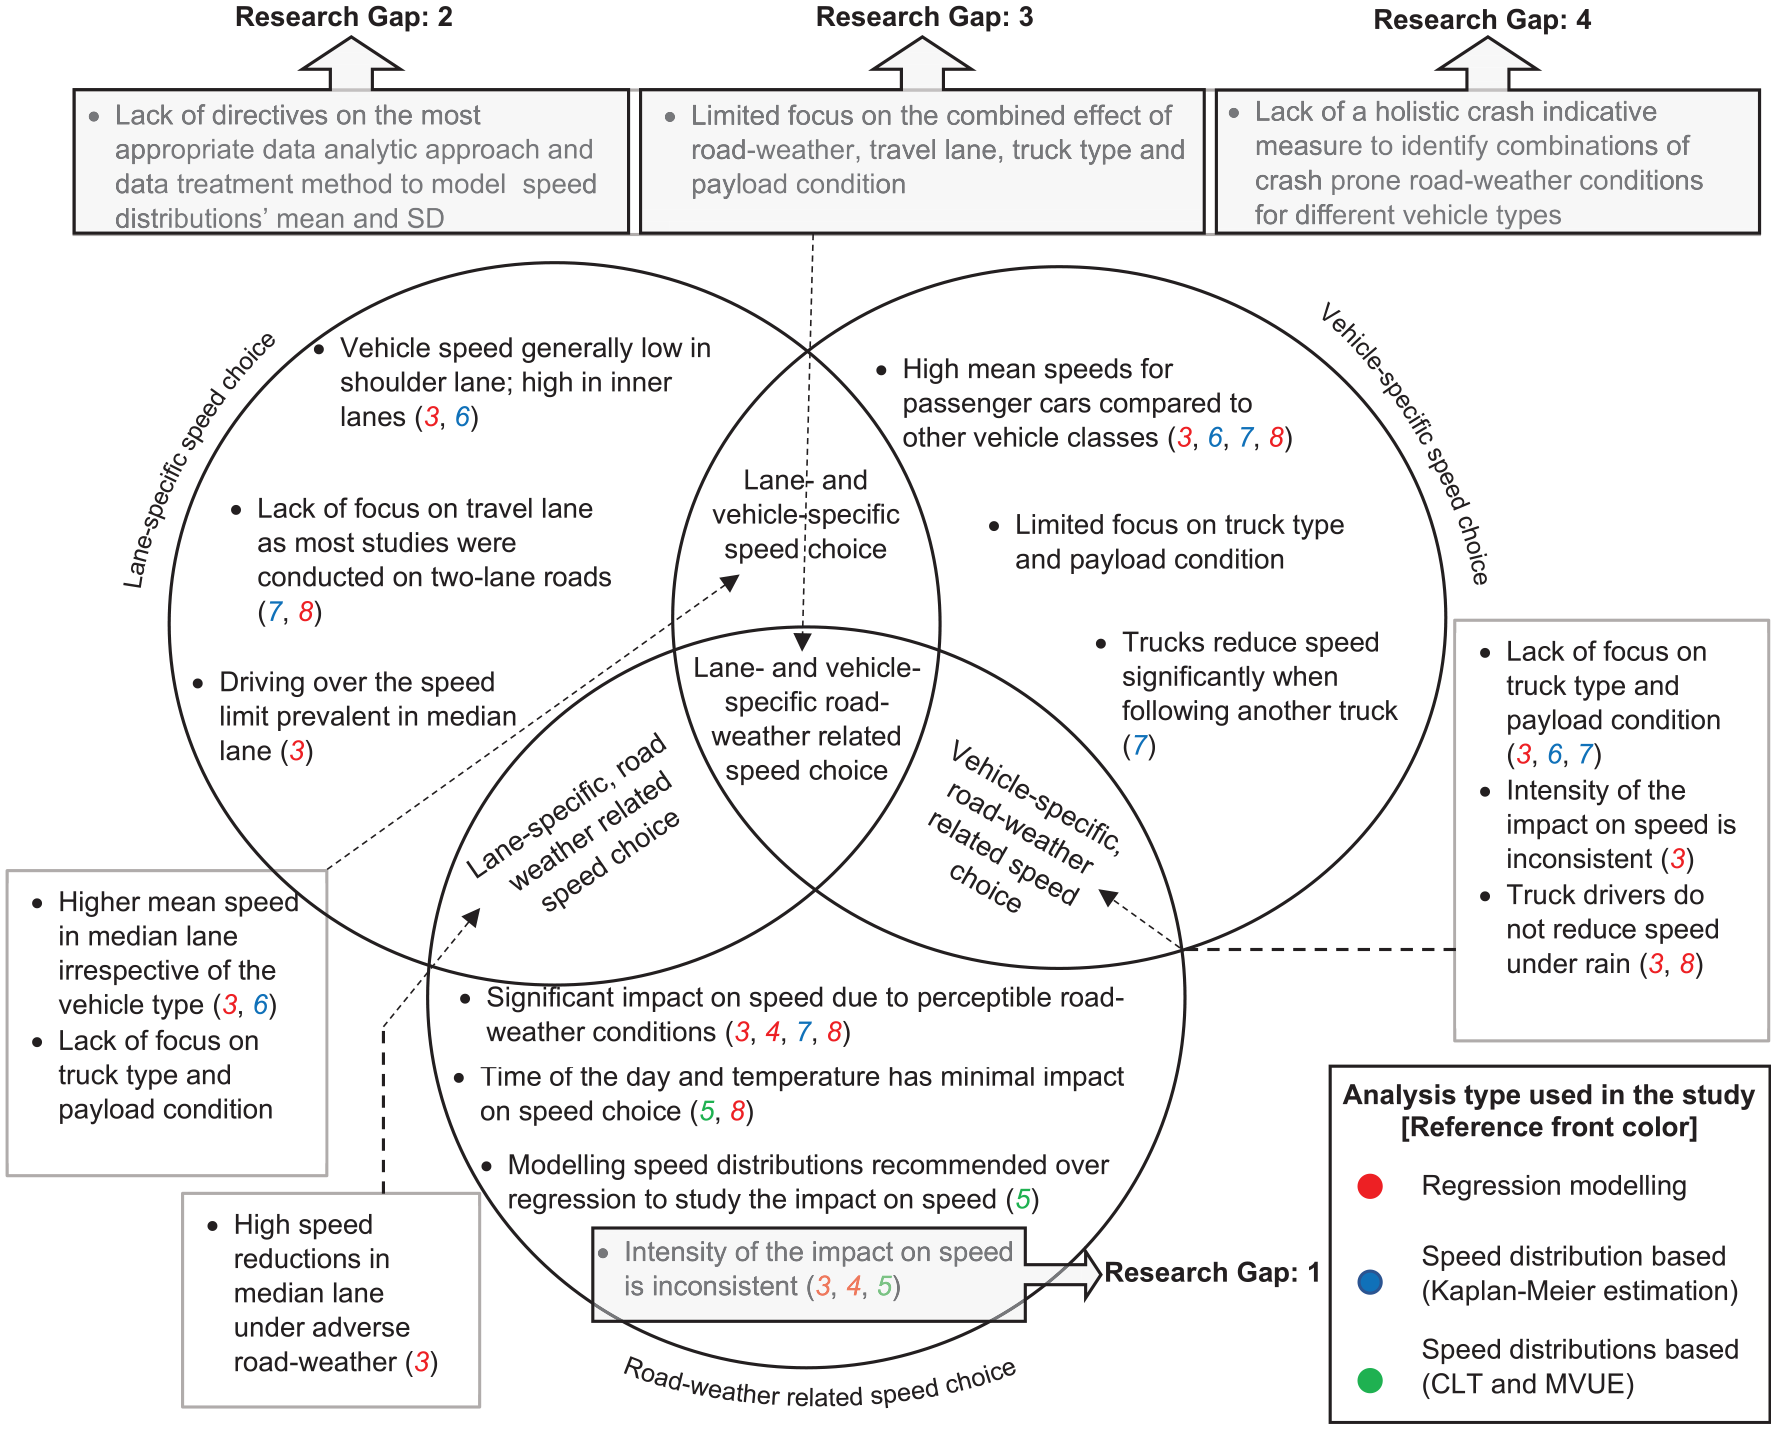
Summary of related literature and research gaps.
Study Data
Data Collection
Study data used in this study consists of road-weather and traffic data, provided by Alberta Transportation. Road-weather and traffic data were collected by a RWIS station and a weigh-in-motion (WIM) station respectively, for 15 months from October 2014 to December 2015. The study site (Figure 2) is located west of Edmonton, Alberta, on a four-lane, divided segment of highway 16—a provincial highway, which is part of yellowhead highway between Jasper and Lloydminister. The study site operates at a fixed speed limit of 110 km/h. According to Alberta Transportation, the annual average daily traffic at the study site in 2015 was 8,120 vehicles ( 21 ). The study site is located on a road section with negligible longitudinal grade and with no appreciable horizontal curves. The site (Figure 2) was selected for this study for two reasons. First, it typically operates under levels of service “A” and “B” (see Figure 2 in Yasanthi et al. [ 5 ])—that is, uncongested; thus, vehicle speeds collected reasonably represent drivers’ desired speed ( 17 ). Second, the RWIS station precisely captures the microclimate data for each vehicle recorded by the WIM station as it is only 148.7 m away from the WIM (Figure 2).
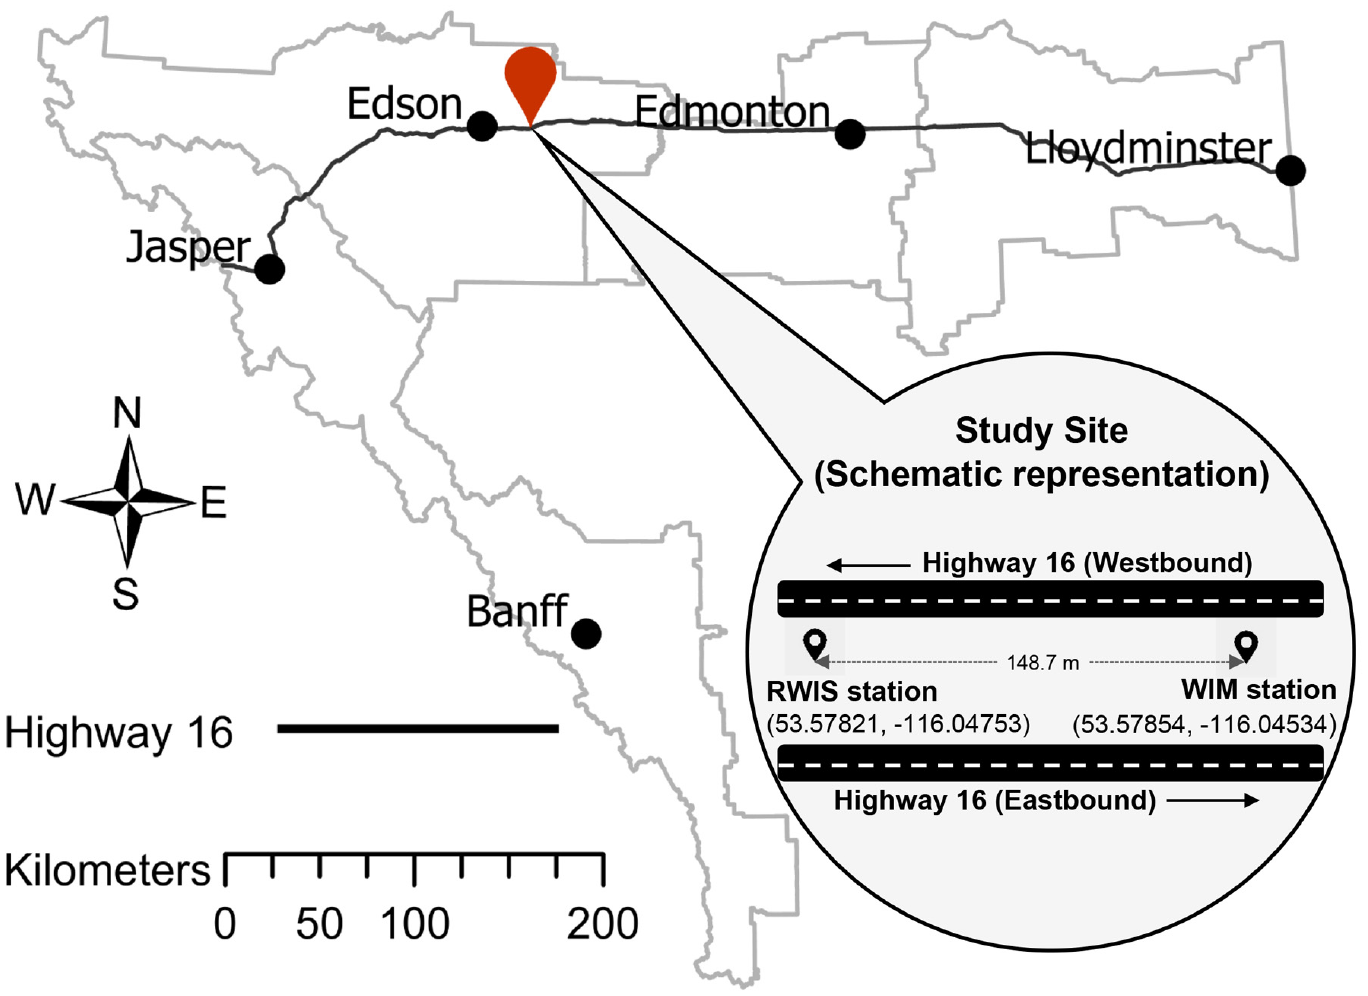
Study site.
The WIM station recorded vehicle-by-vehicle speed, axel weight, inter-axle spacing, and timestamp for each vehicle passing the WIM station. The RWIS station recorded several road-weather attributes including precipitation condition (type and intensity), pavement surface condition, and temperature every 20 min. A recent study by Yasanthi et al. ( 5 ) revealed that the time of day and temperature do not significantly affect speed distribution parameters. Accordingly, this study only focusses on two road-weather attributes: pavement surface and precipitation condition.
Data Preparation
First, the collected data was cleaned by (i) removing “N/A” and “Error” entries in the road-weather data set and (ii) removing vehicle records with “null” speeds and speeds greater than 200 km/h (i.e., considered as error). Thereafter, each vehicle was categorized into one of the 13 vehicle classes proposed in the Federal Highway Administration (FHWA) scheme “F” vehicle classification system ( 22 ). Tractor-Trailer Combinations (TTCs)—trucks belonging to FHWA vehicle classes 8 through 13—were further divided into two categories based on their payload condition. According to Regehr et al. ( 10 ), mean tare weight of a specific truck configuration can be estimated by approximating its gross vehicle weight (GVW) distribution by a Gaussian mixture model (GMM). Accordingly, the mean tare weight for each Tractor-Trailer Combinations (TTC) observed at the study site was estimated by approximating the GVW distribution of each Tractor-Trailer Combinations (TTC) as a GMM. Similar to Regehr et al. ( 10 ), the 99th percentile of the first GMM component was concluded as the tare weight of each Tractor-Trailer Combinations (TTC). The Tractor-Trailer Combinations (TTC) with a GVW more than its tare weight were labelled as “Loaded” or “Empty” otherwise. As a result, the 13 FHWA classes were aggregated into six categories, each representing different vehicle characteristics. A series of Kolmogorov–Smirnov tests conducted between each level of vehicle type, precipitation type, pavement surface condition, and travel lane categories concluded that all levels in each study data category are statistically independent from the rest of levels at a significance level of 5%. Details of different study data categories used in this study are tabulated in Table 1.
Study Data Categories.
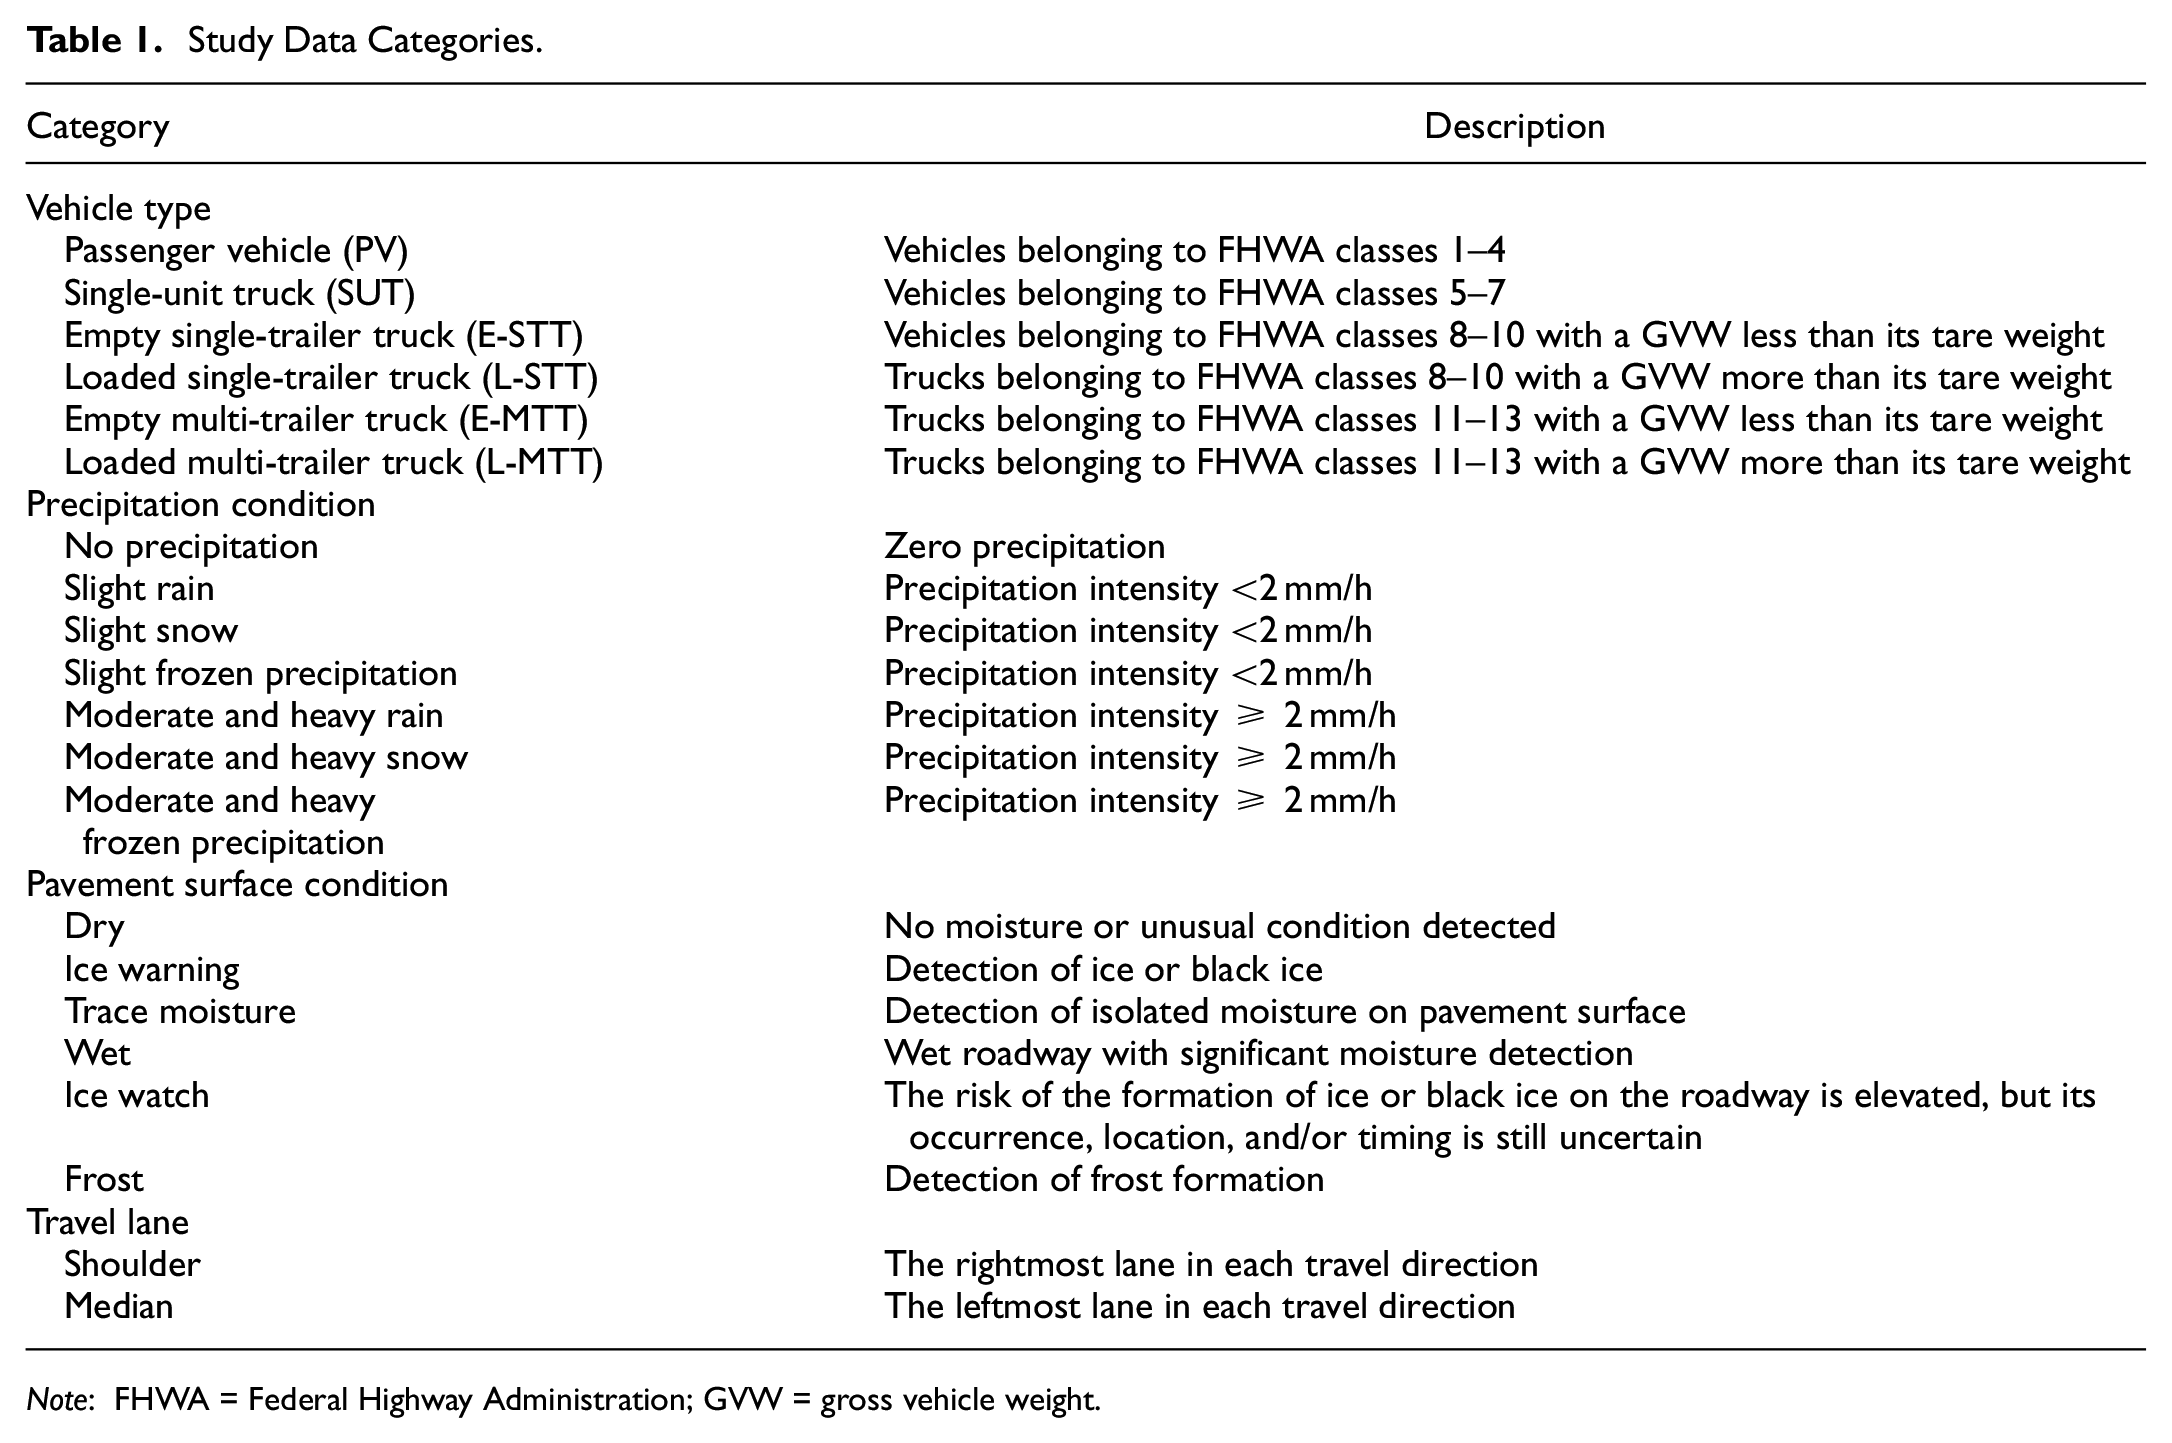
Note: FHWA = Federal Highway Administration; GVW = gross vehicle weight.
Descriptive statistics of the speed data are presented in Figure 3 in regard to mean, SD of speeds and the number of vehicle observations for each combination of study data categories. According to Figure 3, speed is apparently affected by travel lane, vehicle type, and road-weather (the numbers in brackets show the sample size).
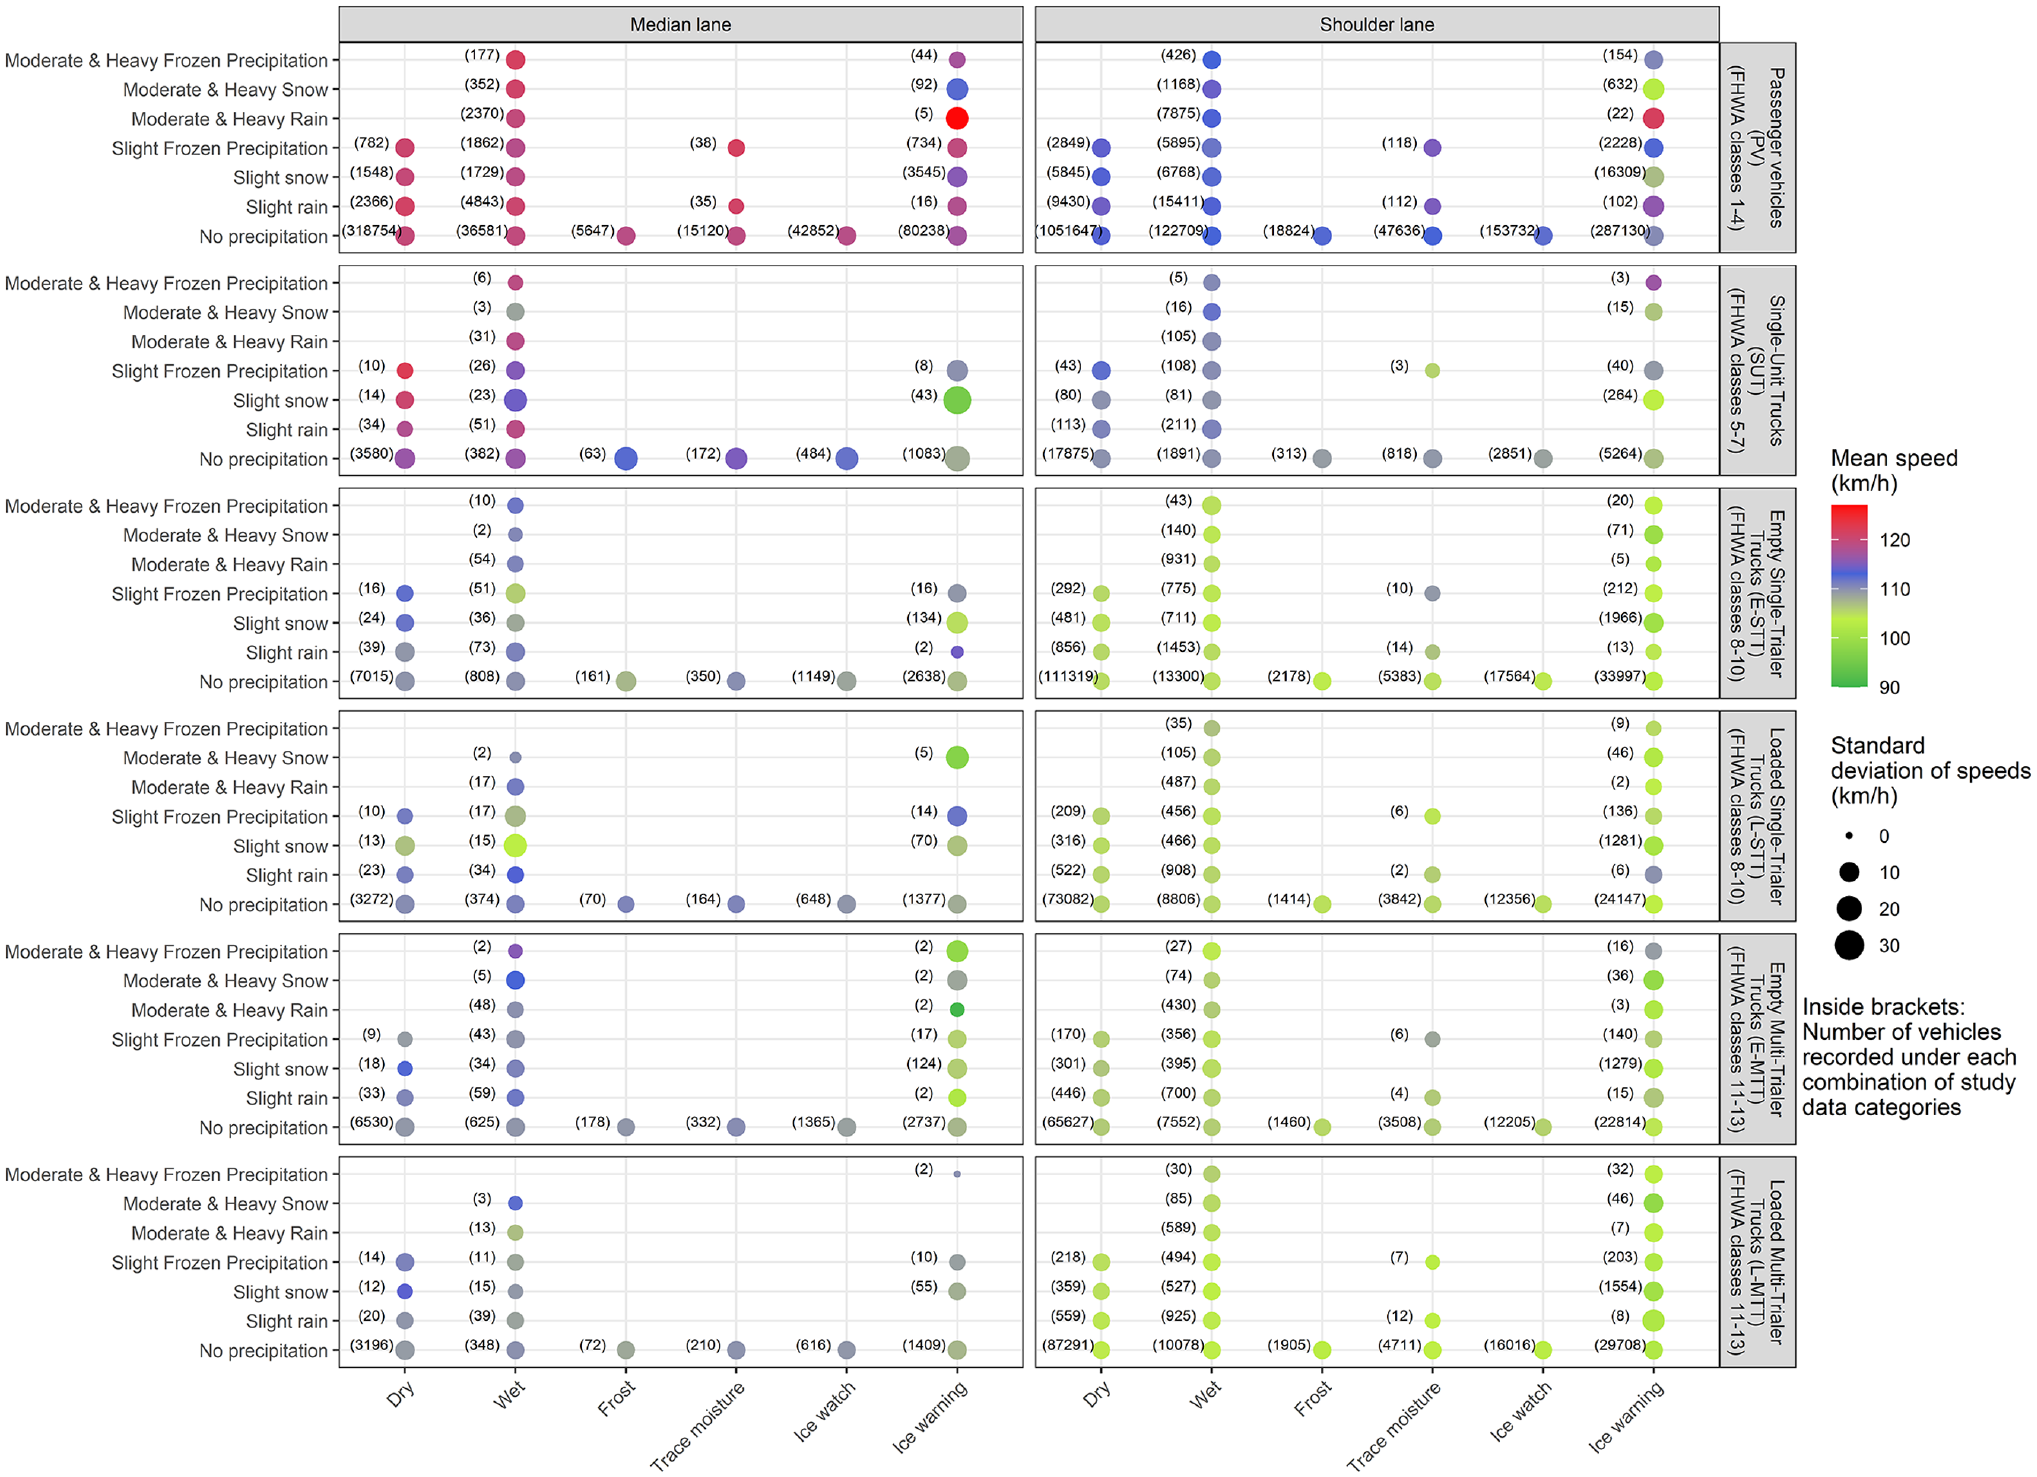
Descriptive statistics of speed data.
As expected, most vehicles seem to travel faster in the median lane regardless of the vehicle type, and prevailing road-weather conditions. Similarly, the higher SD of speeds recorded under all road-weather, and vehicle type combinations in median lane imply comparatively higher speed variations in median lane as compared to the shoulder lane. The significantly higher mean speeds for passenger vehicles (PVs), followed by single-unit trucks (SUTs) signal the importance of differentiating speed distributions by vehicle type. Nevertheless, Figure 3 reports approximately similar mean, and SD of speeds for single-trailer trucks (STTs), and Multi-Trailer Trucks suggesting that TTC speeds might not be affected by the number of trailers attached to a tractor. Overall, the synchrony of snow precipitation (regardless of intensity) and ice warning pavements significantly affect the mean and SD of speeds particularly for PV and SUT travelling in both lanes. Such speed variations imply drivers’ attentiveness while driving under adverse road-weather conditions. Yet, it is important to note that Figure 3 merely exhibits descriptive statistics based on small samples, potentially leading to counterintuitive observations.
Methodology
The methodology proposed to evaluate the combined impact of four speed-decisive factors (road weather, travel lane, vehicle type, and truck payload) on speed consists of two steps. The first step focuses on modelling speed distributions under different combinations of speed-decisive factors. The second step attempts to identify combinations of road-weather conditions posing high collision risks for different vehicle types, based on the speed distributions modelled in the first step.
Modelling Speed Distributions
In this study, speed distributions are modelled based on two assumptions: (i) observed speeds reasonably represent drivers’ desired speeds, and (ii) the population of individual desired speeds under a specific combination of speed-decisive factors can be modelled as a normal distribution characterized by a mean of
Modelling
and
Based on the RBA
“Sample,” in the context of RBA, is defined as individual vehicle speeds observed under a specific combination of speed-decisive factors during the entire study period. For instance, the sample considered for the speed distribution representing PVs traveling in the shoulder lane under no precipitation and dry pavements consists of all individual PV speeds observed under such driving conditions during the study period. To model speed distributions according to RBA, we assume that a speed distribution’s mean

where
Modelling speed distributions using RBA is straightforward. Yet, the explanatory power and statistical significance of model coefficients may vary depending on the samples collected, particularly under small sample sizes.
Modeling
and
Based on the CBA
The CBA applies the approach proposed by Yasanthi et al. (
5
) to estimate
• Step 1: Defining speed populations and samples
In the context of the CBA, a speed population is defined as all collected individual speeds under a specific set of speed-decisive factors. The sample is defined as vehicle speeds collected during a 5-min interval. Two sample statistics, (i)
• Step 2: Producing 5-min aggregate speed distributions (sampling distribution of speed)
According to the CLT, a population of individual desired speeds is represented by a normally distributed 5-min aggregate speed distribution: the sampling distribution of speed ( 5 ). Such 5-min aggregate speed distributions are characterized by unique sample sizes. Yet, because of the definition of the sample adapted in the CBA, a specific population of speeds may encompass several sample sizes. Accordingly, some populations are represented by multiple sampling distributions (see Figure 5 in Yasanthi et al. [ 5 ]). For example, Figure 4 shows a population represented by eight different sampling distributions of observed speeds (the number of sampling distributions k = 8), where M represents the number of 5-min intervals (i.e., samples) contributing to each sampling distribution.
• Step 3: Linear combination of sampling distributions of speed
All
• Step 4: Estimating
According to CLT, the mean (


By estimating speed population parameters using all representative sampling distributions, the CBA is particularly advantageous for investigating the impacts of extreme road-weather conditions in rural highways, where the sample sizes are inherently small because of limited traffic throughput under different adverse road-weather conditions.
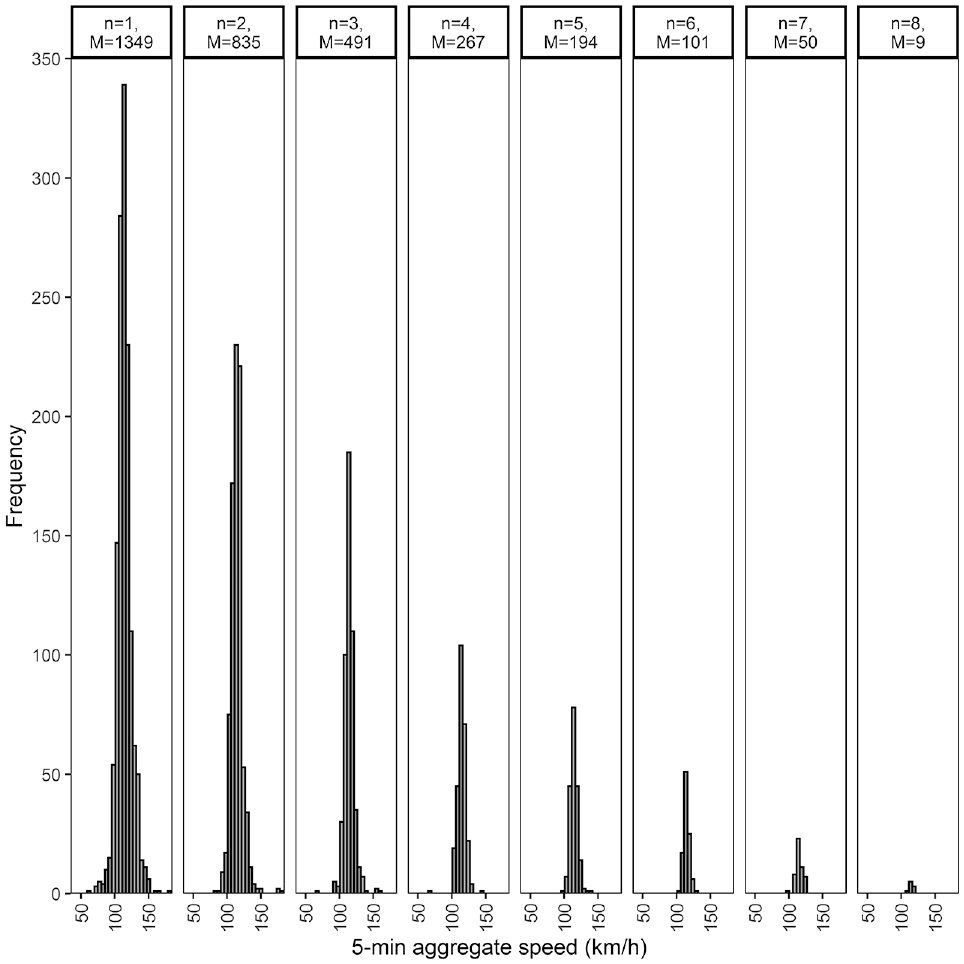
Five-min aggregate speed distributions representing a population.
Identifying Road-Weather-Specific Collision Risk Levels for Different Vehicle Types
In this study, we define “speed differential” as the difference between two population-level speed distributions. If the two speed distributions correspond to identical travel lanes, the distribution of speed differentials is categorized as the within-lane speed differential or across-lane speed differential otherwise. This study develops within- and across-lane speed differentials for different combinations of road-weather conditions, vehicle types, and travel lanes (in the case of the within-lane speed differential). Speed differential is often used as a surrogate safety measure indicative of crash potential ( 25 ). Thus, for a specific combination of driving conditions, we assume that (i) within-lane collision risk for a particular travel lane is implied by corresponding within-lane speed differential, and (ii) across-lane collision risk is reflected by corresponding across-lane speed differential between two adjacent lanes. According to the CLT, the subtraction of normally distributed random variables (i.e., speed distributions) yields a new normally distributed random variable, regardless of the sample size ( 26 ). Accordingly, we assume that the population of the distribution of speed differentials for a specific combination of road weather and vehicle type conditions is represented by a normally distributed random variable characterized by its mean and SD.
Theorem: Difference of Two Population-Level Speed Distributions
If

where


For a specific combination of
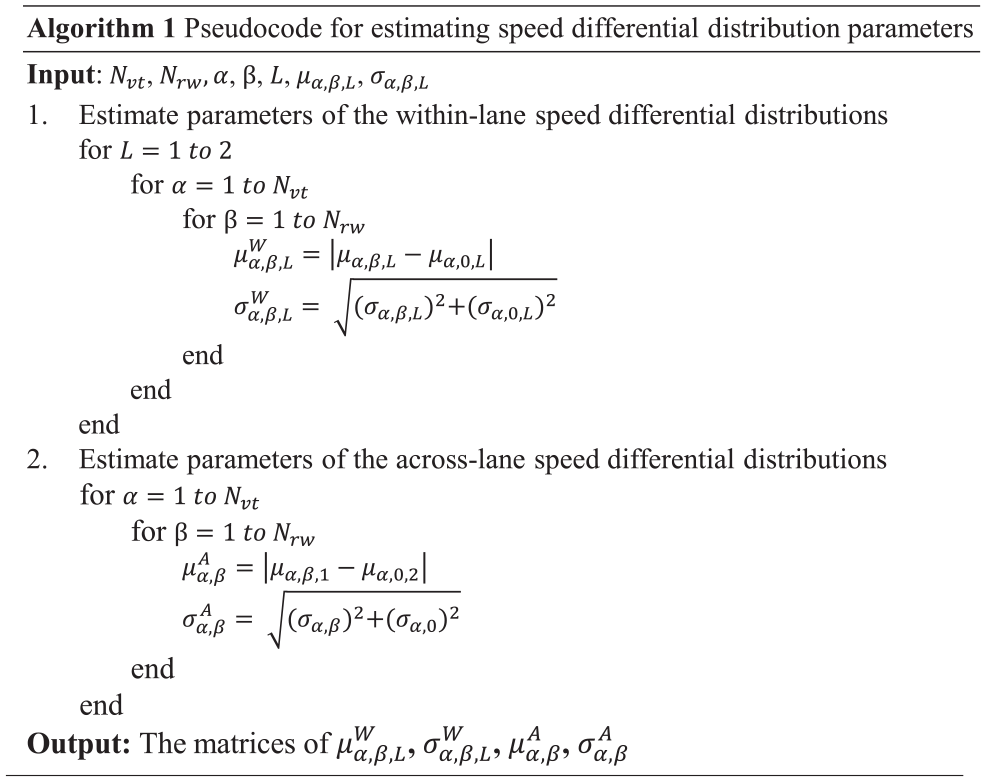
Algorithm for estimating parameters of within- and across-lane speed differentials.
Algorithm 2 explains the criteria for assigning collision risk level based on the within- and across-lane collision potential (Figure 6). Algorithm 2 takes four inputs: (i)
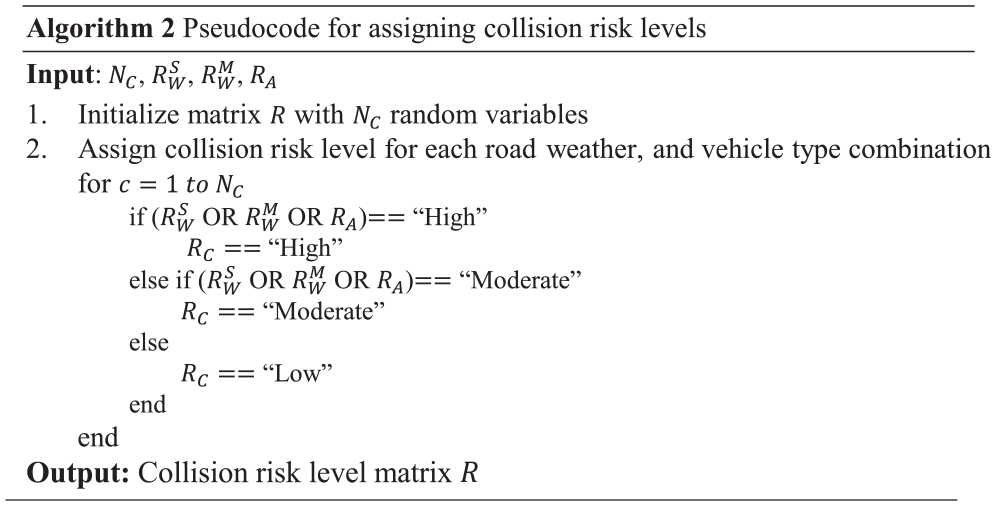
Algorithm for assigning collision risk levels.
Modelling Results and Discussion
Speed Distribution Models
In total, speed data belonging to 248 combinations of speed-decisive factors were used while modelling the speed distributions. To recall, Models 1 and 2 (Equation 1) attempt to estimate the linear relationship between a set of speed-decisive factors and speed distribution parameters
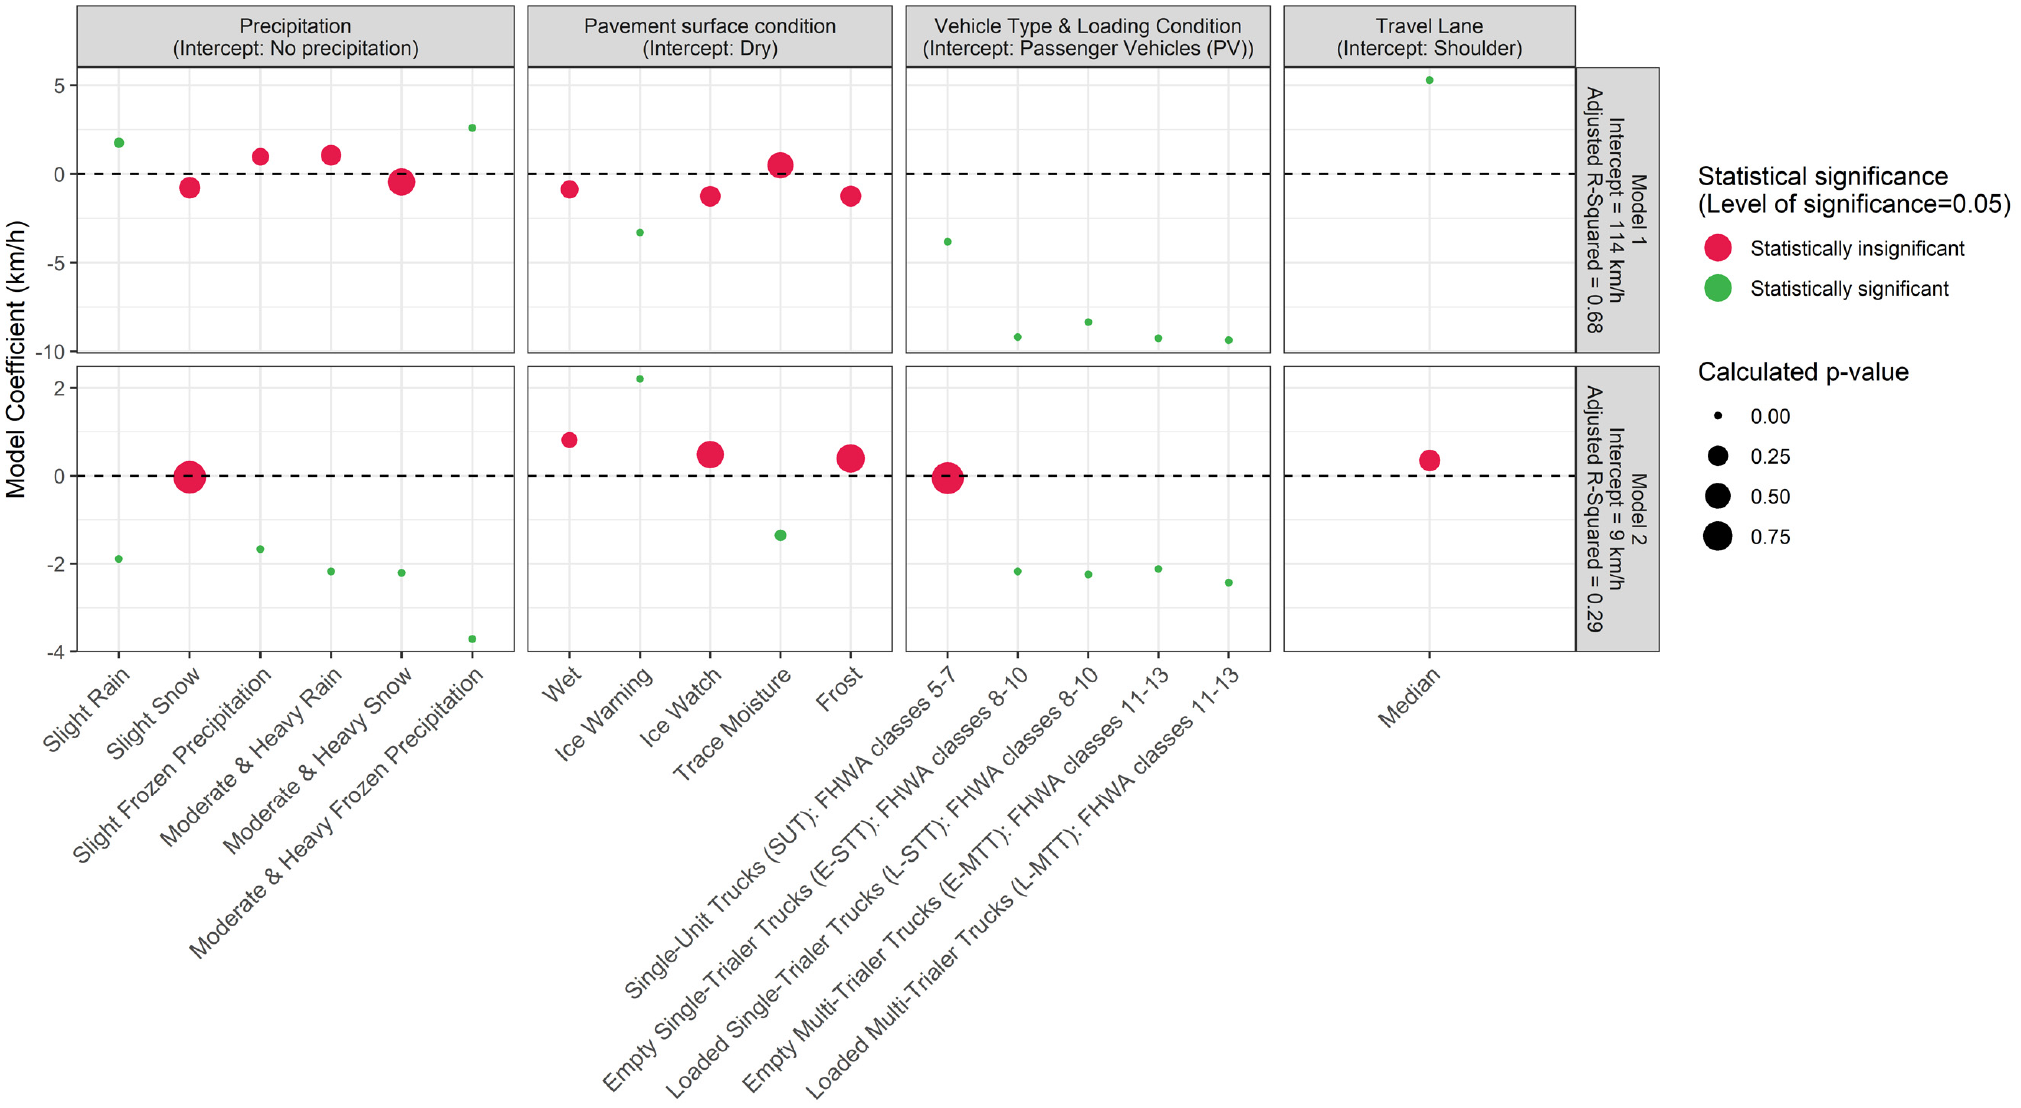
Model coefficients for Models 1 and 2.
Figure 8 presents and compares the speed distribution parameters estimated according to the RBA and CBA. Speed distribution parameters estimated based on RBA are presented regardless of their statistical significance. Yet, discussions on RBA estimates are limited to cases where both
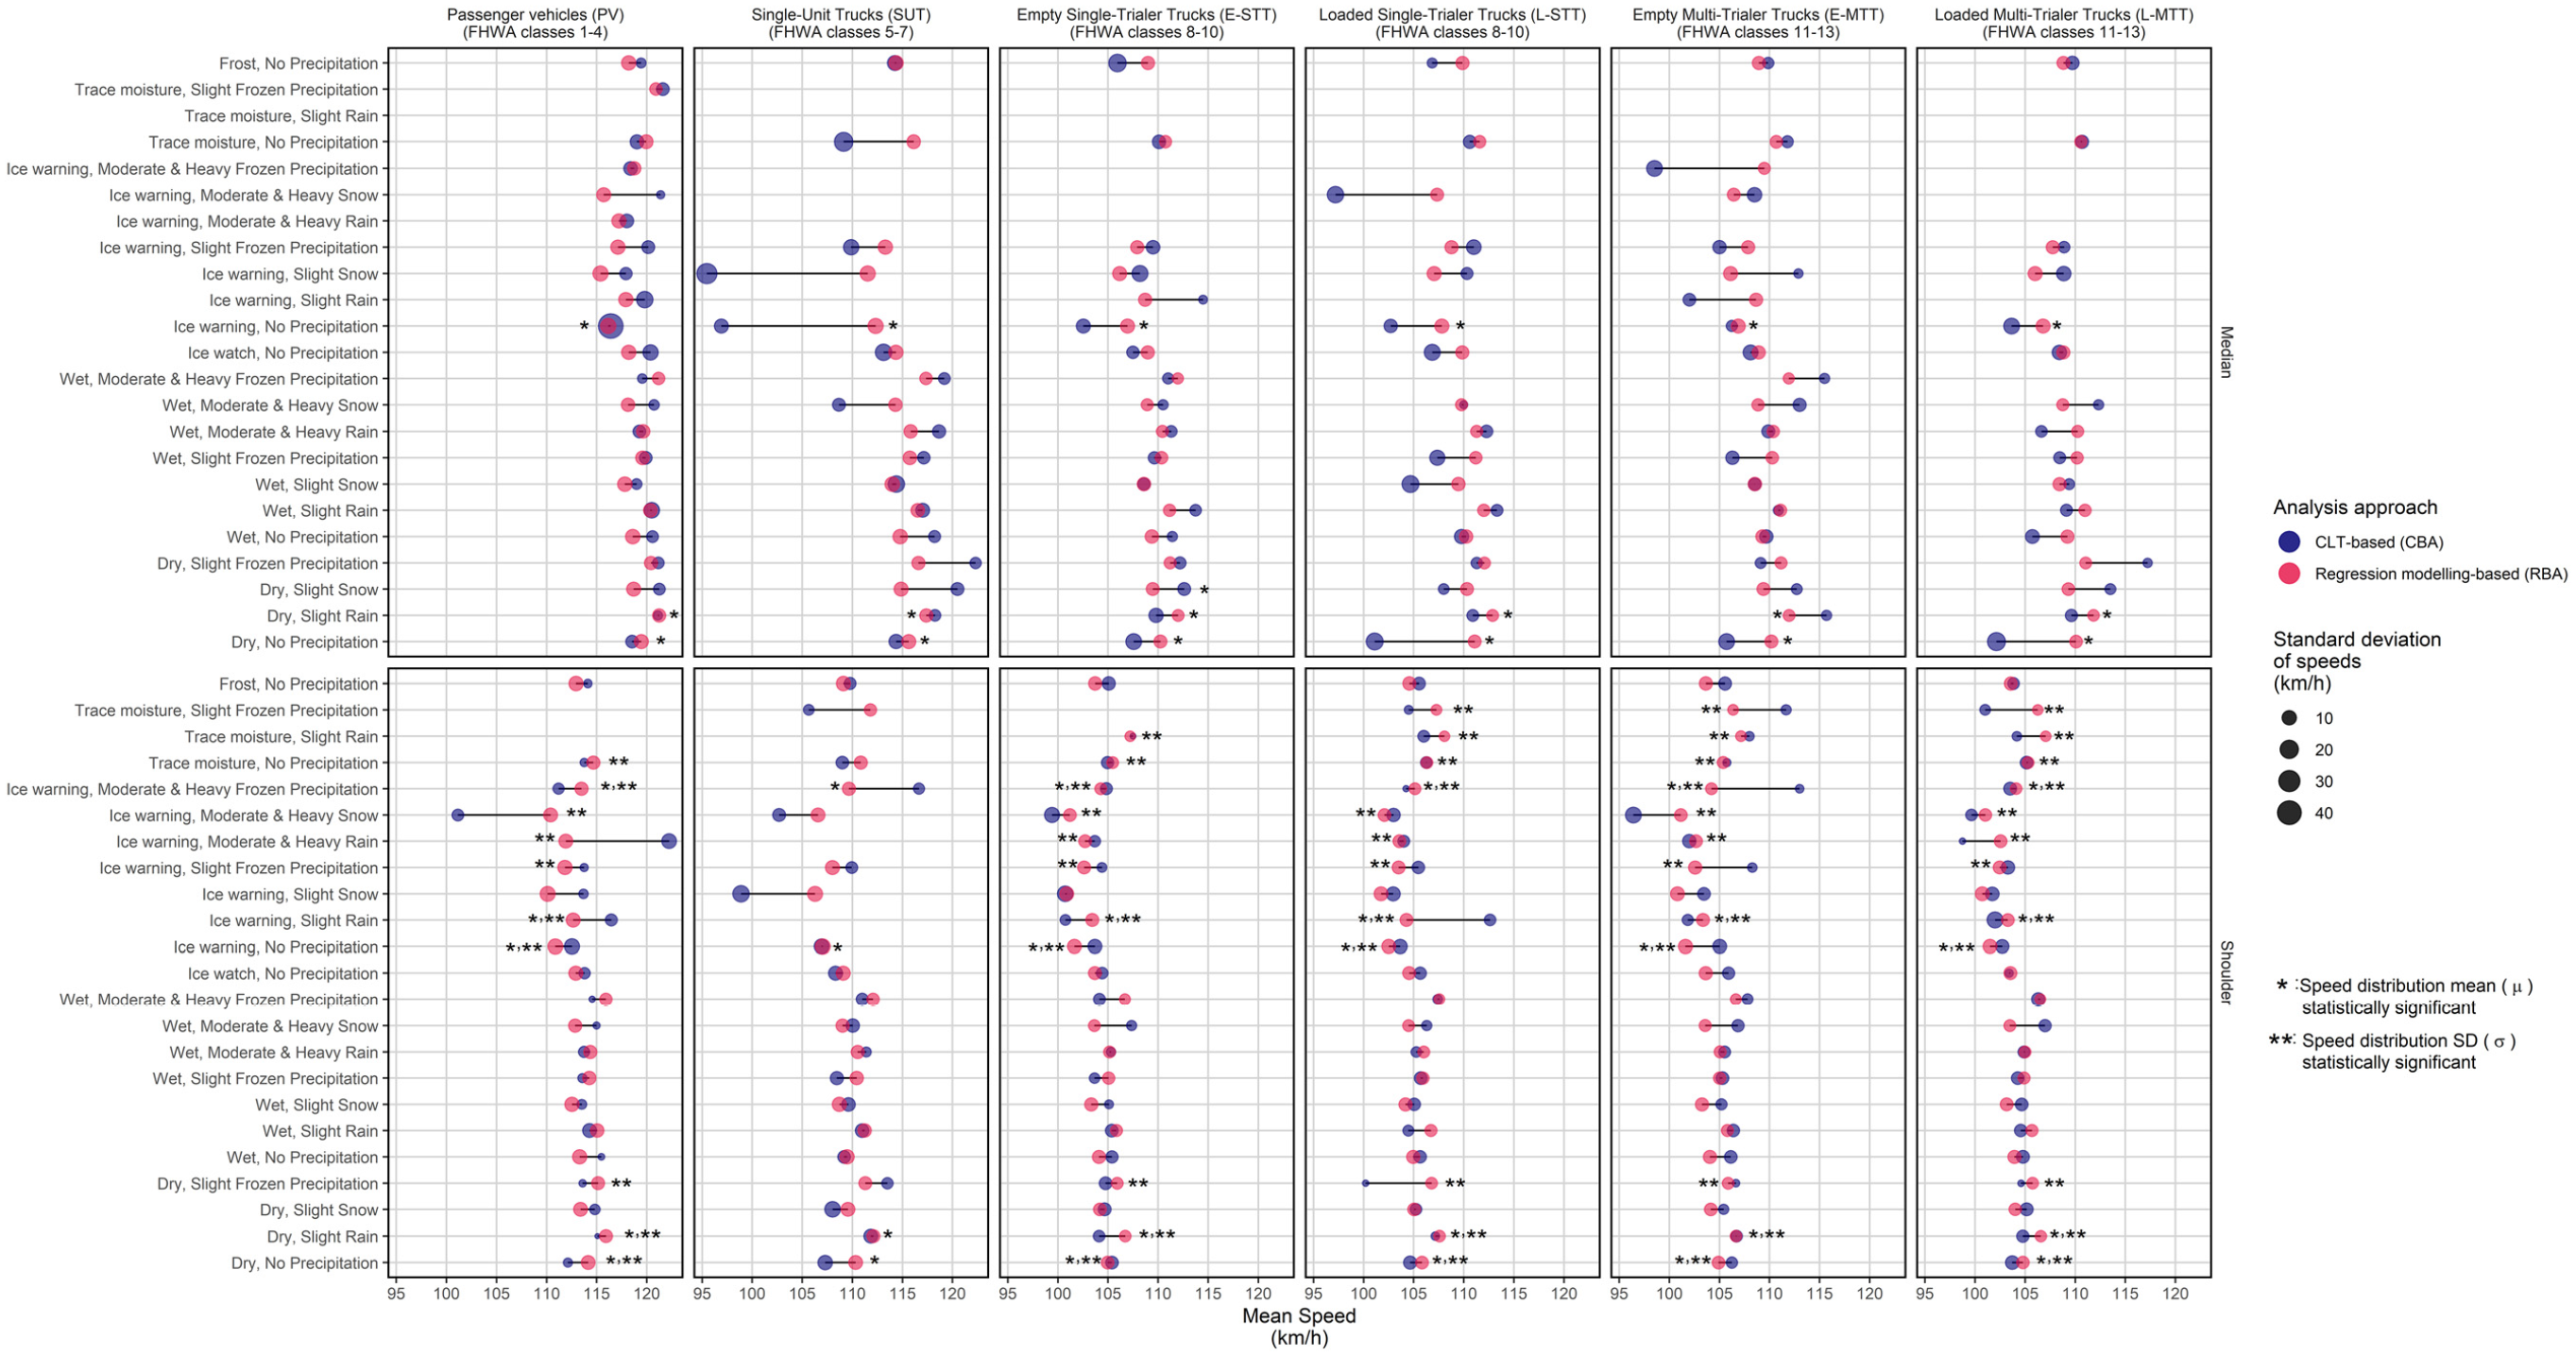
Speed distribution parameters.
According to Figure 8, as per CBA estimations, TTCs travelling in the median lane are described by a considerably low
Vehicle type, in particular, significantly impacts drivers’ speed choice. While the impact of vehicle type on
According to Figure 8, the data-analytics approach adapted significantly affects speed distribution parameters, particularly in the simultaneous presence of adverse road-weather conditions. For example, while the RBA estimated a significantly low
Road-Weather Conditions with Significant Collision Potential
Speed distributions modelled according to the CBA were used to model the distributions of within- and across-lane speed differentials for 135 combinations of road-weather and vehicle type categories. K-means clustering labelled each combination of road-weather and vehicle type category based on the parameters of the distributions of speed differentials (Table 2). It should be noted that the collision risk level was assigned to each cluster based on the SD of speed differential distributions because of the marginal difference in means of the speed differential distributions among the three clusters (Table 2).
Details of the Three Cluster Centroids
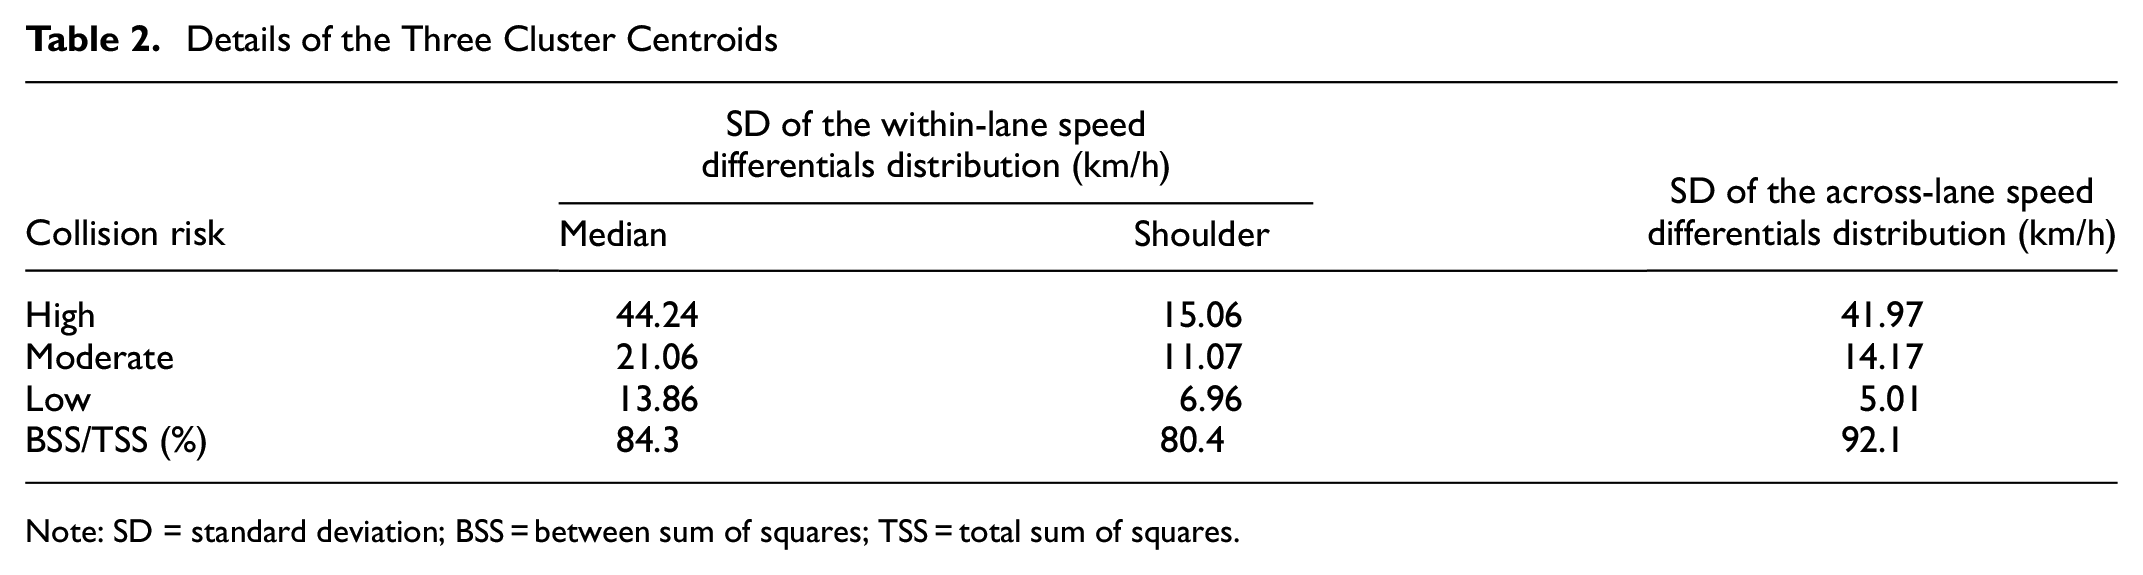
Note: SD = standard deviation; BSS = between sum of squares; TSS = total sum of squares.
Figure 9 demonstrates the collision risk levels estimated for different combinations of road-weather and vehicle type categories in regard to within-lane, across-lane, and overall collision risks (see Figure 6 for estimation of overall collision risks). The silhouette coefficient—a measure evaluating the compactness or separation of the clusters—typically ranges from 0 to 1; a silhouette coefficient of 0 indicates poorly separated clusters, whereas 1 indicates properly assigned clusters ( 27 ). The high silhouette coefficients (shown in brackets in Figure 9) pertaining to each classification imply that collision risks are well clustered. Figure 9 highlights important implications. First, the within-lane collision risks in the shoulder lane seem divergent as compared to the within-lane collision risks present in the median lane, particularly for SUT. The presence of such comparatively low within-lane collision risks in the median lane is rather intuitive because, unlike shoulder lanes, the median lane in a rural highway is predominantly used for passing with more homogeneous passing speeds. In contrast, the shoulder lane is used by different vehicles (Figure 3) potentially travelling at their desired speed; thus, the shoulder lane entails higher within-lane collision risks, particularly for SUTs travelling under adverse road-weather conditions. The number of trailers attached to the trucks seems to reduce the within-lane collision risk for trucks regardless of the travel lane and prevailing road-weather conditions. For instance, the within-lane collision risks for SUTs (zero trailers), E-STTs, and E-MTTs travelling in the shoulder lane under normal road-weather conditions are estimated as high, moderate, and low, respectively. Overall, the truck payload condition increases within-lane collision risk, particularly for multi-trailer trucks. Unlike for PVs, the across-lane collision risk for all types of trucks appears to be low under most road-weather conditions. Trucks predominantly occupy the shoulder lane, which potentially explains the low across-lane collision risk for trucks. The only high across-lane collision risk is present for PVs travelling under no precipitation and ice warning pavements. The comparatively low across-lane collision risks may be attributed to the predominant usage of the shoulder lane in rural highways.
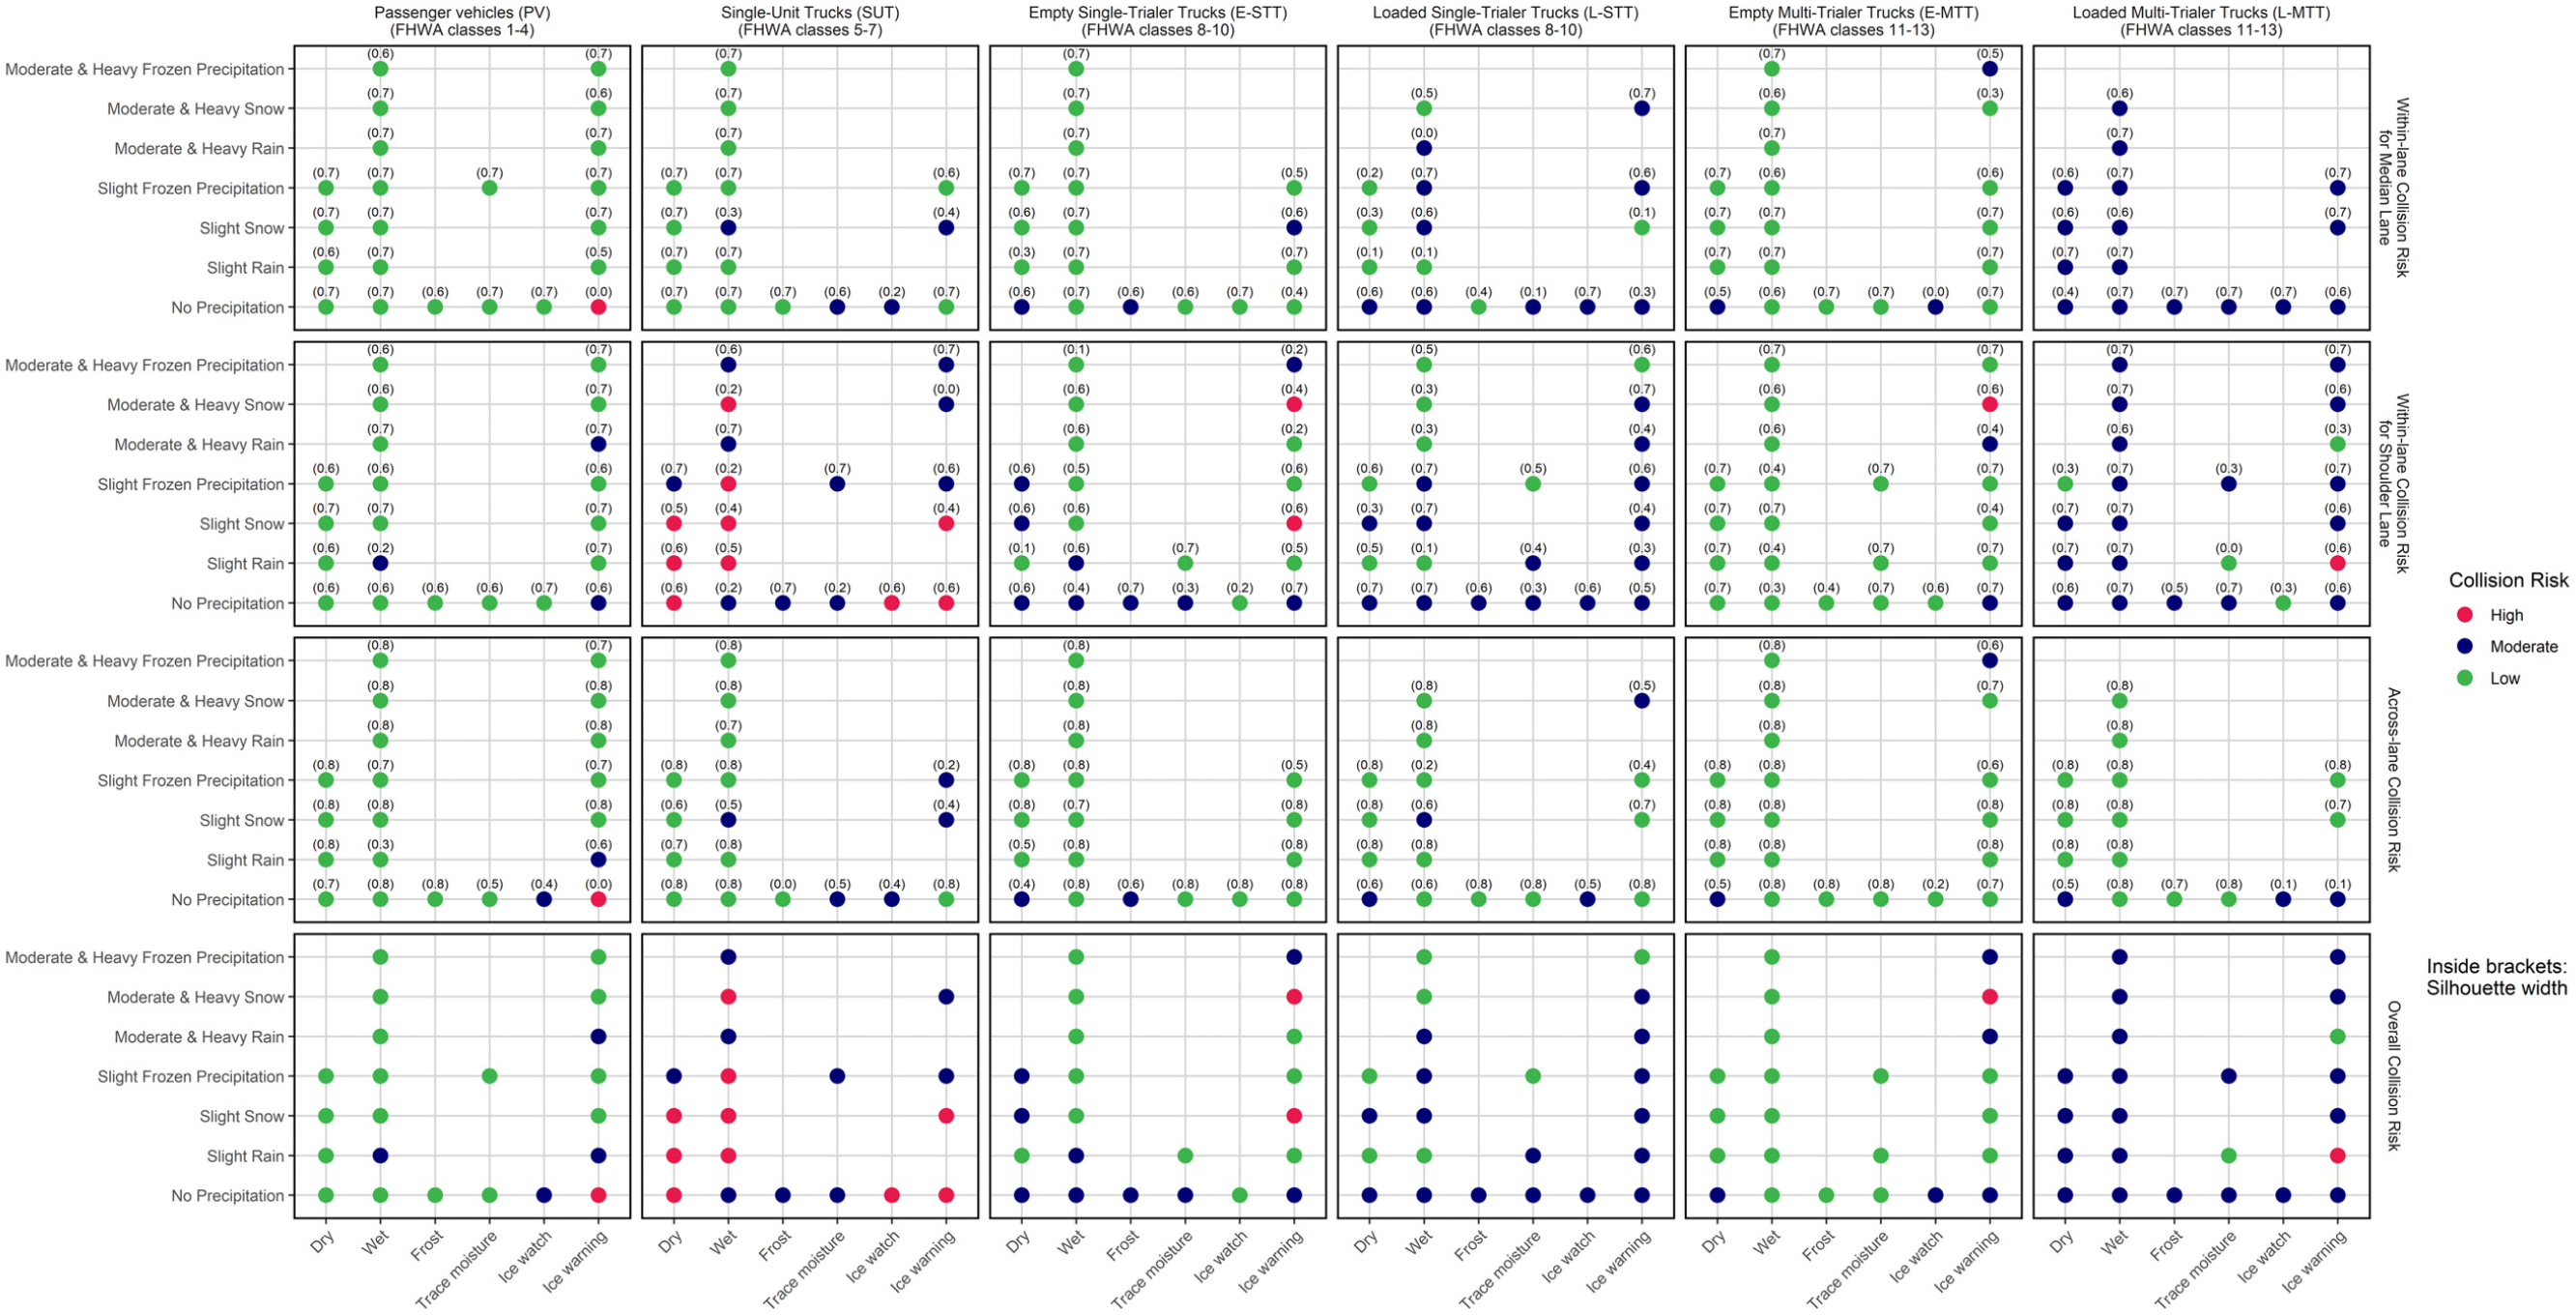
Vehicle-specific collision risks estimated for different road-weather conditions.
According to Figure 9, the within-lane collision risk consists of a diverse mix of low, moderate, and high collision risks. In contrast, the across-lane collision risks are described by either low or moderate collisions risks except for PVs travelling under no precipitation and ice warning pavements. Thus, overall risk mainly reflects the within-lane collision risks because of the low variation of across-lane collision risks regardless of the road-weather condition and vehicle type. According to Figure 9, trucks (particularly SUTs and L-MTTs) entail significantly higher collision risks as compared to PVs under most road-weather conditions. Such high overall collision risks confirm the vulnerability of freight transport vehicles in comparison to PVs. In fact, icy pavement conditions seem to intensify the overall collision risk, particularly for TCCs. For example, the overall collision risk is estimated to be low for empty TTCs travelling on wet pavements under moderate and heavy snow; yet, the collision risk is high when travelling on ice pavements. Importantly, travelling loaded appears to increase collision potential for both TTC under most road-weather conditions.
In summary, the study results unveil important findings. First, the CBA, in comparison with RBA, is deemed as a more appropriate approach to model speed distributions under different driving conditions. In fact, the RBA is not recommended to model speed distributions particularly under limited sampling conditions. Second, our results support the hypothesis that drivers’ speed is significantly affected by the prevailing road-weather, travel lane, and vehicle type. Yet, the impact of truck payload condition on truck speeds seems to be marginal under most road-weather conditions. Although the across-lane collision risk seems marginal for most road-weather conditions, the significant within-lane collision risks signal the need for advanced speed management techniques. One potential approach to minimize within-lane collision risks is to differentiate fast-moving vehicles from slow-moving vehicles in each lane under adverse road-weather conditions. This could be achieved by implementing lane-based weather-responsive variable speed limit (L-WR-VSL) systems together with lane advisories for slow moving vehicles. Such L-WR-VSL systems attempt to minimize speed variation induced by different road weather, vehicle type, and travel lane conditions by imposing unique, differentiated per-lane speed limits under different road-weather conditions ( 20 ). For example, imposing a comparatively low speed limit for the shoulder lane under snowy conditions constrains drivers who are not comfortable to drive in high speeds to the shoulder lane; it further enables fast drivers driving in inner lanes to maintain high speeds without being constrained by slow-moving vehicles ( 20 ).
Conclusion and Future Directions
Inclement road-weather conditions undoubtedly impose significant collision risks to highway freight transportation. Yet, how to identify road-weather conditions posing significant truck collision risks remains a critical question. On the other hand, while past studies recommend modelling context-specific speed distributions to evaluate the impacts of different driving conditions on speed, the most appropriate data-analytics approach to model such speed distributions needs to be evaluated. To address this question, we intend to (i) evaluate the combined impact of four speed-decisive factors—road-weather, travel lane, vehicle type, and truck loading condition (empty or loaded)—on drivers’ desired speed, (ii) explore the variability caused by adapting a RBA and a CBA to model speed distributions, and (iii) propose a unified approach to identify road-weather conditions imposing higher collision risks based on both within- and across-lane collision potential.
The study results recommend modelling speed distributions using the CBA as compared to evaluating context-specific speed choice according to the RBA. Further, findings of this study support the hypothesis that truck speeds are mainly affected by road weather, travel lane, and vehicle type. Particularly, the impact of road-weather conditions was deemed significant when adverse precipitation and pavement conditions are present simultaneously. Travelling loaded appears to marginally increase truck speed under most road-weather conditions. Further, the study results suggest low to moderate across-lane collision risks for all truck types regardless of the prevailing road-weather conditions. In contrast, the within-lane and overall truck collision risks are alarmingly significant, particularly under adverse road-weather conditions. Such collision risks emphasize the importance of implementing proactive countermeasures to mitigate potential truck collisions under adverse road-weather conditions. Thus, we recommend evaluating the suitability of advanced speed management strategies such as L-WR-VSL for cold-region rural highways.
Contributions of this study are mainly threefold. First, jurisdictions located in extremely cold regions may adapt the methodology to evaluate the combined impact of different speed-decisive factors on drivers’ speed. Understanding truck drivers’ speed choice is also important to the trucking industry, as drivers’ speed choices reveal their speeding patterns to some extent. Second, the collision risks estimated by the study manifest the vulnerability of trucks under different combinations of road-weather conditions, particularly when loaded. Thus, transport authorities may apply the proposed methodology to form the basis for important policy implications such as weather-specific truck weight restrictions to mitigate truck collisions potentially leading to severe consequences. In addition, trucking companies may also use the study results to strategize their freight operations based on road-weather conditions, using the road-weather specific truck collision risks unveiled by this study. Further, transportation authorities may use the study results to explore the need for advanced weather-responsive speed management systems. Third, the population-level speed distributions can be used for calibration of traffic simulation models considering different vehicle types and road-weather conditions, while overall collision risks estimated in this study can be used as surrogate safety measures when collision data are not available.
Despite the important implications associated with this study, adaptability of the proposed methodology is limited to uncongested, four-lane divided highways. Adapting the methodology in congested highways violates the two basic assumptions: (i) observed speeds represent drivers’ desired speeds, and (ii) speed distributions are represented by the normal distribution, formulated while developing speed distributions. First, congested traffic entails significant vehicle interactions. In such traffic conditions, drivers’ speed choice is significantly affected by the speed of surrounding vehicles. Thus, speeds observed in congested traffic conditions may not reasonably represent drivers’ desired speeds. Second, speed distribution under congested traffic conditions might not be represented by normal distribution ( 28 ). The overall collision risks estimated in this study are based only on two lanes; thus, the methodology may not be adapted for multilane highways with more than two lanes in one travel direction. Accordingly, future research may focus on extending the proposed methodology to congested traffic and multi-lane conditions. The study results highlight the limitation of linear regression to model speed distributions under limited sampling conditions; thus, future research may focus on evaluating the minimum sample size required to model speed distributions using regression modelling. Future research may also focus on validating the overall collision risks estimated in this study using collision statistics associated with similar study site characteristics. In addition, future research may focus on empirically validating CBA using extensive datasets collected in various highway locations with similar features. While this could be challenging because of limited availability of RWIS stations in the vicinity of traffic detectors, implementation of connected vehicle technologies to collect required speed and road-weather data at the regional scale should be explored further.
Footnotes
Author Contributions
The authors confirm contribution to the paper as follows: study conception and design: R.G.N. Yasanthi, B. Mehran; data collection: B. Mehran; analysis and interpretation of results: R.G.N. Yasanthi, B. Mehran; draft manuscript preparation: R.G.N. Yasanthi, B. Mehran. All authors reviewed the results and approved the final version of the manuscript.
Declaration of Conflicting Interests
The author(s) declared no potential conflicts of interest with respect to the research, authorship, and/or publication of this article.
Funding
The author(s) disclosed receipt of the following financial support for the research, authorship, and/or publication of this article: The authors thank Alberta Transportation for providing the data used in this study and the Natural Sciences and Engineering Research Council of Canada (NSERC) for funding this study (Grant Number: RGPIN:2016-05984).