
Abstract
Despite the aggressive policy goals aiming to transition heavy-duty vehicles (HDVs) toward zero-emission technologies, the penetration rates of zero-emission or even alternative fuel technologies (including zero-emission and other fuels cleaner than petroleum) are still very low. Given that the majority of HDVs are used as fleet vehicles, a better understanding of fleet operator behavior and perspectives on clean fuel technologies is crucial to develop effective demand-side strategies to achieve such policy goals. Of many adoption barriers, a well-known major obstacle is the lack of fueling/charging infrastructure. However, there is limited understanding on how HDV fleet operators have navigated the issues involving the insufficient infrastructure. This study explores how HDV fleets have used alternative fueling infrastructure, how dis/satisfied fleet operators are with the infrastructure, and for what reasons they have decided to construct their own on-site fueling facilities, or to use off-site stations. Based on a case study of compressed natural gas, the most prevalent alternative fuel option so far in the HDV sector, 17 in-depth qualitative interviews were conducted with HDV fleet operators in California. Content and thematic analyses of the data yielded detailed qualitative inferences on use behavior, satisfaction, and fleet decisions between on-site versus off-site fueling. The study findings are the first step toward enhancing our understanding of HDV fleet behavior regarding alternative fueling infrastructure, which can contribute to filling the knowledge gap in this field and to developing further research questions to elicit policy recommendations that can support the adoption of clean fuel technologies in HDV fleets.
Keywords
To protect the environment and public health from the detrimental impacts of greenhouse gases (GHGs) and air pollutants emitted from medium and heavy-duty vehicles (those with a gross vehicle weight rating exceeding 10,000 lb by the U.S. Federal Highway Administration (FHWA), or 8,500 lb by the U.S. Environmental Protection Agency, hereafter “HDVs”), many U.S. states have concurred to support a large-scale transition toward a clean HDV sector ( 1 ). This endeavor includes the agreed aim of all new HDV sales by 2050 being zero-emission vehicles (ZEVs) that do not produce tailpipe emissions of criteria pollutants ( 1 ). However, the penetration rate of ZEVs (e.g., battery electric or hydrogen fuel cell electric vehicles) is marginal. Even the penetration rate of alternative fuel vehicles (AFVs), which include ZEVs and other vehicles running on cleaner fuels than petroleum, such as natural gas and propane ( 2 ), is still very low in the HDV sector. For example, as of 2020, AFV and ZEV penetrations were 3.0% and 0.2%, respectively, in HDV registrations in California ( 3 ) despite the state having some of the most progressive goals and actions for reducing vehicle-generated emissions in the U.S. (e.g., 4 – 6 ). Given that approximately 90% of HDVs are used as fleet vehicles rather than for personal transportation ( 7 ), fleet operators are key demand-side players who lead the decision-making process of fleet purchases in organizations ( 8 ). Therefore, understanding fleet operator behavior and perspectives on clean fuel technologies is critical to develop strategies aiming to accelerate adoption.
Fleet operators have been facing many barriers to adopt alternative fuels ( 9 ). One of the critical challenges is the lack of refueling/charging infrastructure which increases complexity in adopting and operating heavy-duty AFVs ( 9 ). The problem of sparse infrastructure and the poor demand for AFV adoption is recognized as a so-called “chicken-and-egg” dilemma ( 10 ) because each seems to cause the other to arise, making it difficult to discern which occurs first. Fleet operators are reluctant to adopt AFVs because of restricted refueling/charging opportunities, and infrastructure developers are hesitant to construct refueling/charging facilities because of the low demand by fleet operators for AFVs. While understanding fleet operator perspectives on this challenging dilemma related to the insufficient infrastructure is essential for developing useful strategies to achieve policy goals, this topic has not been sufficiently addressed in the literature. Therefore, this study attempts to fill this knowledge gap by exploring how HDV fleet operators have navigated the issues associated with alternative fueling infrastructure.
Of various clean fuel technologies, we selected compressed natural gas (CNG) as the focus of our investigation for several reasons. First, CNG vehicles use commercially mature technologies in various HDV applications, including tractor trucks, refuse trucks, street sweepers, and transit/school buses ( 11 ). In addition, CNG fueling infrastructure is much more widely available than hydrogen refueling or electric charging infrastructure for HDVs ( 12 ). To date, CNG is the most prevalent alternative fuel option used by HDV fleets ( 3 ), which offers a unique opportunity to explore revealed fleet behavior with regard to alternative fueling infrastructure. While current policies aim to transition toward zero-emission technologies, CNG will remain a feasible option in the HDV sector for the foreseeable future ( 13 ). Therefore, the insights gained from this study will remain relevant and valuable in the near-to-medium term. The study findings could also help policymakers and practitioners anticipate potential obstacles related to zero-emission charging/fueling infrastructure from fleet operator perspectives.
This study aims to address the following research questions based on empirical data obtained from fleet operators, with a particular focus on use behavior, satisfaction, and decisions related to on-site versus off-site fueling facilities.
With respect to use behavior of alternative fueling infrastructure, where, during what period of time, and with what equipment are heavy-duty AFVs refueled?
How satisfied or dissatisfied are HDV fleet operators with their current alternative fueling facilities and practices?
For what reasons and under what circumstances, do some fleet operators decide to build on-site fueling infrastructure (i.e., centralized fueling at a fleet base location) and do others decide to use off-site stations (i.e., decentralized fueling at stations away from a fleet base)?
Due to the complex nature of this topic we employed a qualitative research approach, given its suitability to explore a complicated subject under intricate contexts, and its strength for a more in-depth analysis ( 14 ). Based on a stratified purposeful sample of California HDV fleet operators, a total of 17 one-on-one qualitative interviews were conducted. Diverse HDV applications were addressed in these interviews, including refuse trucks, school buses, local delivery trucks, freight trucks, and various public work trucks. The qualitative data were analyzed using content analysis ( 15 ) and thematic analysis ( 16 ). When eliciting themes in the qualitative analysis, we referred to the Diffusion of Innovations theory by Rogers ( 17 ) to better relate the findings to a theoretical understanding.
The study results can contribute not only to filling the knowledge gap in this field with new fleet data and analyses, but to facilitating more realistic modeling in research problems about heavy-duty AFV fueling infrastructure (e.g., fuel demand forecast problems, station location problems). The results will also help policymakers and professionals recognize impediments associated with alternative fueling infrastructure that HDV fleets may encounter and develop further research questions to elicit policy recommendations that can support clean fuel adoption in HDV fleets.
This paper is organized as follows. The next section reviews the relevant literature. The methodology used for this study follows in the subsequent section. We then discuss the study results. The last section concludes with a summary of the findings and recommendations.
Literature Review
Until now, there have only been a limited number of studies regarding alternative fuel adoption in HDV fleets, while several dozen studies have investigated the adoption of alternative fuels in light-duty vehicle (LDV) fleets ( 9 ). Bae et al. ( 9 , 18 ) conducted a comprehensive review of such literature focusing on LDV or HDV fleets and synthesized the findings to develop a conceptual framework that explains AFV adoption behavior in organizations operating vehicle fleets. This framework consists of many elements, including perceived technology characteristics, organization characteristics, and external environmental influences such as government policies, technology supplier support, and social influences ( 9 , 18 ). One of the technology characteristics is the perceived complexity, in which limited fueling infrastructure has been identified as a major barrier to adoption and operation of AFV fleets (e.g., 19 , 20 ).
Recently, studies have investigated the factors influencing alternative fuel adoption in HDV fleets, addressing fueling infrastructure as a key obstacle (e.g., 9 , 21 – 23 ). For example, Pfoser et al. ( 21 ) used a structural equation model based on their survey results in the European Rhine-Main-Danube axis area, finding that the accessibility or availability of technology and refueling infrastructure significantly affected the acceptance of liquefied natural gas (LNG) for long-distance HDV transport operators. In addition, Anderhofstadt and Spinler ( 22 ) employed the Delphi method to examine the factors affecting the adoption of alternative fuel-powered HDVs in Germany and identified the availability of fueling/charging infrastructure as a primary barrier to purchasing and operating these vehicles. Blynn and Attanucci ( 23 ) reported that the cost of charging infrastructure was a significant obstacle to electrifying transit bus fleets in some U.S. states. Furthermore, Bae et al. ( 9 ) found that the lack of infrastructure was frequently cited as a main reason for non-adoption decisions and a primary obstacle for those who proceeded with alternative fuel adoption in HDV fleets in California.
Several previous studies analyzed AFV drivers’ refueling behavior at public stations, particularly focusing on refueling trips and station choices (e.g., 24 , 25 ). However, to the best of the authors’ knowledge, there is a lack of research delving into fleet operator points of view about fueling infrastructure issues in detail, except for a few reports (e.g., 26 , 27 ). Since the relevant issues are not addressed in detail ( 26 ) or the information collected is dated ( 27 ), further studies based on a more analytical methodology with newer data are needed to augment and update the knowledge in this field. Recently, Kchaou-Boujelben ( 28 ) conducted a comprehensive literature review of AFV refueling/charging station location problems, in which 179 research articles were analyzed with different modeling aspects, including model structures, objective functions, and constraints. While there has recently been a growing body of literature on station location problems, such studies focusing on HDV fleets are still limited. Moreover, existing studies on HDV fueling infrastructure have sometimes relied on assumptions and inputs which are too simplified and not in line with actual refueling/charging practice (e.g., no availability to refuel at depot ( 29 )). Inaccurate assumptions in previous studies may partly be the result of the lack of data on revealed refueling behavior of heavy-duty AFVs, and this could lead to less practical and misleading modeling results, as pointed out by Kchaou-Boujelben ( 28 ). This study, which is based on revealed behavior of HDV fleets, can thus help enhance realistic modeling in research problems associated with heavy-duty AFV fueling infrastructure, such as station location and fuel demand forecast problems.
Methodology
CNG in California as a Case Study
The State of California is the second largest GHG emitter among the 50 U.S. states, accounting for 7% of the total emissions in 2017 ( 30 ). While the transportation sector generates the largest share of the state’s GHG emissions (41%), HDVs account for 21% of the sector’s GHG inventory ( 31 ). The state also has an acute awareness of the impacts of vehicle-generated air pollutants on public health ( 32 ). To reduce GHGs and smog-forming emissions in the HDV sector, promoting the adoption of clean fuel technologies by fleet operators instead of traditional petroleum fuels can be one of the effective solutions ( 33 ). Accordingly, California has established progressive goals to reduce vehicle emissions (e.g., 4 , 34 ) and implemented many incentive programs and regulations to encourage or require HDV fleets to use alternative fuels ( 35 ). The state’s recent endeavors are also exemplified by the Advanced Clean Trucks ( 6 ) and Advanced Clean Fleets ( 5 ) programs with an overall aim of transitioning toward zero-emission technologies.
In California, as of 2020, there were 23,786 HDVs running on alternative fuels (3.0%) out of the total of 804,022 HDVs ( 3 ). The remaining 780,236 HDVs were operated using either diesel (72.9%) or gasoline (24.1%) ( 3 ). Of various alternative fuels, natural gas represented the most popular usage with 22,043 HDVs (2.7%), whereas electric options occupied a limited portion only with 1,743 HDVs (0.2%) ( 3 ). Between two different natural gas types, CNG or LNG, the former is more widely used than the latter in the Californian transportation sector, as represented by 321 CNG stations versus 40 LNG stations statewide (c.f., 1,510 CNG stations versus 103 LNG stations nationwide) ( 36 ). As such, CNG in California was selected as the focus in this study given that there is a greater opportunity to investigate revealed fleet behavior associated with CNG fueling infrastructure.
Of the total of 321 CNG stations statewide, 308 were for HDVs (96.0%) and only 13 were for LDVs (4.0%) ( 12 ). These CNG stations were owned by various types of entities, including federal (2.5%), state (1.6%) and local governments (36.8%), utility companies (12.8%), and private fleet owners (46.4%) ( 12 ). Approximately half the stations (52.0%) allowed for public access while the others (48.0%) were available for private customers ( 12 ).
Semi-structured Interviews and Sampling
Given scarce previous findings on HDV fleet behavior regarding alternative fueling infrastructure, a qualitative research approach is more suitable than a quantitative method because the former has strengths in initially exploring a complicated phenomenon with a more detailed analysis when a relevant theory is unavailable ( 14 ). Of several qualitative research methods, we employed semi-structured interviews. This method offers flexibility both to researchers (interviewers) and study participants (interviewees) so that interviewers can have a certain degree of freedom to explore the context of the topic under a set of standard interview questions and interviewees can answer from their own perspectives and in their own words, which enables for a more comprehensive understanding of the topic ( 37 ).
A primary sampling criterion was to select the participating organizations among those that have adopted CNG HDVs and were operating the vehicles in California, so that revealed fleet behavior should be investigated. Another major sampling strategy was to include diverse fleet sectors by assuming that fleet behavior associated with fueling infrastructure would differ depending on various fleet characteristics such as fleet sizes, vocations, and public versus private sectors. Organizations meeting these criteria were approached using data from vehicle incentive programs in California. After reaching out to more than 100 organizations by telephone or email, 17 organizations agreed to participate in this study. It was not intended to form a statistically representative sample given the small sample size for in-depth interviews ( 14 ), however, a wide diversity of HDV fleets was recruited to enable informed discussion on major variations in fleet behavior across different segments.
Of the 17 participating organizations, nine were public (52.9%) and eight were private entities (47.1%). Approximately two-thirds of the participating fleets (64.7%) had a large fleet size with more than 100 HDVs. Almost one-third of the fleets (29.4%) were medium-sized (20 to 100 HDVs) while the others (5.9%) were small in size (less than 20 HDVs). In terms of fleet vocations, diverse categories were captured: various public works (41.2%), waste collection (29.4%), school buses (11.8%), local delivery (11.8%), and freight trucking (5.9%).
Interview Data
In-depth qualitative interviews with fleet operators from the 17 participating organizations were conducted between July and November 2018. The interviewees were key individuals who participated in the decision-making process for fleet procurement in organizations that operated HDV fleets in California. These interviewees held various positions within the organizations, including fleet managers, company presidents, project engineers, and energy analysts. In each semi-structured interview, a set of 13 standard questions was used. For this paper, a specific focus was placed on: 1) use behavior of CNG refueling infrastructure; 2) satisfaction or dissatisfaction with their current refueling facilities and practices; and 3) fleet decisions between building on-site fueling infrastructure and using off-site stations. In addition, many follow-up questions were asked. Basic fleet information was also collected, such as fleet size and vocation. Table 1 presents the list of main interview questions and some examples of the follow-up questions.
Interview Questions
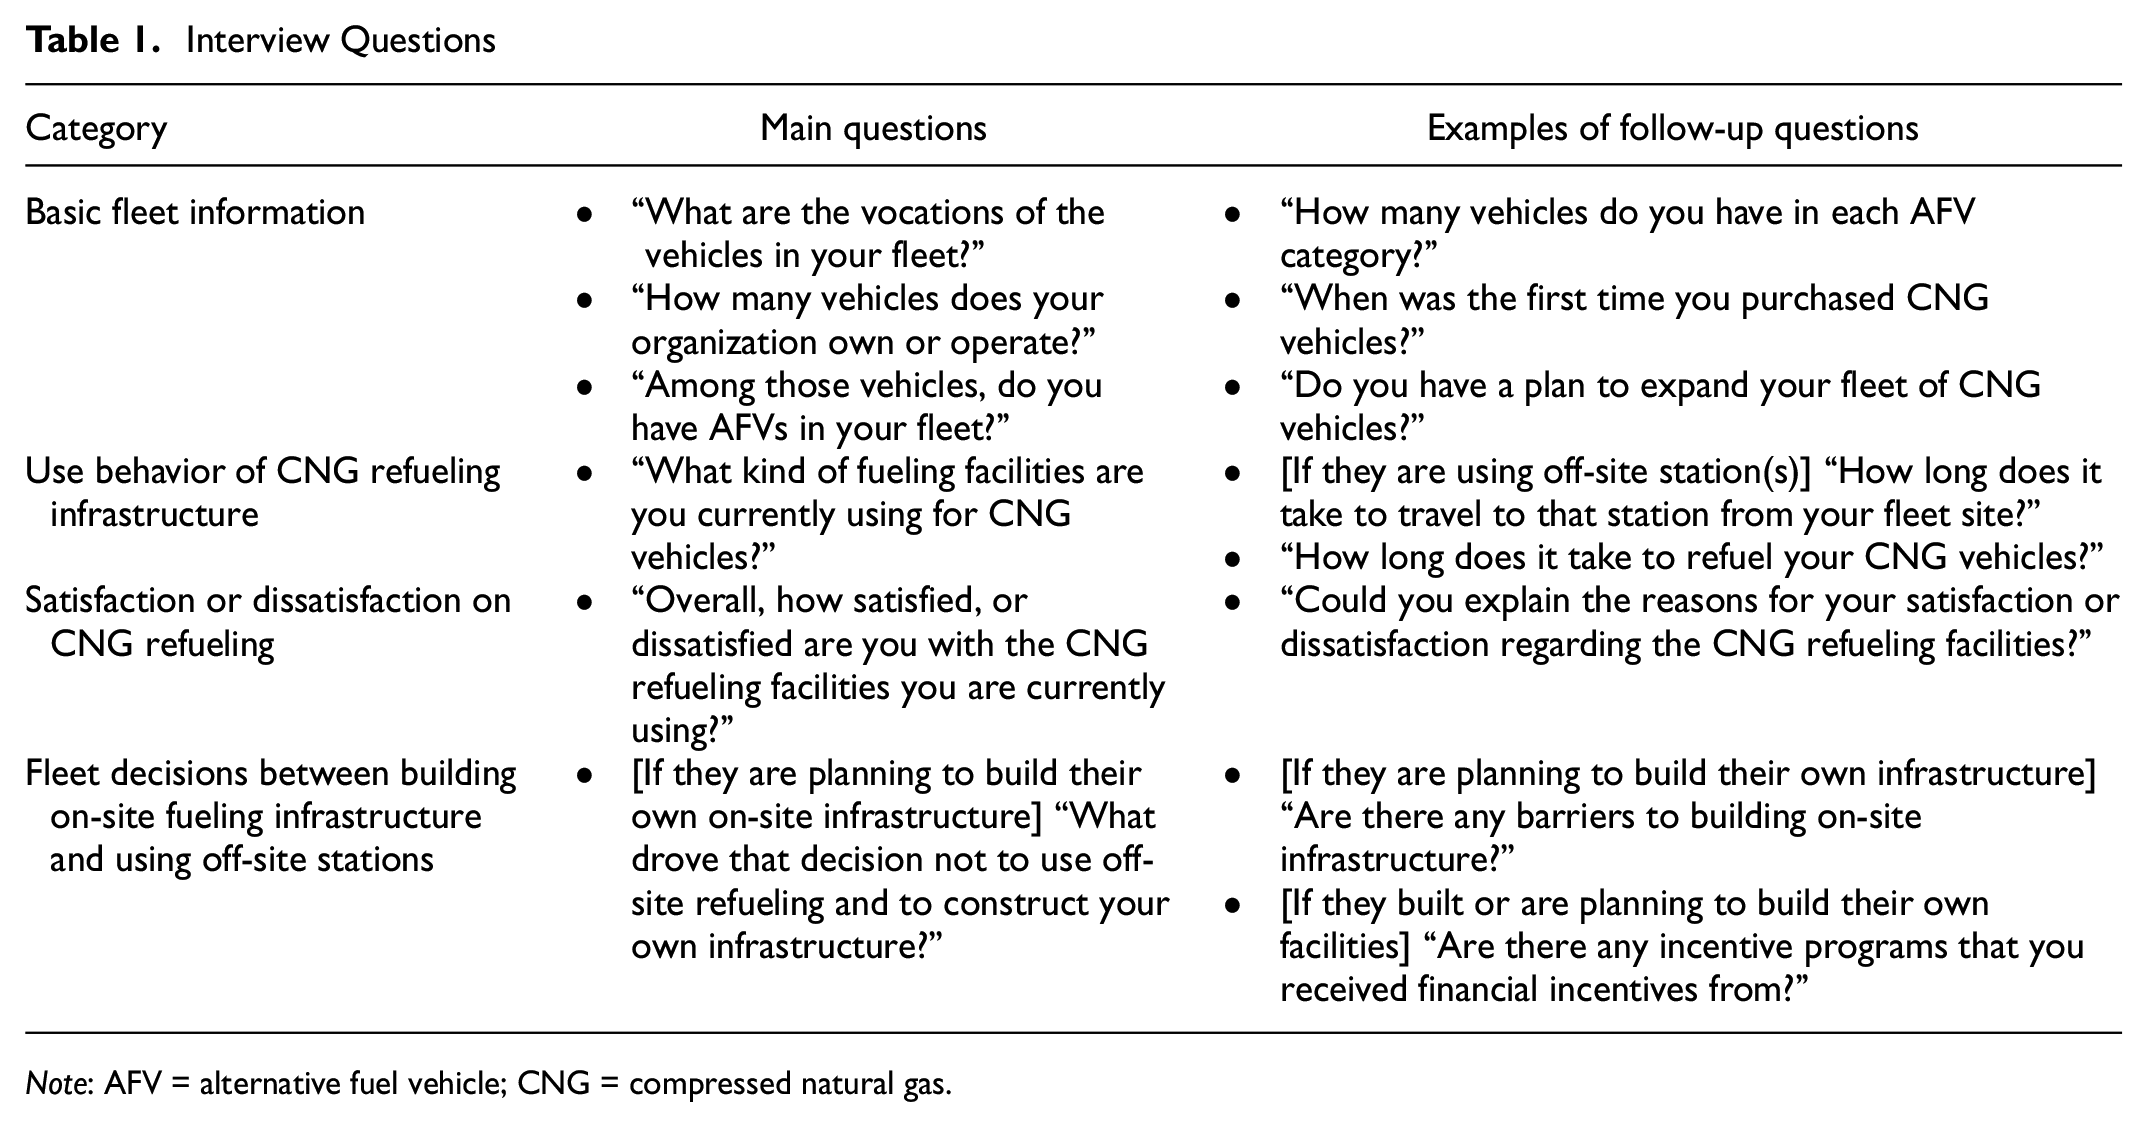
Note: AFV = alternative fuel vehicle; CNG = compressed natural gas.
Before conducting each interview, a detailed information package including consent forms and a study information sheet was sent to the study participants. Each interview was conducted via phone or in person, and lasted 1 h 3 min on average. Interview recordings were professionally transcribed. All study materials and interview protocols were approved by the Institutional Review Board of the University of California, Irvine.
Data Analysis Methods
Interview data were analyzed using content analysis ( 15 ) and thematic analysis ( 16 ). As qualitative research approaches, both methods involve a systematic coding process, extracting patterns, identifying and analyzing themes across qualitative data so as to answer the research questions ( 38 ). As an analysis process, Braun and Clarke ( 39 ) proposed a six-phase approach, which is widely used for thematic analysis: 1) familiarizing with the data, 2) generating initial codes, 3) searching for themes, 4) reviewing themes, 5) defining and naming themes, and 6) producing the report. While employing this six-phase approach, we added the process of computing inter-coder reliability, which is used in content analysis, to ensure the reliability of the findings ( 38 ). In this work, themes are defined as textual categories, either basic or upper levels, identified through the data to serve as the basis for answering the research questions.
As a first step in the analysis, the interview notes and contents were cross-checked between the participating researchers. In the second step, the first author coded the interview data using ATLAS.ti, a qualitative analysis tool that supports organizing numerous codes (i.e., discrete units of meaning) and relevant quotations. For the third step, the long list of codes was further condensed into a shorter list of discrete textual categories by combining multiple codes with related meanings into a single category. An interview data abstraction sheet was then generated from this list. The data abstraction sheet was then filled in by identifying the existence of each textual category and collecting the relevant quotations. Textual categories can be given ratings in terms of a sign (e.g., “+” indicates satisfactory aspects, and “–” indicates unsatisfactory aspects), and a strength (e.g., “1” being implied, “2” explicitly mentioned, and “3” emphasized), following Carley ( 40 ) and Sierzchula ( 41 ). Two coders independently completed the data abstraction sheet using these scores so that the inter-coder reliability could be computed. In case both satisfactory and unsatisfactory aspects were addressed for a textual category, the rating “n” was assigned.
Meanwhile, the textual categories were further classified into upper-level categories, if applicable, by referring to the Diffusion of Innovations theory ( 17 ) to better accommodate theoretical understanding of the findings. For example, the categories of dis/satisfactory aspects of infrastructure were organized under a set of concepts related to technology characteristics, including perceived relative advantages, perceived compatibility, perceived complexity, and perceived uncertainty ( 17 ). These concepts are defined as follows: (i) Perceived relative advantage refers to the degree to which AFVs are “perceived as being better than the idea it supersedes” ( 17 , p. 213); (ii) Perceived compatibility is the degree to which AFVs are “perceived as consistent with the existing values, past experiences, and needs of potential adopters.” ( 17 , p. 223); (iii) Perceived complexity refers to the degree to which AFVs are “perceived as relatively difficult to understand and use” ( 17 , p. 230); and (iv) Perceived uncertainty is defined as “the degree to which a number of alternatives are perceived with respect to the occurrence of an event and the relative probability of these alternatives” ( 17 , p. 6).
For the fourth and fifth steps, a series of discussions was held using agreed categories and relevant quotes between the participating researchers to review and define textual categories and hypotheses, and address the research questions. In addition, inter-coder reliability was checked by computing Krippendorff’s α ( 15 ) using the subset of data applicable for such computations. Krippendorff’s α ( 15 ) is the most general agreement measure in content analysis, which lies between 0 (indicating the absence of reliability) and 1 (indicating perfect reliability). The scoring results from the two coders yielded a Krippendorff’s α of 0.988, which is above a common threshold of 0.9 ( 42 ) and thus confirmed the reliability. The remaining disparities between the two coders were resolved by a third coder.
Results and Discussion
To address the three research questions, the analysis results of interview data obtained from the fleet operators of heavy-duty CNG vehicles (CNGVs) are discussed below under the following subtopics: 1) Use behavior of CNG fueling infrastructure, 2) Satisfaction with the refueling facilities and practices, and 3) Fleet decisions on constructing on-site infrastructure versus using off-site stations.
Use Behavior of CNG Fueling Infrastructure
To explore where, during what period of time, and with what equipment CNGVs are refueled, a subset of the relevant interview data was analyzed, focusing on their refueling behavior along with basic fleet characteristics, which is summarized in Table 2. About two-thirds of the participating fleets had their own on-site fueling infrastructure while the remaining fleets relied on off-site fueling stations. A few organizations, particularly with a large fleet size (e.g., Org. 3 and 15) used both on-site and off-site stations. Details on refueling behavior at on-site versus off-site stations are discussed below. Further discussions on fleet choices between on-site versus off-site fueling, in relation to their fleet characteristics, will be addressed in a later subsection.
Participating Heavy Duty Vehicle Fleets and Their CNG Fueling Infrastructure
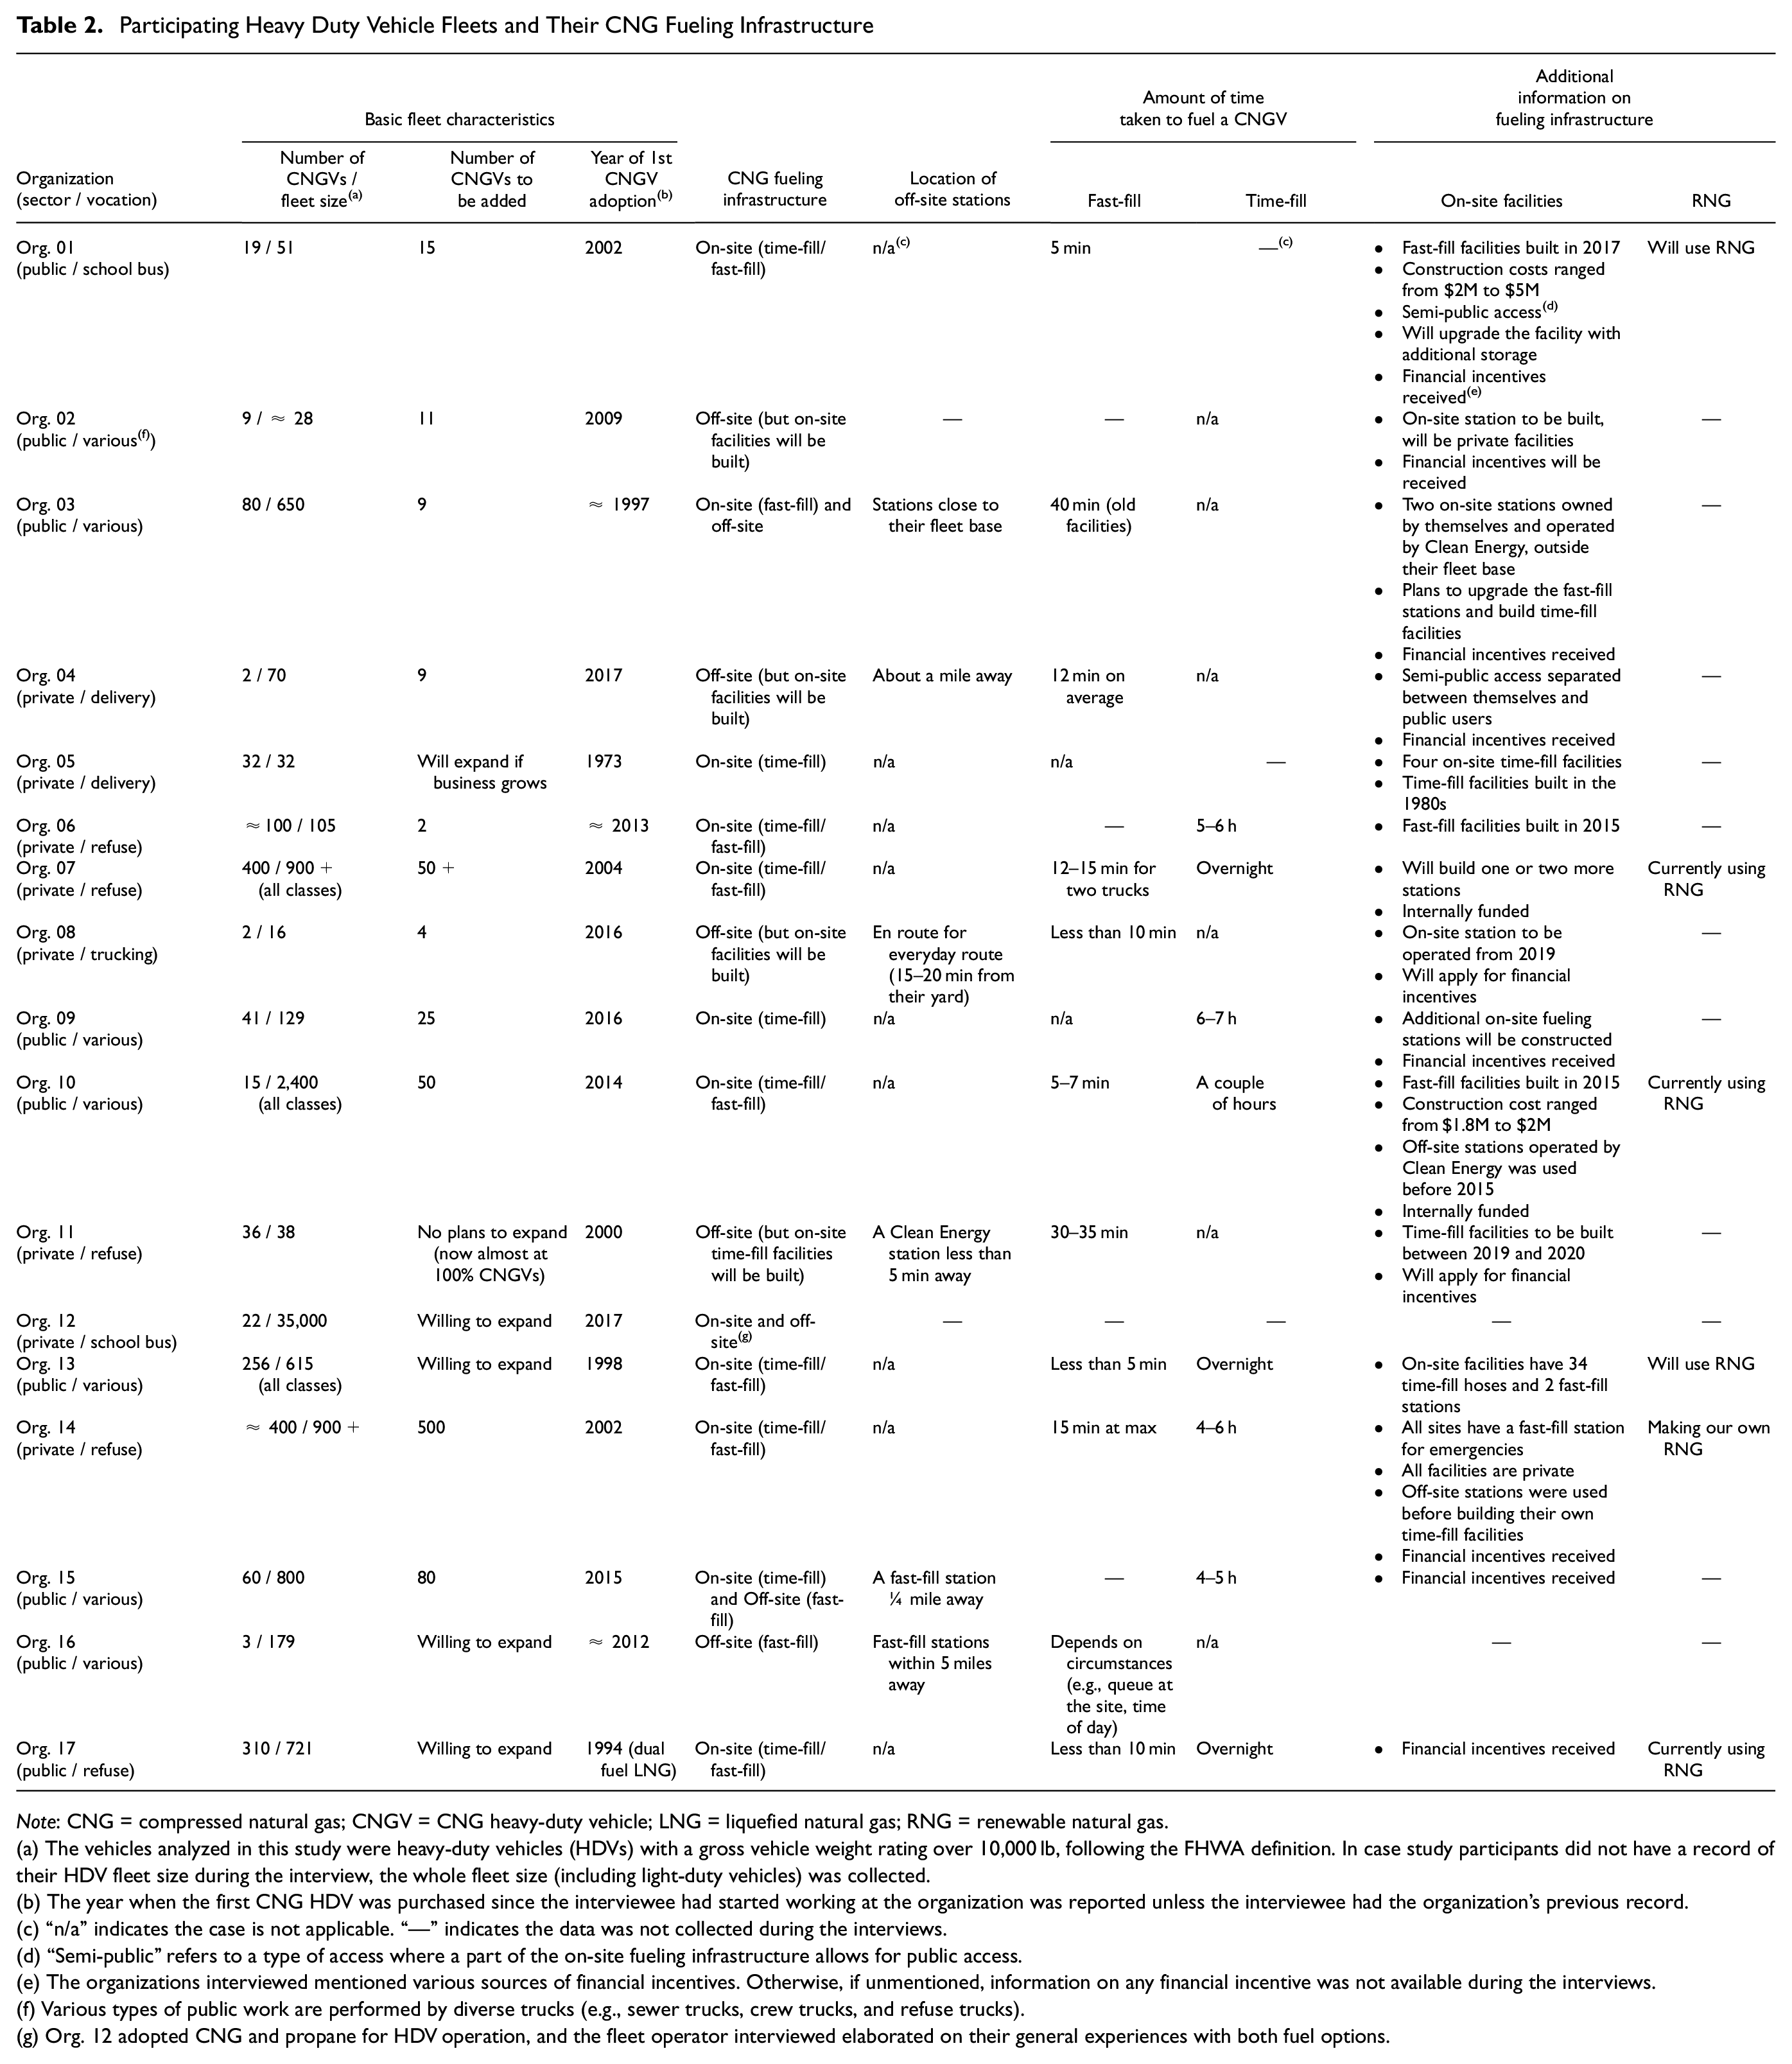
Note: CNG = compressed natural gas; CNGV = CNG heavy-duty vehicle; LNG = liquefied natural gas; RNG = renewable natural gas.
(a) The vehicles analyzed in this study were heavy-duty vehicles (HDVs) with a gross vehicle weight rating over 10,000 lb, following the FHWA definition. In case study participants did not have a record of their HDV fleet size during the interview, the whole fleet size (including light-duty vehicles) was collected.
(b) The year when the first CNG HDV was purchased since the interviewee had started working at the organization was reported unless the interviewee had the organization’s previous record.
(c) “n/a” indicates the case is not applicable. “—” indicates the data was not collected during the interviews.
(d) “Semi-public” refers to a type of access where a part of the on-site fueling infrastructure allows for public access.
(e) The organizations interviewed mentioned various sources of financial incentives. Otherwise, if unmentioned, information on any financial incentive was not available during the interviews.
(f) Various types of public work are performed by diverse trucks (e.g., sewer trucks, crew trucks, and refuse trucks).
(g) Org. 12 adopted CNG and propane for HDV operation, and the fleet operator interviewed elaborated on their general experiences with both fuel options.
Refueling at On-Site Fueling Infrastructure
The participating organizations addressed two different types of refueling equipment: time-fill and fast-fill options. These two types have structural differences that result in different amounts of fuel dispensed and time taken to fuel ( 43 ). More than half the fleets with on-site fueling infrastructure used both time-fill and fast-fill options (7 out of 11 fleets) while the others tended to have only a time-fill option. For a time-fill option, 4–7 h was reported to be the time taken to refuel their CNGV fleets. Several fleet operators also noted, “it really doesn’t matter whether it takes 4 hours, 6, or 8, because I’ve got 10 hours of downtime” during the overnight (e.g., Org. 14). Meanwhile, for a fast-fill option, 5–15 min was reported for the refueling time. For those who had plentiful slow-fill facilities, the fast-fill option was used “just for emergencies” (Org. 14).
Refueling at Off-Site Fueling Infrastructure
The participating fleets using off-site infrastructure stated that the stations were located near their fleet base (e.g., a mile away or within 5 min) in most cases or “en route for our everyday route” (Org. 8). At these off-site stations, a fast-fill option was used with a refueling time of 10–35 min. While a slightly longer and wider range of refueling time was reported than on-site fast-fill cases, one organization expressed some uncertainty in estimating the refueling time at off-site stations, such as depending on “the queue at the site, and time of day” (Org. 16).
Dis/satisfaction with CNG Fueling Infrastructure
To answer the second research question, the quantification part of the content analysis results is first depicted in Table 3, with the scoring results of dis/satisfaction (i.e., from −3 being very unsatisfied, to +3 being very satisfied) along with the types of refueling facilities used by the participating fleets. For overall dis/satisfaction with the fueling infrastructure, the participating fleets with their own on-site facilities tended to be more satisfied than those using off-site stations. The specific dis/satisfactory aspects were analyzed and classified under the list of several upper-level themes of technology characteristics, including perceived relative advantages, perceived compatibility, perceived complexity, and perceived uncertainty, which is in line with the Diffusion of Innovations theory ( 17 ).
Satisfaction on Compressed Natural Gas Refueling Infrastructure
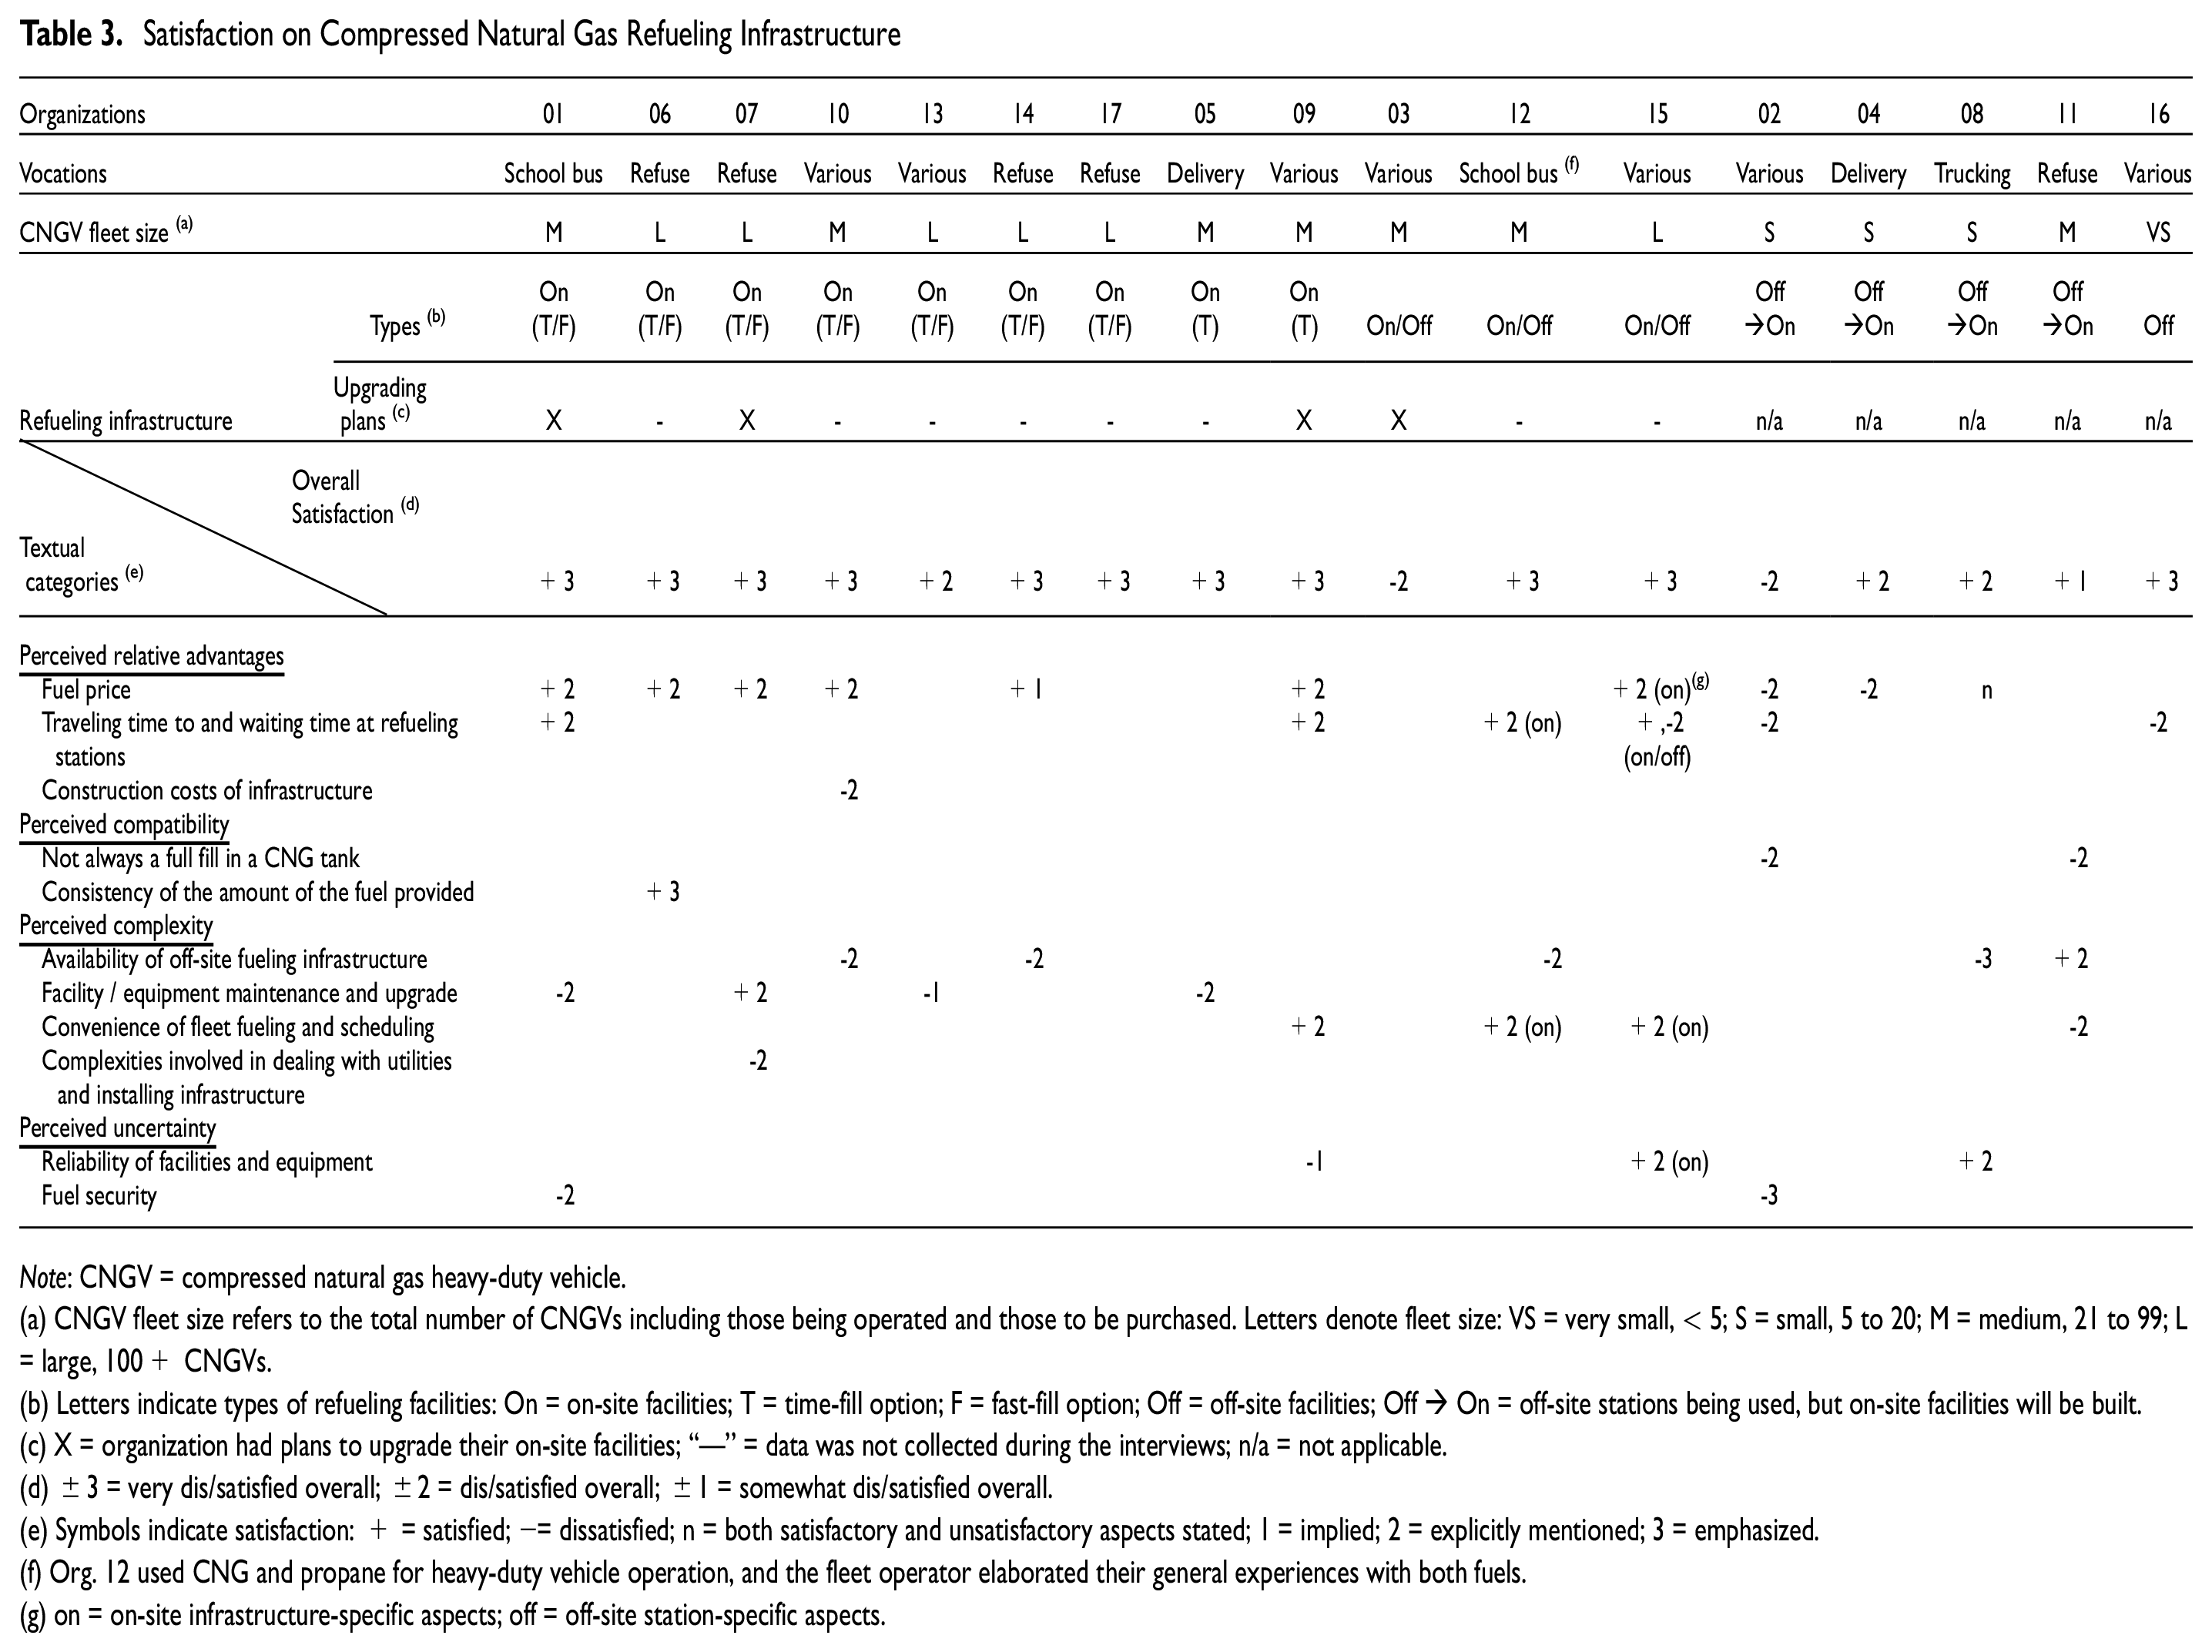
Note: CNGV = compressed natural gas heavy-duty vehicle.
(a) CNGV fleet size refers to the total number of CNGVs including those being operated and those to be purchased. Letters denote fleet size: VS = very small, < 5; S = small, 5 to 20; M = medium, 21 to 99; L = large, 100+ CNGVs.
(b) Letters indicate types of refueling facilities: On = on-site facilities; T = time-fill option; F = fast-fill option; Off = off-site facilities; Off ↑ On = off-site stations being used, but on-site facilities will be built.
(c) X = organization had plans to upgrade their on-site facilities; ‘‘—’’ = data was not collected during the interviews; n/a = not applicable.
(d) ±3 = very dis/satisfied overall; ±2 = dis/satisfied overall; ±1 = somewhat dis/satisfied overall.
(e) Symbols indicate satisfaction: + = satisfied; −= dissatisfied; n = both satisfactory and unsatisfactory aspects stated; 1 = implied; 2 = explicitly mentioned; 3 = emphasized.
(f) Org. 12 used CNG and propane for heavy-duty vehicle operation, and the fleet operator elaborated their general experiences with both fuels.
(g) on = on-site infrastructure-specific aspects; off = off-site station-specific aspects.
Across these themes, the organizations with on-site infrastructure tended to express positive or mixed remarks. Examples included satisfactory compatibility (e.g., in terms of consistency of the amount of the fuel supplied), relative advantages or disadvantages (e.g., lower fuel price, saving time for traveling to and waiting at refueling stations, but expensive construction costs), and increased or alleviated complexity (e.g., complexities involved in installing and maintaining the facilities, but convenience of fleet fueling and scheduling). In contrast, the fleets using off-site stations tended to address negative aspects across these themes, such as relative disadvantages (e.g., uncompetitive fuel prices, traveling and waiting time at refueling stations), unsatisfactory compatibility (e.g., inability to have a full-fill tank), and increased complexity (e.g., in terms of fleet fueling and scheduling). Meanwhile, there was a common negative remark across both cases of on-site and off-site fueling with regard to perceived uncertainty (e.g., fuel security issue). In the subsections below, detailed points with which the participating fleets were content or not content are discussed, for each case of on-site and off-site fueling. The aspects commonly stated by both fleets with on-site and off-site fueling are also addressed in a separate subsection.
On-site Fueling Infrastructure: Satisfactory or Dissatisfactory Aspects
In the case of organizations with their own on-site fueling infrastructure, most of them (10 out of 12) were found highly satisfied overall with the facilities (i.e., +3). Only a few organizations with their facilities on-site that were old and thus required more maintenance and upgrade expressed a moderate level of overall satisfaction or dissatisfaction (i.e., ±2). Various satisfactory aspects of having on-site infrastructure were reported, including lower fuel prices, saving time for driving to and waiting at stations, and reduced complexity in fleet operations. At the same time, several unsatisfactory aspects were also addressed, including costs and complexities associated with infrastructure construction and maintenance. For reasons of space, only the following seven main dis/satisfactory aspects are discussed in this paper.
(+) Lower fuel price: Among the benefits of having on-site fueling infrastructure, the most frequently cited was CNG fuel prices lower than those at off-site stations. One stated, “If we didn’t have a plant, our cost would be so much higher […] Because we would be paying whatever market prices for CNG” (Org. 1). In addition, a waste management company, which was producing renewable natural gas (RNG) using the waste they collected, implied satisfactory fuel costs: “We’re unique. We make our own fuel. So, even if electricity would save me a couple dollars [compared with the market price of CNG], I probably wouldn’t switch” (Org. 14).
(+) Saving time for traveling to and waiting at refueling stations: Another major advantage of on-site fueling is to save a certain amount of time that would have been otherwise needed by drivers to travel to off-site stations, as addressed by some participants (e.g., Org. 1 and 12). In addition, potential waiting time at off-site stations can be also saved: “In the CNG time-fill scenario […] There’s not that time of chatting and waiting” (Org. 15).
(+) Consistency of the amount of the fuel provided: With regard to fuel supply to their on-site facilities, one organization expressed their highest satisfaction with “the amount of fuel we’re able to acquire” and “the consistency of that fuel” (Org. 6), which indicates satisfactory compatibility of the infrastructure.
(+) Convenience of fleet fueling and scheduling: As another satisfactory aspect, the participating fleets addressed the convenience of fueling, which reduces the complexity of fleet operations, particularly when using a time-fill fueling overnight. One organization elaborated, “You’re going to bring your vehicle in at the end of the day […] You’re going to park in the spot, you’re going to hook up the hose for the time-fill, and essentially you’re going to finish your checks on that vehicle and you’re going to walk away, and it’s going to refuel all night” (Org. 15).
(−) Construction costs for on-site infrastructure: Notably, one of the major dissatisfactory aspects was the financial cost required for constructing the infrastructure, for example, more than one million dollars for a fast-fill station (see Table 2). The majority of the organizations with on-site infrastructure, therefore, sought opportunities to utilize financial incentives available from governments (see the next section for further discussions).
(−) Complexities involved in dealing with utilities and installing infrastructure: In addition to the costs, a long and complex process to deal with necessary utilities was identified as another impediment. One explained, “The only dissatisfaction I have is […] when you’re dealing with the utilities to get it done, like the gas company or the power company […] It’s just ridiculous. It takes forever and you really got to be ahead of it if you’re planning on doing one” (Org. 7). Although not directly related to the scope of this study, it is worth noting that another fleet operator elaborated on “so many hurdles” they experienced in installing electric charging stations for LDVs: “Here in my facility where I work, we put in [charging infrastructure], and by the time you do all the engineering and planning, and working with the utilities, to even get a cost estimate to even be able to do a project to get it funded and engineered and designed, it’s a year and a half to two-year process” (Org. 10).
(−) Facility and equipment maintenance and upgrade: Although the maintenance of CNG fueling equipment was perceived as “a fairly simplistic process” by one organization (Org. 7), several fleets still addressed the essential need for maintenance and upgrade, including the monitoring efforts to “keep ensuring our tanks, pressure valves, etc. are inspected […] as equipment is getting rather old” (Org. 5) and the expenses required to maintain code compliant facilities (Org. 10). These disadvantageous aspects were addressed only for on-site fueling, along with the costs and complexities in on-site infrastructure construction, while none of the fleets with off-site fueling mentioned such issues.
Off-site Fueling Infrastructure: Satisfactory or Dissatisfactory Aspects
Of the fleets relying only on off-site stations, only one (out of five) was very satisfied overall with the infrastructure (i.e., +3) while the others expressed a moderate or minimal level of overall satisfaction, or explicit dissatisfaction (i.e., −2 to +2) (See Table 3), which contrasts sharply with the cases with on-site infrastructure. Just a few satisfactory aspects were identified, including reliability of the facility and equipment. However, various unsatisfactory points were reported, such as expensive fuel prices, the time taken for driving to and waiting at off-site stations, and increased complexity in fleet scheduling. Accordingly, the following five specific points are discussed below.
(+) Reliability of facilities and equipment: One of the few satisfactory aspects of using off-site stations was that the fleets were reliably able to use the facilities and equipment. One fleet operator elaborated, “The station that we are filling at has been a very good station […] I think we’ve had two issues in the last two or three years […] And we’ve been able to call a 24-hour hotline” (Org. 8).
(−) Fuel prices: Despite fuel prices of CNG being observed to be typically lower on average than diesel ( 44 ), several participating fleets using off-site stations were found to be dissatisfied with CNG fuel prices. One explained the potential saving of fuel costs when using on-site infrastructure instead of off-site stations: “[If we own fueling infrastructure on-site] I’ll be going from paying $2.20 a gallon to about $1.80 […] I’m saving another 40 cents a gallon” (Org. 8). Another fleet operator further expressed that there is “no cost saving” in using CNG compared with diesel at a specific off-site station near their fleet base because “the owner of the station seems to know and keep their finger on the pulse of what diesel sells for, and that’s what they sell it for” (Org. 4).
(−) Traveling time to and waiting time at refueling stations, and associated labor costs: Another major disadvantage of using off-site stations was the amount of time needed for a refueling trip, including driving to the station, waiting, fueling, and driving back to the fleet base or a scheduled route. Fleet operators pointed out a particular situation, in which an off-site station is “small [in its capacity] and gets crowded” (Org. 15), causing more lost time and thus requiring them to “identify multiple sites” (Org. 16). One organization further explained their off-site refueling trips created huge labor costs: “I kind of calculated how many hours a year that costs me, and it was mind-boggling […] We were spending 700,000 dollars a year on labor costs getting back and forwards” (Org. 2).
(−) Not always a full-fill in a CNG tank: The inability to fill the tank to full capacity was addressed by a few participating fleets, especially in fast-fill scenarios during the daytime (Org. 2 and 11). This drawback is related to the properties of CNG as a gaseous fuel, which means that its density, or the energy per unit volume, can be significantly affected by changes in temperature ( 45 ). Such experiences may be inconsistent with their previous experience with diesel, which could diminish the perceived compatibility of CNG technology. As an example quotation, one elaborated, “It is a fast-fill station, which means that […] depending on the outside temperature […] you’re going to get, 75 to 85 percent of a full tank” (Org. 11).
(−) Convenience of fleet fueling and scheduling: Operating vehicles with partially filled tanks, combined with limited availability of off-site stations, may increase complexity and inefficiency in fleet scheduling: “[75 to 85 percent of a full tank] does mean our drivers may have to come in in the middle of the day to refuel during the course of their route” (Org. 11).
Common Concerns in Both Fleets with On-site and Off-site Infrastructure
There were additional concerns identified both by fleets with on-site infrastructure and those with off-site fueling, such as a fuel security issue and limited availability of off-site stations.
(−) Availability of off-site fueling infrastructure: Although one organization was satisfied with the off-site station close to their facility (Org. 11), several participating organizations repeatedly raised concerns about the limited availability of off-site fueling stations (e.g., Org. 8, 10, and 12). For fleet vocations that require trips longer than a CNGV’s maximum driving range, the insufficient infrastructure may pose fleet operational complexities and restrictions. One fleet operator explained, “We are not usually inclined to use a CNG-powered bus on a commercial charter trip […] from California to Nevada or et cetera. […] because of the fueling limitations” (Org. 12).
(−) Fuel security: Lastly, the CNG fuel security issue, particularly in case of natural disasters, was addressed as another common concern regardless of types of infrastructure being used (Org. 1 and 2). This may increase the perceived uncertainty of fuel supply and operational risk: “If an earthquake of a size that interrupts CNG flow […] Southern California gases line breaks, I am out of fuel” (Org. 2).
Fleet Decisions Between On-site Versus Off-site Fueling Infrastructure
During the investigation of fleet satisfaction with fueling infrastructure, it was found that several participating organizations made decisions to switch from off-site to on-site infrastructure or upgrade their existing on-site facilities, despite the substantial costs associated with such changes. These decisions might have been based on the level of dissatisfaction accumulated and their commitment to using CNGVs. To explore related patterns, we examined overall satisfaction levels and the fleet size planned for CNGVs (which includes both the numbers of CNGVs being operated and to be expanded) across the participating organizations that made switching or upgrading decisions compared with those that did not make such decisions. As expected, a tendency was identified where organizations that were less satisfied or were dissatisfied with off-site fueling (i.e., overall satisfaction of −2 to +2) and had a small to medium fleet size of CNGVs (at least five vehicles) were seeking to change from off-site to on-site infrastructure. In contrast, one organization (Org. 16) with the highest satisfaction level for off-site stations (i.e., +3) and a very small size of CNGV fleet (less than five) continued to rely only on off-site stations. It is also noteworthy that many other organizations with medium to large-sized CNGV fleets (20+ vehicles) had already built their own on-site stations (see Table 3). A similar case was observed for decisions related to upgrading on-site facilities. For example, one organization (Org. 3), which had a medium-sized fleet and was dissatisfied with their existing on-site facilities, planned to upgrade their infrastructure with additional equipment.
For those organizations that were planning to build on-site fueling infrastructure, we further explored specific motivators and barriers for their decisions by asking several follow-up questions (see Table 1). The analysis results are summarized in Table 4. The main motivators for building on-site facilities were to gain financial advantages from lowered CNG fuel price (Org. 2, 4, 8, and 11) and reduced labor costs associated with off-site refueling trips (Org. 2), and to ease complexity in fleet scheduling (Org. 11). Such motivators appeared to arise from the unsatisfactory aspects they experienced with off-site stations (c.f., Table 3). Meanwhile, the barriers to constructing the infrastructure that were addressed included a limited physical space for on-site facilities as well as construction costs (Org. 2).
Reasons for Not Using Off-site Fueling and Constructing On-Site Infrastructure
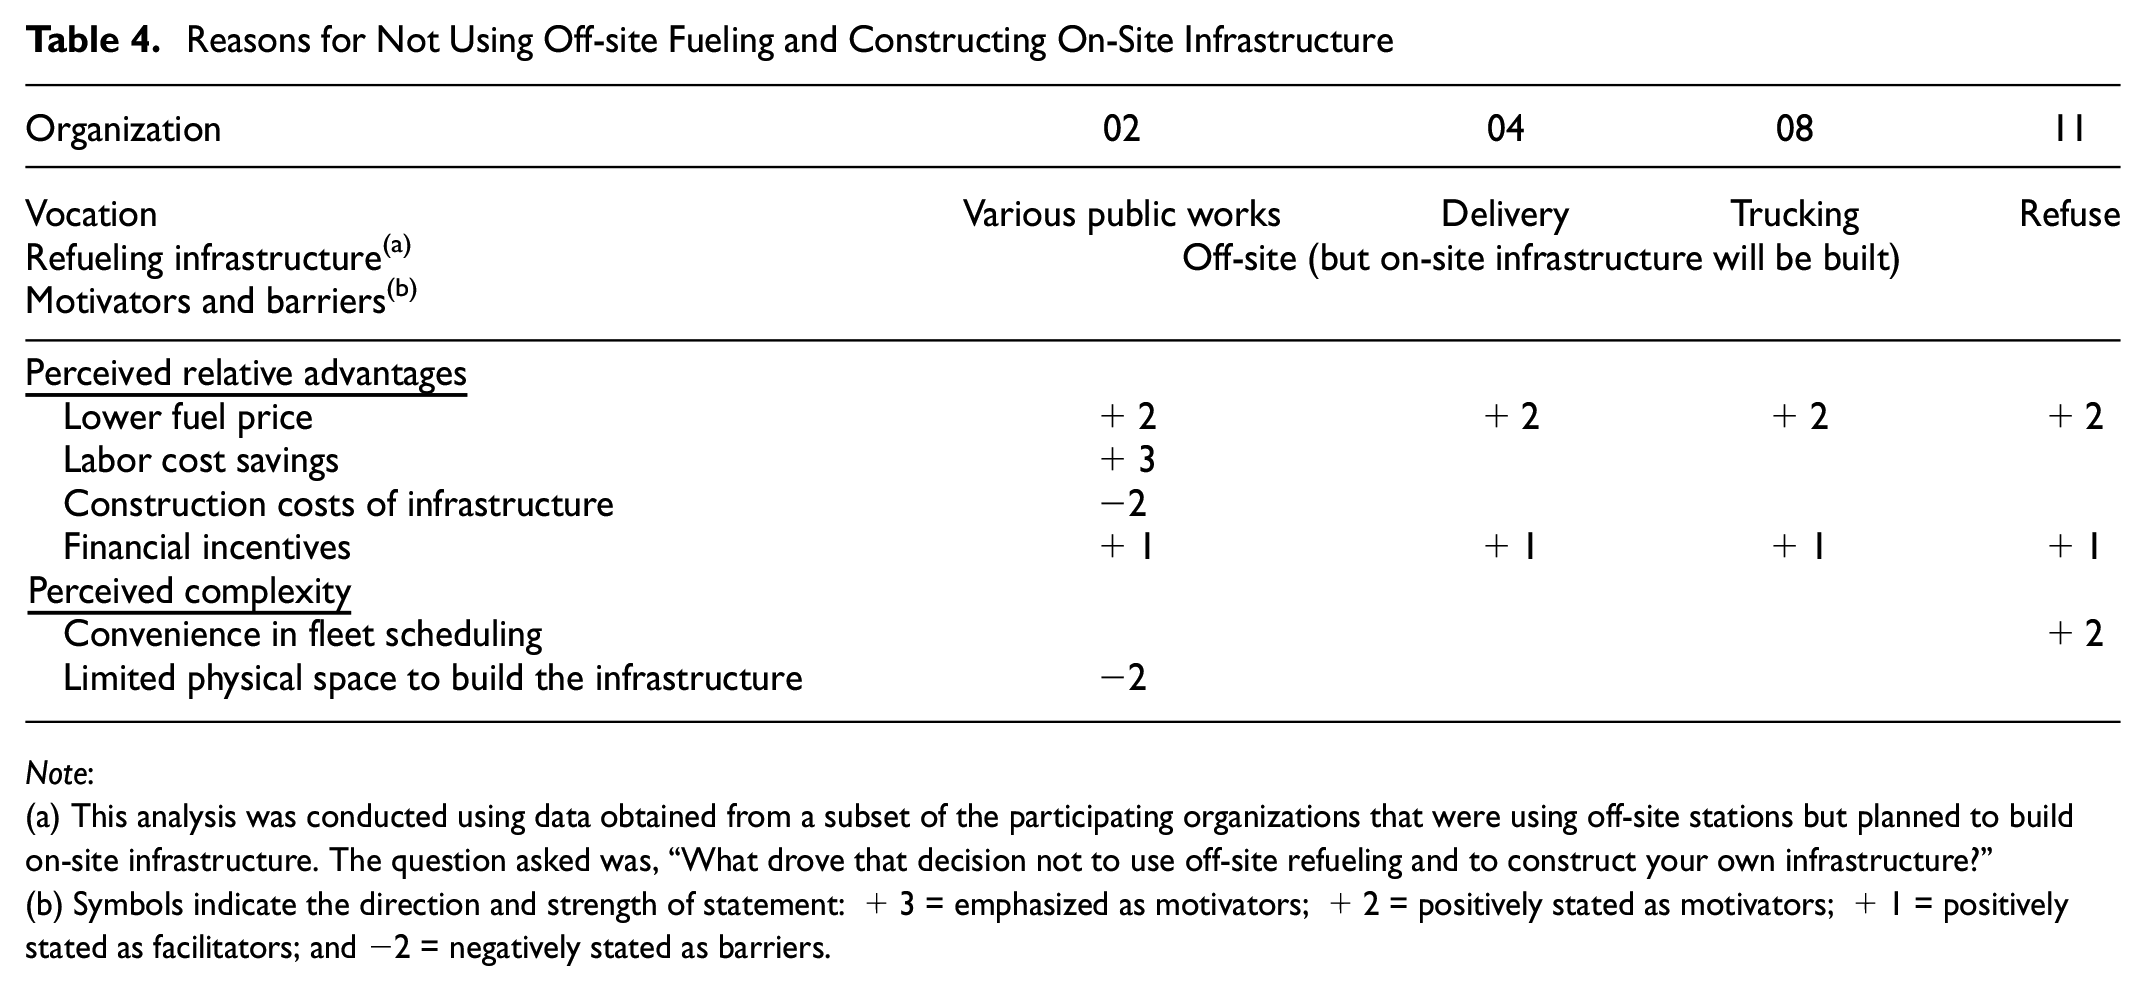
Note:
(a) This analysis was conducted using data obtained from a subset of the participating organizations that were using off-site stations but planned to build on-site infrastructure. The question asked was, “What drove that decision not to use off-site refueling and to construct your own infrastructure?”
(b) Symbols indicate the direction and strength of statement: +3 = emphasized as motivators; +2 = positively stated as motivators; +1 = positively stated as facilitators; and −2 = negatively stated as barriers.
To alleviate the construction cost barrier, financial incentives from multiple government entities were sought by most of the organizations that decided to build the infrastructure. As shown in Table 4, all four organizations that planned to build on-site facilities stated that they already applied or planned to apply for incentive programs. In addition, at least half the organizations that had already constructed on-site infrastructure reported on incentives they utilized from various government sources, including the Carl Moyer Program ( 46 ) and the Mobile Source Air Pollution Reduction Review Committee ( 47 ) (see Table 2). Given that the participating organizations mentioned the incentives as supplementary information, such financial support could be interpreted as a facilitator of the decisions, though the actual impacts of the incentives on these decisions would require further exploration.
Lastly, the participating organizations addressed subsequent decisions following their choice about on-site versus off-site fueling. First, those who decide to build on-site infrastructure should decide on type of equipment (e.g., time-fill and/or fast-fill options), capacity (e.g., size of fuel storage), and type of access (e.g., private versus semi-public) (see Table 2). While allowing for public access to their own on-site facilities could help other fleets expand their geographical operational coverage ( 27 ), the participating fleets revealed different choices. Some considered opening a part of the facilities to the public mainly to share the costs (e.g., Org. 1), but others preferred keeping their facilities private because they had insufficient space in their yard (Org. 2), or they did not prefer selling the fuel to others (Org. 14). Another decision was on whether to use a renewable fuel. More specifically, growing interest in using RNG was observed among the participating fleets with on-site infrastructure (6 out of 11) (see Table 2). As the motivators for using RNG, the participants pointed out the fuel price being “even cheaper than the natural gas fuel from the petroleum sources” and the environmental benefits of “a negative carbon footprint as far as lifecycle analysis” (Org. 17). Meanwhile, those organizations who decide to use off-site infrastructure should also make ensuing decisions, including selection of the specific off-site stations and scheduling of fleet fueling, by considering specific operational characteristics of AFVs (e.g., where to “dispatch CNGVs” and “where they can be refueled and properly operated” [Org. 16]).
Overall, the analyses in this subsection, combined with the dis/satisfactory aspects previously addressed on infrastructure, may serve as motivators or barriers for deciding between on-site or off-site fueling. Table 5 summarizes such motivators and barriers for each decision of constructing on-site infrastructure versus using off-site fueling stations.
Summary of Fleet Decisions for On-site Versus Off-site Fueling
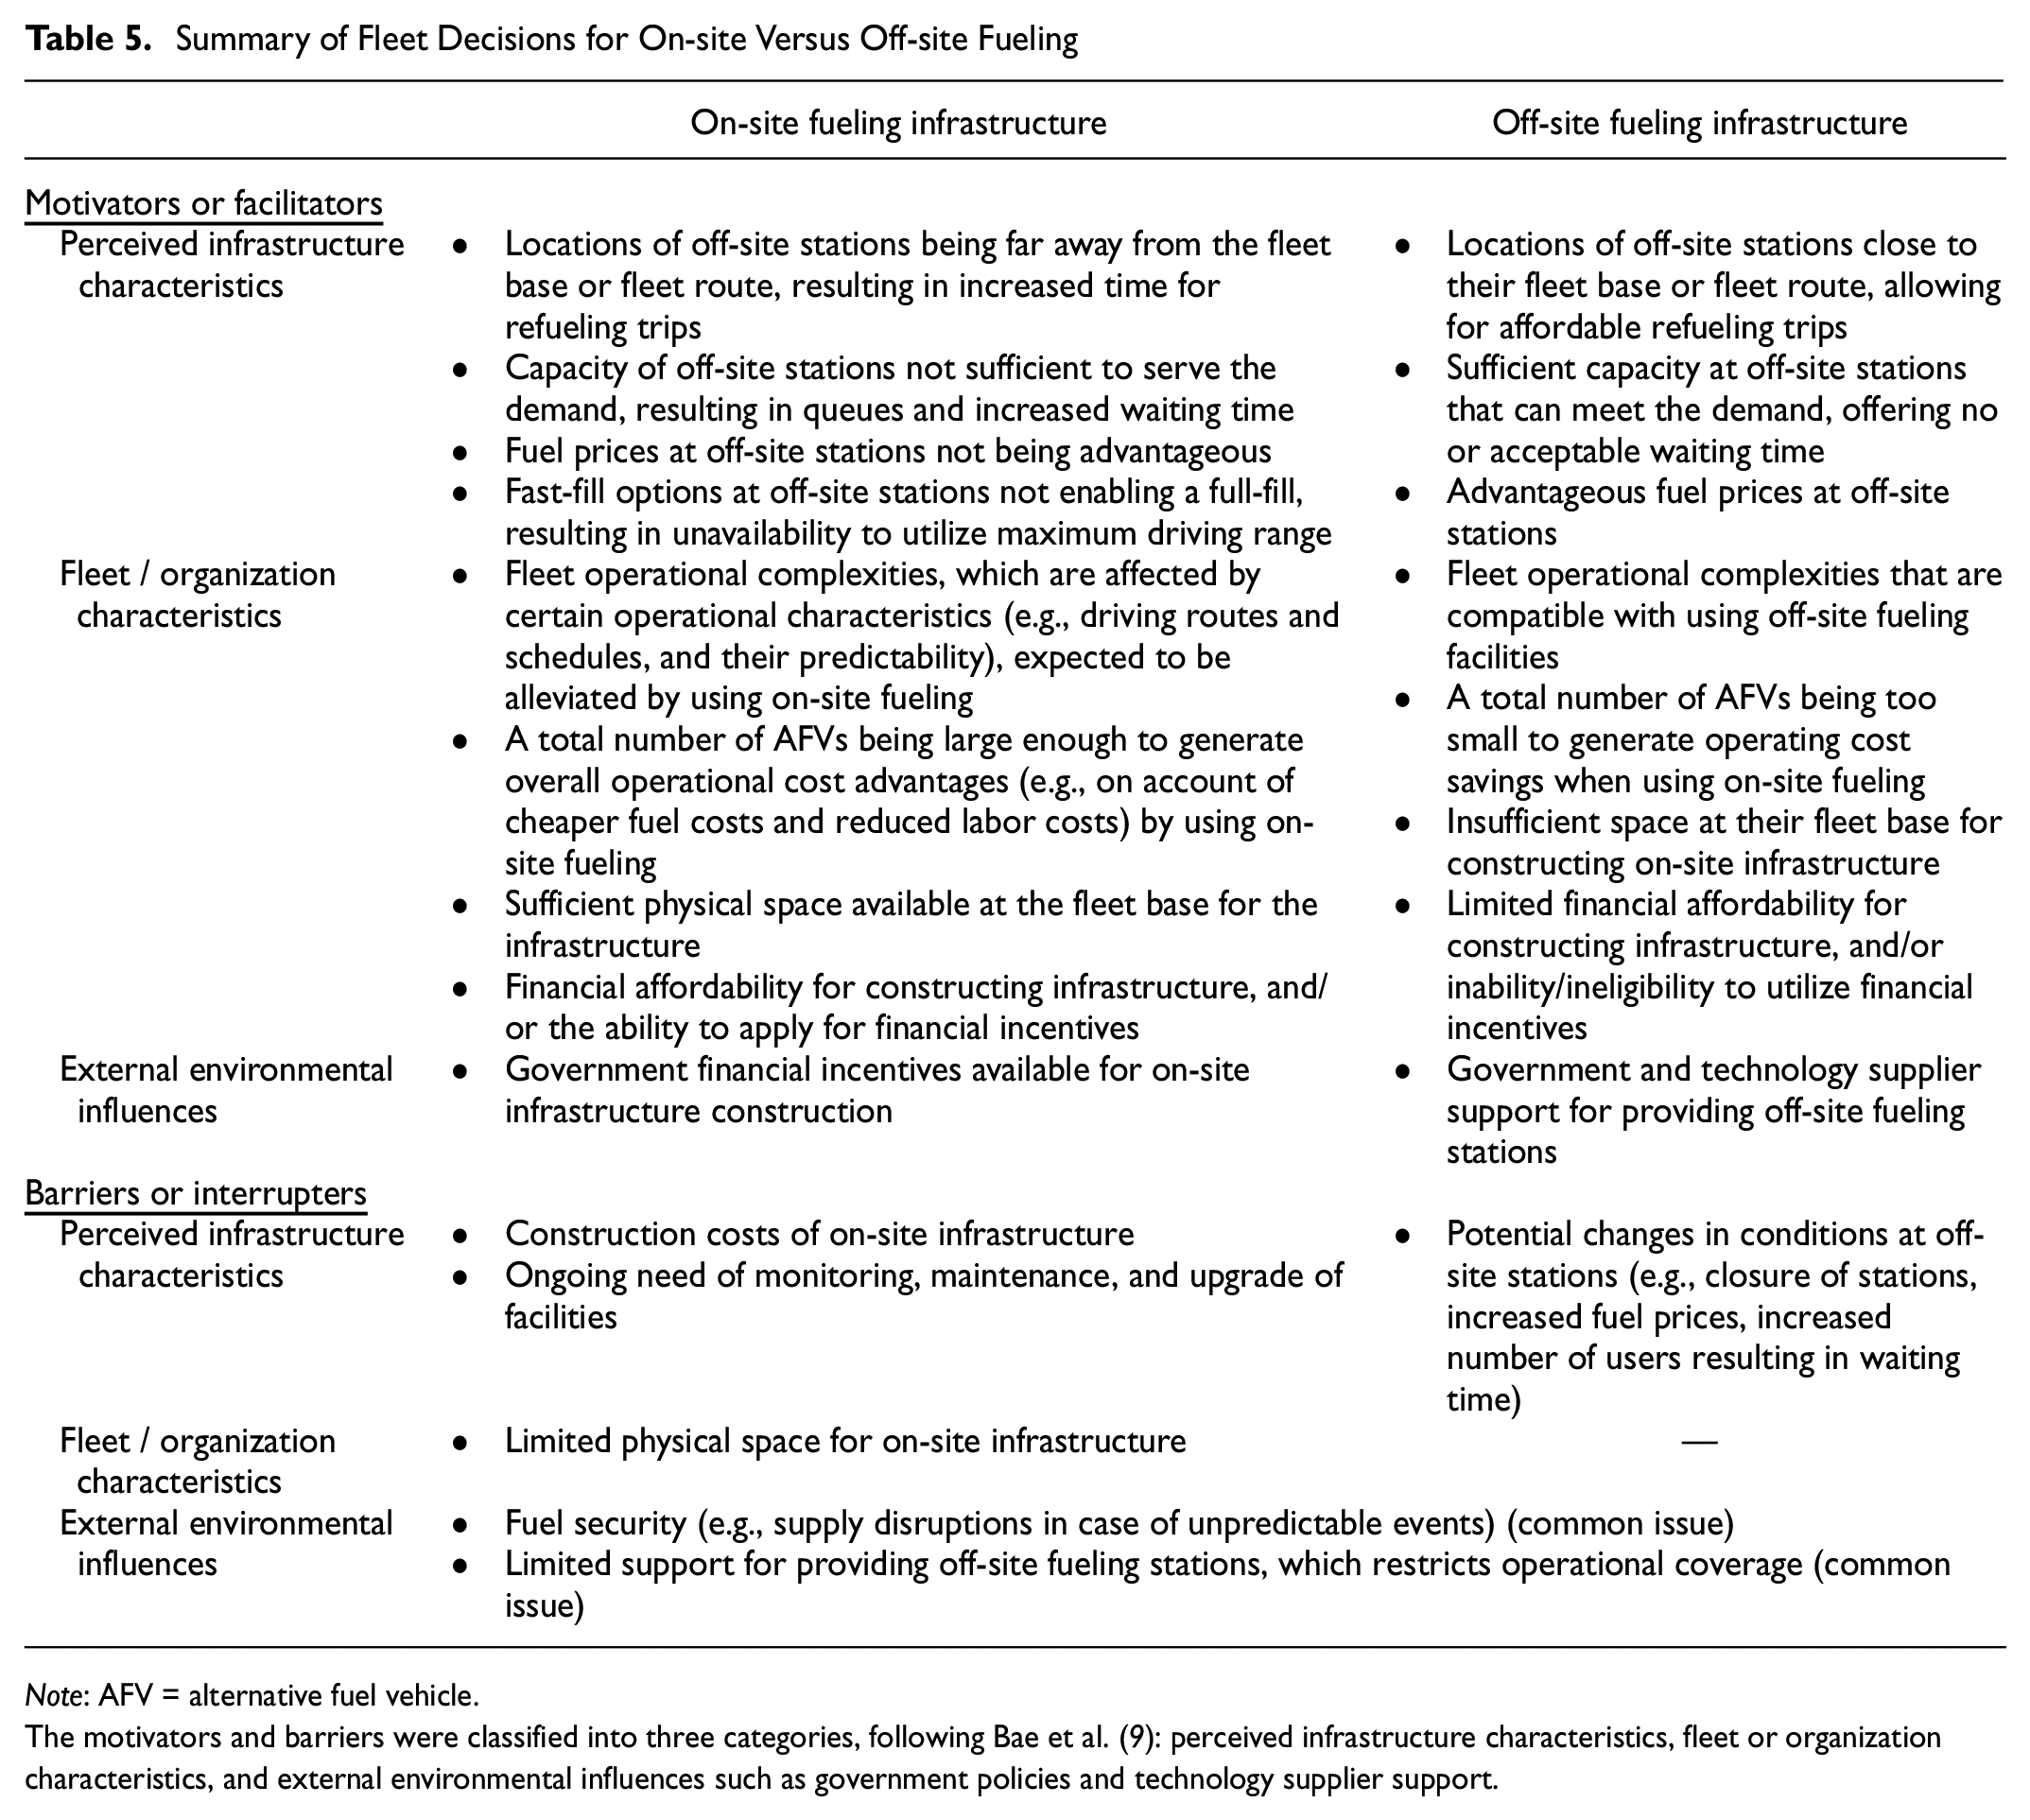
Note: AFV = alternative fuel vehicle.
The motivators and barriers were classified into three categories, following Bae et al. ( 9 ): perceived infrastructure characteristics, fleet or organization characteristics, and external environmental influences such as government policies and technology supplier support.
Conclusion and Recommendations
Summary Findings
Despite aggressive policy goals to reduce HDV-generated emissions using cleaner fuel technologies, there is limited understanding of how HDV fleet operators have navigated the issues involving the lack of fueling infrastructure, which is a major barrier to adoption ( 9 ). This work attempted to explore how HDV fleets have used alternative fueling infrastructure, how dis/satisfied the fleet operators were with the infrastructure, and for what reasons they decided to construct their own on-site facilities or to use off-site fueling stations. Based on a case study of CNG, the most prevalent alternative fuel option and a feasible option in the near-to-intermediate term in the HDV sector, in-depth qualitative interviews were conducted with California fleet operators across various types of fleet vocations. The results from content and thematic analyses yielded comprehensive qualitative inferences on use behavior and specific un/satisfactory aspects distinguished between on-site and off-site fueling, along with motivators and barriers for the fueling infrastructure decisions. The study findings are the first step toward improving our understanding of HDV fleet behavior and alternative fueling infrastructure. Some of the main findings are summarized below.
For use behavior of CNG fueling infrastructure:
At on-site fueling facilities, the time-fill option was used while some fleets also used the fast-fill option.
Off-site stations used were located near the fleet base or on the way to the destination, offering the fast-fill option.
Extended refueling time at on-site facilities was not a concern as vehicles were refueled overnight, whereas off-site refueling time sometimes posed uncertainty depending on the time of day and queue at the site.
For dis/satisfaction with the infrastructure:
Overall, fleets with on-site fueling facilities tended to be more satisfied than those using off-site stations.
For on-site fueling, satisfactory aspects included lower fuel prices, time saved from traveling to and waiting at stations, and convenience of fleet fueling and scheduling. However, unsatisfactory aspects, such as construction costs, complexities involved in dealing with utilities and installing infrastructure, and facility maintenance/upgrades were also reported.
For off-site fueling, a few satisfactory aspects were reported such as reliable facilities and equipment. However, several unsatisfactory aspects were addressed, including uncompetitive fuel prices, traveling/waiting time, associated labor costs, and increased scheduling complexity.
Organizations with on-site facilities and those using off-site stations both shared common concerns about fuel security and limited availability of off-site fueling infrastructure.
For decisions to build on-site versus use off-site fueling infrastructure:
The size of the CNGV fleet was observed to be related to decisions about constructing on-site facilities versus using off-site stations. Medium to large-sized fleets (20+ vehicles) had on-site facilities, small to medium-sized fleets planned to switch to on-site infrastructure, and a very small-sized fleet (<5 vehicles) continued to use off-site stations only.
Unsatisfactory aspects experienced with off-site fueling may serve as motivators for organizations to decide to construct on-site fueling facilities.
Limited space and financial incentives were additionally reported as an obstacle and a facilitator, respectively, for building on-site infrastructure.
Further Research to Develop Policy Recommendations
For policy recommendations to support fueling infrastructure, our qualitative findings have implications for further research that could help advance both on-site and off-site fueling infrastructure to sustain existing users and secure new adopters. First, financial support from governments was found to be helpful by most of the participating organizations that had already built or planned to construct on-site infrastructure. To develop policy suggestions for better design of such incentive programs, further work should be undertaken to estimate the potential impact such incentives would have on fleet operators’ decisions to build on-site infrastructure, with potential differences in such impacts across different fleet sectors, vocations, sizes, and incentive amounts.
Second, the limited availability of off-site stations was repeatedly pinpointed as a concern by both fleets using off-site fueling and those with on-site infrastructure. To support the expansion of off-site fueling infrastructure, better planning and design may be necessary, including estimating the number of stations required and their capacity, and determining their locations. Further research, including quantitative data collection on alternative fueling practices and experimental analyses of fleet responses, can assist these efforts. For example, fleet survey data would be useful in providing insight into whether fleet operators would procure AFVs and what fueling facilities they would prefer under different scenarios of off-site station properties, such as station locations and fuel prices.
Moreover, for the types of access to on-site fueling facilities, different choices were observed among the participating fleets, such as allowing for public access to their infrastructure versus keeping the facilities private. Such different choices might have a different impact on the decisions of other fleets operating nearby, for their AFV adoption and/or fueling infrastructure decisions. Further experimental studies are therefore suggested to establish the relationships between fleet operator choices about types of access, if they would have on-site infrastructure, and their potential impacts on other fleets’ decisions, and to explore any implications for better incentive design.
Limitations and Future Work
Our research has several limitations, primarily related to the study design. First, because of the small sample size, the findings might not be generalized to the population of California’s HDV fleets. In addition, there are some fleet segments lacking from the sample of natural gas adopters, in terms of fleet vocations (e.g., drayage trucks) or fleet size (e.g., smaller fleets with less than 10 vehicles). Given the heterogeneity of fleet behavior in the HDV sector ( 18 ), insights into those segments are rather limited. A future study based on a larger representative sample, or targeting those lacking segments, will therefore need to be performed to obtain generalized findings, and to enhance our understanding.
Other weaknesses in the scope of our sample should also be recognized. For example, further investigation focusing on adopters of other alternative fuels, such as propane, biodiesel, or renewable diesel, may strengthen the understanding of alternative fueling behavior in HDV fleets. Moreover, HDV fleets using zero-emission fueling/charging infrastructure were beyond the scope of recruitment for this study due to only a peripheral market penetration of those technologies. It is not inconceivable that additional complications would have been observed if the focus had also been on such fleets of battery electric or hydrogen fuel cell electric HDVs. Further data collection is thus required, once such recruitment becomes feasible, to better understand the advantages and difficulties in fueling/charging zero-emission HDV fleets. This includes delving into challenges associated with installing ZEV infrastructure, such as managing utilities, and developing practical and efficient solutions. Furthermore, modification of the sampling design to include the fleets that considered but rejected an alternative fuel (i.e., active rejection cases ( 9 )) may be conducive to obtaining particular insights on infrastructure barriers leading to such rejection decisions. Lastly, while this work focused on the California HDV sector, some other U.S. states also have abundant CNG stations, such as Oklahoma and Texas ( 36 ). Future studies should be conducted to explore and compare alternative fueling behavior in such different regions, along with consideration of any state-specific policies, support, and technology aspects for HDVs.
Finally, our qualitative findings on fueling behavior and decisions across diverse fleet segments have raised many questions in need of further investigation. Data collection and analyses are first recommended, for example, considering a distribution of fleet home-base locations, their operational coverage and fueling behavior, along with their basic fleet characteristics (e.g., vocations and sizes), to understand current alternative fueling practices quantitatively and spatially. Such efforts may help identify fueling/charging strategy(ies) that could best serve a certain operational need for a fleet with a certain type of fuel technology, a certain fleet size, and certain operational complexity. In addition, there may exist fleet segments that do not have the choice of either on-site or off-site fueling for an alternative fuel technology: for example, smaller fleets or owner-operators, particularly those who operate their vehicles with a lack of infrastructure (e.g., off-site stations are too distant from their operational coverage), but do not have enough space in their yard or cannot afford to build their own facilities. Future studies should also address innovative fueling/charging solutions for those fleet segments. The findings from such further research, addressing fueling/charging strategies and behavior differentiated across various segments, could facilitate more realistic approaches in other related research, such as spatial and temporal forecasting of fuel demand, and station location problems.
Footnotes
Acknowledgements
The authors gratefully acknowledge the assistance provided by the California Energy Commission. The authors would also like to express their appreciation to the anonymous reviewers for their valuable feedback and insightful comments, contributing significantly to improving the quality of this paper.
Author Contributions
The authors confirm contribution to the paper as follows: study conception and design: Y. Bae, C. R. Rindt, S. G. Ritchie, S. K. Mitra; data collection: Y. Bae, S. K. Mitra, C. R. Rindt; analysis and interpretation of results: Y. Bae, C. R. Rindt, S. K. Mitra; draft manuscript preparation: Y. Bae. All authors reviewed the results and approved the final version of the manuscript.
Declaration of Conflicting Interests
The authors declared no potential conflicts of interest with respect to the research, authorship, and/or publication of this article.
Funding
This study was funded by the California Energy Commission through the Natural Gas Vehicle Incentive Project.
The contents of this paper reflect the views of the authors who are responsible for the facts and the accuracy of the data presented in the paper. The contents do not necessarily reflect the official views or policies of the California Energy Commission.