
Abstract
Background
Excessive iron deposition is associated with migraine occurrence, disease severity, and related dysfunction. The migraine attack is a coordinated, whole-nervous-system event, while previous research has predominantly focused on discrete brain regions. This study aims to explore the associations between network-level iron deposition and both disease occurrence and clinical manifestations in migraine using the functional connectome.
Methods
Seventy-three migraine patients, including 32 episodic migraine (EM) and 41 chronic migraine (CM), and 37 age- and sex-matched healthy controls (HCs) were recruited. All participants underwent magnetic resonance imaging (MRI) to acquire quantitative susceptibility mapping (QSM) data. First, individual iron deposition maps were defined by comparing iron levels in each patient versus HCs. Next, the network coupling with each patient's site of iron deposition was calculated using seed-based functional connectivity (FC) in a large (n = 1000) normative connectome, termed the iron deposition network map (IDNM). We then performed inter-group analysis to identify disease- and symptom-associated brain regions and measured the FC strength between these regions and the patients’ iron deposition maps. Finally, we investigated the relationships between IDNM-derived metrics and various clinical manifestations, including headache characteristics, migraine-related symptoms, disability measures, and comorbidities.
Results
IDNM group comparisons revealed significant differences in the superior temporal gyrus (STG), insula, and cerebellum in both migraine vs. HCs and CM vs. HCs comparisons, whereas no statistically significant differences were found for EM compared to either CM or HCs. FC strength between the peak site of the regions and individual iron deposition maps showed good discriminative performance in receiver operating characteristic (ROC) analysis (AUC > 0.70), effectively distinguishing migraine patients from HCs. Moreover, we identified clinical manifestation-related networks based on the IDNMs: the cerebellum for monthly headache days (MHDs; r = 0.349, p = 0.003); the orbitofrontal cortex (OFC) and nucleus accumbens (NAC) for poor sleep quality (r = 0.604, p < 0.001); and the globus pallidus (GP) for vomiting (p < 0.001).
Conclusion
Network-level iron deposition may distinguish migraine patients from HCs and is associated with clinical manifestations including MHDs, poor sleep quality, and vomiting symptoms, suggesting that iron deposition may play a role in migraine through the functional connectome.
This is a visual representation of the abstract.
Keywords
Introduction
Migraine is a complex and disabling neurological disorder that affects over one billion people worldwide (1). The disease is characterized by recurrent moderate to severe headaches accompanied by symptoms such as nausea, vomiting, photophobia, and phonophobia (2). Additionally, migraine is often comorbid with various conditions including anxiety, depression, and poor sleep quality (3,4). According to the third edition of the International Classification of Headache Disorders (ICHD-3), it can be classified into episodic migraine (EM) and chronic migraine (CM). The latter is defined as headaches over 15 days per month for ≥ 3 months, with at least 8 days having migraine features (2).
In recent years, an increasing number of studies have found that excessive iron deposition in different gray matter regions of migraine patients. These regions include both cortical and subcortical structures, such as the insula, thalamus, periaqueductal gray (PAG), and basal ganglia (BG) (5–7). This phenomenon may be closely related to the pathophysiological mechanisms underlying migraine attacks. On the one hand, excessive release of vasoactive peptides such as calcitonin gene-related peptide (CGRP) may trigger neurogenic inflammation; on the other hand, sustained activation of brain regions involved in pain modulation may lead to increased local perfusion and oxygenation, which promotes abnormal iron deposition (8–10). Moreover, prior research has demonstrated that iron deposition levels in specific brain areas are significantly associated with disease severity, clinical symptoms, and even treatment response (5,11). These findings suggest that iron deposition may serve as a biomarker for migraine.
Prior work on brain iron deposition in migraine patients has primarily identified abnormal brain regions at the group level by comparing average iron deposition between migraine patients and healthy controls (HCs) (5–7). While these methods can reveal associations between iron deposition in specific regions and clinical symptoms, the heterogeneity of iron distribution among patients may lead to instability and inconsistency within individual studies and across different studies, particularly those with small sample sizes. In fact, migraine attacks are not localized events confined to single brain regions, but rather involve the coordinated activation of multiple neural networks (12). A recently developed technique known as lesion network mapping provides new insights into addressing these challenges by extending the analysis from single brain regions to the network level. This method also allows for individual analysis and has been widely applied in network localization studies of various neurological and psychiatric disorders (13–16). In this context, our study applies lesion network mapping to iron deposition for the first time. We aim to investigate the associations between network-level iron deposition and both disease occurrence and clinical manifestations in migraine patients and their subgroups based on common brain regions affected by iron deposition through the functional connectome.
Methods
Participants
This study was approved by our institutional review board, and all participants provided written informed consent. Between October 2020 and March 2023, we prospectively recruited patients diagnosed with EM or CM from the Headache Center at Beijing Tiantan Hospital, Capital Medical University (2). All diagnoses were made by three experienced headache specialists (Y.W., Y.Z., H.T.) according to the ICHD-3 criteria. The inclusion criteria for patients were as follows: (1) confirmed diagnosis of EM or CM (all patients had migraine without aura); (2) history of migraine more than one year; (3) right-handedness. The exclusion criteria for patients were: (1) diagnosis of other primary headache disorders or chronic pain conditions (e.g., fibromyalgia, temporomandibular disorder, myofascial pain); (2) presence of neurodegenerative, cardiovascular, or psychiatric conditions; (3) use of preventive medications for over three consecutive months prior to enrollment, or of acute analgesics within two days before the magnetic resonance imaging (MRI) scan. Inclusion criteria for HCs: (1) no abnormal brain lesions or calcifications on cranial imaging; (2) no history of neurological, psychiatric, or major systemic diseases; (3) right-handedness. Exclusion criteria: (1) contraindications to MRI; (2) pregnancy or breastfeeding. In total, 73 migraine patients (32 EM and 41 CM) and 37 matched HCs were recruited. All HCs underwent MRI scanning, whereas the patients completed both MRI scanning and clinical assessments during the interictal period.
Clinical evaluation
Prior to MRI acquisition, all migraine patients completed a standardized headache questionnaire. This questionnaire was evaluated by two neurologists (Z.Y. and P.Z.) with extensive experience in headache management. Collected data included demographics (age, sex, and body mass index) and headache characteristics such as disease duration, monthly headache days (MHDs), headache intensity assessed using the Visual Analogue Scale (VAS), and accompanying symptoms (nausea, vomiting, photophobia, and phonophobia). In addition, the following scales were used to assess patients: the Migraine Disability Assessment (MIDAS) and Headache Impact Test-6 (HIT-6) for migraine-related disability; the Generalized Anxiety Disorder-7 (GAD-7) and the Patient Health Questionnaire-9 (PHQ-9) for anxiety and depression, respectively; and the Pittsburgh Sleep Quality Index (PSQI) for sleep quality.
MRI acquisition
MRI scanning was conducted on a 3.0 Tesla GE MRI system (Signa premier, GE Healthcare, Waukesha, WI, USA) equipped with a 48-channel head coil. Each participant underwent an identical imaging protocol. High-resolution three-dimensional (3D) T1-weighted images (T1-WI) were acquired using a magnetization-prepared rapid gradient-echo (MP-RAGE) sequence with 1.0-mm isotropic resolution. Imaging parameters included repetition time (TR) = 400 ms, echo time (TE) = 3 ms, slice thickness = 1 mm, 192 slices, flip angle = 8°, field of view (FOV) = 256 × 256 mm2, reconstruction matrix = 256 × 256, acceleration factor = 2, and acquisition time = 4 min. Quantitative susceptibility mapping (QSM) data were collected using a multi-echo 3D gradient recalled echo (GRE) sequence with the following settings: TE = 4.0/8.9/13.7/18.5/23.4 ms, TR = 27.4 ms, matrix = 240 × 240, slice thickness = 1.8 mm, flip angle = 20°, FOV = 220 × 220 mm2, and voxel dimensions = 0.9 × 0.9 × 1.8 mm3. The total acquisition time for QSM was 2 min and 34 s.
Data preprocessing procedure
QSM images were reconstructed from GRE data using SEPIA (SuscEptibility mapping PIpeline tool for phAse images), a comprehensive MATLAB-based toolbox that integrates a wide range of established algorithms for QSM processing (https://sepia-documentation.readthedocs.io) (17). QSM reconstruction followed a standardized pipeline derived from previous methodological work (18,19). To enable inter-subject comparison, QSM maps were registered to Montreal Neurological Institute (MNI) space through a two-step process, ensuring accurate anatomical correspondence for group-level analysis (Figure 1A). The detailed preprocessing pipeline was provided in Online Supplementary Figure 1 and its corresponding description, “Detailed Method of Data Preprocessing”.
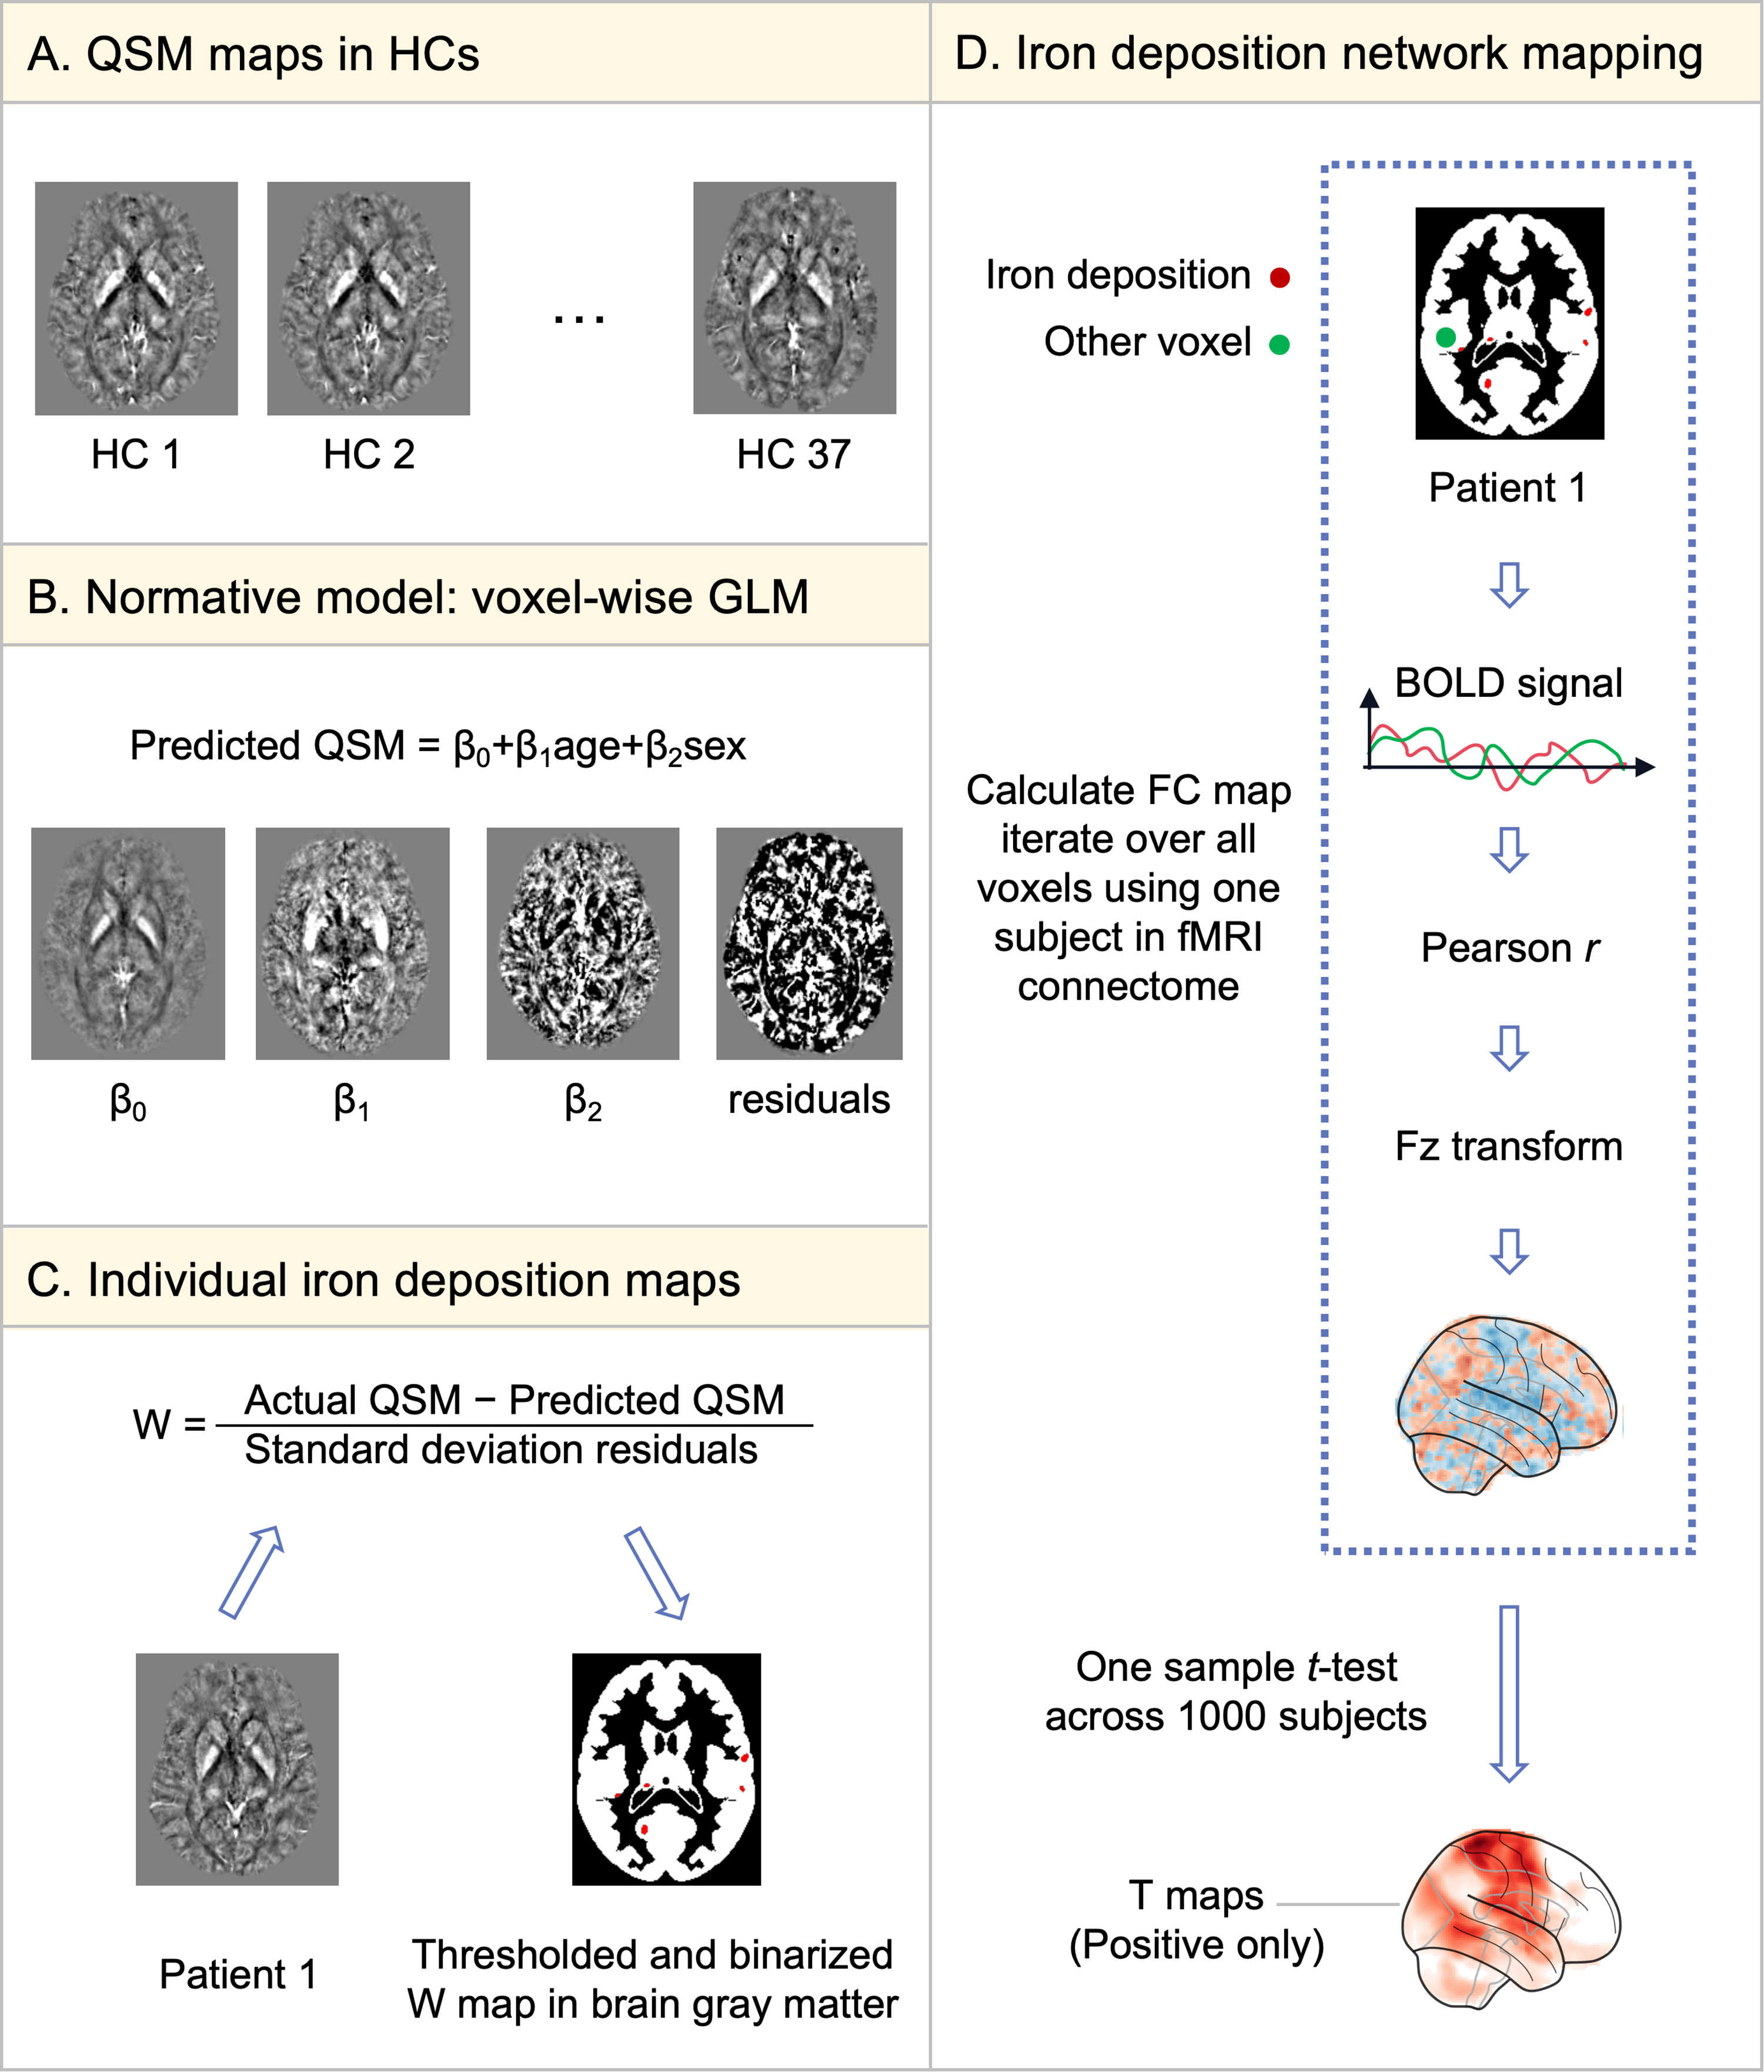
Flowchart of methods for individual iron deposition and network mapping. (A) The QSM data of HCs obtained after preprocessing and registration to standard space. (B) A standard GLM of QSM was established using age and sex as variables in HCs. (C) Each patient's QSM was compared to the standard model to generate a voxel-wise map, referred to as the individual iron deposition map. (D) For each iron deposition site, an IDNM was constructed by conducting seed-based FC analyses between the site and all other voxels using resting-state fMRI data (2 × 2 × 2 mm resolution) from 1000 healthy subjects (https://dataverse.harvard.edu/dataverse/GSP). Abbreviations: QSM, Quantitative susceptibility mapping; HC, healthy control; GLM, generalized linear model; BOLD, blood oxygenation level dependent; FC, functional connectivity; fMRI, functional magnetic resonance imaging; IDNM, iron deposition network map
Individual iron deposition maps
We constructed a voxel-wise general linear model (GLM) for iron deposition using data from HCs, with age and sex as covariates (Figure 1B). Next, we used the beta maps for the constant term, age, and sex, along with the residual maps derived from the normative model, to compute a voxel-wise w-score of iron deposition for each patient. The w-score represents a z-score that is adjusted for covariates such as age and sex (Figure 1C). The w-score for each voxel was calculated using the formula: w-score = (actual QSM – predicted QSM) / RSD, where “actual QSM” refers to the patient's measured iron deposition, “predicted QSM” is the iron deposition estimated from the normative model, and RSD corresponds to the residual standard deviation derived from the normative model. Iron deposition w-score map was binarized at a threshold of w-score > 2, indicating iron deposition 2 standard deviations above the mean of HCs after adjusting for age and sex. We repeated above analyses with stricter (w > 2.5) and looser (w > 1.5) iron deposition thresholds to confirm that the results remained consistent regardless of the chosen threshold (Online Supplementary Figure 2). All calculations were performed using Python version 3.9 with custom scripts.
Iron deposition network mapping
Subsequently, we generated an “iron deposition network map (IDNM)” for each participant, defined as functional connectivity (FC) strength between each voxel and individual iron deposition maps. First, using openly accessible normative FC data from 1000 healthy subjects provided by the Genome Superstruct Project (GSP) (20), we calculated the mean blood oxygen level-dependent (BOLD) signal time course across all voxels within each patient's individual iron deposition map. Then, we computed the correlation between this mean time course and the BOLD time series of every other voxel within the brain gray matter. The resulting r-values were transformed into z-scores following Fisher's r-to-z conversion to approximate a normal distribution. These z-scores were subsequently used to perform a voxel-wise one-sample t-test across the 1000 subjects in the normative connectome dataset. To minimize contentiousness of negative correlations, only the positive t-values were retained. As shown in Figure 1D, the resulting positive t-map served as an individual IDNM. Eventually, we overlaid all IDNMs from all patients to identify regions functionally connected to iron deposition sites in the majority of patients (Figure 2B).

Iron deposition network mapping results in migraine and its subgroups. (A) Percentage of individual iron deposition maps (w-score > 2) overlapping in the same site. (B) Percentage of IDNMs overlapping in the same site. (C) A two-sample t-test was performed to compare IDNMs between migraine patients and HCs, using permutation-based multiple comparisons implemented in SnPM13 (10,000 simulations), with a voxel-wise cluster-forming threshold of p < 0.001 and results reported at voxel-wise FWE-corrected p < 0.05. In the subgroup analysis, CM patients showed similar results to the overall migraine population, while EM patients showed no significant difference. Abbreviations: EM, episodic migraine; CM, chronic migraine; IDNMs, iron deposition network maps
Comparing IDNMs in migraine patients versus HCs
IDNMs from migraine patients were compared to those of age- and sex- matched HCs. Iron deposition in these HCs was defined using the same procedure as above. Each HC was assessed against the normative model, and the resulting w-score maps were binarized at a threshold of w > 2. In HCs, these regions were expected to show a random spatial distribution. Voxel-wise comparison between IDNMs of all migraine patients and HCs were conducted using a two-group t-test, controlling for multiple comparisons via permutation testing implemented by Statistical nonparametric Mapping (SnpM13, http://warwick.ac.uk/snpm, 10,000 simulations, voxel-wise cluster-forming threshold puncorrected < 0.001, voxel-wise report threshold pFWE corrected < 0.05). In addition, to quantify the IDNM differences for each migraine patient against HCs, an 8-mm-radius spherical seed was created, centered on the peak coordinate identified by the t-test in the above analysis (the detailed coordinate is provided in Online Supplementary Table S1). The FC strength between each patient's iron deposition map and the spherical seed was then calculated. Specifically, we extracted the average BOLD time series of all voxels within each patient's iron deposition map and within each 8-mm-radius seed, then computed the correlation between these two time series to obtain the FC strength. Eventually, we conducted a comparison of FC results among the HC, EM, and CM groups. A similar analysis was also performed using the seed of CM patients versus HCs.
Identifying iron deposition risk-related brain regions in migraine patients
We used the previously defined spherical seed to identify brain regions associated with an increased risk of iron deposition. To this end, seed-to-whole-brain FC analyses were performed using the spherical seed, based on the functional connectome from 1000 healthy subjects. A one-sample t-test was then conducted across the 1000 connectivity maps to infer brain regions comparable to previously reported iron deposition areas (Supplementary Table S2).
Association between IDNMs and clinical measures
In our study, headache characteristics and standardized scales were classified as continuous variables, while accompanying symptoms were classified as categorical variables. We further analyzed the relationships between these measures and IDNMs in migraine patients at the voxel level. For continuous variables, voxel-wise regression analyses were performed to assess their associations with IDNMs. Of note, to ensure group accuracy and data comparability, only migraine patients whose self-reports were consistent with their scale scores were analyzed (anxiety, n = 31; depression, n = 43; sleep quality, n = 42). For categorical variables, patients were classified into groups with symptoms and without symptoms (e.g., vomiting vs. non-vomiting). Voxel-wise two-sample t-tests were used to compare differences in IDNMs between groups.
All analyses were conducted using SnPM13 (http://warwick.ac.uk/snpm; 10,000 permutations) with a voxel-wise cluster-forming threshold of p < 0.001 (uncorrected) and results reported at a voxel-wise threshold of p < 0.05 (FWE-corrected). Additionally, spherical seeds with an 8-mm radius were constructed at peak coordinates of above significant results (the detailed coordinates are provided in Online Supplementary Table S1). FC strength between these seeds and each patient's iron deposition map was computed based on the normative connectome. Finally, for continuous variables, linear regression analyses were performed to assess their associations with FC strength; For categorical variables, two-sample t-tests were used to compare FC strength between groups with symptoms and without symptoms. Subgroup analyses were also performed in the EM and CM groups.
Statistical analysis
Continuous variables were described as mean ± standard deviation or median (interquartile range) depending on whether the data is normally distributed, and categorical variables as percentages. Normality was assessed using the one-sample Kolmogorov–Smirnov test. For the comparison of non-normally distributed continuous variables among the three groups, the Kruskal-Wallis H test was used, while the chi-square test was employed for the comparison of categorical variables. For pairwise comparisons, t-tests were used for normally distributed continuous variables, Mann–Whitney U tests for non-normally distributed variables, and chi-square or Fisher's exact tests for categorical variables. In the receiver operating characteristic (ROC) curve analysis, an area under the curve (AUC) > 0.7 was considered indicative of good diagnostic value. Statistical significance was set at a two-sided p < 0.05. All statistical analyses were performed using SPSS version 25.0 (IBM Corp., Armonk, NY, USA).
Results
Demographics and clinical features
A total of 117 participants were evaluated in this study, and 110 were finally included (37 HCs, 32 EM, and 41 CM). Among the CM patients, 24 had medication overuse headache (MOH) and 17 did not. Five participants (two EM, three CM) were excluded due to incomplete QSM data and two HCs were excluded due to poor MRI quality (Online Supplementary Figure 3). There were no significant differences among the three groups in terms of age, sex, and BMI (p > 0.05). Compared to the EM group, the CM group had significantly higher MHDs (p < 0.001), MIDAS scores (p < 0.001), HIT-6 scores (p = 0.035), and PHQ-9 scores (p = 0.012). No significant differences were found between EM and CM groups in disease duration, headache intensity, photophobia, phonophobia, nausea, vomiting, or GAD-7 scores (Table 1).
Comparisons of demographics and clinical features between migraine patients and HCs.
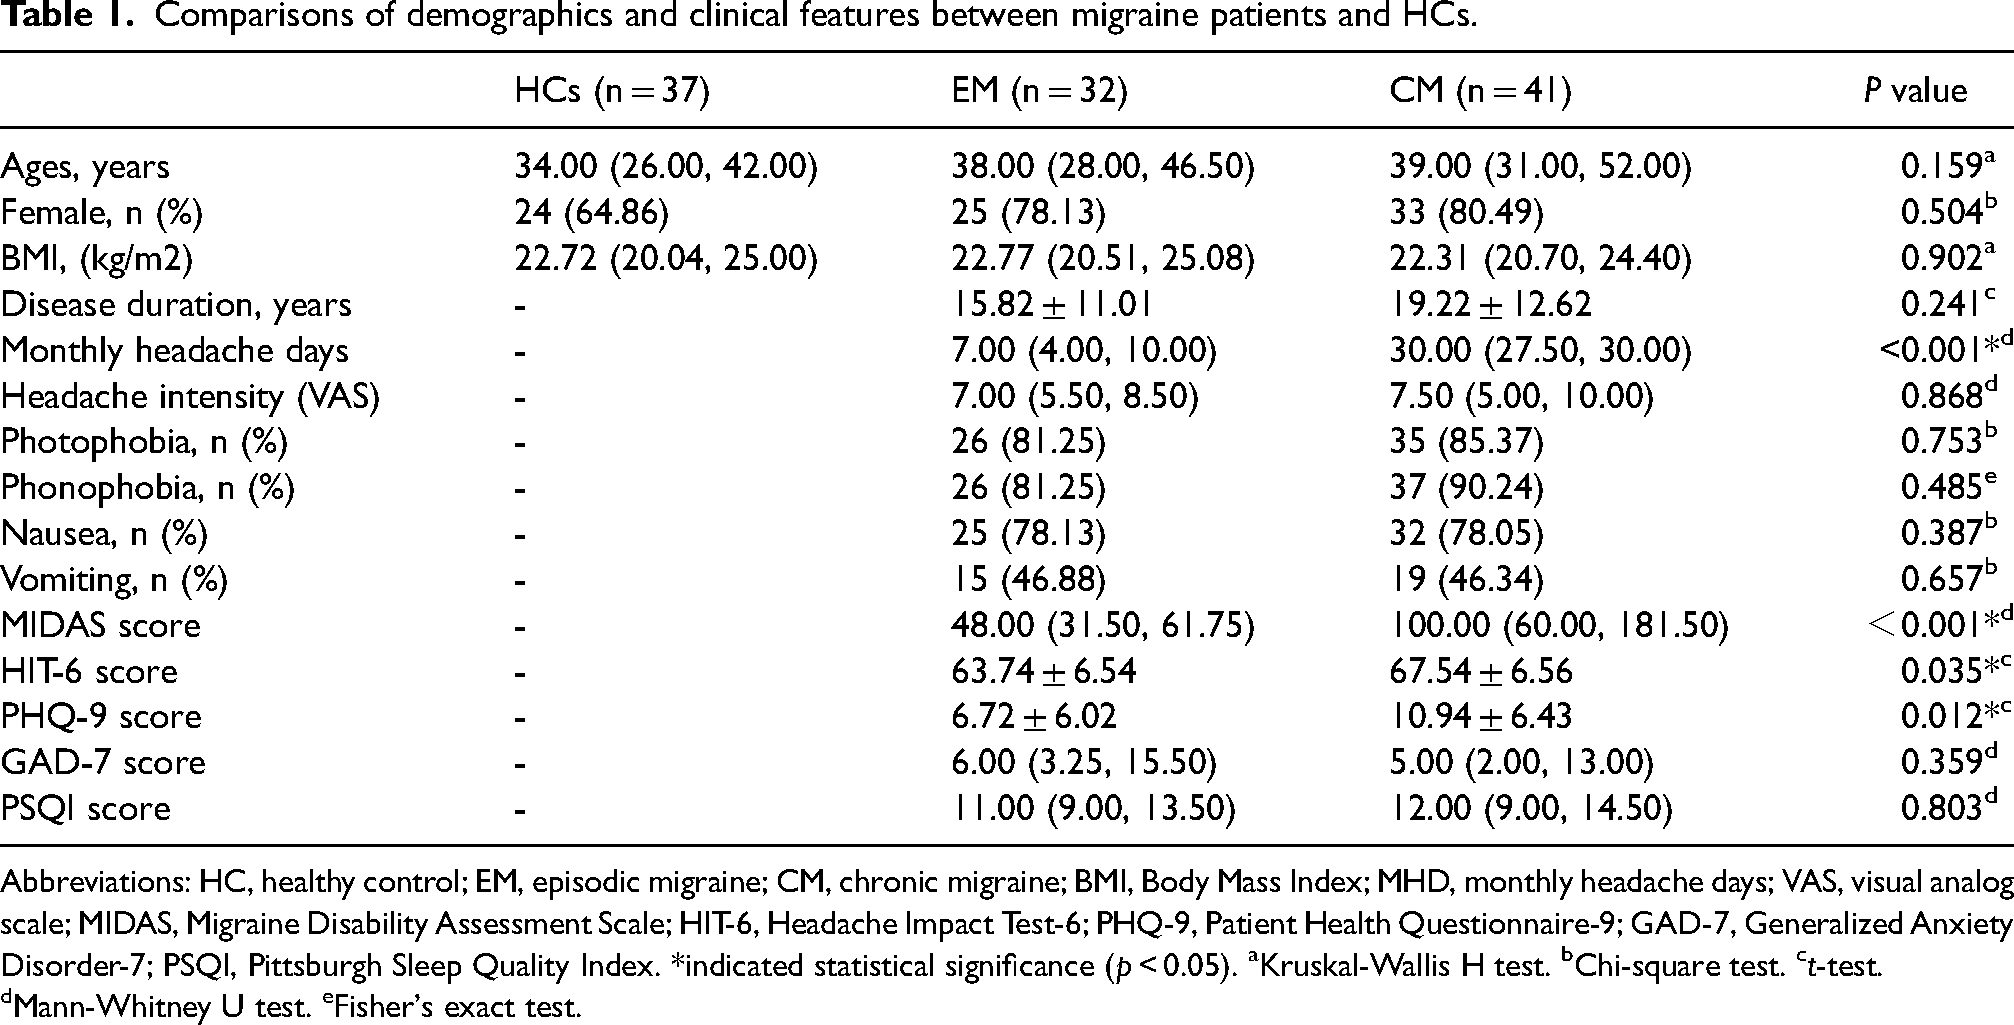
Abbreviations: HC, healthy control; EM, episodic migraine; CM, chronic migraine; BMI, Body Mass Index; MHD, monthly headache days; VAS, visual analog scale; MIDAS, Migraine Disability Assessment Scale; HIT-6, Headache Impact Test-6; PHQ-9, Patient Health Questionnaire-9; GAD-7, Generalized Anxiety Disorder-7; PSQI, Pittsburgh Sleep Quality Index. *indicated statistical significance (p < 0.05). aKruskal-Wallis H test. bChi-square test. ct-test. dMann-Whitney U test. eFisher's exact test.
Individual iron deposition maps in migraine patients are heterogeneous
We conducted group-level and subgroup-level overlap analyses of individualized iron deposition maps derived from normative data for each participant. There was considerable heterogeneity in the distribution of iron deposition across individual patients. Among all migraine patients, the highest regional overlap was only 38%. In subgroup analyses, the overlap remained low, with a maximum of 44% in CM patients and 41% in EM patients (Figure 2A).
IDNMs identify a common iron deposition network in migraine
Even though the sites of individual iron deposition were heterogeneous, over 70% of migraine patients had iron deposition functionally connected to common brain regions (Figure 2B). The EM and CM groups exhibited patterns consistent with the overall migraine patients, and a severity-related trend was observed between these two groups (Figure 2B). Furthermore, the t-test comparison of IDNMs between migraine patients and HCs revealed differences in brain regions including the superior temporal gyrus (STG), insula, and cerebellum (Figure 2C). The subgroup analysis showed that the IDNMs comparison results in CM patients were consistent with the overall migraine population, while no significant differences were observed in EM patients (Figure 2C). The results remained stable across different thresholds for defining iron deposition (Online Supplementary Figure 2). Based on the most significant site identified in the IDNM comparison between migraine patients and HCs, a spherical seed (the “migraine seed”) was defined to measure FC strength for each participant. The results showed that both the EM and CM groups had significantly higher FC strength compared to HCs (p < 0.05), while no significant difference was found between the EM and CM subgroups (Figure 3A). Similarly, a “CM seed” was constructed based on the IDNM differences between CM patients and HCs, and FC strength was re-evaluated across the HC, EM, and CM groups. All pairwise group comparisons showed significant differences in FC strength (p < 0.05), as illustrated in Figure 3A. To further assess the diagnostic potential of FC strength in differentiating migraine and its subgroups, ROC analyses were conducted. Using FC strength derived from the migraine seed, the area under the curve (AUC) was 0.71 (95% CI: 0.604–0.805) for migraine vs. HC, 0.67 (95% CI: 0.537–0.787) for EM vs. HC, 0.75 (95% CI: 0.637–0.851) for CM vs. HC, and 0.58 (95% CI: 0.441–0.709) for EM vs. CM (Figure 3C). In addition, ROC analysis based on FC strength derived from the CM seed showed AUCs of 0.70 (95% CI: 0.602–0.796) for migraine vs. HC, 0.62 (95% CI: 0.472–0.745) for EM vs. HC, 0.77 (95% CI: 0.668–0.872) for CM vs. HC, and 0.64 (95% CI: 0.500–0.775) for EM vs. CM (Figure 3D). Detailed results are provided in Online Supplementary Table 3.

FC strength reveals the occurrence and severity of migraine. (A) Comparison of FC strength derived from migraine and CM seeds among the three groups (HC, EM, CM). (B) Voxel-wise GLM regression of MHDs on IDNMs, with the inset shown in the upper left corner (voxel-wise cluster-forming threshold puncorrected < 0.001, cluster-wise report threshold pFWE corrected < 0.05); scatter plot showing the correlation between FC strength and MHDs. (C) ROC curves based on FC strength (migraine seed) for classifying migraine and subgroups. (D) ROC curves based on FC strength (CM seed). AUC values are shown for each comparison. *p < 0.05; ***p < 0.001; ns, not significant. Abbreviations: FC, functional connectivity; HC, healthy control; EM, episodic migraine; CM, chronic migraine; MHDs, migraine headache days; IDNMs, iron deposition network maps; ROI, region of interest; GLM, generalized linear model; AUC, area under the curve
Specific networks associated with clinical measures in migraine
To identify brain networks associated with clinical measures, we performed regression analyses of IDNMs for continuous variables and group comparisons for categorical variables in migraine patients. FC strength related to each clinical measure was computed for each patient. We identified a specific network associated with MHDs, involving regions in the cerebellum (Figure 3B). FC strength identified in this analysis was significantly correlated with MHDs (r = 0.349, p = 0.003, Figure 3B). Subgroup analysis revealed that CM patients showed a similar association (r = 0.349, p = 0.025), whereas no significant correlation was observed in EM patients (Figure 3B). As shown in Figure 4A, a distinct network associated with poor sleep quality was also identified, including regions in the bilateral rectus gyrus, orbitofrontal cortex (OFC), and nucleus accumbens (NAC). FC strength in this network was strongly associated with PSQI scores (r = 0.604, p < 0.001, Figure 4B). Subgroup analysis showed similar associations in both EM and CM patients (EM: r = 0.834, p < 0.001; CM: r = 0.427, p = 0.030, Figure 4B). As shown in Figure 4C, another network associated with vomiting was identified, involving regions in the globus pallidus (GP). FC strength in this network was significantly higher in migraine patients with vomiting than in those without (p < 0.001, Figure 4D), and this difference was consistent in both CM and EM subgroups (p < 0.05, Figure 4D).

Iron deposition network mapping of sleep disorder and vomiting in migraine. (A) Voxel-wise GLM regression of PSQI scores with the IDNMs (voxel-wise cluster-forming threshold puncorrected < 0.001, cluster-wise report threshold pFWE corrected < 0.05). (B) Scatter plot showing the correlation between FC strength and PSQI scores (n = 42). (C) Voxel-wise t-test comparing IDNMs between migraine patients with and without vomiting (voxel-wise cluster-forming threshold puncorrected < 0.001, voxel-wise report threshold pFWE corrected < 0.05). (D) Violin plot showing FC strength in migraine patients with and without vomiting. Similar analyses were conducted in the EM and CM groups; results are presented in Figures B and D. *p < 0.05; **p < 0.01; ***p < 0.001. Abbreviations: EM, episodic migraine; CM, chronic migraine; PSQI, Pittsburgh Sleep Quality Index; GLM, generalized linear model; FC, functional connectivity; IDNMs, iron deposition network maps
Predicted iron deposition risk regions are similar to previous findings
The brain regions associated with an increased risk of iron deposition were identified, including Pu, GP, thalamus, supramarginal gyrus, postcentral gyrus, dorsolateral superior frontal gyrus, NAC, anterior cingulate cortex, orbital inferior frontal gyrus, and cerebellum. These regions were compared with previously reported regions of excessive iron deposition, revealing overlapping distributions (Online Supplementary Table 2).
Discussion
This study is the first to extend the network mapping approach used in brain injury and atrophy to iron deposition. We identified a common iron deposition network in migraine patients, primarily involving the bilateral STG, insula, and cerebellum. Further analyses revealed symptom-specific networks associated with MHDs, poor sleep quality, and vomiting, with key connected regions including the cerebellum, OFC and NAC, and GP, respectively. These findings demonstrated favorable generalizability across subgroups and provide new insights for the clinical diagnosis and treatment of migraine.
Network results provide qualitative and quantitative support for disease occurrence and severity
At the group level, migraine patients showed significant differences in IDNMs compared to HCs, particularly in the STG, insula, and cerebellum, with more pronounced effects in CM patients. Previous studies have suggested that enhanced FC within the auditory network involving the STG may mediate pain hypersensitivity in CM patients (21). The insula acts as a cortical hub for multimodal integration in migraine (12), and its CGRP expression has been linked to pain and anxiety levels, suggesting a potential treatment target (22). The cerebellum projects to key regions regulating the trigeminovascular system (23–25). Some research has indicated that modulating the activity of the cerebellar cortex can inhibit the output of deep cerebellar nuclei, thereby alleviating pain (26,27). Thus, the cerebellum may represent a promising therapeutic target. Accordingly, the regions identified by our IDNM analysis may be associated with disease occurrence. In addition, our findings also indicate a possible modulatory role of IDNMs in migraine with functional impairment and highlight the need for further studies on QSM-derived therapeutic targets. For subgroups analyses, significant differences were observed only in CM, whereas no significant regions were identified in EM. This may be related to the higher MHDs in CM patients, as frequent headaches could make the persistent iron deposition pattern more detectable. Prior research has suggested that repeated episodes of neuroinflammation and hyperoxia during migraine attacks may increase the brain's vulnerability to iron-induced oxidative stress (5). The accumulation of iron in migraine patients may thus reflect the long-term impact of these abnormal metabolic processes (5,7). In contrast, EM patients are at an earlier stage of the disease, so may lack stable iron deposition patterns. Additionally, no significant difference was found between EM and CM groups. Overlap analysis revealed that IDNMs more clearly depict severity-related trends than conventional maps, as more CM patients showed overlapping networks. These findings demonstrate clinically observable differences in disease severity between EM and CM subgroups. To further elucidate the role of iron deposition in disease chronification, larger longitudinal cohort studies are needed to discover imaging biomarkers that can assess disease progression and treatment response.
Moreover, we used the “migraine seed” to quantify disease risk by measuring its FC strength with patients’ iron deposition maps. Both CM and EM patients showed increased connectivity strength compared with HCs. When the “CM seed” was applied, FC strength differed significantly among all three groups (HC, EM, CM). These results suggest that migraine-related network differences may predict individual headache severity, with CM-derived results showing stronger discriminative ability. ROC analysis revealed that, regardless of whether the seed was derived from migraine or CM patients, the calculated FC strength demonstrated favorable diagnostic performance in distinguishing migraine and its subgroups. However, the wide confidence intervals may reduce the diagnostic power of the indicators, and their stability and generalizability require further validation in larger cohort studies. Overall, individualized network-based markers may have potential clinical value. To better quantify headache severity, we used MHDs instead of the EM–CM classification. IDNM analysis identified a cerebellar network associated with MHDs, whose peak FC strength positively correlated with headache frequency. This finding aligns with previous evidence linking migraine frequency and duration to cerebellar impairment (28). However, the marked difference in MHDs between the CM and EM groups may have introduced spectrum bias, potentially influencing the observed associations. To address this, future studies require larger, more finely stratified cohorts covering a broader severity spectrum.
Network mapping of iron deposition related to poor sleep quality
Sleep disorders commonly co-occur with migraine and are linked to increased attack frequency and disease severity (29–31). In this investigation, up to 75% of migraine patients reported reduced sleep quality. We identified IDNMs related to poor sleep mainly in the OFC and NAC, consistent with prior findings on sleep disorder–related brain regions. QSM studies have shown excessive iron in the NAC correlates with disease severity and poor sleep (5). While research on OFC's role in sleep and iron deposition is limited, structural and functional abnormalities in this region are associated with sleep disturbances (32–34). Additionally, individual FC positively correlated with poor sleep across migraine subgroups.
Dysfunction of the dopaminergic system may represent a shared neurobiological mechanism underlying both migraine and sleep disorders (29–30). Abnormal iron accumulation may disrupt dopaminergic function by affecting key structures of the reward network, such as the OFC and NAC (35–37). Therefore, we speculate that iron deposition might contribute to the pathophysiology of migraine comorbid with sleep disorders by affecting dopamine-mediated reward pathways. Multiple neuroimaging studies of sleep regulation support our hypothesis. In some studies, regions such as the OFC and the dorsomedial/dorsolateral prefrontal cortex are frequently selected as targets in brain stimulation practice of migraine or insomnia (38,39). With regard to NAC, a study suggested that it integrates motivational stimuli to participate in sleep regulation and may become a novel therapeutic target (40). Another study revealed that NAC neurons with dopamine D1 receptors differentially regulate chronic pain and sleep through distinct projections to the ventral tegmental and the preoptic area (41). Taken together, our findings implicate the potential role of the OFC and NAC, two key regions within the reward system, in the underlying neural mechanisms and regulation of pain comorbid with sleep disorders.
Network mapping of iron deposition related to vomiting
Vomiting is a common autonomic symptom of migraine and forms the core clinical manifestations of this disorder. We found that the IDNMs associated with vomiting were located in the GP. The FC strength at the peak coordinate of this network differed significantly between migraine patients with and without vomiting, and this pattern was consistent across different clinical subgroups. Mechanistically, iron and dopamine may form conjugated products with oxidative stress properties under pathological conditions, exerting neurotoxic effects on the dopaminergic system including the GP (36). Evidence from pharmacological experiments (42) and neuroimaging studies (43) has demonstrated that dysfunction of the dopaminergic system is closely associated with the occurrence of vomiting. Therefore, we speculate that the iron deposition network associated with the GP might contribute to migraine-related vomiting by affecting dopaminergic pathways. Although SnPM analysis showed high significance, the small voxel count and limited prior research on the GP in vomiting suggest this finding should be interpreted cautiously and needs further validation.
Limitations
This study has several limitations. First, we used the average signal from individual iron deposition maps as the seed when constructing the IDNM, which may have led to the dilution of some important signals. Future work may consider advanced methods, such as using weighted individual iron deposition seeds. Second, our analysis used a large normative connectome dataset (n = 1000) from healthy individuals. While this approach enhances reliability, it carries the inherent assumption that the functional architecture of migraine patients is not fundamentally altered. Therefore, future studies should incorporate patient-specific connectome data, thereby accounting for network-level reorganization in migraine. Third, our findings indicate that the correlation between MHDs and the cerebellar IDNM was relatively weak (r = 0.349), suggesting limited stability. Furthermore, the lack of statistical significance in the EM group and the absence of significant differences between EM and CM groups do not support a definitive conclusion that the IDNM is associated with migraine chronification. Large-sample, longitudinal neuroimaging studies are needed to validate the robustness of IDNM as a potential biomarker. Finally, this study was limited to exploring correlations, without including functional analysis. Thus, the potential clinical utility of IDNM in guiding neuromodulation remains to be further investigated.
Conclusions
Our study expanded the localization of disease and symptoms from single iron deposition sites to related functional networks through IDNM. We found that the migraine-related network primarily involved the bilateral STG, insula, and cerebellum; the network associated with poor sleep quality was distributed in the OFC and NAC; and the vomiting-related network was centered in the GP. The FC strength between patients’ iron deposition maps and these common brain regions was associated with disease occurrence and specific migraine manifestations. These findings not only enhance our understanding of the pathophysiological mechanisms underlying migraine but also hold translational potential. In particular, FC strength may serve as a quantifiable imaging biomarker to support objective diagnosis and symptom evaluation. Moreover, their functional coupling with iron deposition regions in migraine suggests that these common regions could serve as potential targets for connectome-based neuromodulation.
Clinical implications
A novel application of lesion network mapping to iron deposition reveals key migraine-associated regions, including the STG, insula, and cerebellum.
Furthermore, this study identified distinct brain regions associated with sleep (OFC, NAC) and vomiting (GP) symptoms.
Our findings provide new imaging biomarkers and potential intervention targets for the diagnosis and treatment of migraine patients.
Supplemental Material
sj-docx-1-cep-10.1177_03331024261416488 - Supplemental material for Iron deposition network mapping of disease occurrence and clinical manifestations in migraine: A prospective study
Supplemental material, sj-docx-1-cep-10.1177_03331024261416488 for Iron deposition network mapping of disease occurrence and clinical manifestations in migraine: A prospective study by Xiaoshuang Li, Runtian Li, Geyu Liu, Dong Qiu, Yanliang Mei, Zhonghua Xiong, Ziyu Yuan, Peng Zhang, Mantian Zhang, Xin Liu, Hefei Tang, Yaqing Zhang, Xueying Yu, Yong Liu, Binbin Sui and Yonggang Wang in Cephalalgia
Supplemental Material
sj-png-2-cep-10.1177_03331024261416488 - Supplemental material for Iron deposition network mapping of disease occurrence and clinical manifestations in migraine: A prospective study
Supplemental material, sj-png-2-cep-10.1177_03331024261416488 for Iron deposition network mapping of disease occurrence and clinical manifestations in migraine: A prospective study by Xiaoshuang Li, Runtian Li, Geyu Liu, Dong Qiu, Yanliang Mei, Zhonghua Xiong, Ziyu Yuan, Peng Zhang, Mantian Zhang, Xin Liu, Hefei Tang, Yaqing Zhang, Xueying Yu, Yong Liu, Binbin Sui and Yonggang Wang in Cephalalgia
Supplemental Material
sj-png-3-cep-10.1177_03331024261416488 - Supplemental material for Iron deposition network mapping of disease occurrence and clinical manifestations in migraine: A prospective study
Supplemental material, sj-png-3-cep-10.1177_03331024261416488 for Iron deposition network mapping of disease occurrence and clinical manifestations in migraine: A prospective study by Xiaoshuang Li, Runtian Li, Geyu Liu, Dong Qiu, Yanliang Mei, Zhonghua Xiong, Ziyu Yuan, Peng Zhang, Mantian Zhang, Xin Liu, Hefei Tang, Yaqing Zhang, Xueying Yu, Yong Liu, Binbin Sui and Yonggang Wang in Cephalalgia
Supplemental Material
sj-png-4-cep-10.1177_03331024261416488 - Supplemental material for Iron deposition network mapping of disease occurrence and clinical manifestations in migraine: A prospective study
Supplemental material, sj-png-4-cep-10.1177_03331024261416488 for Iron deposition network mapping of disease occurrence and clinical manifestations in migraine: A prospective study by Xiaoshuang Li, Runtian Li, Geyu Liu, Dong Qiu, Yanliang Mei, Zhonghua Xiong, Ziyu Yuan, Peng Zhang, Mantian Zhang, Xin Liu, Hefei Tang, Yaqing Zhang, Xueying Yu, Yong Liu, Binbin Sui and Yonggang Wang in Cephalalgia
Footnotes
Acknowledgments
We deeply appreciate the involvement of all participants in this research.
Ethical considerations
The study protocol was reviewed and approved by the Ethics Committee of Beijing Tiantan Hospital, Capital Medical University (Approval No. KY2022-044) and registered at ClinicalTrials.gov (NCT05334927).
Consent to participate
Each participant or their guardian provided written informed consent prior to participation.
Consent for publishing
All authors authorize the publication of the article.
Author contributions
Y.W. and X.L. designed the study. X.L. drafted the manuscript. G.L., D.Q., Y.M., Z.Y., P.Z., M.Z., and X.L. collected the clinical and MRI data. X.L., D.Q., Y.M., Z.X., Z.Y., and P.Z. assisted with participant screening and recruitment. X.L. and R.L. analyzed the data. H.T., Y.Z., X.Y., Y.L., and B.S. contributed to data quality control. All authors participated in the preparation of the final manuscript and approved its content.
Declaration of conflicting interests
The authors declared no potential conflicts of interest with respect to the research, authorship, and/or publication of this article.
Funding
The authors disclosed receipt of the following financial support for the research, authorship, and/or publication of this article: National Key R&D Program of China, 2024YFC2510100; Joint Funds of the National Natural Science Foundation of China, U24A20683; Beijing Natural Science Foundation, Z200024; National Key R&D Program of China, Joint Funds of the National Natural Science Foundation of China, Beijing Natural Science Foundation, (grant number 2024YFC2510100, Z200024).
Data availability statement
The supporting data and materials for this study are available from the corresponding author on reasonable request.
Supplemental material
Supplemental material for this article is available online.
References
Supplementary Material
Please find the following supplemental material available below.
For Open Access articles published under a Creative Commons License, all supplemental material carries the same license as the article it is associated with.
For non-Open Access articles published, all supplemental material carries a non-exclusive license, and permission requests for re-use of supplemental material or any part of supplemental material shall be sent directly to the copyright owner as specified in the copyright notice associated with the article.