
Abstract
Background
Neuroinflammation, which is mediated by microglial activation, contributes to central sensitization, a key mechanism in vestibular migraine (VM). Transient receptor potential vanilloid 2 (TRPV2)-mediated calcium influx enhances nucleotide-binding oligomerization domain; leucine-rich repeat, and pyrin domain-containing protein 3 (NLRP3) inflammasome assembly, potentially driving inflammation. This study investigated the role of TRPV2 in VM pathogenesis.
Methods
A VM model was established via repeated intraperitoneal injections of nitroglycerin and kainic acid-induced vestibular nerve terminal impairment. Periorbital thresholds and vestibular scores were measured to assess allodynia and vestibular dysfunction. Western blotting and immunofluorescence were used to evaluate TRPV2, ionized calcium-binding adapter molecule 1 (IBA1), interleukin-1β and NLRP3 expression in the spinal trigeminal nucleus caudalis (Sp5c) region. In vitro, BV2 cells treated with lipopolysaccharide and interferon-γ were transfected with TRPV2 small interfering RNA. TRPV2 activity was analyzed via patch-clamp electrophysiology. Microglial polarization and morphology were examined via flow cytometry and immunofluorescence, with a focus on CD16, CD63, CD206 and CD163 markers. NLRP3 inflammasome activation was assessed through western blotting and immunofluorescence.
Results
VM-related behaviors, including allodynia and dizziness, were successfully reproduced. Central sensitization in the Sp5c was marked by increased TRPV2 expression in microglia, as demonstrated by co-localization with the microglial marker IBA1. In vitro, TRPV2 inhibition in BV2 cells shifted microglial polarization from the pro-inflammatory M1 state to the anti-inflammatory M2 state. Additionally, TRPV2 blockade significantly reduced NLRP3 inflammasome activation and the levels of proinflammatory cytokines.
Conclusions
TRPV2 regulates microglial activation and NLRP3 inflammasome activity via polarization mechanisms, contributing to central sensitization in VM. These findings highlight the critical role of TRPV2 in VM pathogenesis and its potential as a therapeutic target.
Introduction
Vestibular migraine (VM) is a distinct neurological entity within the migraine spectrum characterized by recurrent episodes of vertigo, dizziness and vestibular dysfunction, occurring alongside or independently of headache symptoms. Unlike typical migraine, which primarily presents with headache and sensory hypersensitivities, VM is marked by prominent vestibular involvement, reflecting a complex interplay between migraine mechanisms and central vestibular processing (1,2). Despite its prevalence, the specific pathophysiological mechanisms underlying VM remain poorly understood. Increasing evidence suggests that neuroinflammation and central sensitization play critical roles in the development and perpetuation of migraine, including vestibular forms (3). Central sensitization, a process in which the central nervous system becomes hyper-responsive to both nociceptive and non-nociceptive stimuli, is strongly associated with the activation of microglia, comprising resident immune cells in the brain and spinal cord (4). Once activated, microglia release proinflammatory cytokines and other mediators that increase neuronal excitability and contribute to pain amplification (5).
Transient receptor potential vanilloid 2 (TRPV2) is a non-selective ion channel that has been implicated in the regulation of various cellular processes, including pain perception and neuroinflammation (6). Based on our preliminary RNA sequencing analysis of the caudal part of the spinal trigeminal nucleus via this modeling method, TRPV2 was identified as the most significantly differentially expressed ion channel among all ion channels (7). Furthermore, immunohistochemical staining clearly revealed the colocalization of TRPV2 with microglia. These findings agree with previous conclusions, which suggest that TRPV2 modulates microglial activity and amplifies inflammatory responses (8). However, its precise role in VM, particularly its contribution to microglial activation and central sensitization, remains largely unexplored.
Recent studies have shown that TRPV2 is expressed on microglia and that its activation can promote the release of inflammatory mediators, suggesting that TRPV2 may be involved in neuroinflammatory processes associated with chronic pain. Nonetheless, the specific relationship between TRPV2 and VM is not well defined. A more comprehensive understanding of this mechanism could identify novel therapeutic targets for managing VM. Notably, TRPV2 activation may regulate inflammatory pathways such as the nucleotide-binding oligomerization domain; leucine-rich repeat, and pyrin domain-containing protein 3 (NLRP3) inflammasome, which plays a pivotal role in the release of proinflammatory cytokines like interleikin (IL)-1β (9). This pathway is particularly relevant in chronic pain conditions, where sustained microglial activation leads to persistent neuroinflammation (10).
In the present study, we aimed to elucidate the role of TRPV2 in vestibular migraine by investigating its effects on microglial activation and polarization, as well as its influence on the NLRP3 inflammasome, in both in vivo and in vitro models. The hypothesis of this study was that, using a VM model induced by the intraperitoneal injection of nitroglycerin (NTG) and kainic acid (KA) to impair vestibular nerve terminals, along with lipopolysaccharide (LPS) and interferon (IFN)-γ-stimulated microglia, the activation of TRPV2 in the caudal part of the spinal trigeminal nucleus initiates microglial polarization. This polarization subsequently activates NLRP3, thereby driving central sensitization associated with VM. Our findings may provide important insights into the molecular mechanisms underlying vestibular migraine and suggest potential therapeutic approaches that target TRPV2 to alleviate the neuroinflammatory processes that drive this debilitating condition.
Methods
Animals
This experiment was single-blinded. All animal procedures and ethical considerations were approved by the Institutional Animal Care and Use Committee of Harbin Medical University (approval reference number: YS166). Researchers used 60 eight-week-old male C57BL/6J mice (weighing 22–25 g) obtained from Liaoning Changsheng Biotechnology Co, Ltd (Benxi, Liaoning, China). Mice were randomly assigned to two groups using an online random number generator (https://www.graphpad.com/quickcalcs/randomize1). The control group received intraperitoneal and cochlear injections of saline. All animals were housed under standardized conditions (23 ± 1°C, 12:12-h light/dark photocycle, free access to food and water). To minimize confounding factors, treatments, measurement order and cage locations were randomized. Blinding was implemented wherever applicable. No formal a priori sample size calculation was performed, but the sample size was based on previous studies and ethical guidelines to minimize animal use at the same time as ensuring sufficient statistical power (7,10). Animals were included if they were healthy and exhibited normal behavior, and were excluded if they showed signs of illness, injury or failure to recover from anesthesia, or if severe distress required euthanasia.
VM model
The model of the VM mouse model was based on previous studies (11). The VM model involves two main steps: inducing migraine and vestibular dysfunction. Migraine was induced through an intraperitoneal injection of NTG at a dose of 10 mg/kg (12). Thirty minutes after administration, the inner and outer ear canals on the right side were gently expanded to expose the tympanic membrane. To induce unilateral vestibular organ injury, a fine needle was used to create a small incision in the right tympanic membrane, followed by a slow injection of 0.10 mL of 12.5 m
Cell culture and treatment
BV2 cells, a widely used murine microglial cell line originally derived from raf/myc-immortalized neonatal mouse microglia, were obtained from Wuhan Procell Life Science & Technology Co, Ltd (Wuhan, China), were cultured in a medium supplemented with 10% fetal bovine serum and 5% penicillinstreptomycin. The BV2 cell model, which was developed by treating cells with 10 μg/ml LPS and 20 μg/ml IFN-γ (10), has demonstrated limited fidelity in replicating primary microglial responses; however, its scientific validity can be verified by reference to supportive studies. To suppress TRPV2 expression and explore its role, knockdown experiments were conducted for validation and three small interfering RNA (siRNA) sequences targeting TRPV2, along with a negative control siRNA (NC siRNA), were designed. The oligonucleotide sequences are provided in Table 1. Western blot analysis was performed to assess the knockdown efficiency, and the siRNA that achieved the highest knockdown efficiency was selected for further investigation. Among them, TRPV2-2 siRNA showed the most effective suppression of TRPV2 protein expression and was therefore selected for use in subsequent experiments (see supplementary material, Figure S1).
Small interfering RNA sequence list.

Behavioral assessment
Periorbital withdrawal threshold test
The method estimates the mechanical withdrawal threshold by applying monofilaments with progressively increasing force until a withdrawal response is observed (14). The force of the von Frey filament that evokes this response is defined as the mechanical withdrawal threshold. The criteria for a positive response to a filament can vary between laboratories, with typical protocols requiring a 20–40% withdrawal response rate over five to 10 applications.
Vestibular dysfunction tests
Vestibular dysfunction was assessed three hours following the fifth induction of the VM model using a composite behavioral scoring system based on previously established methodologies (15,16). The scoring encompassed six distinct behavioral parameters, each rated on a scale of 0 to 2 (0 = normal, 1 = moderate impairment, 2 = severe impairment), yielding a total score reflecting the degree of vestibular dysfunction. The evaluated parameters included: abnormal head posture characterized by intermittent retrocollis; circling behavior ranging from mild to compulsive ipsilateral rotations; retropulsion indicative of postural imbalance; altered tail-hang reflex, where animals with unilateral vestibular impairment exhibit axial body rotation rather than forelimb extension; disrupted contact inhibition reflex, as evidenced by the inability to release a wire grid in the supine position; and impaired aerial righting reflex, where animals with vestibular deficits land dorsally when dropped from a height of 40 cm onto a cushioned surface. This composite scoring approach provided a quantitative framework for evaluating vestibular impairment in the experimental model.
Western blot analysis
Two hours after VM modeling, spinal trigeminal nucleus caudalis (Sp5c) tissue was collected and stored at −80°C. The tissue was then homogenized in RIPA lysis buffer and centrifuged at 14,000 rpm for 15 minutes. Protein concentrations were measured via a BCA assay kit (Thermo Fisher Scientific, Waltham, MA, USA). The proteins were separated by sodium dodecyl sulfate–polyacrylamide gel electrophoresis, followed by transfer to an NC membrane. To prevent non-specific binding, the membrane was incubated with 5% skim milk at room temperature for one hour. This was followed by overnight incubation at 4°C with the corresponding primary antibody. After washing, the membrane was incubated with the appropriate horseradish perxidase-conjugated secondary antibodies. The protein bands were detected via a gel imaging system (Bio-Rad, Hercules, CA, USA), with GAPDH serving as the reference (Table 2).
Antibodies used in western blotting and immunofluorescence staining.

Immunofluorescence staining
Immediately after perfusion, the brain tissue was dissected and fixed in 4% paraformaldehyde at 4°C for 24 h. The tissue was subsequently dehydrated in 30% sucrose solution, frozen, and sectioned at a thickness of 6 μm. Following one hour of incubation with blocking solution at room temperature, the tissue was incubated overnight at 4°C with the primary antibody. The next day, the sections were incubated with the secondary antibody at room temperature. Afterward, the tissue was stained with 4′,6-diamidino-2-phenylindole (DAPI) at 37°C for 10 minutes. Finally, the slides were mounted with a mounting medium, and the staining was observed and photographed via a confocal microscope.
Whole-cell, voltage-clamp electrophysiology
Whole-cell, voltage-clamp electrophysiology was employed to investigate TRPV2 ion channel activity in BV2 cells (17). The BV2 cells were divided into two groups: the model group and the blank group. The BV2 cell model was established by treating the cells with 10 μg/ml LPS and 20 μg/ml IFN-γ. In the model group, the TRPV2 agonist p-(di-n-propylsulfamoyl)-benzoic acid (probenecid) and the TRPV2-selective blocker MCE-157131 were applied to examine the overall current density–voltage relationship. The cells were cultured in 35-mm dishes and immersed in a bath solution containing 130 m
Flow cytometry
After BV2 cells were established and transfected with siRNA to knock down the TRPV2 gene, they were collected and resuspended in 100 µl of buffer. The cells were then incubated with a fluorescein isothiocyanate-conjugated anti-mouse CD16 antibody, anti-mouse CD64 antibody, anti-mouse CD206 antibody or anti-mouse CD163 antibody for 20 min at 4°C. The fluorescence intensity of CD16, CD64, CD63 and CD206 was detected via flow cytometery.
Statistical analysis
The experimental data are expressed as the mean ± SEM and were analyzed via Prism, version 9 (GraphPad Software Inc., San Diego, CA, USA). Before statistical analysis, the normality of the data was assessed via the Shapiro–Wilk test, and variance homogeneity was evaluated via descriptive statistics. For data with unequal variances, Brown–Forsythe and Welch analysis of variance (ANOVA) was applied, followed by Dunnett's T3 post-hoc test. Non-normally distributed data were analyzed via the Kruskal–Wallis test. For data meeting both normality and homogeneity of variance assumptions, one-way ANOVA was performed, followed by Tukey's post-hoc test for multiple comparisons. Two-way ANOVA with Geisser–Greenhouse correction was used, followed by Tukey's post-hoc test for group comparisons. Comparisons between two groups were made via an unpaired t-test. p < 0.05 was considered statistically significant.
Results
Intraperitoneal NTG injection and intraural KA administration reproduce VM-related allodynia and dizziness behavior in mice
In vivo, to assess peripheral pain hypersensitivity in the VM model, we used von Frey filaments to measure the mechanical pain threshold in the periorbital region before and after model induction. The overall experimental design is shown in Figure 1(a). In vitro, as illustrated in Figure 1(b), BV2 microglial cells were stimulated with LPS/IFN on day 2 and treated with specific agents on day 4. Subsequent analyses included electrophysiological recording, immunofluorescence, western blotting and flow cytometry. Baseline testing of the periorbital pain threshold prior to model induction showed no significant difference between the control and VM groups (n = 8 per group, control vs. VM, p = 0.9534) (Figure 1c). However, beginning on day 3 post-induction, the VM group exhibited a gradual and significant reduction in pain threshold compared to the control group (n = 8 per group, control vs. VM, p = 0.0007) (Figure 1d). We also evaluated dizziness behavior scores to assess VM-induced susceptibility to dizziness. Common vestibular dysfunction behaviors include head tilting, spinning, backward motion, the tail-hanging reflex, the contact inhibition reflex and the aerial righting reflex. After five inductions, the vestibular dysfunction behavior scores in the VM group were significantly greater than those in the control group (n = 8 per group, control vs. VM p < 0.0001) (Figure 1e).

Experimental design and effects of vestibular migraine (VM) model and treatments. (a) In vivo protocol: VM was induced by nitroglycerin (NTG) injections and kainic acid. Behavioral tests von Frey was performed on days 1, 3, 5, 7 and 9, vestibular scoring only performed on day 9. Immunofluorescence and western blotting were conducted on day 9. In vitro protocol: BV2 microglial cells were treated with lipopolysaccharide (LPS)/interferon (IFN) on day 2 and specific agents on day 4, followed by electrophysiology, immunofluorescence, western blotting and flow cytometry. (b) Basal periorbital responses: no differences were observed between control and VM groups (Control vs. VM, p = 0.9534, Welch's t-test, n = 8 per group). (c) Post-treatment periorbital responses: periorbital thresholds decreased significantly in the VM group after NTG and kainic acid (KA) (control vs. VM, p = 0.0007, Welch's t-test, n = 8 per group), indicating sensitization. (d) Vestibular dysfunction scores: VM animals had significantly higher scores than controls (control vs. VM, p < 0.0001, Welch's t-test, n = 8 per group), indicating vestibular impairment.
Intraperitoneal NTG injection and intra-aural KA administration stimulates and central sensitization in the Sp5c of VM mice
To investigate the impact of central sensitization in this model, we assessed IL-1β and NLRP3 protein expression in Sp5c following intraperitoneal nitroglycerin injection and intraaural KA administration. As shown in Figures 2(a–c), the immunofluorescence data revealed significantly elevated levels of IL-1β (n = 4 per group; control vs. VM, p = 0.0495) and NLRP3 (n = 4 per group; control vs. VM, p = 0.0352) in the model group. However, the difference of in the Western blot results was not significant (n = 4 per group, IL-1β control vs. VM, p = 0.0822; and NLRP3 control vs. VM, p = 0.0586) (Figure 2d–f).

Increased interleukin (IL)-1β and nucleotide-binding oligomerization domain; leucine-rich repeat, and pyrin domain-containing protein 3 (NLRP3) expression in the vestibular migraine (VM) model. (a) Immunofluorescence staining: representative images of the vestibular nucleus showing IL-1β (red) and NLRP3 (green) expression in control and VM groups. 4′,6-Diamidino-2-phenylindole (DAPI) (blue) was used to counterstain nuclei. Dashed lines outline the vestibular nucleus region. VM mice exhibited increased expression of IL-1β and NLRP3 compared to controls. (b) Quantification of IL-1β expression: the percentage of IL-1β-positive area was significantly higher in the VM group compared to controls (control vs. VM, p = 0.0495, unpaired t-test, n = 4 per group). (c) Quantification of NLRP3 expression: the percentage of NLRP3-positive area was significantly elevated in the VM group compared to controls (control vs. VM, p = 0.0352, unpaired t-test, n = 4 per group). (d) Western blot analysis: protein expression of IL-1β and NLRP3 in the vestibular nuclei from control and VM mice. GAPDH served as the loading control. Both IL-1β and NLRP3 levels were elevated in the VM group. (e) Densitometric analysis of IL-1β: quantification of western blot bands confirmed a non-significant trend toward increased IL-1β expression in the VM group compared to controls (control vs. VM, p = 0.0822, Welch's t-test, n = 4 per group). (f) Densitometric analysis of NLRP3: western blot quantification revealed a non-significant trend toward in NLRP3 expression in the VM group (control vs. VM, p = 0.0586, unpaired t-test, n = 4 per group).
TRPV2 is expressed in Sp5c microglia and is highly upregulated
Microglial activation is widely recognized for its essential role in regulating inflammatory responses, which are central mechanisms in pain-related disorders and migraine pathogenesis. To investigate the regulatory role of TRPV2 in microglial activation and inflammation, we conducted dual immunofluorescence staining to examine changes in microglial morphology and TRPV2 colocalization (Figure 3a) and performed western blotting to assess the expression levels of ionized calcium-binding adapter molecule 1 (IBA1) and TRPV2 (n = 4 per group control vs. VM IBA1, p = 0.0001; control vs. VM, TRPV2, p = 0.0003) (Figure 3b–d). These findings confirmed the presence of TRPV2 in microglia within the Sp5c. Whole-cell, patch-clamp electrophysiology further demonstrated the functional activity of TRPV2 channels in BV2 microglia. Compared with that in the control group, the current density in the model group (LPS + IFN-γ) was significantly greater, suggesting that TRPV2 was upregulated (Figure 4a). Compared with model group, the TRPV2-selective blocker reduced the current density, confirming its involvement (Figure 4b), whereas the application of a TRPV2 agonist further increased the current density compared to the model group (Figure 4c). Quantitative analysis of the current density at −80 mV revealed a significant increase in the model group compared with the control group(control: n = 4, LPS + IFN-γ: n = 5, p = 0.0050) (Figure 4d), which was attenuated by a TRPV2-selective blocker (LPS + IFN-γ: n = 5, TRPV2-selective blocker, n = 4, p = 0.0429) (Figure 4d), but was not significantly further enhanced by the TRPV2 agonist (LPS + IFN-γ: n = 5, TRPV2 agonist, n = 4, p = 0.9999) (Figure 4d). These findings highlight the regulatory role of TRPV2 in BV2 microglia under inflammatory conditions.

Microglial activation and transient receptor potential vanilloid 2 (TRPV2) upregulation in the vestibular migraine (VM) model. (a) Immunofluorescence staining: representative images of the vestibular nucleus showing ionized calcium-binding adapter molecule 1 (IBA1) (green) and TRPV2 (red) expression in control and VM groups. 4′,6-Diamidino-2-phenylindole (DAPI) (blue) was used to counterstain nuclei. Dashed lines outline the vestibular nucleus region. VM mice displayed increased IBA1 and TRPV2 expression compared to controls, with evident colocalization in merged images. (b) Western blot analysis: protein expression of IBA1 and TRPV2 in vestibular nuclei from control and VM mice. GAPDH served as the loading control. Both IBA1 and TRPV2 were significantly upregulated in the VM group. (c) Quantification of IBA1 expression: densitometric analysis of western blot bands revealed a significant increase in IBA1 expression in the VM group compared to controls (control vs. VM, p = 0.0001, Welch's t-test, n = 4 per group). (d) Quantification of TRPV2 expression: densitometric analysis of western blot bands showed significantly higher TRPV2 levels in the VM group relative to controls (control vs. VM, TRPV2, p = 0.0003, Welch's t-test, n = 4 per group).
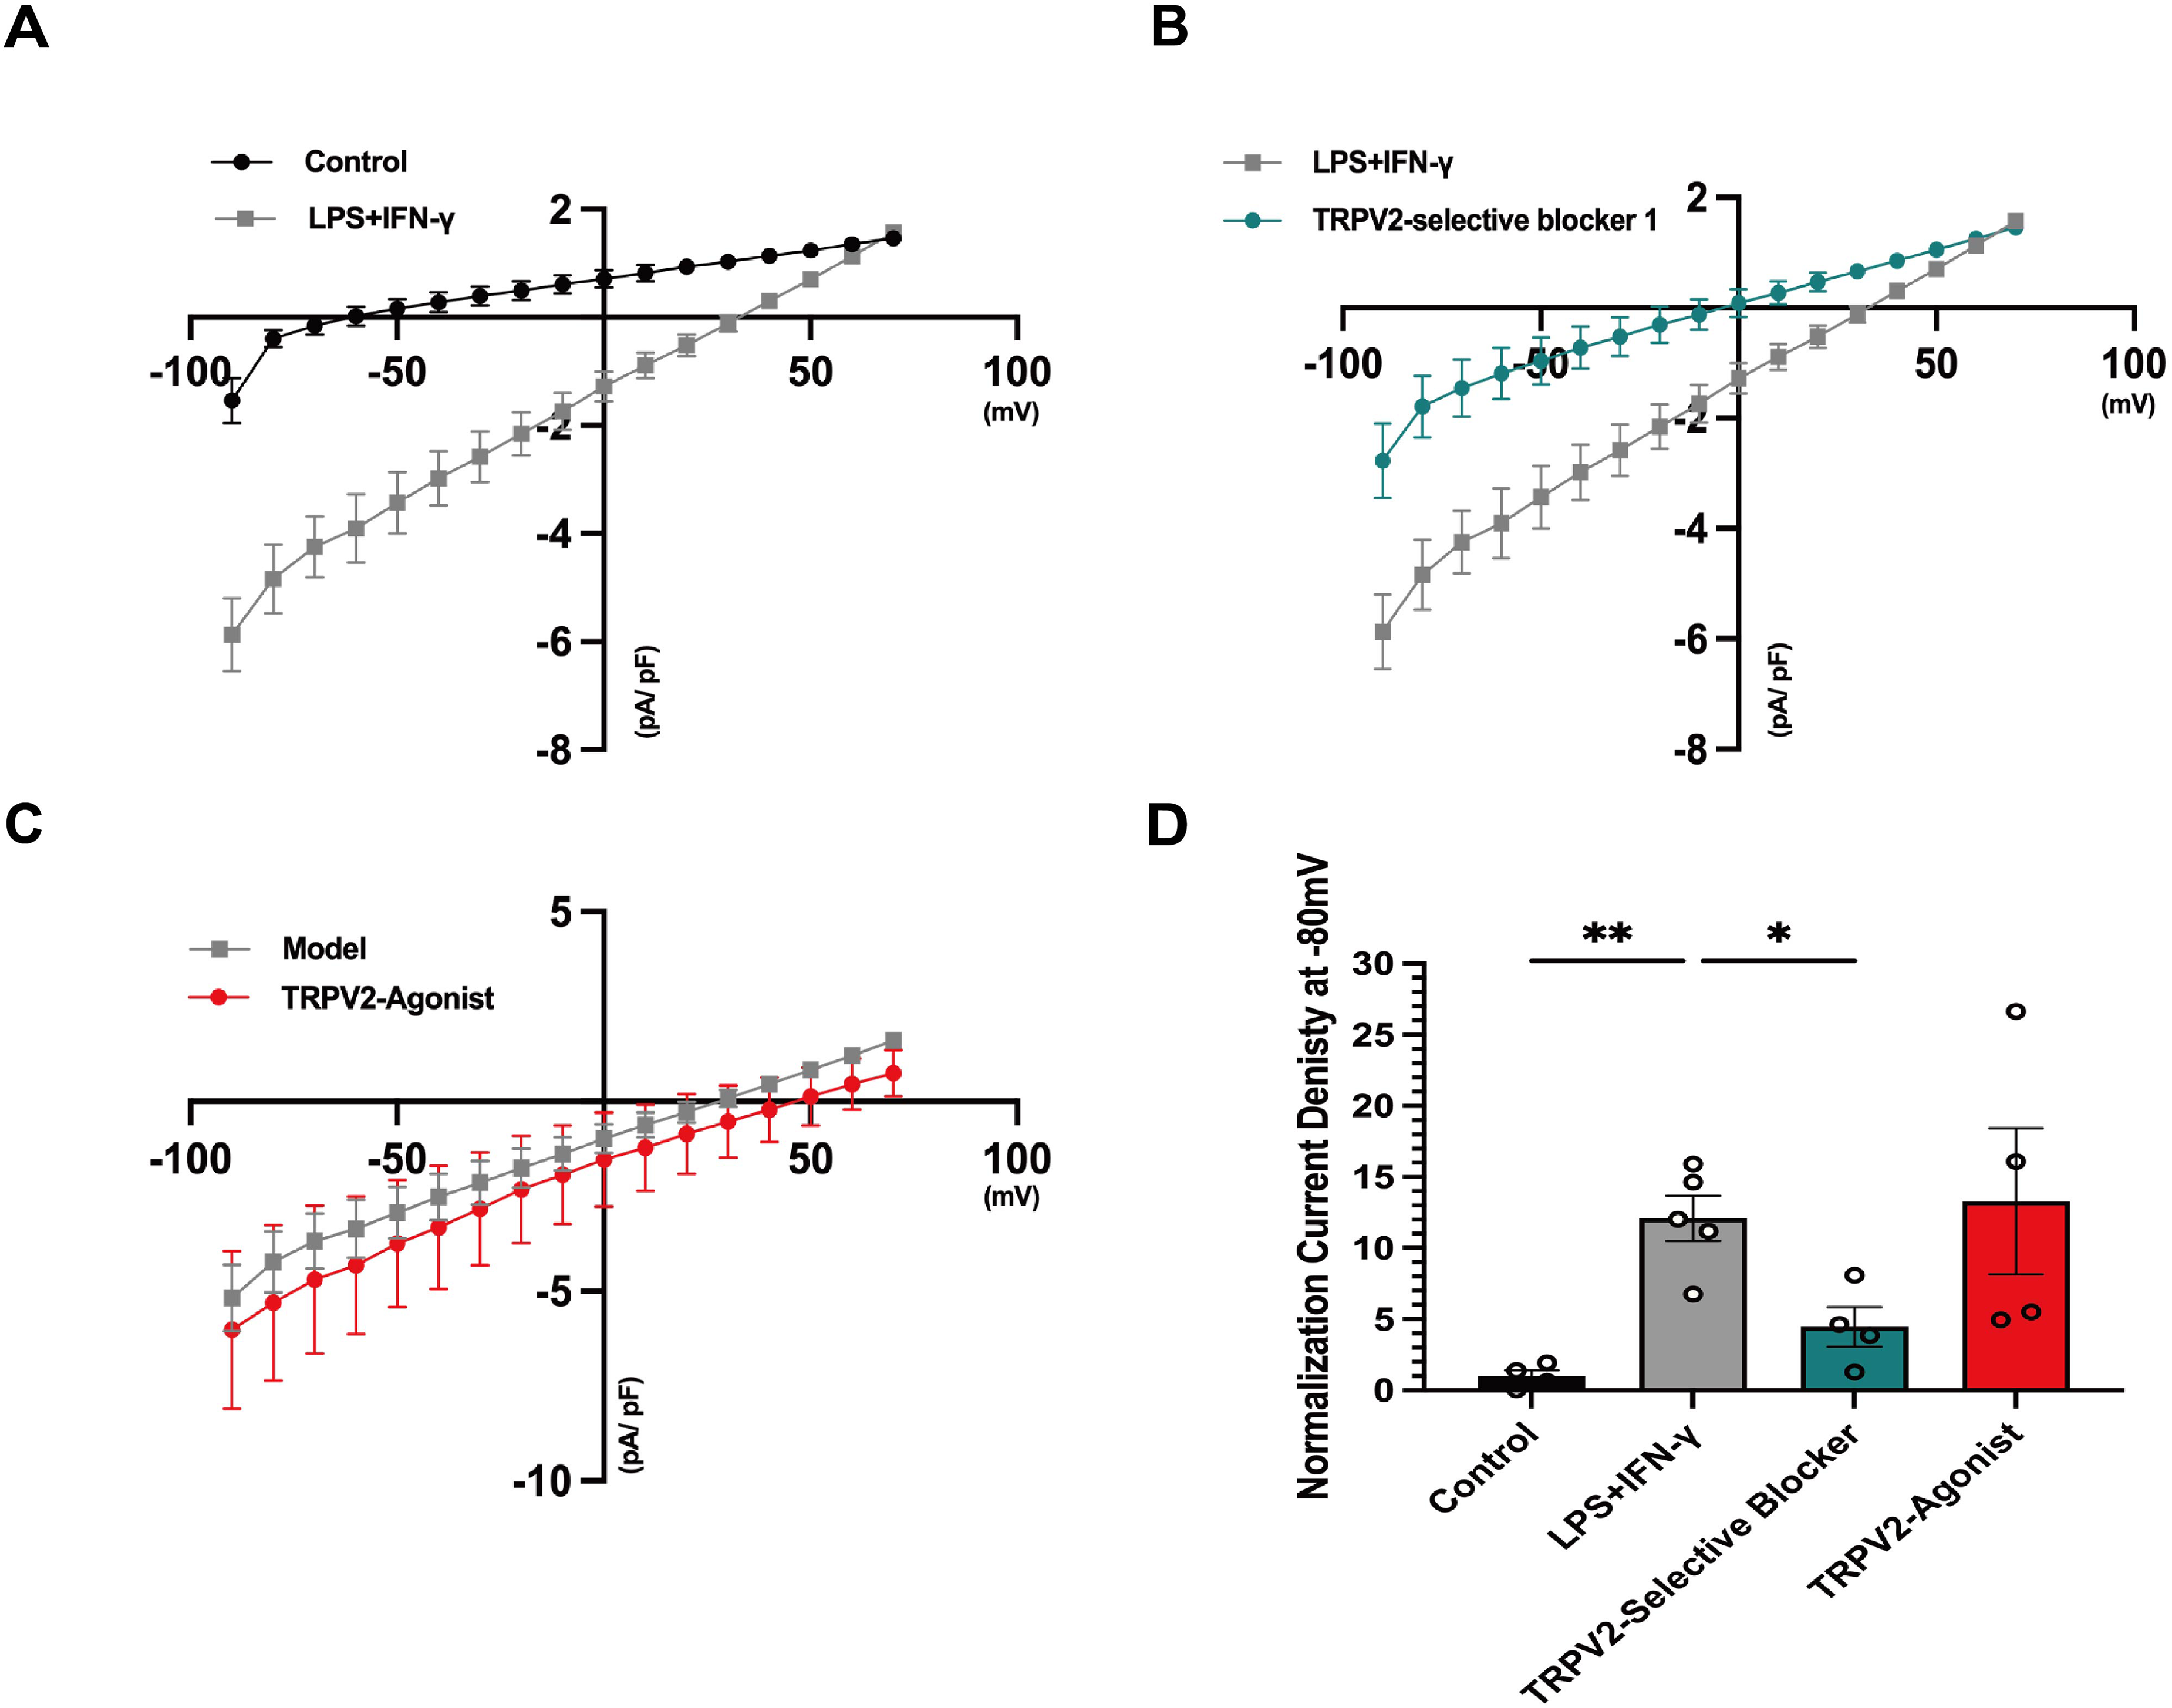
Electrophysiological analysis of transient receptor potential vanilloid 2 (TRPV2) modulation in lipopolysaccharide (LPS) + interferon (IFN)-γ-treated BV2 cells. (a) Current–voltage (I–V) relationship under LPS + IFN-γ treatment: whole-cell, patch-clamp recordings showing the I–V relationship in control (black) and LPS + IFN-γ-treated cells (grey). LPS + IFN-γ treatment significantly increased current density compared to controls. (b) TRPV2-selective blocker mitigates LPS + IFN-γ-induced currents: I–V relationship comparing LPS + IFN-γ-treated cells (grey) and cells treated with TRPV2-selective blocker 1 (teal). TRPV2-selective blocker significantly reduced current density. (c) TRPV2 agonist enhances currents: I–V relationship comparing the LPS + IFN-γ model (grey) and cells treated with TRPV2 agonist (red). TRPV2 agonist resulted in further increases in current density. (d) Normalized current density at −80 mV: quantification of current densities at −80 mV for control, LPS + IFN-γ, TRPV2-selective blocker and TRPV2- agonist groups. LPS + IFN-γ treatment significantly increased current density compared to controls (control: n = 4, LPS + IFN-γ: n = 5, p = 0.0050, Brown–Forsythe and Welch analysis of variance (ANOVA) tests), TRPV2 selective blocker significantly reduced current density compared to the LPS + IFN-γ group (LPS + IFN-γ: n = 5, TRPV2-selective blocker n = 4, p = 0.0429, Brown–Forsythe and Welch ANOVA tests), whereas TRPV2 agonist further not enhanced current density compared to the model group (LPS + IFN-γ: n = 5, TRPV2 agonist, n = 4, p = 0.9999, Brown–Forsythe and Welch ANOVA tests).
TRPV2 blockade affects microglia M1/M2 polarization in LPS and IFN-γ treated BV-2 cells
To investigate whether TRPV2 silencing is associated with M1 polarization in microglia following LPS and IFN-γ treatment, we used flow cytometry to assess the M1 polarization markers CD16 and CD68. LPS and IFN-γ treatment significantly increased the mean fluorescence intensity (MFI) of CD16 and CD68 in BV2 cells, whereas TRPV2 siRNA intervention markedly suppressed the MFI of these markers (n = 3 per group, CD16: blank vs. LPS + IFN-γ, p = 0.0048; LPS + IFN-γ + NC siRNA vs. LPS + IFN-γ + TRPV2 siRNA, p = 0.0002; CD68: blank vs. LPS + IFN-γ, p = 0.0114; LPS + IFN-γ + NC siRNA vs. LPS + IFN-γ + TRPV2 siRNA, p = 0.0186) (Figure 5a–c). Additionally, we performed immunostaining for the M1 polarization marker CD16, which revealed a significant increase in CD16 + fluorescence intensity following LPS and IFN-γ treatment; however, LPS and IFN-γ + TRPV2 siRNA treatment significantly reduced this fluorescence intensity (n = 3 per group, F3,8 = 125.4, blank vs. LPS + IFN-γ, p = 0.0001; LPS + IFN-γ + NC siRNA vs. LPS + IFN-γ + TRPV2 siRNA, p = 0.0001) (Figure 5d and e). These findings indicate that TRPV2 silencing can inhibit M1 polarization in microglia after LPS and IFN-γ exposure.

Transient receptor potential vanilloid 2 (TRPV2) silencing reduces macrophage activation markers in lipopolysaccharide (LPS) + interferon (IFN)-γ-treated BV2 cells. (a) Flow cytometry histograms: expression levels of macrophage activation markers CD16 (top) and CD68 (bottom) in blank, LPS + IFN-γ, LPS + IFN-γ + negative control small interfering RNA (NC siRNA) and LPS + IFN-γ + TRPV2 siRNA groups. LPS + IFN-γ treatment increased CD16 and CD68 expression, whereas TRPV2 siRNA reduced their expression. (b) Quantification of CD16 expression: mean fluorescence intensity (MFI) of CD16 was significantly increased in the LPS + IFN-γ group compared to blank. TRPV2 silencing significantly reduced CD16 expression compared to the LPS + IFN-γ + NC siRNA group (CD16: blank vs. LPS + IFN-γ, p = 0.0048; LPS + IFN-γ + NC siRNA vs. LPS + IFN-γ + TRPV2 siRNA, p = 0.0002, Brown–Forsythe and Welch analysis of variance (ANOVA) tests, n = 3 per group). (c) Quantification of CD68 expression: MFI of CD68 showed similar trends, with a significant reduction in the LPS + IFN-γ + TRPV2 siRNA group compared to the LPS + IFN-γ + NC siRNA group (CD68: blank vs. LPS + IFN-γ, p = 0.0114; LPS + IFN-γ + NC siRNA vs. LPS + IFN-γ + TRPV2 siRNA, p = 0.0186, Brown–Forsythe and Welch ANOVA tests, n = 3 per group). (d) Immunofluorescence staining: representative images showing CD16 (green) expression and 4′,6-diamidino-2-phenylindole (DAPI) (blue) nuclear counterstain. The LPS + IFN-γ + TRPV2 siRNA group exhibited reduced CD16 expression compared to LPS + IFN-γ and LPS + IFN-γ + NC siRNA groups. (e) Quantification of CD16 immunofluorescence: relative fluorescence intensity of CD16 was significantly lower in the LPS + IFN-γ + TRPV2 siRNA group compared to the LPS + IFN-γ + NC siRNA group (F3,8 = 125.4, Blank vs. LPS + IFN-γ, p = 0.0001; LPS + IFN-γ + NC siRNA vs. LPS + IFN-γ + TRPV2 siRNA, p = 0.0001, one-way ANOVA, n = 3 per group).
Next, we examined whether TRPV2 silencing is related to M2 polarization in microglia. Flow cytometry analysis was performed on the M2 polarization markers CD206 and CD163. As expected, TRPV2 siRNA treatment significantly increased the MFI of CD206 and CD163, whereas LPS and IFN-γ exposure suppressed these markers (n = 3 per group, CD206: blank vs. LPS + IFN-γ, p = 0.0276; LPS + IFN-γ + NC siRNA vs. LPS + IFN-γ + TRPV2 siRNA, p = 0.0008; CD163: blank vs. LPS + IFN-γ, p = 0.1165; LPS + IFN-γ + NC siRNA vs. LPS + IFN-γ + TRPV2 siRNA, p = 0.0061) (Figure 6a–c). Similarly, immunostaining for the M2 polarization marker CD206 revealed a significant increase in the number of CD206 + cells following TRPV2 inhibition, surpassing the levels observed in the LPS and IFN-γ + NC siRNA groups (n = 3 per group, F3,8 = 82.20, blank vs. LPS + IFN-γ, p = 0.0018; LPS + IFN-γ + NC siRNA vs. LPS + IFN-γ + TRPV2 siRNA, p = 0.0001) (Figure 6d and e). These data suggest that blocking TRPV2 promotes M2 polarization in microglia following LPS and IFN-γ treatment. Overall, these results indicate that TRPV2 blockade shifts microglial polarization from the M1 phenotype to the M2 phenotype in response to LPS and IFN-γ treatment.

Transient receptor potential vanilloid 2 (TRPV2) silencing promotes M2 macrophage polarization in lipopolysaccharide (LPS) + interferon (IFN)-γ-treated cells. (a) Flow cytometry histograms: expression of M2 macrophage markers CD206 (top) and CD163 (bottom) in blank, LPS + IFN-γ, LPS + IFN-γ + negative control small interfering RNA (NC siRNA) and LPS + IFN-γ + TRPV2 siRNA groups. LPS + IFN-γ treatment reduced M2 marker expression, whereas TRPV2 silencing restored their levels. (b) Quantification of CD206 expression: MFI of CD206 was significantly increased in the LPS + IFN-γ + TRPV2 siRNA group compared to the LPS + IFN-γ + NC siRNA group (blank vs. LPS + IFN-γ, p = 0.0276; LPS + IFN-γ + NC siRNA vs. LPS + IFN-γ + TRPV2 siRNA, p = 0.0008, Brown–Forsythe and Welch analysis of variance (ANOVA) tests, n = 3 per group). (c) Quantification of CD163 expression: MFI of CD163 showed a significant increase in the LPS + IFN-γ + TRPV2 siRNA group compared to the LPS + IFN-γ + NC siRNA group (blank vs. LPS + IFN-γ, p = 0.1165; LPS + IFN-γ + NC siRNA vs. LPS + IFN-γ + TRPV2 siRNA, p = 0.0061, Brown–Forsythe and Welch ANOVA tests, n = 3 per group). (d) Immunofluorescence staining: representative images showing CD206 (green) expression and 4′,6-diamidino-2-phenylindole (DAPI) (blue) nuclear counterstain in blank, LPS + IFN-γ, LPS + IFN-γ + NC siRNA and LPS + IFN-γ + TRPV2 siRNA groups. TRPV2 silencing enhanced CD206 expression compared to the LPS + IFN-γ and LPS + IFN-γ + NC siRNA groups. (e) Quantification of CD206 immunofluorescence: relative fluorescence intensity of CD206 was significantly higher in the LPS + IFN-γ + TRPV2 siRNA group compared to the LPS + IFN-γ + NC siRNA group (F3,8 = 82.20, blank vs. LPS + IFN-γ, p = 0.0018; LPS + IFN-γ + NC siRNA vs. LPS + IFN-γ + TRPV2 siRNA, p = 0.0001, one-way ANOVA, n = 3 per group).
TRPV2 is essential for the induction of the NLRP3 inflammasome in BV2 microglia upon LPS and IFN stimulation
Our results revealed that, compared with those in the LPS and IFN-γ groups, the number and immunoreactivity of microglia in the TRPV2 siRNA group were significantly lower. TRPV2 siRNA also significantly reduced the total and average initial process lengths of microglia, as well as the fluorescence intensity of NLRP3 (n = 3 per group, IBA1: blank vs. LPS + IFN-γ, p = 0.0162; LPS + IFN-γ + NC siRNA vs. LPS + IFN-γ + TRPV2 siRNA, p = 0.0120; NLRP3: F3,8 = 99.20, blank vs. LPS + IFN-γ, p = 0.0001; LPS + IFN-γ + NC siRNA vs. LPS + IFN-γ + TRPV2 siRNA, p = 0.0001) (Figure 7a and b). Furthermore, LPS and IFN-γ treatment increased the levels of NLRP3 inflammasome components, whereas TRPV2 inhibition significantly reduced the levels of cleaved IL-1β and cleaved caspase-1 (n = 3 per group, apoptosis-associated speck-like protein containing a CARD (ASC): blank vs. LPS + IFN-γ, p = 0.0025; LPS + IFN-γ + NC siRNA vs. LPS + IFN-γ + TRPV2 siRNA, p = 0.2066; cleaved IL-1β: F3,12 = 8.675, blank vs. LPS + IFN-γ, p = 0.0106; LPS + IFN-γ + NC siRNA vs. LPS + IFN-γ + TRPV2 siRNA, p = 0.0412; cleaved caspase-1: blank vs. LPS + IFN-γ, p = 0.0073; LPS + IFN-γ + NC siRNA vs. LPS + IFN-γ + TRPV2 siRNA, p = 0.0097; NLRP3: blank vs. LPS + IFN-γ, p = 0.0055; LPS + IFN-γ + NC siRNA vs. LPS + IFN-γ + TRPV2 siRNA, p = 0.0201) (Figure 7c–i).
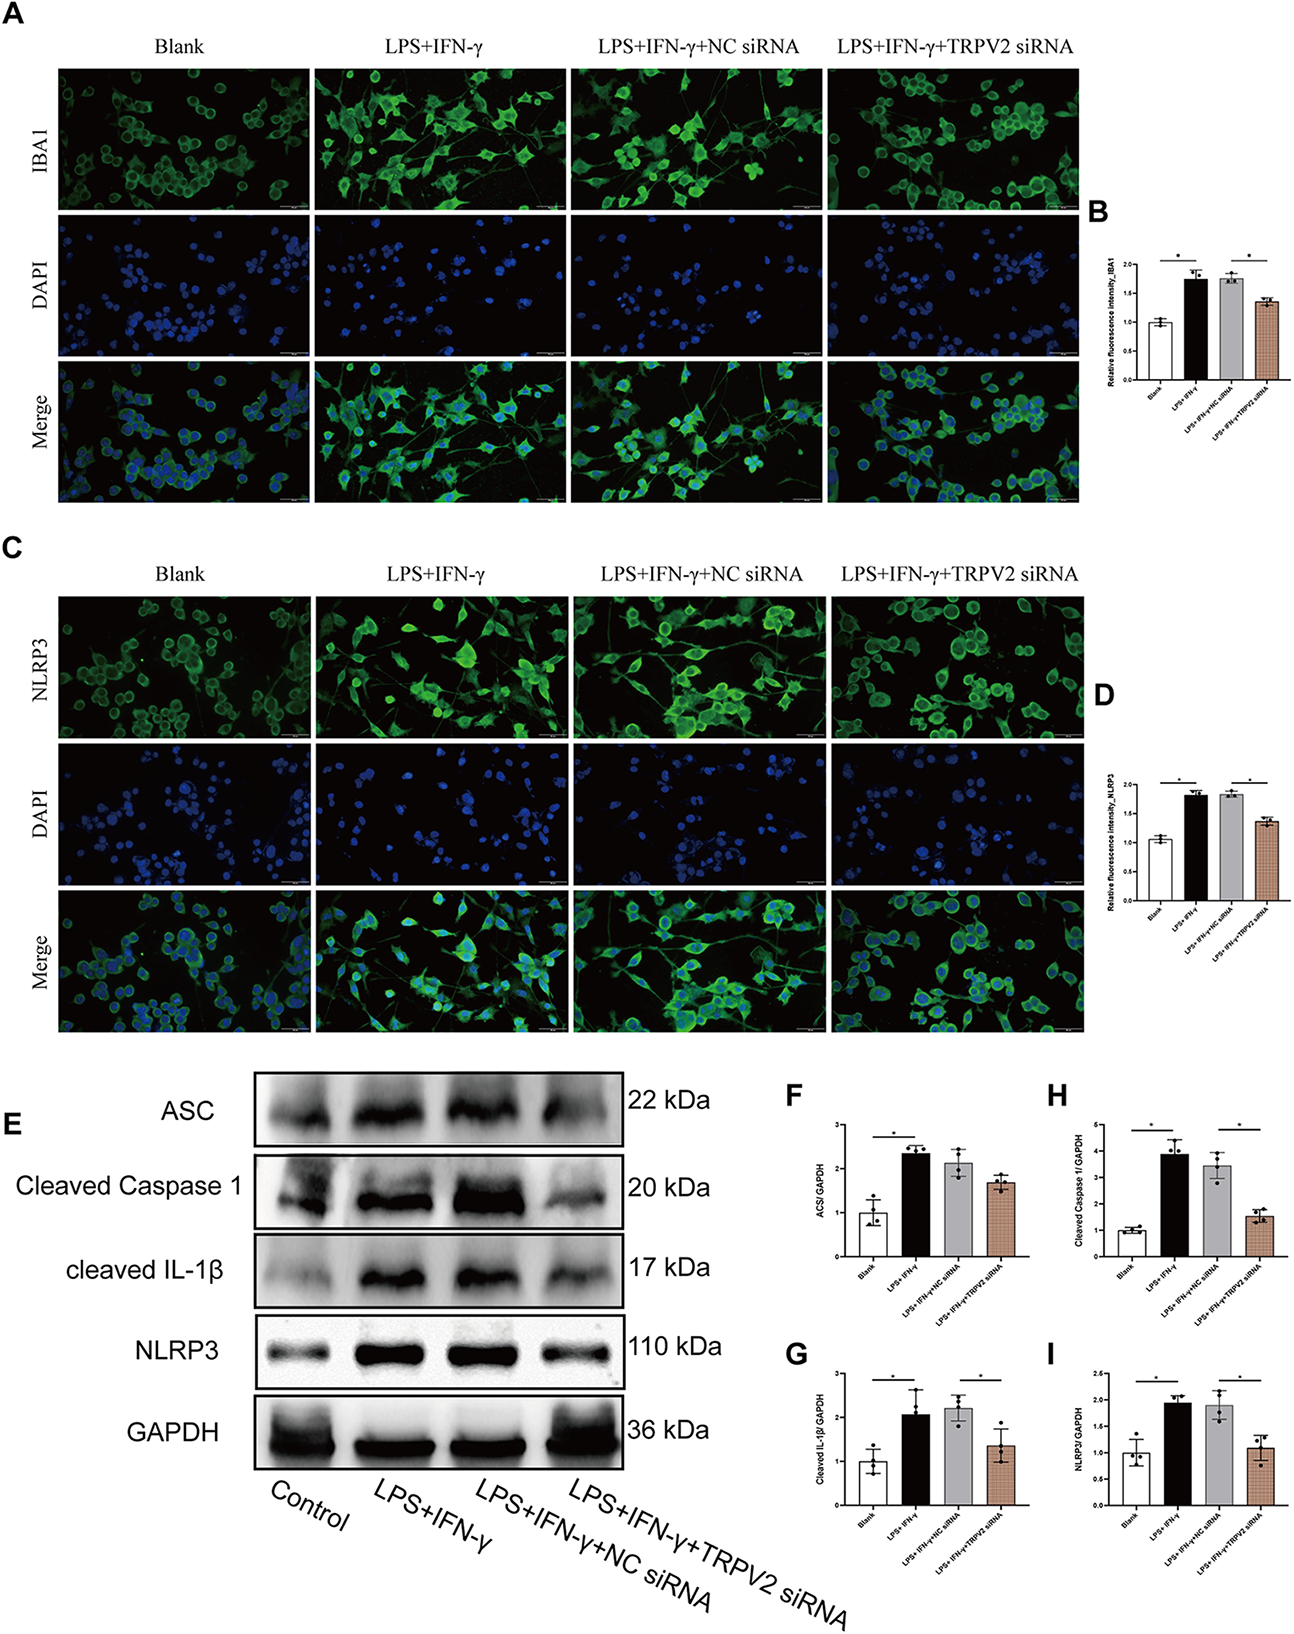
Transient receptor potential vanilloid 2 (TRPV2) silencing reduces microglial activation and nucleotide-binding oligomerization domain; leucine-rich repeat, and pyrin domain-containing protein 3 (NLRP3) inflammasome signaling in lipopolysaccharide (LPS) + interferon (IFN)-γ-treated BV2 cells. (a) Ionized calcium-binding adapter molecule 1 (IBA1) immunofluorescence: representative images showing IBA1 (green) expression and 4′,6-diamidino-2-phenylindole (DAPI) (blue) nuclear counterstain in blank, LPS + IFN-γ, LPS + IFN-γ + negative control small interfering RNA (NC siRNA) and LPS + IFN-γ + TRPV2 siRNA groups. TRPV2 silencing markedly reduced IBA1 expression compared to the LPS + IFN-γ and LPS + IFN-γ + NC siRNA groups. (b) Quantification of IBA1 fluorescence: relative fluorescence intensity of IBA1 was significantly reduced in the LPS + IFN-γ + TRPV2 siRNA group compared to the LPS + IFN-γ + NC siRNA group (n = 3 per group, IBA1: blank vs. LPS + IFN-γ, p = 0.0162; LPS + IFN-γ + NC siRNA vs. LPS + IFN-γ + TRPV2 siRNA, p = 0.0120). (c) NLRP3 immunofluorescence: representative images showing NLRP3 (green) expression and DAPI counterstain in the same treatment groups. NLRP3 expression was reduced following TRPV2 silencing. (d) Quantification of NLRP3 fluorescence: relative fluorescence intensity of NLRP3 was significantly lower in the LPS + IFN-γ + TRPV2 siRNA group compared to the LPS + IFN-γ + NC siRNA group (F3,8 = 99.20, blank vs. LPS + IFN-γ, p = 0.0001; LPS + IFN-γ + NC siRNA vs. LPS + IFN-γ + TRPV2 siRNA, p = 0.0001). (e) Western blot analysis: protein expression of apoptosis-associated speck-like protein containing a CARD (ASC), cleaved caspase-1, cleaved IL-1β and NLRP3 in the treatment groups. GAPDH served as the loading control. TRPV2 silencing significantly decreased the levels of these inflammasome markers compared to LPS + IFN-γ and LPS + IFN-γ + NC siRNA groups. (f–i) Quantification of inflammasome markers: densitometric analysis of ASC (f), cleaved caspase-1 (g), cleaved IL-1β (h) and NLRP3 (i) western blot bands revealed significant reductions in the LPS + IFN-γ + TRPV2 siRNA group compared to the LPS + IFN-γ + NC siRNA group (ASC: blank vs. LPS + IFN-γ, p = 0.0025; LPS + IFN-γ + NC siRNA vs. LPS + IFN-γ + TRPV2 siRNA, p = 0.2066, Brown–Forsythe and Welch analysis of variance (ANOVA) tests, n = 3 per group; cleaved IL-1β: F3,12 = 8.675, blank vs. LPS + IFN-γ, p = 0.0106; LPS + IFN-γ + NC siRNA vs. LPS + IFN-γ + TRPV2 siRNA, p = 0.0412, one-way ANOVA, n = 3 per group; cleaved caspase-1: blank vs. LPS + IFN-γ, p = 0.0073; LPS + IFN-γ + NC siRNA vs. LPS + IFN-γ + TRPV2 siRNA, p = 0.0097, Brown–Forsythe and Welch ANOVA tests, n = 3 per group; NLRP3: blank vs. LPS + IFN-γ, p = 0.0055, n = 3 per group; LPS + IFN-γ + NC siRNA vs. LPS + IFN-γ + TRPV2 siRNA, p = 0.0201, Brown–Forsythe and Welch ANOVA tests, n = 3 per group).
Discussion
In this in vivo study, we established a VM model through the intraperitoneal injection of NTG and KA application to the external auditory canal, followed by tissue collection from the Sp5c region. The results demonstrated a significant increase in the inflammatory factors IL-10 and NLRP3 within the overall Sp5c nucleus area. Moreover, we observed markedly enhanced activation of IBA1 and TRPV2, further confirming that microglial activation in the inflammatory microenvironment of the VM model is closely associated with TRPV2.
To further investigate the mechanisms of the TRPV2 ion channel in microglia, we conducted in vitro experiments via whole-cell, patch-clamp techniques with the BV2 microglial cell line. By introducing TRPV2 -selective blockers and agonists, we observed changes in current responses. Additionally, our findings revealed that activation of the NLRP3 inflammasome and polarization of microglia from the M1 to the M2 phenotype are key mediators of induced pluripotent stem cell- and IFN-induced neuroinflammatory cascades. Notably, the neuroinflammation triggered by the established model was significantly reversed by knocking down the TRPV2 gene.
VM pathophysiology
Migraine is a complex neurobiological disorder with a multifactorial origin accompanied by significant prodromal symptoms (18). It is considered to result from altered brain excitability, which activates the trigeminovascular system in genetically susceptible individuals. The anatomical structures of the trigeminovascular pain pathway include the peripheral nerves of the trigeminovascular system, the central projections of primary afferent neurons in the meninges, the ascending projections of Sp5C neurons and the projections of thalamic trigeminovascular neurons to the cerebral cortex (19).
The trigeminal ganglion, as the primary peripheral structure in this system, releases vasoactive neuropeptides such as substance P and calcitonin gene-related peptide (CGRP) from unmyelinated C fibers and thinly myelinated Aδ fibers (20). These neuropeptides primarily target the soft meninges, arachnoid, dura mater, and cerebral arteries and sinuses via the ophthalmic branch (V1) of the trigeminal nerve. Receptors located on the soft meninges, which are sensitive to mechanical, electrical or chemical stimuli (such as inflammatory molecules, blood or infection), become activated. The central projections of the afferent fibers then enter the brainstem through the trigeminal nerve bundle, transmitting signals caudally at the same time as sending branches that terminate in the Sp5C and the upper cervical spinal segments (C1–3) (21).
Early results from brainstem auditory evoked potentials indicate that both VM and migraine patients exhibit brainstem dysfunction, with VM patients displaying more severe dysfunction (22,23). Furthermore, resting-state functional magnetic resonance imaging and diffusion tensor imaging revealed significant differences between VM patients and migraine patients. In VM patients, the vestibular pathways are notably more active, particularly in the right hemisphere, dominant vestibular hemisphere and vestibular cortex in the parietal insula. By contrast, migraine patients show reduced activity in the left cerebellar Crus I region (24). Moreover, migraine patients exhibit abnormalities in white matter fiber structures, particularly in the knee of the corpus callosum and the anterior limb of the internal capsule, suggesting the involvement of these areas in pain processing.
Dysfunction of the meninges, coupled with intracranial pain signals that impact midbrain structures involved in sensation, emotion, endocrine and autonomic nervous functions, along with abnormal neuronal activity and altered connections in the cortex, diencephalon and/or brainstem, may help explain the various symptoms associated with migraine beyond pain (25). These include irritability, fatigue, drowsiness, exaggerated emotional responses, nausea and loss of appetite.
Neuronal and microglial inflammation in vestibular migraine
In the in vivo experiments, we observed a significant increase in IBA1 activation. The primary interactions between microglia and neurons are associated with synaptic pruning or the rapid clearance of apoptotic cells and non-functional synapses (26). These essential activities ensure the maintenance of neural network integrity and healthy brain function. Furthermore, the microglia-neuron connection provides a communication channel through which microglia continuously monitor neuronal activation and health status, allowing for timely responses to disruptions (27).
In addition, a study using a nitroglycerin-induced migraine model demonstrated increased expression of miR-155-5p and reduced levels of sirtuin 1 in the trigeminocervical complex, indicating an increase in microglial cell numbers (4). Moreover, in migraine models, the levels of Toll-like receptor 4 (TLR4) and IL-18 produced by microglia are persistently elevated (28). Blocking TLR4 not only suppressed the upregulation of IL-18, but also significantly reduced facial rubbing behavior and tactile allodynia in the migraine models. Similarly, Zhang et al. (29) first reported that the protease-activated receptor 2-mitogen-activated protein kinase-nuclear factor-κB pathway mediates mast cell tryptase activity in microglia. Increasing evidence suggests that microglia-driven feedback mechanisms help regulate neuronal activity under physiological conditions. However, under pathological conditions, the reprogramming and activation of microglia may lead to excessive neuronal activation, exacerbating neuroinflammatory responses.
In the present study, although IL-1β levels were significantly elevated in the Sp5c region, the expression levels of NLRP3, as measured by immunofluorescence and western blotting, were not significantly different. However, in vivo experiments on microglia demonstrated that the activation of NLRP3 inflammasome components is a key mediator of induced pluripotent stem cells- and IFN-induced neuroinflammatory cascades and that TRPV2 gene knockdown significantly alleviated the neuroinflammatory responses in this model. The non-significant trends observed in IL-1β and NLRP3 expression remain to be fully explored, potentially indicating time- or context-specific dynamics. Further experiments will be conducted to validate these findings.
Previous studies have shown that, in migraine models induced by either single or multiple cortical spreading depression stimuli, the activation of microglia occurs later than the assembly of the NLRP3 inflammasome in neurons (30). Notably, microglial activation may be partially mediated by TLR2/4 receptor activation through HMGB1 (i.e. high-mobility group box 1) released by neurons. Moreover, inhibiting microglial activation downregulated the NLRP3-mediated inflammatory cascade in neurons. Following NLRP3 activation, microglia release IL-1β, which facilitates caspase-1 activation, leading to the cleavage of pro-IL-1β into mature IL-1β (31).
Taken together, these findings suggest the presence of a potential positive feedback loop between neuronal inflammation and microglial activation. These findings underscore the critical role of microglia-neuron interactions in the onset and progression of migraine and neuroinflammation. Our study further highlights the potential mechanisms of microglia-neuron interactions in the pathogenesis of migraine.
TRPV2 and microgila polarization
The results of the present study are consistent with those of previous experiments, which revealed significant coexpression of TRPV2 and microglia in the Sp5c nucleus. In vitro, we further validated the role of TRPV2 ion channels in microglia via electrophysiological methods. Additionally, further investigations revealed that silencing the TRPV2 gene resulted in suppressed M1 polarization of microglia, as evidenced by immunofluorescence and flow cytometry analysis, at the same time as promoting a marked increase in M2 polarization. Therefore, we conclude that TRPV2 plays a critical role in regulating the polarization of microglia from the M1 to the M2 state.
TRP channels are a class of non-selective cation channels that mediate thermosensation and nociception by allowing the influx of cations such as sodium and calcium (32). This influx contributes to membrane depolarization and the activation of second messenger signaling cascades. The activation of these channels increases the excitability of nociceptive sensory nerve fibers and promotes the release of CGRP from sensory nerve endings. TRPA1, TRPV1, TRPV4, TRPM8, TRPM3 and TRPC5 have been identified at the terminals of meningeal nociceptors. Although TRPV1 channels have been implicated in the transmission of meningeal nociceptive signals and the pathophysiology of headache, clinical trials using the selective TRPV1 antagonist SB-705498 have not demonstrated significant therapeutic benefits in migraine patients, thereby limiting its clinical potential (33). TRPV2 expression was first observed in 16% of rat dorsal root ganglion neurons, primarily in medium-to-large neurons, which are most likely thinly myelinated Aδ fibers (34). Additionally, 30% of TRPV2-positive cells were found to coexpress CGRP, a neuropeptide associated with nociceptive sensory neurons (35). A similar pattern of TRPV2 expression has been observed in the trigeminal ganglia of rats, with higher levels detected in the trigeminal nerves of the dental pulp (36).
In immune cells, TRPV2 acts as a molecular sensor with diverse functions, including phagocytosis/degranulation, migration/chemotaxis, cytokine secretion, tissue infiltration, endocytosis, inflammasome activity, neuroinflammation and pod some assembly (37). In a study of cannabidiol (CBD) study, TRPV2 expression was reduced in neurons exposed to oxygen-glucose deprivation (OGD) but significantly increased in activated phagocytic microglia (8). CBD treatment not only increased TRPV2 expression but also reduced microglial phagocytosis at the same time as increasing the number of rod-shaped microglia after OGD. Endogenous nitric oxide production in microglia balances between the negative feedback regulation by the SOCC with positive feedforward regulation by TRPV2 channels. This balance controls intracellular calcium dynamics and regulates microglial functions such as proliferation and phagocytosis. Furthermore, CBD activated TRPV2, enhancing microglial phagocytosis of amyloid-β and increasing the mRNA expression of phagocytosis- asscociated receptors (38). However, this effect was reversed by silencing TRPV2 or Trem2. TRPV2-mediated functions are dependent on the PDK1/Akt signaling pathway, where autophagy plays an essential role. More importantly, CBD treatment successfully alleviated neuroinflammation and improved mitochondrial function and ATP production through TRPV2 activation (39). On the basis of these findings, we hypothesize that microglia increase calcium influx through TRPV2 channels, increasing synaptic transmission in VM. This process likely promotes central sensitization and contributes to the development of vestibular migraine.
The present study hypothesizes that, in a VM model induced by NTG and KA, along with LPS and IFN-γ-stimulated microglia, TRPV2 activation in the caudal spinal trigeminal nucleus drives microglial polarization, leading to NLRP3 activation and central sensitization, thereby contributing to the development of vestibular migraine. However, broader implications, such as the therapeutic potential of targeting TRPV2, remain underexplored. Future research will focus on addressing this gap by investigating how TRPV2 modulation could be integrated into the clinical management of VM and other neuroinflammatory conditions.
Study limitations
The present study investigated the relationship between the TRPV2 gene and VM primarily through siRNA transfection targeting TRPV2 in BV2 cell lines. However, no in vivo experiments have been conducted using TRPV2-knockout mice because of their extremely high perinatal mortality, which poses significant challenges for research. Specifically, in heterozygous breeding, only 2.5% of weaned pups were TRPV2 knockouts, resulting in a very limited number available for analysis (40). This scarcity makes it difficult to characterize these animals comprehensively. Notably, only one existing study has reported the pain phenotype of TRPV2-deficient mice, further underscoring the lack of data in this area. This limitation affects the interpretation of microglial polarization data because findings derived solely from BV2 cells may not fully reflect in vivo mechanisms. Alternative approaches, such as CRISPR (i.e. clustered regularly interspaced short palindromic repeats) knockdown in primary microglia, should be considered to address this gap. Future research will focus on the broader context of TRP channel investigations in migraine, aiming to expand our understanding of the role of TRPV2 in neuroinflammation and its therapeutic potential.
The prevalence of migraine in women is approximately three times greater than that in men (41), with the highest rates observed in both sexes between the ages of 35 and 39 years. In female mice, hormonal levels fluctuate significantly throughout the estrous cycle, which may impact the stability and reproducibility of the experimental results. Additionally, monitoring the estrous cycle requires additional time and resources, increasing the complexity of the experiments. Therefore, female mice were excluded from this study, limiting the exploration of sex differences in disease progression. However, it is important to note that there may be a significant three-way interaction between sex, the model induction method and gene knockdown, which could not be fully addressed in this study with respect to its relationship to the disease.
For the electrophysiological experiments, we used probenecid as a TRPV2 agonist and MCE-157131 as a TRPV2-selective blocker. However, the results revealved no statistically significant activation by probenecid. We hypothesize that this lack of activation is because although probenecid exhibits high specificity for the TRPV2 channel, it is not a TRPV2-specific agonist. Probenecid is a potent and selective agonist of TRPV2 channels. Probenecid also inhibits pannexin 1 channels. Therefore, this could explain the absence of positive results observed in our experiments (42).
Conclusions
In conclusion, the present study identified TRPV2 as a key regulator of microglial activation and NLRP3 inflammasome activity in vestibular migraine. TRPV2 promotes central sensitization in the Sp5c by driving proinflammatory microglial polarization and neuroinflammation. Blocking TRPV2 alleviates these effects, highlighting its potential as a therapeutic target for managing vestibular migraine.
TRPV2-mediated calcium influx enhances NLRP3 inflammasome activation, contributing to neuroinflammation and central sensitization in vestibular migraine VM. TRPV2 upregulation in the Sp5c is associated with microglial activation. TRPV2 inhibition shifts microglial polarization from the proinflammatory M1 state to the anti-inflammatory M2 state. Blocking TRPV2 reduces NLRP3 inflammasome activation and proinflammatory cytokine release, suggesting TRPV2 as a promising therapeutic target for VM treatment.
Supplemental Material
sj-docx-1-cep-10.1177_03331024251364753 - Supplemental material for Microglial TRPV2-mediated neuroinflammation promotes central sensitization through microglial polarization in a vestibular migraine mouse model
Supplemental material, sj-docx-1-cep-10.1177_03331024251364753 for Microglial TRPV2-mediated neuroinflammation promotes central sensitization through microglial polarization in a vestibular migraine mouse model by Qingling Zhai, Hongyan Li, Qihui Chen, Ning Zhang, Yanan Huang and Yonghui Pan in Cephalalgia
Footnotes
Declaration of conflicting interests
The authors declared no potential conflicts of interest with respect to the research, authorship and/or publication of this article.
Funding
This work was supported by General Program of National Natural Science Foundation of China (82071549, 82371483); Key Program of Natural Science Foundation of Heilongjiang Province (ZD2019H006); and Key Program of Planning Subject for the 13th Five-Year Plan of Heilongjiang Province Education Sciences (GJB1319086).
Ethical statement
All animal procedures and ethical considerations were approved by the Institutional Animal Care and Use Committee of Harbin Medical University.
Supplemental material
Supplemental material for this article is available online.
References
Supplementary Material
Please find the following supplemental material available below.
For Open Access articles published under a Creative Commons License, all supplemental material carries the same license as the article it is associated with.
For non-Open Access articles published, all supplemental material carries a non-exclusive license, and permission requests for re-use of supplemental material or any part of supplemental material shall be sent directly to the copyright owner as specified in the copyright notice associated with the article.