
Abstract
Background
The visual cortex is involved in the generation of migraine aura. Voxel-based multivariate analyses applied to this region may provide complementary information about aura mechanisms relative to the commonly used mass-univariate analyses.
Methods
Structural images constrained within the functional resting-state visual networks were obtained in migraine patients with (n = 50) and without (n = 50) visual aura and healthy controls (n = 50). The masked images entered a multivariate analysis in which Gaussian process classification was used to generate pairwise models. Generalizability was assessed by five-fold cross-validation and non-parametric permutation tests were used to estimate significance levels. A univariate voxel-based morphometry analysis was also performed.
Results
A multivariate pattern of grey matter voxels within the ventral medial visual network contained significant information related to the diagnosis of migraine with visual aura (aura vs. healthy controls: classification accuracy = 78%, p < 0.001; area under the curve = 0.84, p < 0.001; migraine with aura vs. without aura: classification accuracy = 71%, p < 0.001; area under the curve = 0.73, p < 0.003). Furthermore, patients with visual aura exhibited increased grey matter volume in the medial occipital cortex compared to the two other groups.
Conclusions
Migraine with visual aura is characterized by multivariate and univariate patterns of grey matter changes within the medial occipital cortex that have discriminative power and may reflect pathological mechanisms.
Keywords
Introduction
Migraine auras are transient neurological symptoms that typically occur before a headache attack. Approximately 10–30% of migraine patients experience auras and, among these, about 90% have visual auras (1,2). The occipital cortex is considered to have a pivotal role in the initiation of visual auras, as cortical spreading depression, the likely mechanism underlying visual auras, have been observed to arise within this region (3). Interictal changes in resting-state functional connectivity and grey matter structure within the occipital cortex has also been observed in migraine with visual auras (MA) (4–9), albeit with inconsistencies reported (10). These changes may either represent a predisposition to cortical spreading depression or arise as a consequence of the repetitive attacks. Further characterization of the neurobiological mechanisms associated with migraine auras may not only improve our understanding of the long-term consequences of repeated aura on the brain, but also provide objective biomarkers that would allow for optimization of migraine diagnostic criteria.
Previous neuroimaging studies on migraine auras have primarily used mass-univariate analyses in which each voxel is considered as a spatially independent unit. However, univariate voxel-wise analyses may fail to detect spatially distributed multidimensional effects (11). Multivariate pattern analysis is a complementary approach in which information contained jointly among multiple voxels is taken into account at once. Multivariate pattern classification applies machine learning algorithms to identify distributed patterns of voxels which, for example, can differentiate groups of participants and be used to make predictions about diagnoses at the individual level. To ensure successful classification, it is important that only information that is meaningful to the condition or diagnosis is used.
In the present cross-sectional study, we sought to investigate whether a multivariate pattern of grey matter structure within the visual pathways can be used to distinguish MA from migraine without aura (MO) or healthy controls (HC). Because the occipital cortex is involved in the generation of visual aura and may exhibit altered interictal grey matter structure and functional connectivity (4–9), we hypothesized that grey matter within the functionally defined resting-state visual networks contains discriminative information that can be used to differentiate MA from MO and HC. We have previously shown that grey matter structure constrained to a functional resting-state network could be used to predict individual characteristics such as pain sensitivity (12). It is noteworthy that the present study does not propose a functional classification model but rather focuses on defining features for future application in such models. A mass-univariate voxel-based morphometric analysis was also performed to obtain complementary information. To mitigate some of the limitations of previous studies, we employed a balanced design and controlled for a range of demographic and clinical characteristics. Furthermore, because episodic and chronic migraine likely involves different pathophysiologies, the present study only included patients with low-frequency migraine to avoid mixed results.
Methods
Study population
Episodic migraine patients with visual aura and without any type of aura were recruited from the Headache Clinic of Taipei Veterans General Hospital. Both diagnoses were made according to the criteria proposed by the International Classification of Headache Disorders, 3rd edition (ICHD-3) (13). Potential participants completed a structured questionnaire on demographics and clinical profile during his or her first visit and were required to keep a daily headache diary. The following clinical information was collected from the questionnaires and diaries: headache and migraine frequency (days/month), maximum headache severity and mean headache severity in the previous year (0–10 on a visual analogue scale), age at headache onset, aura phenotype (visual/sensory/aphasia/other), the presence of photophobia (yes/no), usage of acute or preventive medication (type, dosage and days/month) and past medical history. In addition, on the day of scanning, the Beck Depression Inventory and the Migraine Disability Assessment questionnaire were administered. Patients were enrolled in this study if they (i) had one to nine headache days per month (i.e. low-frequency episodic migraine attacks); (ii) were in the interictal state (i.e. had no migraine attacks within 48 hours before and after the scanning as determined by their headache diaries and telephone follow-up); (iii) had not received any prophylactic medication six months prior to the experiment; and (iv) took no acute abortive medications 48 hours prior to the scanning. In addition, all aura patients had to have active visual aura (i.e. at least one migraine with visual aura per month). Healthy controls were recruited through advertising in the local community, including Taipei Veterans General Hospital and National Yang Ming Chiao Tung University, and were required to have no history of migraine or other primary headaches. Infrequent tension-type headache (≤1 headache day/month) was, however, allowed. Apart from the migraine diagnosis in the patient groups, both patients and healthy controls were normal in physical and neurological examinations and did not have any systemic diseases, psychiatric disorders or conditions incompatible with magnetic resonance imaging. Recruitment and scanning took place between July 2016 and July 2020 after approval of the study by the Institutional Review Board of Taipei Veterans General Hospital (VGH IRB: 2012-01-029BC; 2015-01-004CC; 2015-11-002B). All participants provided their written, informed consent in accordance with the Helsinki Declaration (6th revision) before undergoing any study-related procedures.
Imaging protocol
Data were acquired at Taipei Veterans General Hospital on a 3-Tesla GE Discovery MR750 scanner (GE Healthcare, Waukesha, WI, USA) with an eight-channel head coil. Participants’ heads were immobilized with cushions inside the coil to diminish motion artifacts during scanning. Anatomical images were acquired using a T1-weighted, 3D-fast spoiled gradient echo pulse sequence (repetition time/inversion time/flip angle: 9.156 ms/3.68 ms/12°) with the following parameters: matrix, 256 × 256 × 168; field of view, 256 × 256 mm2; voxel size: 1 × 1 × 1 mm3. The resting-state functional scans were acquired with a T2*-weighted gradient echo planar imaging sequence using blood oxygenation level-dependent contrast (repetition time/echo time/flip angle: 2500 ms/30 ms/90°) with the parameters: matrix, 64 × 64 × 43; field of view, 222 × 222 mm2; voxel size = 3.47 × 3.47 × 3.5 mm3. In all, 200 functional volumes were acquired for each participant. During the functional scans, participants were instructed to refrain from moving the head and remain awake at the same time as keeping their eyes closed.
A priori masks
The visual network masks were generated from functional connectivity maps based on resting-state data acquired in the same participants as those included in the analysis of the grey matter images (Figure 1). The resting-state data were pre-processed as described in detail in Niddam et al. (14). Initial pre-processing was performed using the Statistical Parametric Mapping 12 software package (SPM12; https://www.fil.ion.ucl.ac.uk/spm/software/spm12) running in MATLAB (R2021b; MathWorks, Natick, MA, USA) and included removal of the first five image volumes, slice time correction, realignment, coregistration of individual functional and anatomical images, spatial warping to standard space, and spatial smoothing with a 6 × 6 × 6 mm3 (full width at half maximum) Gaussian kernel. Further pre-processing using DPARSF (http://rfmri.org/DPARSF) included removal of linear trends, removal of signals related to head motion and temporal filtering with a band-pass of 0.01–0.1 Hz. These images then entered into a group independent component analysis (GIFT toolbox; http://mialab.mrn.org/software). Four analyses were performed: one for each of the three groups of participants and one in which all participants entered together. The purpose of the first three analyses was to create masks that were specific to the participants entered in the prediction models. The purpose of the fourth analysis was to generate larger and less specific masks. It is noteworthy that, as a result of the larger number of participants included in the latter analysis, more regions will pass the same statistical criteria as if used in the former three analyses. Based on our previous experience (14), a total of 40 spatially independent components were estimated for each participant. In each of the four analyses, group component maps corresponding to the visual networks were first identified by spatial sorting using predefined template images from prior analyses. The corresponding individual component maps then entered into one-sample t-tests in SPM12. The group specific maps were thresholded at a voxel-level p < 2 × 10⁻⁵, corrected for family-wise errors (FWE), in order to create focal maps and to reduce the spatial overlap between the different visual networks. The map resulting from including all three groups in the analysis was thresholded at a voxel-level p < 0.05, corrected for FWE. The statistical maps from the four analyses were then converted into binary images. Because pair-wise classification was performed among the three groups (see below), the focal masks from the two groups entered in the specific classification analysis were added together and binarized again to generate the final specific masks (Figure 1 and supplementary Figure 1). In summary, smaller focal masks and larger more general masks were generated for each of the identified visual networks (supplementary Figure 1).
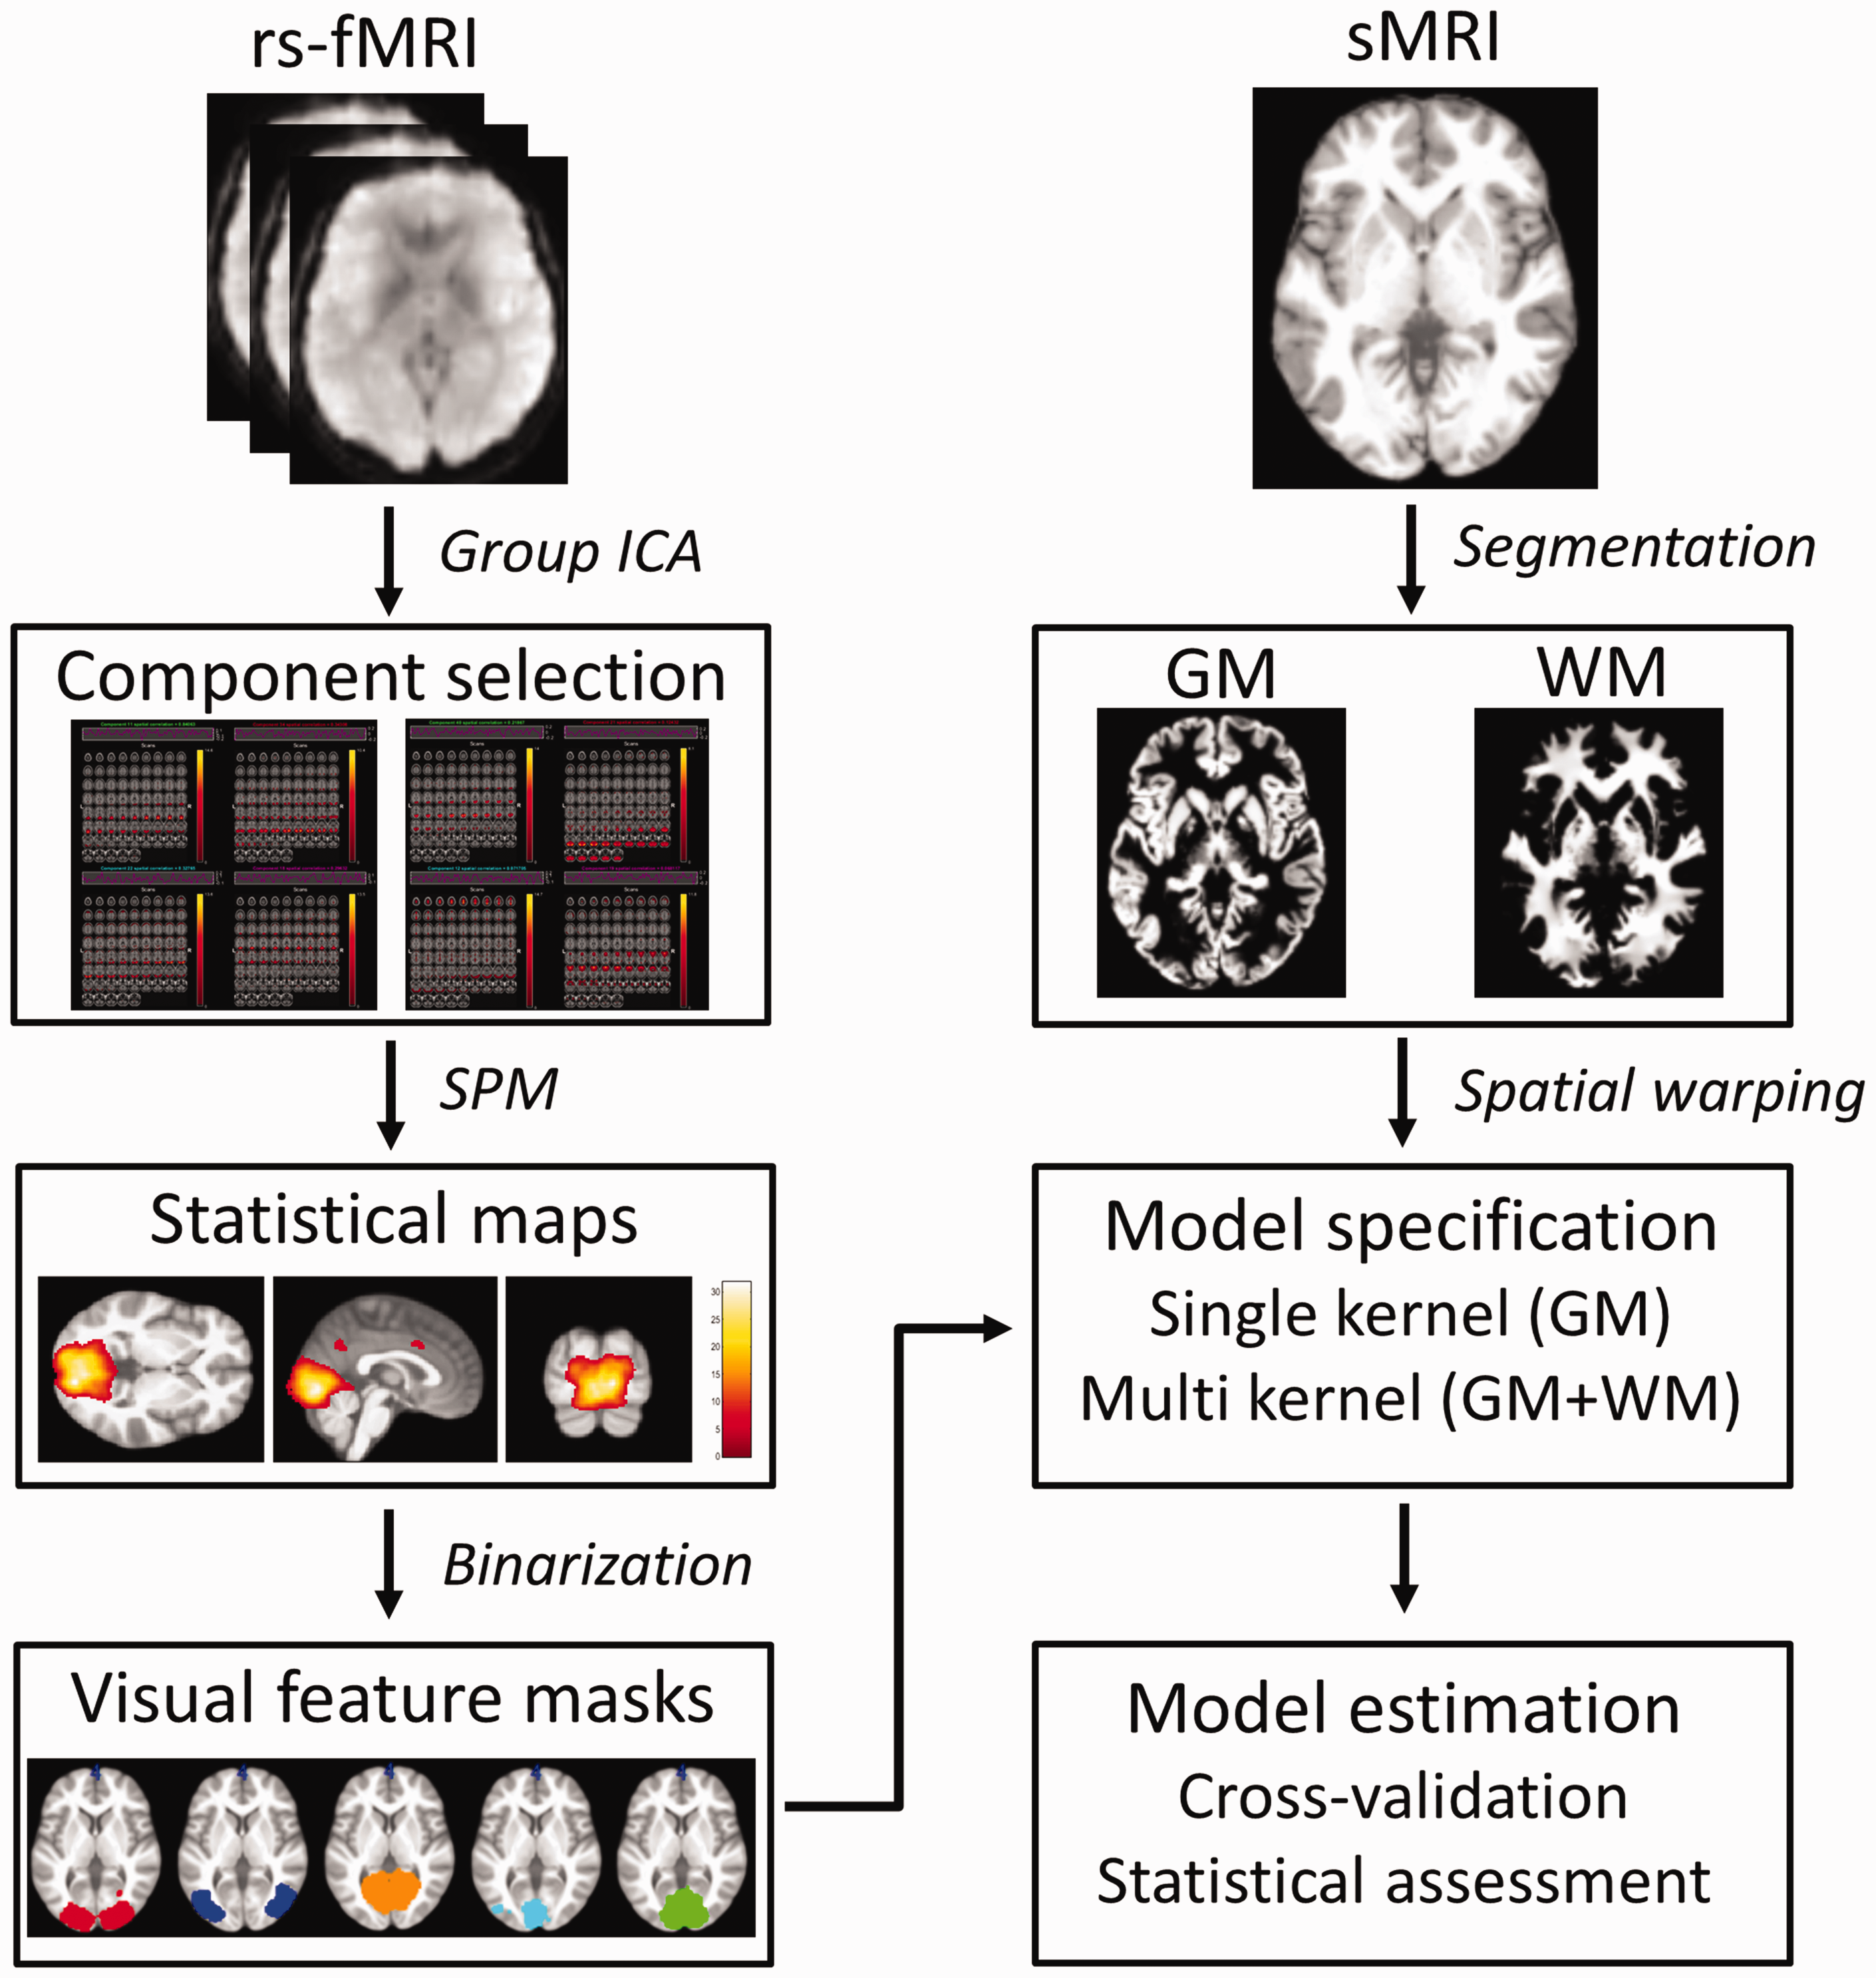
Schematic illustration of the processing flow for the multivariate analyses. Independent component analysis (ICA) of resting-state functional magnetic resonance imaging data (rs-fMRI) was first used to generate features. Five visual networks were identified in each group. The component maps for each network entered into one-sample t-tests in Statistical Parametric Mapping (SPM) where the resulting maps were binarized. The generated feature masks were used to constrain grey (GM) and white (WM) matter images segmented from structural magnetic resonance images (sMRI). The masked images entered into multivariate analyses in which single or multi kernel classification models were setup and performances were estimated.
Tissue segmentation
The Computational Anatomy Toolbox (CAT12; http://www.neuro.uni-jena.de/cat), an extension to SPM12, was used to first segment the anatomical images into grey and white matter images (Figure 1). These images were then spatially warped to standard Montreal Neurological Institute space and resampled to a resolution of 1.5 × 1.5 × 1.5 mm3. Spatial warping was performed with the tissue volume preserved (modulated) as well as non-preserved (unmodulated) and the resulting images were spatially smoothed with a 6 × 6 × 6 mm3 Gaussian kernel. The quality (sample homogeneity) of the images were examined by inspecting the Mahalanobis distance and weighted overall image quality for each participant. No outliers were found.
Multivariate pattern analysis
The multivariate pattern analysis was implemented in the Pattern Recognition for Neuroimaging Toolbox (ProNTo; http://www.mlnl.cs.ucl.ac.uk/pronto) (15) running in MATLAB. A schematic illustration of the processing flow for the multivariate analysis is shown in Figure 1. Because unmodulated grey matter images have been shown to yield improved prediction accuracy (15,16), the unmodulated, smoothed grey matter images were used in this analysis. Furthermore, these images were constrained within the focal and non-focal visual network masks and entered as features into separate classification models. Pairwise classification models were then generated among the three groups: HC vs. MA, MO vs. MA and HC vs. MO. Binary Gaussian process classification (17) was used to predict the migraine diagnosis and the generalizability of each model was evaluated using five-fold cross validation (i.e. for each fold, 10 participants from each group were used to test the model). The participants included in each fold were the same for all features within the same pairwise classification model and for each group across models. Furthermore, age, sex and handedness were balanced across all folds within and between groups (supplementary Figure 2). Headache and migraine frequencies were also balanced across all folds within and between migraine groups. Finally, total intracranial volume and age were regressed out prior to the analyses. The performance of the models was indexed by the balanced accuracy and the area under the receiver operating characteristic curve (AUC). In addition, class accuracies and class predictive values were also calculated to assess the predictions. Non-parametric permutation tests were used to assess the significance of the performance metrics. More specifically, to evaluate the null hypothesis that no difference exists between grey matter patterns from the different diagnoses, null distributions of the performance metrics were generated by permuting group labels (i.e. group labels were randomly assigned to imaging data and performance metrics calculated for each permutation). In all, 2000 permutations were performed per classification model. As a result of the multiple models tested, only p-values for which the balanced accuracy and the area under the curve both passed a threshold corrected for the false discovery rate were considered significant. Voxel-wise weight maps were calculated for the best performing models. These maps show the spatial representation of the predictive function with contributions from each voxel. Because the entire map contributes to the prediction, the map cannot be thresholded.
To further examine the performance of the best models in mixed population groups, two new groups were generated in which both HC and MO were included (HCMO1 and HCMO2). The choice of splitting HC and MO into two mixed groups was made to avoid an imbalanced design at the same time as controlling for confounds across folds. The analyses proceeded as above. Finally, unmodulated white matter images were included in the best performing models as an additional modality to examine whether improved performances could be obtained. For these models, an L1 multiple kernel learning algorithm was used with five-fold cross validation for hyperparameter tuning, as well as for the overall validation.
Voxel-based morphometry
A conventional univariate voxel-based morphometry analysis was performed using the modulated grey matter images from the entire brain (i.e. an unrestricted analysis). Modulation of the grey matter images ensures that volumes are compared instead of concentrations. Pairwise group comparisons were made in SPM12 using two-sample (independent) t-tests. Voxels with a grey matter value <0.1 were excluded from the analyses to avoid possible boundary effects between tissue types and to preserve homogeneity. Total intracranial volume and age were added as covariates of no interests. Statistical maps were thresholded at a voxel-level p < 0.001 followed by a cluster-level p < 0.05, corrected for FWE. The relationship between grey matter density and clinical variables (mean headache severity in the last year, headache frequency, migraine frequency and headache duration) was examined in MA patients using (i) a region-of-interest analysis (MarsBaR 0.45 toolbox; https://marsbar-toolbox.github.io) in which the mean grey matter density was extracted from a cluster in the medial visual cortex exhibiting significant changes in the between-group analyses and (ii) whole-brain voxel-wise regression analyses. In both analyses, age and total intracranial volume were used as covariates of no interests. In the region-of-interest analysis, p < 0.0125 (Bonferroni corrected for the four tests) was considered significant and in the voxel-wise analysis, statistical maps were thresholded at a voxel-level p < 0.001 followed by a cluster-level FWE corrected p < 0.05.
Functional connectivity analyses
Two functional connectivity analyses were performed. In the first analysis, the component maps identified from the above mentioned independent component analysis, in which all three groups of participants were included, entered into pairwise group comparisons in SPM12 using independent t-tests. In the second analysis, a seed-based functional connectivity analysis was performed for a locus in the left medial visual cortex exhibiting increased grey matter density. The seed was defined as a sphere with a radius of 6 mm centered at [–6 –88 –9] (see Results). Using DPARSF, the time series within the seed were averaged and r-maps were generated for each participant. The r-maps were converted into z-maps using Fisher’s r-to-z transformation. Finally, pairwise group comparisons of the z-maps were performed in SPM12 using independent t-tests. In all analyses, age was added as a covariate of no interest. Statistical maps were thresholded at a voxel-level p < 0.001 followed by a cluster-level FWE corrected p < 0.05.
Other statistical analyses
Descriptive statistics (mean ± SD) were calculated for demographic data, clinical characteristics, questionnaire scores and total intracranial volume. Independent t-tests or one-way analysis of variance were used to test for between group differences in continuous variables and chi-squared tests were used to test for between group differences in categorical variables. p < 0.05 (two-tailed) was considered statistically significant for all of these tests.
Results
Demographics and behaviour
In total, 150 individuals participated in the study. Of these, 50 had episodic migraine with visual aura, 50 had episodic migraine without aura and 50 were healthy controls. All patients were without headache on the scan day and were in the interictal state. Demographics and clinical characteristics of the study population are provided in Table 1. The three groups were sex matched and did not differ with respect to handedness, height, weight or total intracranial volume. However, MA patients were significantly younger than MO patients (post-hoc Tukey: p = 0.022). The two patient groups did not differ with respect to any of the clinical characteristics. Of the 50 MA patients with visual aura, 13 also had sensory auras and five also had aphasic aura. Twenty-five MA patients had unilateral visual aura, seven had bilateral visual aura and 18 had sometimes unilateral and sometimes bilateral aura. Information about the specific side of the unilateral aura was not obtained. All MA patients reported scotomas and 42 reported jagged lines and/or blurry vision. Additional aura features included flickering (all MA patients) and moving (32 MA patients) qualities.
Demographics and clinical characteristics of migraine patients and healthy controls (mean ± SD).

Chi-squared test.
One-way analysis of variance or independent t-test, when appropriate.
Includes migraines with and without aura.
BDI, Beck Depression Inventory; HC, healthy controls; MA, migraine with visual aura; MIDAS, The Migraine Disability Assessment questionnaire; MO, migraine without aura; TIV, total intracranial volume. Mean headache severity was estimated in the previous year.
The functionally defined masks
Two patients with aura, four patients without aura and five healthy controls were excluded from the functional analysis as a result of excessive head movements during the scan. For the remaining participants, independent component analysis of each group, separately, and for the three groups combined resulted in five components within the visual cortical areas per analysis. Two of these components were mainly distributed laterally (denoted Lateral 1 and 2) and three components were mainly distributed medially (denoted Medial 1, 2 and 3). Accordingly, four sets of five feature masks were generated (Figure 1 and 2). The first three sets were specific to the pairwise classification analysis (i.e. only adding the masks from the groups used in the classification) (HC vs. MA, MO vs. MA and HC vs. MO). The fourth set was based on the analysis in which all three groups were included simultaneously and remained the same for the different pairwise classifications. Hence, for each of the three pairwise classification analyses, the five feature masks specific to the classification were used as well as the five unspecific feature masks generated from all three groups (Figure 2 and supplementary Figure 2). It is noteworthy that the latter masks also included regions outside the visual cortical areas.
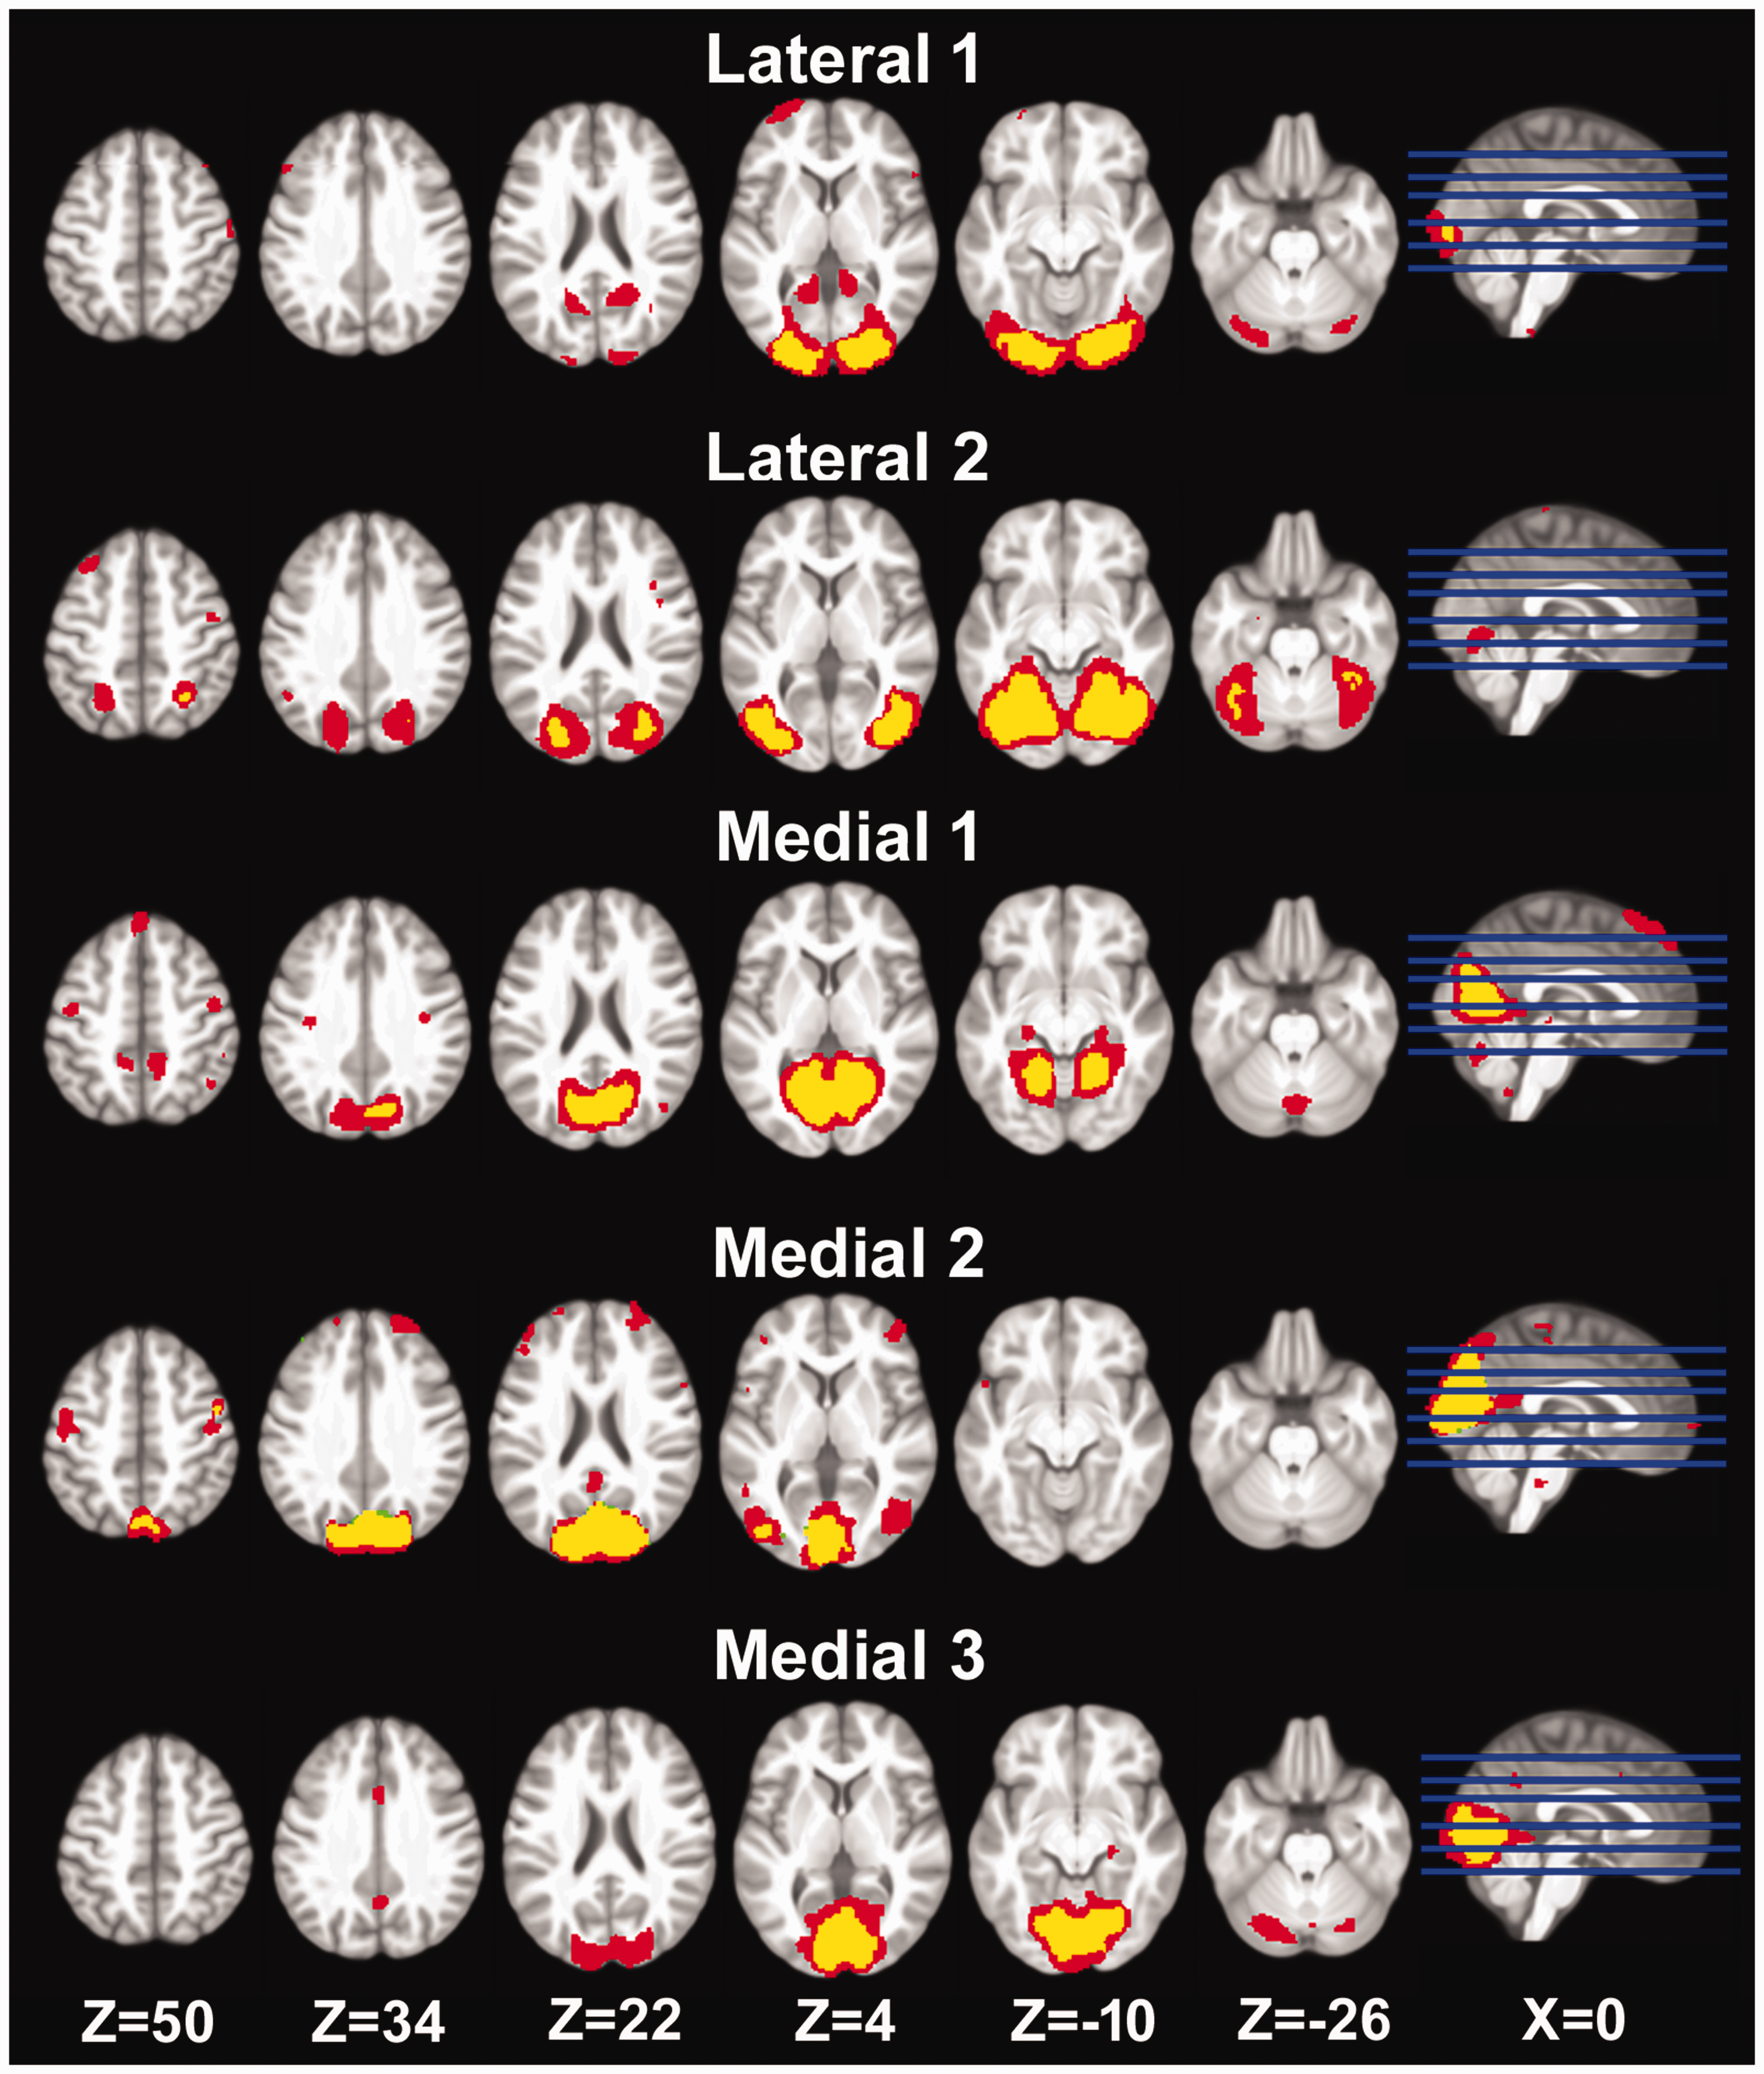
Five visual networks were identified in the functional resting-state data, including two lateral networks and three medial networks. Focal and specific feature masks (yellow) were generated for each binary classification model (here shown for data from healthy controls and migraine patients with visual aura). Larger general feature masks (red) were also generated. These were based on data from all three groups and remained the same across models. Thus, 10 feature masks were applied per binary classification model.
Multivariate analyses of grey matter structure
Pairwise classification using grey matter confined within each of the 10 feature masks was performed using binary Gaussian process classification with five-fold cross validation. The performance of each model is listed in supplementary Table 1. The specific Medial 3 mask was found to be the best performing feature when predicting the MA diagnosis relative to HC. The balanced accuracy was found to be 78% (p = 0.0005) and class accuracies were 82% and 74% for HC and MA, respectively. The corresponding AUC was 0.84 (p = 0.0005) and the class predictive values were 81 and 84% for HC and MA, respectively. The resulting voxel-based predictive pattern, the confusion matrix and the receiver operating characteristic curve are shown in Figure 3. The balanced accuracy and AUC measures resulting from the unspecific Medial 1 and 3 masks also remained significant after correcting for the false discovery rate, albeit at lower p-values (supplementary Table 1).

Voxel-wise multivariate pattern classification of migraine patients with visual aura and healthy controls. Upper: The voxel-wise weight maps within the Medial 3 mask. The slice location of the mask is shown in the insert. Lower left: The confusion matrix showing the true positives, false negatives, false positives and true negatives for the classification model. Values are given as the number of participants across the five test folds and should be divided by the total number of participants in all test folds (i.e. n = 50) and multiplied by 100 to obtain percentages. Lower right: Receiver operating curve showing the true positive rate as a function of the false positive rate. HC, healthy controls; MA, migraine with visual aura; AUC, area under the curve; ROC, receiver operating curve; Z, MNI coordinate in the dorsal-ventral direction.
When predicting the MA diagnosis relative to MO, the larger unspecific Medial 3 (Medial 3*) mask was found to be the best performing feature (supplementary Table 1). The balanced accuracy was found to be 71% (p = 0.0005) and class accuracies were 74 and 68% for patients without and with aura, respectively. The corresponding AUC was 0.73 (p = 0.0030) and the class predictive values were 75 and 71% for MO and MA patients, respectively. The resulting voxel-based predictive pattern, the confusion matrix and the receiver operating characteristic curve are shown in Figure 4. Using the specific and unspecific Medial 1 masks also resulted in significant predictions (supplementary Table 1). None of the features were able to significantly diagnose migraine without aura relative to healthy controls (supplementary Table 1).

Voxel-wise multivariate pattern classification of migraine patients with and without visual aura Upper: The voxel-wise weight maps within the extended Medial 3 mask. The slice location of the mask is shown in the insert. Lower left: The confusion matrix showing the true positives, false negatives, false positives and true negatives for the classification model. Lower right: Receiver operating curve showing the true positive rate as a function of the false positive rate. Values are given as the number of participants across the five test folds and should be divided by the total number of participants in all test folds (i.e. n = 50) and multiplied by 100 to obtain percentages. MA, migraine with visual aura; MO, migraine without aura; AUC, area under the curve; ROC, receiver operating curve; Z, MNI coordinate in the dorsal-ventral direction.
The performance of the unspecific Medial 1* and Medial 3* features were further explored using two control groups consisting of both HC and MO (i.e. HCMO1 and HCMO2), each including 25 HCs and 25 MOs. For the Medial 1* mask, the mean balanced accuracy and AUC were 71% and 0.78, respectively (HCMO1: 74%, p = 0.0005 and 0.82, p = 0.0005; HCMO2: 68%, p = 0.0020 and 0.73, p = 0.0020). For the Medial 3* mask, the mean balanced accuracy and AUC were 68% and 0.74, respectively (HCMO1: 66%, p = 0.0035 and 0.73, p = 0.0005; 69%, p = 0.0010 and 0.75, p = 0.0015.
L1-Multiple kernel learning models were created to further assess whether including white matter within the masks would improve the best classification results. For classification of MA versus HC, using both grey and white matter within the specific Medial 3 mask did not improve the result (balanced accuracy: 75%, p = 0.0010; HC class accuracy: 80%; MA class accuracy: 70%; AUC: 0.81, p = 0.0005; class predictive value for HC: 77%; class predictive value for MA: 79%). However, a slight improvement was found in the classification of MA versus MO within the unspecific Medial 3* mask (balanced accuracy: 72%, p = 0.0005; MO class accuracy: 72%; MA class accuracy: 72%; AUC: 0.74, p = 0.0015; class predictive value for MO: 76%; class predictive value for MA: 73%).
Univariate analyses of grey matter structure
Conventional mass-univariate voxel-based morphometric analyses were performed to further examine group differences in grey matter density. Higher grey matter density was found in the same two loci when comparing MA with HC as well as MO (Figure 5). One cluster was located in the left lingual gyrus and calcarine sulcus (Brodmann areas 17 and 18; MA vs. HC: [x y z] = [–4 –88 –9]; cluster size = 1105 voxels; cluster-wise pFWE <0.001; MA vs. MO: [x y z] = [–6 90 –9]; cluster size = 699 voxels; cluster-wise pFWE = 0.004). The other cluster was located in the right middle frontal and inferior frontal gyri (MA with HC: [x y z] = [50 18 33]; cluster size = 648 voxels; cluster-wise pFWE = 0.007; MA vs. MO: [x y z] = [45 26 36]; cluster size = 849 voxels; cluster-wise pFWE = 0.001). Differences in grey matter density were not found when comparing migraine patients without aura with healthy controls. Box plots of mean grey matter intensities within the two clusters, as well as their mirrored clusters in the opposite hemisphere, are shown in supplementary Figure 3. None of the pairwise comparisons resulted in lower grey matter density in any region. Using the significant cluster located in the left lingual gyrus as a region-of-interest, the mean grey matter density was extracted in the MA group and correlated with clinical variables (mean headache severity in the last year, headache frequency, migraine frequency and headache duration). However, significant relationships were not found for any of the variables. An additional whole-brain voxel-wise regression analysis was performed for the same clinical parameters. A positive relationship was found with migraine frequency for three clusters located in the left superior parietal lobule ([x y z] = [–21 –70 54]; cluster size = 433 voxels; cluster-wise pFWE = 0.038), the left posterior hippocampus ([x y z] = [–27 –26 –6]; cluster size = 614 voxels; cluster-wise pFWE = 0.008) and the right cerebellum ([x y z] = [33 –57 –40]; cluster size = 413 voxels; cluster-wise pFWE = 0.046). None of the other clinical variables exhibited a significant relationship with grey matter density.
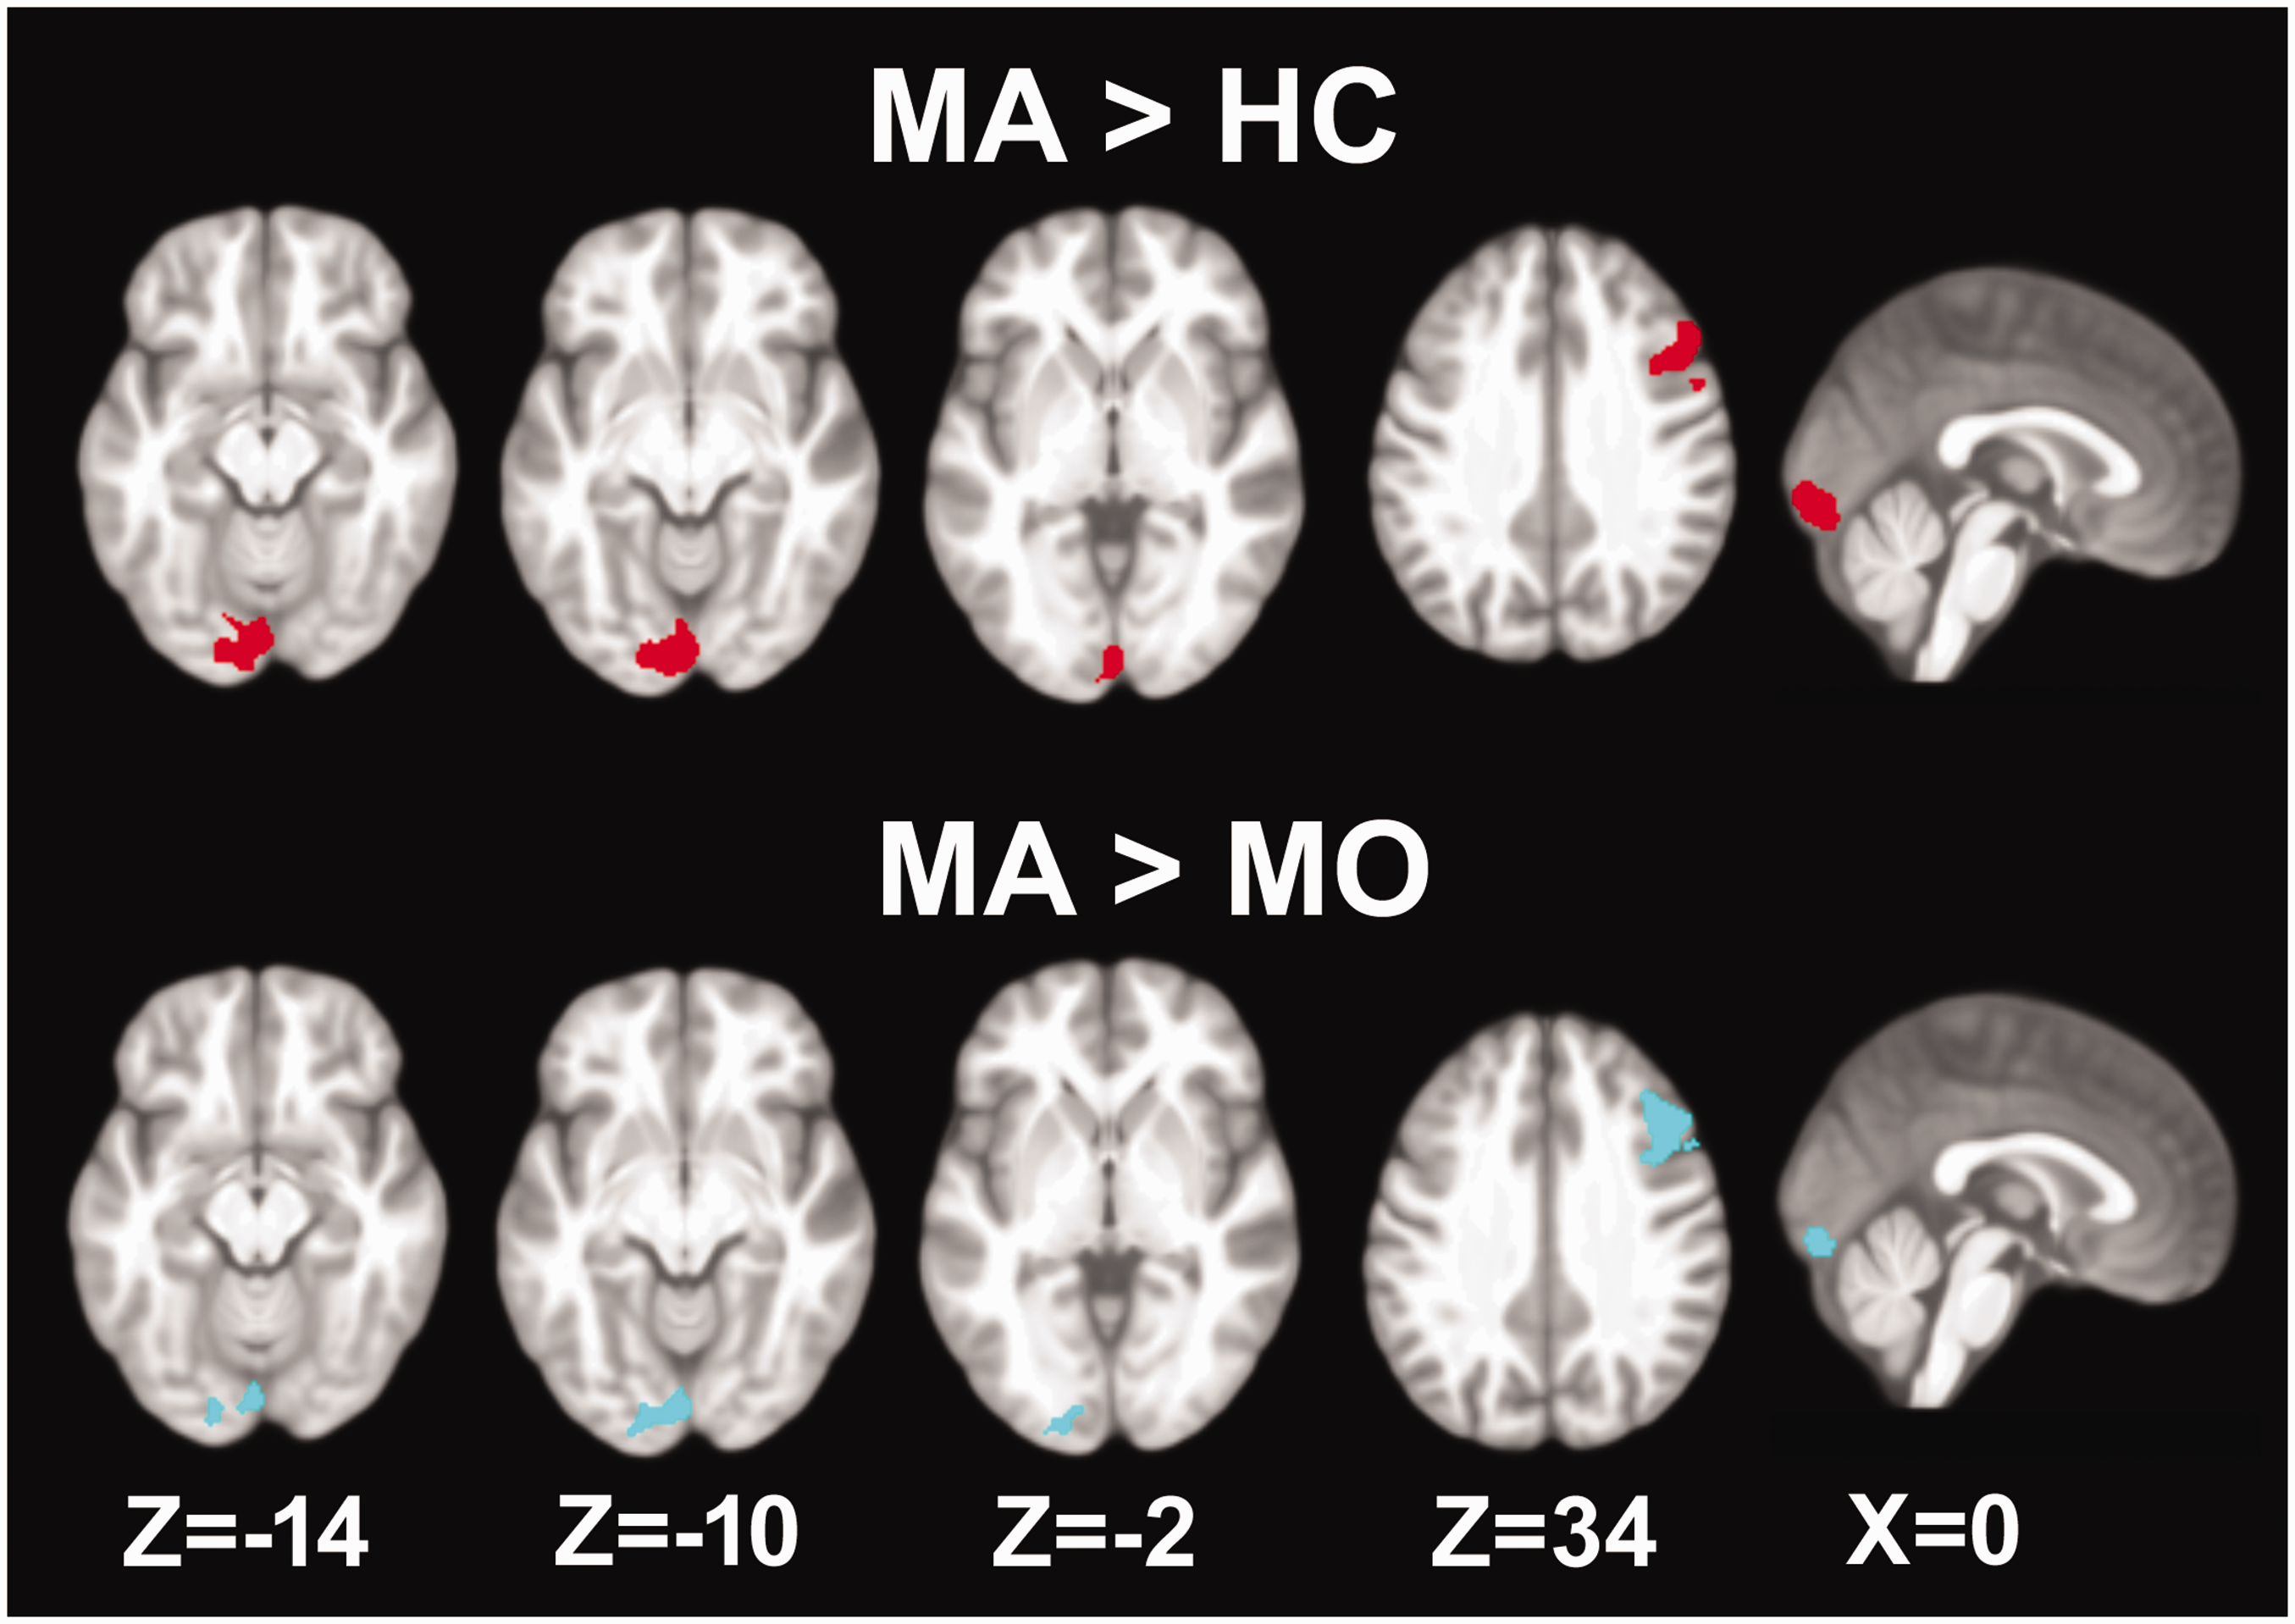
Mass-univariate voxel-based morphometry comparing grey matter volume. Upper: Migraine with visual aura (MA) and healthy controls (HC). Lower: Migraine with visual aura and migraine without aura (MO). For each comparison, increased grey matter volume was found in the medial visual cortex and in the middle frontal cortex. Maps were thresholded at a voxel-wise p < 0.001 and cluster-wise P < 0.05, corrected for family-wise errors. Z, MNI coordinate in the dorsal-ventral direction.
Univariate analyses of functional connectivity
Pairwise group comparisons of functional connectivity for the five component maps did not result in any significant findings. The seed-based analysis, using the left medial visual cortex as a seed point, resulted in reduced functional connectivity to widespread areas in cortical, cerebellar and brainstem areas in MA patients compared to HCs (Figure 6A and Table 2). Significant differences were not found when comparing MA with MO or MO with HC. To further investigate whether the regions exhibiting reduced connectivity in MA were specific to MA or shared with MO, an explorative conjunction analysis was performed in which the thresholds were lowered (uncorrected voxel-wise p < 0.005 followed by a cluster extent threshold of 50 voxels). Results from MA vs. HC were converted into a binary mask and applied to the results of MA vs. MO and MO vs. HC. This analysis suggests that the reduced functional connectivity to the middle cingulate, parts of the brainstem, the right inferior temporal gyrus and the left superior frontal gyrus were specific to MA (Figure 6B and Table 2). Most of the remaining regions were shared with MO (Figure 6C and Table 2).
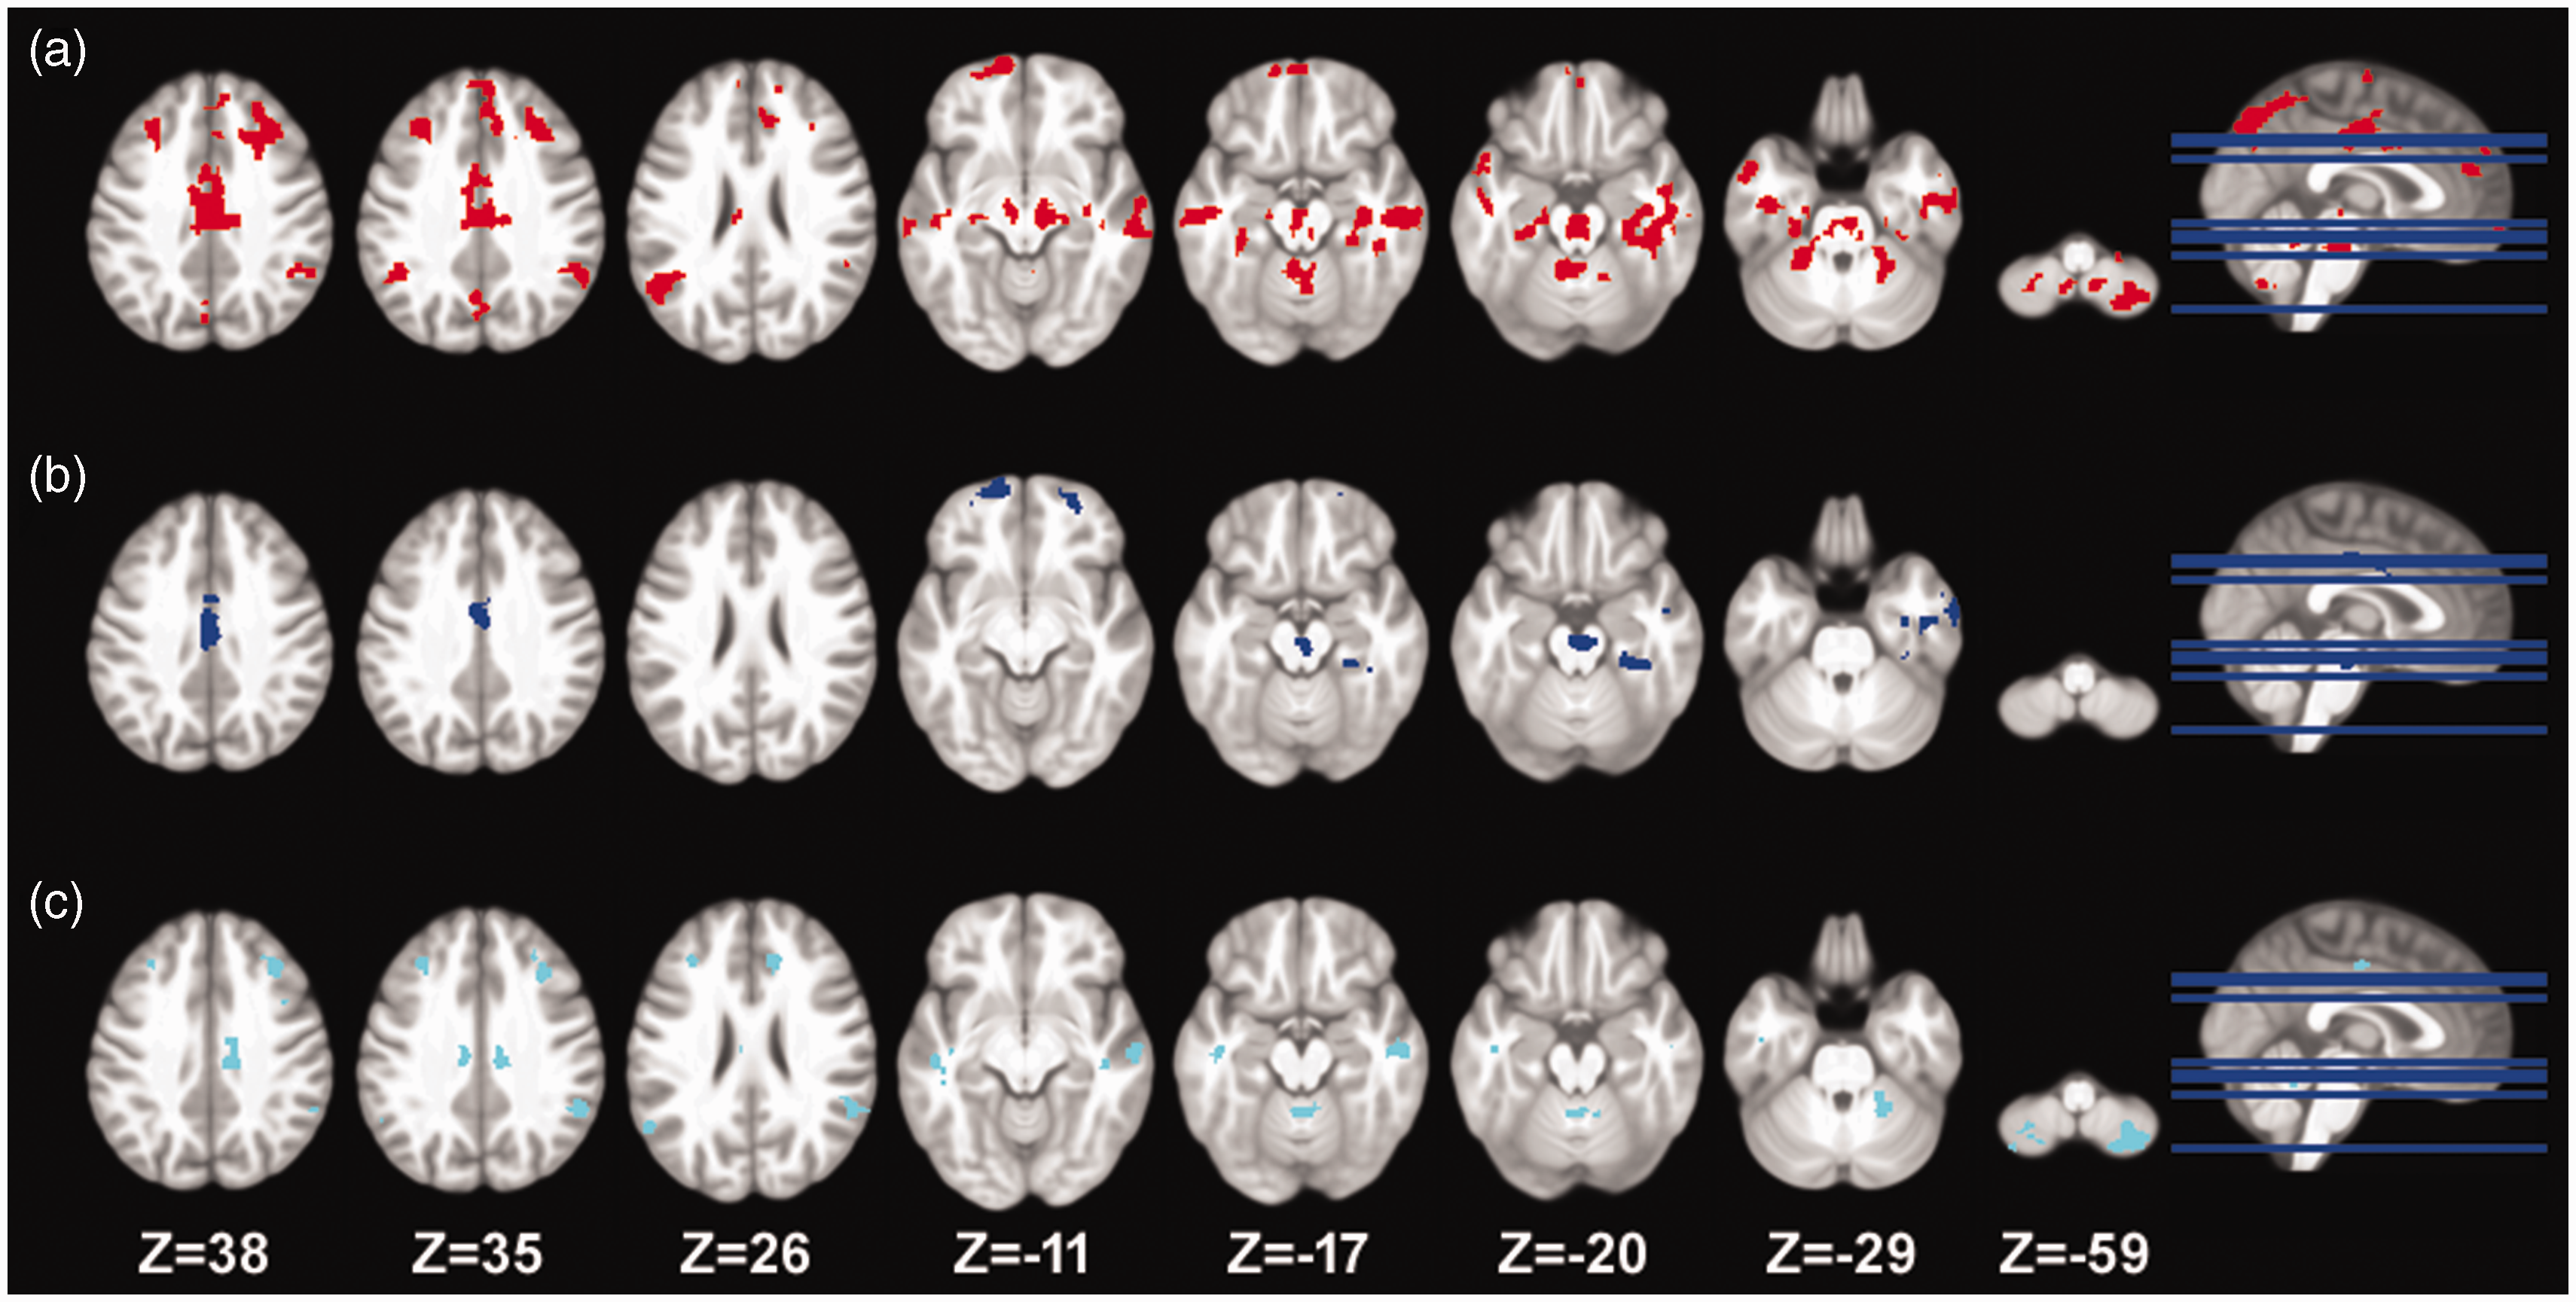
Seed-based functional connectivity analysis with the seed-point placed in the left medial visual cortex. (a) Reduced functional connectivity was found to widespread areas when comparing migraine with visual aura with healthy controls. The other group comparisons did not result in any significant differences. An explorative conjunction analysis was performed using a lowered threshold (voxel-wise p < 0.005 and cluster extent >50 voxels). At this threshold (b) regions specific to migraine with visual aura were identified and (c) regions shared with migraine without aura were identified; (b) and (c) should be interpreted with caution. Note that, as a result of the lowered thresholds in (b) and (c), some clusters appear not to overlap with (a) in which a higher threshold was used. The coordinate of the slices is in Montreal Neurological Institute space and is given in millimeters.
Regions with decreased functional connectivity to the left medial visual cortex ([x y z]=[–6 –88 –9]) in patients with migraine with aura compared to healthy controls.

Statistical maps were thresholded at an uncorrected voxel level of p < 0.001 and a cluster threshold corrected for family-wise errors (FWE).
*Overlap with conjunction analysis with migraine without aura larger than migraine with aura (uncorrected voxel-wise p < 0.005 and cluster extent = 50 voxels).
**Overlap with conjunction analysis with healthy controls larger than migraine without aura (uncorrected voxel-wise p < 0.005 and cluster extent = 50 voxels).
G, gyrus; L, left hemisphere; R, right hemisphere. Coordinates are provided in standard Montreal Neurological Institute (MNI) space and are in millimeters.
Discussion
The present study addressed whether multivariate pattern classification and mass-univariate voxel-based morphometry analyses could be used to distinguish MA from HC and MO. The major findings were: (i) a multivariate pattern of grey matter voxels within a functionally defined ventral medial visual network contained significant information related to the diagnosis of MA; (ii) adding white matter in the classification models did not substantially alter the results; (iii) MA patients had increased grey matter volume in the left medial occipital cortex and the right middle and inferior frontal gyri compared to the two other groups; and (iv) functional connectivity between the left medial occipital cortex and numerous wide-spread cortical and subcortical regions was reduced in MA patients compared with HC, but not MO.
The five visual networks
Multivariate patterns of grey matter structure were examined within masks encompassing five functionally defined visual networks. Of these, one network covered ventral-lateral visual areas (Lateral 1) mainly in the occipital pole and corresponded to the occipital visual network (18). The second network (Lateral 2) covered predominantly peristriate areas, including the inferior and superior lateral occipital cortex and the fusiform gyrus. This network corresponded to the lateral visual network (18,19). The remaining three networks covered the anterior (Medial 1) and the posterior dorsal (Medial 2) and ventral (Medial 3) portions of striate and parastriate areas. Together, these three subnetworks constitute the medial visual network (18,19). The division into subnetworks is typically observed when a relatively large number of components is estimated as in the present study.
Multivariate analyses
Using voxel-wise multivariate pattern classification we were able to differentiate between MA patients and HC, as well as MO patients, based on grey matter within the Medial 3 and extended Medial 3* masks, respectively. Moreover, grey matter within the extended Medial 1* mask could also differentiate between MA patients and the two other groups, albeit with reduced classification accuracy. That both the extended Medial 1* and 3* masks resulted in significant predictions may be a result of their spatial overlap. The improved result when using the larger Medial 3* mask for pairwise classification of the two patient groups suggests that additional information was needed to differentiate between the two. This is a reasonable observation considering the phenotypic similarity of the two groups.
In general, the medial visual network has been linked to the processing of simple visual stimuli, both static and moving, and responds to flashing checkerboard stimuli (18). Congruent with this, common symptoms associated with visual aura include low-level features such as a single area of bright light, phosphenes, scotoma and jagged lines. Symptoms may also have scintillating or flickering qualities (20). The division into medial subnetworks may reflect the mapping of visual fields onto the cortex (21). For eccentricity maps, foveal and peripheral stimuli are represented posteriorly and anteriorly in the visual cortex, respectively. By contrast, for polar angle maps, the upper visual fields are represented ventrally and the lower visual fields are represented dorsally. The Medial 3 masks thus cover regions processing inputs from the foveal and/or dorsal visual fields and the Medial 1 masks cover regions processing inputs from the peripheral visual fields. Although aura progression from the foveal representation of the visual field to the peripheral representation has been described previously (3), the exact location of aura symptoms can differ from person to person. Interestingly, none of the lateral feature masks could significantly classify aura patients. The areas included in these masks are involved in higher-level visual processing, which are not typically associated with visual auras (18,20). Our results were not substantially altered by mixing the composition of the control group or by adding white matter images in the multivariate analyses. The latter is congruent with previous observations, which indicates that multi-kernel models, including the same or similar imaging modalities, yield results that are comparable to the best outcomes achieved by single kernel models (16). Overall, our results suggest that our models are specific to the diagnosis of MA because we did not obtain significant results when attempting pairwise classification of MO and HC. Furthermore, our models were able to successfully classify MA patients, despite their relatively low disease burden, as indexed by headache frequency, as well as the absence of symptoms during scanning.
Univariate analyses
In the conventional voxel-based morphometry analysis, increased grey matter volume was observed in two brain regions when comparing MA patients with the other two groups. The two clusters were located in the left medial occipital cortex and the right middle frontal gyrus extending to the inferior frontal gyrus. The former cluster was located entirely within the larger Medial 3* mask. Despite the considerable number of studies investigating grey matter volume in MA patients (10), no other studies have reported similar findings as ours, including another well-powered study (22). However, the variability in results may not only be attributed to differences in study size but also to patient heterogeneity, such as aura phenotype and disease load (duration and frequency). It is possible that pure visual aura and visual aura combined with other aura symptoms may involve different brain reorganization. In the present study, we have attempted to mitigate some of these limitations by employing a balanced design at the same time as controlling for a range of demographic and clinical characteristics. Interestingly, several studies have reported increased cortical thickness within the occipital lobe in MA patients (4–6,8). It has been suggested that a thicker visual cortex may be an inherent trait in MA patients (4–6,8). This is congruent with the absence in our study of a relationship between clinical features and grey matter density in the medial visual cortex. It is noteworthy that we only examined a limited number of clinical features and that volume and surface-based measures do not necessarily represent the same underlying mechanisms. Despite the variability in results observed in previous studies, our multivariate and univariate analyses consistently demonstrated changes in the medial visual cortex in MA patients. These changes were evident when comparing MA to both HC and MO. The consistent findings in the present study suggest that the medial visual cortex may play a significant role in the pathophysiology of visual aura.
The locus in the medial visual cortex exhibiting increased grey matter volume also exhibited decreased functional connectivity to several cortical and subcortical areas when comparing MA with HC. Overlaying our results with the network masks described in Yeo et al. (23) revealed that most of the cortical areas fell within the default mode network. Because activity of this network is known to decrease in face of external stimuli (24), our results may in part represent a response to an overactive medial visual cortex. This is also congruent with the notion of experience-dependent increases in grey matter volume (25). In the same vein, reduced connectivity to brainstem regions, including the red nucleus and substantia nigra, may also result from the repetitive aura attacks as these structures have been associated with evoked auras (26,27).
Limitations
A number of limitations need to be taken into consideration. First, our classification models did not obtain a high enough classification accuracy for them to be clinically meaningful in and of themselves. However, the grey-matter features identified in our study may be used in future multimodal imaging-based classifications of MA. Cross-modal models in which, for example, grey matter and resting-state functional connectivity maps are included may obtain better classification accuracy (16,28–30). Although grey matter has been proposed to yield the highest accuracy when it comes to single-modality models (30), the specific contributions of the two modalities likely depend on how the features are delineated (e.g. atlas-based versus migraine specific networks) (29,30). Second, we did not include patients with occipital lobe epilepsy or transient ischemic attacks. The addition of such patients would increase the clinical value of the classification models. Third, because we did not include external validation in our study, it is important to consider the possibility that our predictions may be overly optimistic. It is possible that the performance estimates of the models will be lower when they are applied to future samples. External validation is crucial to assess the generalizability and reliability of the model's performance in real-world scenarios. Fourth, because the patient populations included in the present study had low-frequency migraine, it remains uncertain whether our results can be generalized to patients with high-frequency migraine attacks. However, it is reasonable to assume that an increased disease burden may yield similar or even improved results (31). Further research and validation involving patients with high-frequency migraine attacks would be necessary to confirm this assumption.
Clinical implications
The visual cortices are involved in the generation of visual aura and exhibit altered grey matter structure and functional connectivity. A multivariate pattern of grey matter voxels within a functionally defined ventral medial visual network contains significant information related to the diagnosis of migraine with visual aura. Migraine patients with visual aura have increased grey matter volume in the left medial visual cortex compared to control groups.
Supplemental Material
sj-pdf-1-cep-10.1177_03331024231222637 - Supplemental material for Grey matter structure within the visual networks in migraine with aura: multivariate and univariate analyses
Supplemental material, sj-pdf-1-cep-10.1177_03331024231222637 for Grey matter structure within the visual networks in migraine with aura: multivariate and univariate analyses by David M. Niddam, Kuan-Lin Lai, Yi-Ting Hsiao, Yen-Feng Wang and Shuu-Jiun Wang in Cephalalgia
Footnotes
Acknowledgements
This work was supported by grants from the Ministry of Science and Technology and National Science and Technology Council (111-2314-B-A49-075-MY2; 111-2314-B-A49-069-MY3; 111-2321-B-A49-011; 112-2321-B-075-007), the Brain Research Center, National Yang Ming Chiao Tung University and the Ministry of Education, Aim for the Top University Plan.
Declaration of conflicting interests
The authors declare the following potential conflicts of interest with respect to the research, authorship, and/or publication of this article: DMN, KLL, YTH and YFW report no disclosures. SJW has served on the advisory boards of Allergan, and Eli Lilly Taiwan. He has received speaking honoraria from the Taiwan branches of Pfizer, Elli Lilly and GSK and has received research grants from the Taiwan National Science and Technology Council, Taipei-Veterans General Hospital and Taiwan Headache Society.
Supplemental material
Supplemental material for this article is available online.
References
Supplementary Material
Please find the following supplemental material available below.
For Open Access articles published under a Creative Commons License, all supplemental material carries the same license as the article it is associated with.
For non-Open Access articles published, all supplemental material carries a non-exclusive license, and permission requests for re-use of supplemental material or any part of supplemental material shall be sent directly to the copyright owner as specified in the copyright notice associated with the article.