
Abstract
Background
Migraine is a common primary headache disorder with a significant genetic component influencing its pathophysiology, in which the trigeminal system plays a central role. The spontaneous trigeminal allodynia (STA) inbred rat strain is a validated migraine model that exhibits a chronic cephalic hypersensitive phenotype, responsive to specific migraine treatments. The heritable STA trait presents a unique opportunity to dissect the genetic component of migraine.
Methods
STA rats were backcrossed twice with wild-type (WT) Sprague–Dawley (SD) rats and whole-genome sequencing was performed on 47 rats exhibiting either the STA or WT phenotype. mRNA and protein expression analyses were conducted in the trigeminovascular system of both rats and humans. Based on data from the STA rats, we performed an F-SKAT (i.e. sequence kernel association test for family data) analysis to investigate a potential link between families with clustering of migraine and our findings from the STA rats.
Results
Sequencing of STA rats revealed a risk locus near the gene for adhesion G protein-coupled receptor L3 (Adgrl3). In humans, the ADGRL3 gene showed an increased burden of rare variants segregating with migraine in families with a clustering of the condition (p = 0.046). We found similar associations between migraine and the ADGRL3 when expanding the analyses to a genome-wide analysis including rare variants from more than one million individuals with migraine. Expression analyses of rat and human tissues confirmed that Adgrl3 is expressed in the migraine-associated trigeminovascular system.
Conclusions
In this translational study, ADGRL3 was associated with both cephalic hypersensitivity in STA rats and an increased burden of rare variants in humans with migraine. The gene was expressed in the trigeminovascular system, a central pathophysiological component of cephalic pain. ADGRL3 provides novel insights into the pathophysiology of chronic cephalic pain in migraine.
This is a visual representation of the abstract.
Introduction
Migraine is a prevalent neurological disorder characterized by recurring episodes of severe headaches that affect approximately one billion people worldwide (1). The spontaneous trigeminal allodynia (STA) inbred rat strain represents a unique opportunity to investigate the genetic component of migraine. The STA rat was initially described with an episodic migraine-like behavioral phenotype, exhibiting characteristics such as spontaneous allodynia in the trigeminal area, sensitivity to sound, increased sensitivity to both migraine triggering compounds and response to known acute and preventive migraine therapeutics during periods with hypersensitivity (2). Later generations have developed a chronic cephalic hypersensitivity, which can be reversed with migraine-specific treatments such as olcegepant and sumatriptan, as well as the ATP sensitive potassium channel blocker glibenclamide (3,4).
Heritability factors in migraine are significant (5–7) and twin studies estimate heritability to be 40–50% (8). Genome-wide association studies (GWAS) of migraine reveal a complex and polygenic background. GWAS results show that both common and rare variants are associated with migraine, with some risk variants being specific to migraine with or without aura (9,10). While most migraines are polygenic, some cases are the result of a combination of a few genetic variants with moderate effects, or a single variant with a significant functional impact, similar to monogenic migraines (11,12). In these rare conditions, a mutation in a single gene can cause the disease with nearly complete penetrance. A well-known example of monogenic migraine is familial hemiplegic migraine, which follows an autosomal dominant inheritance pattern (13). Studies have identified mutations in genes involved in neuronal or vascular functions that contribute to both migraine and allodynia (11,14,15). An example is the TRPM8 genetic variant linked to chronic migraine and allodynia, suggesting a shared genetic basis for these conditions (15). Understanding these genetic connections aids in identifying potential therapeutic targets and enhancing treatment strategies for patients with both migraine and allodynia. However, despite these advancements, much of the heritability of migraine remains unexplained, highlighting the need for new discovery paradigms.
Based on the inheritance patterns of STA rats shown by Oshinsky et al. (2) and our previously published data (3), we hypothesized that the STA phenotype is a dominant monogenic trait that might be of relevance for human health. Therefore, in the present study, we aimed to identify the genetic variants associated with the STA phenotype in rats, as well as understand whether such variants might be translatable to families with established clustering of migraine.
Methods
Animal studies
In total, 138 rats were used in the study. The STA rats were derived from a single breeding pair originally sourced from the Thomas Jefferson University under license (14) and subsequently bred in-house. Wild-type SD rats were obtained from Taconic Bioscience (Ejby, Denmark), Charles River (Sulzfeld, Germany) or were bred in-house. All rats were group housed in Tecniplast 1354G Eurostandard type IV polycarbonate cages (length × width × height: 60 × 38 × 20 cm; Brogaarden, Karise, Denmark) under a 12:12 hour light/dark photocycle with lights on at 04.00 h. Bedding consisted of Enviro-Dri nesting material (Brogaarden). Standard rat chow (Altromin; Brogaarden) and tap water were available ad libitum in the animals’ home cage environment. The cages were also equipped with opaque red polycarbonate shelters (20 × 11.5 × 16 cm and 15 × 9 × 9 cm, respectively), an aspen biting stick (10 × 2 × 2 cm; Tapvei, Paekna, Estonia) and a piece of hemp rope suspended from the cage lid for retreat and enrichment purposes. Humidity ranged from 45–65%. Experiments were approved by the Danish Animal Experiments Inspectorate in accordance with the relevant guidelines and regulations (approval number 2014-15-0201-00256 and 2019-15-0201-00378).
Measurement of periorbital thresholds
To measure the sensitivity of the frontal region of the head (V1 ophthalmic trigeminal dermatome), a static mechanical stimulation was performed using an electronic von Frey device fitted with a rigid plastic tip (IITC LifeScience Inc., Woodland Hills, CA, USA). The rat was gently restrained with a cotton towel in the lap of the investigator. The rat was held in a prone position with its head and neck region left exposed and unrestricted. The tip of the von Frey device was applied to the right periorbital area above the eye, avoiding the soft tissue around the eye. An increasing weight as a surrogate of force was then applied, which was not allowed to exceed a value of 500 g. Notably, this threshold was only approached in a very limited number of instances in F2 rats, as shown in Figure 1 and no tissue damage was ever observed. The stimulus was continually applied until the rat displayed a reflex nociceptive behavior by withdrawing its head, laterally rotated its head and/or vocalizing as an indication of pain and/or discomfort. The process was then repeated over the midline, the left periorbital area and then the right periorbital area above the eye. The average of the latter three measurements was considered the withdrawal threshold (g). If a stimulus had to be reapplied due to inappropriate application, the probe tip was carefully positioned at a different location within the measurement area to avoid targeting the same spot. The investigator performing the procedure was blinded with respect to genotype and typically the procedure took approximately 2 min to perform.
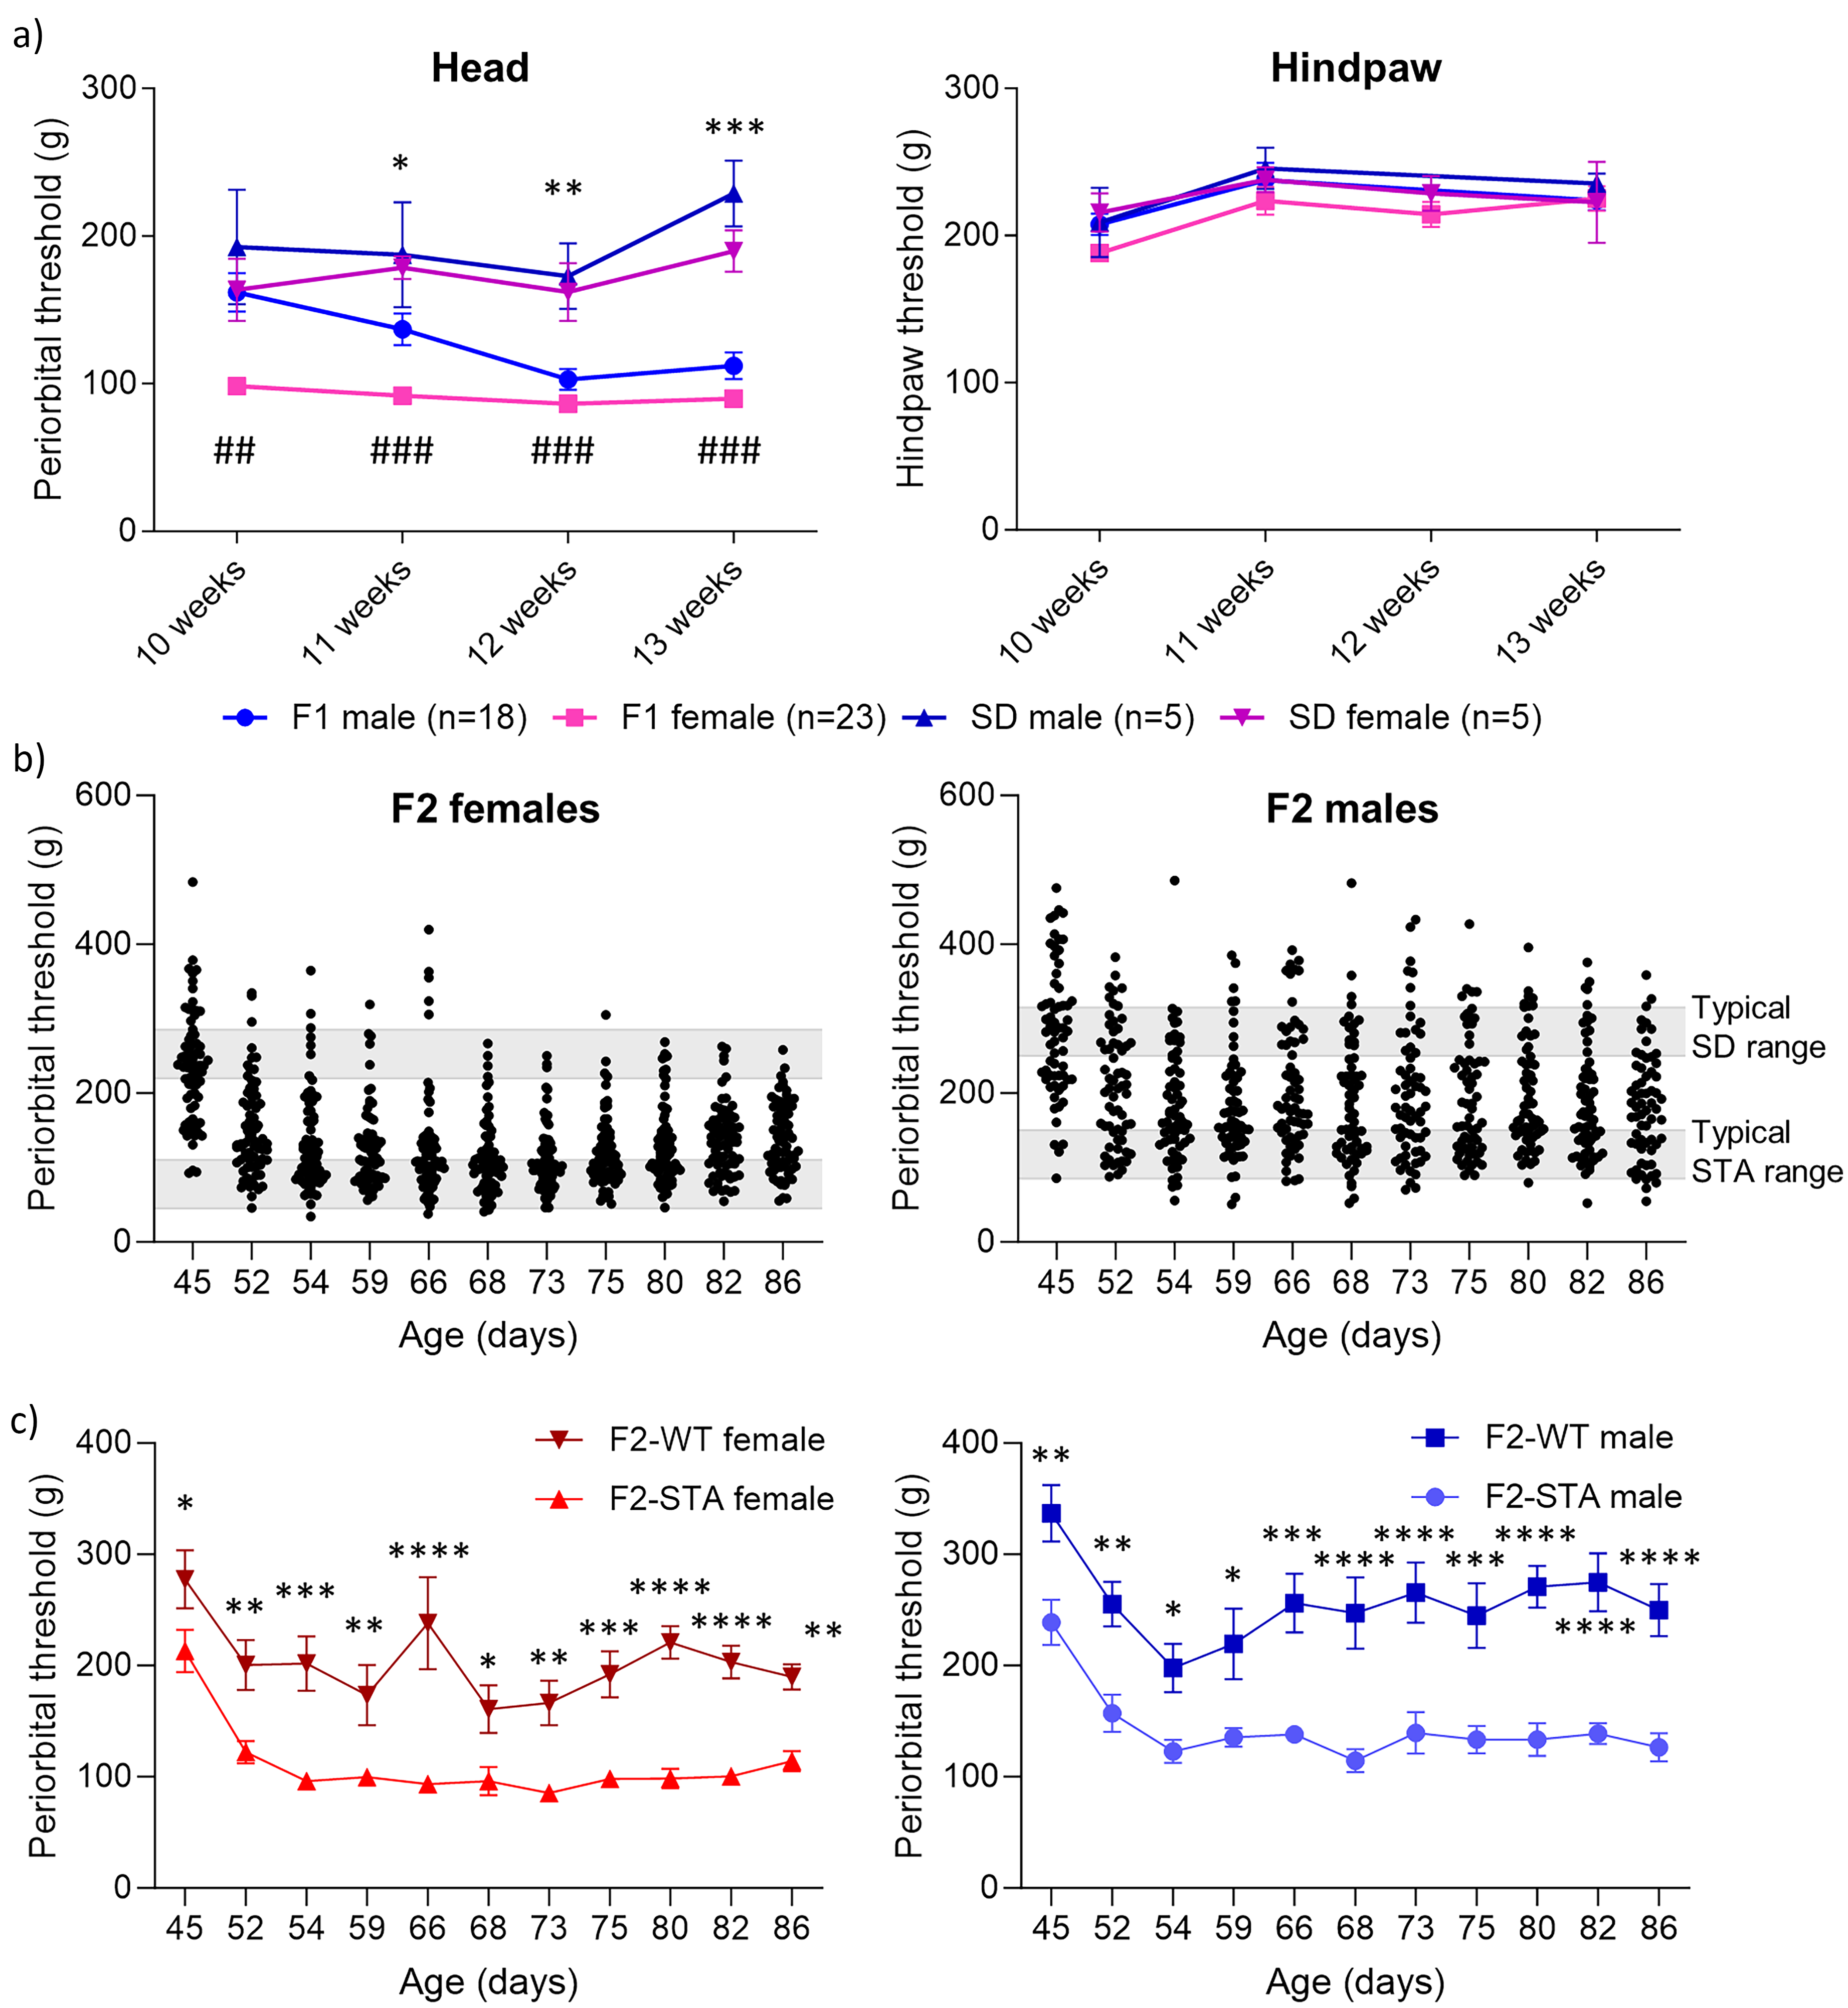
Hypersensitivity in the F1 and F2 generations. (a) The periorbital threshold was measured in all F1 animals, and a significant difference was observed between F1-female (n = 23) and SD female as indicated with a hash symbol (#), and for F1-male (n = 18) and SD male, as indicated with an asterisk (*). Hypersensitivity was not observed in the hindpaw. (b) Hypersensitivity was assessed in all F2 offspring. An automated von Frey device was used to measure cephalic sensitivity. Periorbital thresholds in F2 females (nTotal = 69) and periorbital thresholds in F2 males (nTotal = 69). The gray bars represent the typical periorbital threshold range for STA and SD rats. Three phenotypes were identified: 32 hypersensitive rats (16 female and 16 male), 19 hyposensitive rats (nine female and 10 male) and 87 rats with intermediate sensitivity. (c) Periorbital thresholds for F2-STA and F2-WT females and males. Data represent the mean ± SEM. Statistical significance was tested using repeated-measure mixed model and Sidak's post hoc comparison between groups and timepoints: *P < 0.05, **P < 0.01, ***P < 0.001, ****P < 0.0001 and #P < 0.05, ##P < 0.01, ###P < 0.001.
Breeding strategy
To understand the mutation behind the STA Sprague–Dawley (SD) phenotype, three pairs of STA males with wild-type (WT) SD females were mated (Figure 2). This breeding resulted in 18 male and 23 female F1 pups. The periorbital thresholds were measured once a week from the age of five weeks to the age of 13 weeks to help identify putative STA rats with low periorbital thresholds, which would be used for future breeding purposes. The SD control male and female mates were tested once a week from the age of 10 weeks to the age of 13 weeks. Five STA males and five STA females from the F1 generation were paired with five SD females and five SD males, together representing ten breeding pairs. This breeding resulted in 138 F2 generation pups. The periorbital thresholds of the entire F2 generation were measured 21 times over 13 weeks. The periorbital threshold values defining F2-STA and F2-WT groups were based on previously published data (3).
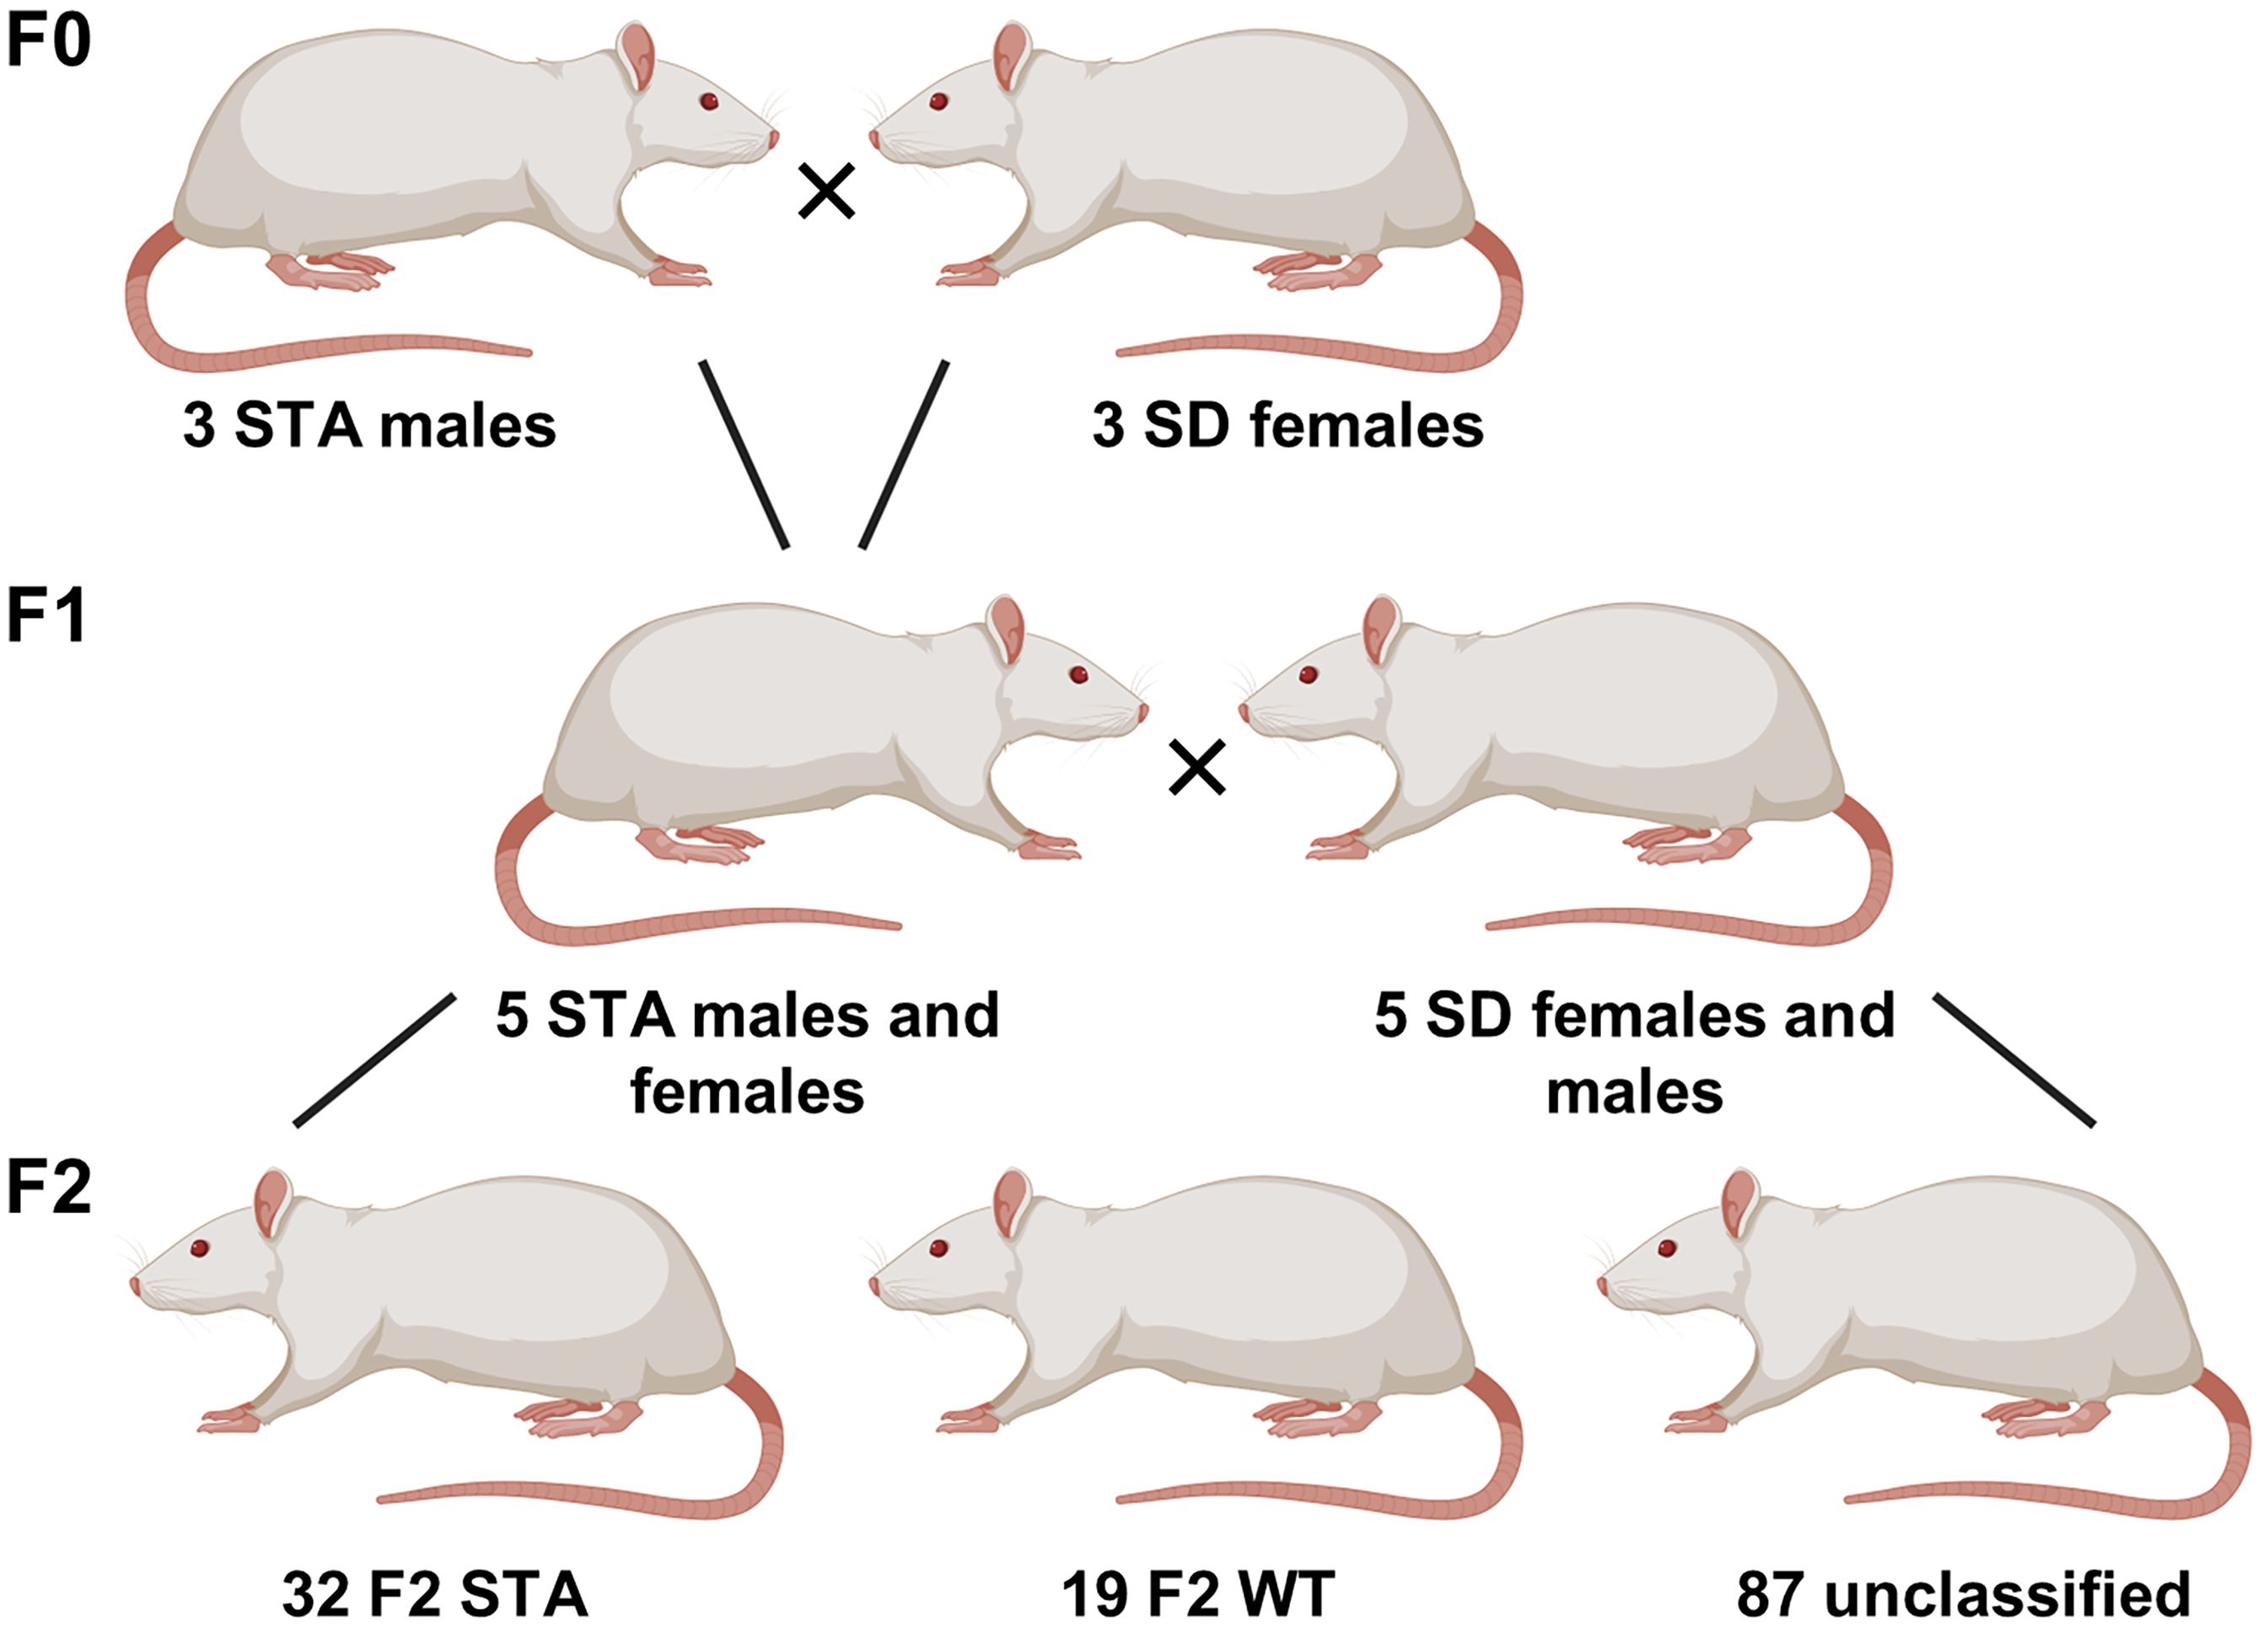
A schematic overview of the breeding program used to establish the outbred F2-STA to investigate the genomic differences. Five F1 STA males and five F1 STA females were mated with the respective WT SD mates, resulting in a total of 10 breeding pairs. This breeding program produced 138 F2 pups with three different phenotypes: F2-STA, F2-WT and unclassified (intermediate phenotype).
Whole genome sequencing of STA and WT rats
DNA from 51 rats (32 STA and 19 WT) was extracted from tail biopsies (10 mg) using a NucleoSpin Tissue XS kit (Macherey-Nagel, Dueren, Germany) in accordance with the manufacturer’s instructions. The quantity of the extracted DNA was assessed using a Qubit 2.0 Fluorometer (Thermo Fisher Scientific, Waltham, MA, USA) and the DNA was fragmented using a Covaris instrument (Covaris, Woburn, MA, USA). The quality was again analyzed with an Agilent 2100 Bioanalyzer (Agilent, Santa Clara, CA, USA) after fragmentation and the expected peak size was 200–400 bp. End repair and adenylation of the fragmented DNA and barcode adaptor were performed using a Nextflex End Repair & Adenylation kit (PerkinElmer, Ballerup, Denmark) and a Nextflex DNA Barcodes Adaptor kit (PerkinElmer) in accordance with the manufacturer’s instructions. PCR amplifications were cleaned using the AmPure XP Clean XP beads (Beckman Coulter, Indiana, USA). The DNA concentrations were measured on a NanoDrop™ 2000 Spectrophotometer (Thermo Fisher Scientific) and the quality was assessed with the Agilent 2100 Bioanalyzer system (Agilent). The DNA was loaded on a flow cell. Each sample was sequenced to 9–90× (median 43×) by BGI Genomics (Shenzhen, China). Four tail biopsy DNA samples were not sequenced due to flow cell loading issues. The successfully sequenced samples were distributed by phenotype and sex as follows: WT females, n = 9; WT males, n = 10; STA females, n = 15; and STA males, n = 13.
Genotype calling
All short reads were mapped to the rat genome (Rnor_6.0, http://uswest.ensembl.org/Rattus_norvegicus/Info/Index) using BWA (version 0.7.13-r1126) with default settings. PCR duplicates in the mapped bam files were removed using “samtools rmdup” with SAMTools (version 1.3). Different libraries from the same individual were then merged using “samtools merge”. The reads in the merged bam files were remapped at the gap region using GATK (version 3.5). Genotypes were called using “samtools mpileup”. Low quality alignments and bases were masked using the “-Q30 -Q20” arguments. To obtain a high-quality single nucleotide polymorphism (SNP) dataset, the variant dataset was filtered by removing low quality sites (quality score < 30), sites with a minor allele frequency smaller than 5% and SNPs in regions with an unusual total read depth (combined depth smaller than 400 or greater than 5000). Futhermore, the genotype calls with a genotype quality Phred score smaller than 20 were masked for each individual and then further filtering on the variant datasets were performed by removing sites where more than 20% of individuals had missing data. This was followed by imputing the genotype dataset with Beagle (version r1399).
Genotype–phenotype associations in the F2 population
The 47 sequenced STA (n = 28) and WT F2 (n = 19) rats were used to test for an association between genotype and phenotype. Based on the inheritance patterns of STA rats shown by Oshinsky et al. (2), our previously published data (3) and present breeding (Figure 2), we hypothesized that the STA phenotype is a dominant monogenic trait. According to this hypothesis, all sites in which more than three phenotypically WT individuals were heterozygous or homozygous for the alternative allele (Aa or AA) were removed, retaining 277,880 variants. Differences in allele frequencies between WT and STA individuals for each SNP were tested using a standard chi-squared test in a two-by-two contingency table, where heterozygotes and homozygotes for the STA allele were combined into one category. This design was chosen to maximize the mapping power under the assumption of a dominant mutation.
Human studies
Cohort
In total, 155 families with a clustering of migraines were recruited. The families consisted of 1040 individuals, including 746 individuals with migraines and 294 with no history of migraine. Initially, a proband from each family was recruited at the Danish Headache Center, Rigshospitalet-Glostrup, Denmark, and, subsequently, the remaining family members were recruited. All individuals were assessed by a neurologist, or a senior medical student trained in headache diagnostics, using a validated semi-structured interview (16,17). The interview was designed according to the International Classification of Headache Disorders, 3rd edition (ICHD-3) (18) by the head of the classification committee (Professor Jes Olesen) to derive the correct diagnosis. The study was approved by the National Committee on Health Research Ethics (file no. H-2-2010-122) and reported to the data protection agency. Written informed consent was obtained from all participants.
Whole genome sequencing
Genomic DNA was extracted from whole blood, and whole genome sequencing was performed in collaboration with deCODE genetics, as described in detail by Jónsson et al (19).
F-SKAT
A sequence kernel association test for family data (F-SKAT) (20) using only rare genetic variants (minor allele frequency (MAF) < 5%) from whole genome sequencing data was performed to analyze the associations in families, with corrections for gender and age. F-SKAT is valuable for identifying genes where multiple variants can lead to the same phenotype, but statistical comparison is not possible if a gene contains relatively few variants. The threshold for performing burden analysis is N rare variants < 2.
Rare functional variants in ADGRL3
Bioconductor, version 3.19 (BiocManager 1.30.23), R 4.4.1 (R Foundation, Vienna, Austria) and scores from cadd.v1.6.hg38 in R were used to identify rare variants associated with migraine and with a CADD-scores above 20 at www.decode.com/summarydata using the data summary of Björnsdottir et al. (10).
Human tissue
In collaboration with The Body Donation Programme, University of Copenhagen, the trigeminal ganglion (TG), middle meningeal arteries (MMA), middle cerebral arteries (MCA) and a general pool of cerebral blood vessels (CBV) were dissected from the corpses of two elderly women <48 hours after death. All tissues were placed in ice-cold phosphate-buffered saline and transported to the laboratory for further handling and storage.
RNA extraction and real-time qPCR
mRNA from frozen trigeminal nucleus caudalis (TNC), TG, CVB and dura mater from F2-STA and F2-WT rats and human samples were extracted using TRIzol™ Reagent (Thermo Fisher Scientific). The tissue samples were disrupted and homogenized using the FastPrep-24 5G Instrument (MP Biomedicals, Irvine, CA, USA). After purification, the quality of the RNA was measured on a NanoDrop™ 2000 Spectrophotometer (Thermo Fisher Scientific). cDNA synthesis was performed using the iScript™ cDNA Synthesis kit (Bio-Rad, Copenhagen, Denmark) and 500 ng of total RNA was used. The level of Adgrl3 mRNA was investigated using real-time quantitative PCR (RT-qPCR). cDNA was mixed with SYBR Green I dye chemistry (SensiFASTTM SYBRVR NO-ROX kit; Bioline, Memphis, TN, USA), forward (5′-ACC CCA TTG AGC TAC GCT GT-3′) and reverse primers (5′-ATC TTG TCA TCT GTC CTC CCG-3′). One endogenous reference gene (Hprt1: Forward: 5′-ACC CCA TTG AGC TAC GCT GT-3′ and reverse: 5′-ATC TTG TCA TCT GTC CTC CCG-3′) was used as control. The RT-qPCR reaction was run on a QuantStudio™ 6 Pro (Applied Biosystems, Waltham, MA, USA) using the following program: 95 °C for 120 seconds to activate the polymerase, followed by 40 cycles of denaturation at 95 °C for 5 seconds and annealing/extension at 60 °C for 30 seconds. A melting curve stage was also included: 5 seconds at 95 °C, 30 seconds at 60 °C, and then 5 seconds at 95 °C to validate the measurements.
RNA-sequencing data of human and rat
RNA-sequencing data of the TG was investigated in humans and rats, and from the same rats, TNC was investigated as previously described (21). In short, human TG samples (n = 16) were downloaded from the Sequence Read Archive (SRA) database (PRJNA384203) (22) and TG and TNC of rat samples (n = 12) were present in-house and previously published (23). After quality control of the samples using FastQC (23) and of the reads using NGSQC (24), remaining reads were quantified using kallisto (25) using the reference genomes GRCh38.p12 (human) and Rnor6.0 (rat) and normalized into transcripts per million.
Protein purification and western blot
Frozen TG, TNC, dura mater and CBV tissues from F2-STA and F2-WT rats and the human samples were first grinded on dry ice using a mortar and pestle. Pierce™ RIPA buffer (Thermo Fisher Scientific) containing a cocktail of proteinase inhibitors (PhosStop tablet and complete mini-inhibitor tablet; Roche, Copenhagen, Denmark) was added to the tissue samples. Protein concentrations were determined using the DC protein assay kit II (Bio-Rad). Protein samples were diluted to 30 µg and loaded onto a 4–12% NuPAGE™ Gel (Invitrogen, Carlsbad, CA, USA). After size separation, the proteins were transferred to a polyvinylidene fluoride membrane using the iBlot 2 dry blotting system (Life Technologies, Waltham, MA, USA). The membrane was incubated with the primary antibody Latrophilin-3 (B-6) (sc-393576; Santa Cruz Biotechnology, Heidelberg, Germany) or Anti-ADGRL3 antibody C-terminal (ASJ-9PDDLA-100; Nordic Biosite, Täby, Sweden) and anti-GAPDH (Cell Signaling Technology, Danvers, MA, USA) or anti-HPRT (Abcam, Cambridge, UK) at 4°C overnight. The next day, the membranes were probed with Goat Anti-Rabbit (DAKO, Carpenteria, CA, USA) or Goat Anti-Mouse (DAKO) at room temperature for one hour. The membranes were developed with an ECL™ Prime kit (Merck, Darmstadt, Germany) and visualized using ImageQuant LAS 4000 mini (GE Healthcare, Chicago, IL, USA). The post-translational processing of Adgrl3 results in the cleavage of the protein into a 120-kDa extracellular domain at amino acids 841–842 and an 85-kDa 7-TM C-terminus (26,27). This aligns well with the bands observed in our western blot analyses (see supplementary material, Figures S1 and S2). The utilized antibodies have been validated for their respective applications, ensuring reliable and specific detection of ADGRL3/LPHN3 proteins in the western blot.
Statistical analysis
Periorbital threshold using electronic von Frey and body weight gain are presented and analyzed as the mean ± SEM and data were analyzed with a repeated-measure mixed model with Sidak's post-hoc comparison between groups. mRNA and protein expression data are presented as the mean ± SEM and in each tissue F2-WT was compared with F2-STA and analyzed using an unpaired t-test. For animal experiments, ‘n’ signifies the number for a single animal. Statistical analysis was performed with Prism, version 8–10 (GraphPad Software Inc., San Diego, CA, USA) and the applied statistical test is indicated where appropriate.
Results
The hypersensitive phenotype is driven by a dominant monogenic trait
To investigate the genetics behind the STA phenotype, initially, three pairs of inbred STA males with low periorbital thresholds (<150 g, presumed to have a homozygous genotype at the disease-causing loci and thereafter termed AA) were mated with WT females with high periorbital thresholds (>220 g, presumed not to have the disease-causing loci and thereafter termed aa) (Figure 2). The breeding resulted in 18 male and 23 female F1 pups that were tested once a week for the STA phenotype from the age of five weeks to the age of 13 weeks. All animals in this F1 generation exhibited the STA phenotype with low periorbital hypersensitivity with no hindpaw hypersensitivity (Figure 1a). Mean periorbital threshold values were 112 ± 9 g for the males and 90 ± 5 g for the females at the age of 13 weeks (Figure 1a). Simultaneously with the F1 generation, WT SD rats were tested as controls once a week from the age of 10 weeks to the age of 13 weeks. These WT SD rats were found to have mean threshold values of 229 ± 22 g and 190 ± 14 g for males and females, respectively (Figure 1a), and were subsequently mated with the F1 generation. Together, these data suggest that the STA locus has a dominant trait, with the heterozygous Aa genotype resulting in the STA phenotype.
Five F1-STA (Aa) males and five F1-STA (Aa) females were mated with respective WT (aa) mates. The breeding resulted in 138 F2 generation pups that were predicted to have Aa and aa genotypes, predicting a phenotypic split of 50% STA (Aa) and 50% WT phenotype (aa). Thirty-two (16 female and 16 male) animals were identified as STA phenotype with low periorbital thresholds (<110 g for females and <150 g for males) and 19 animals (nine female and 10 male) as WT with high periorbital thresholds (>220 g for females and >250 g for males). Eighty-seven animals were found to fluctuate too much in their periorbital thresholds to be categorized confidently as either STA or WT and were thus designated as having an intermediate phenotype (Figure 1b and c).
The phenotypic F2-STA and F2-WT rats were terminated at the age of 125 days after a final periorbital testing (see supplementary material, Figure S3a). The weight of the F1 and F2 generations was found to be significantly different between F1-males and STA-males (p = 0.0002). No significant difference was observed between F1-females and STA-females or F2-STA and F2-WT rats (see supplementary material, Figure S3b and c).
Association mapping in an F2 rat population
Genomic DNA was isolated from tail biopsies from the rats of the F2 generation with identified STA and WT phenotypes, and DNA libraries were subsequently prepared for each of the animals. Twenty-eight STA and 19 WT samples were subjected to high-coverage genome sequencing, and 3 to 39× (median 19×) of sequencing data was obtained for each individual. A dataset with 2,437,152 variants across the 20 rat chromosomes, with a genotype missing rate at each site below 10% and an overall genotype missing rate of 2.3%, was obtained after genotype calling. GWAS was then performed on this dataset to map genomic regions associated with the STA phenotype. While none of the tests were significant after Bonferroni correction for multiple tests, the smallest p-values were found on chromosome 14 (peak SNP uncorrected p = 2.9 × 10⁻⁵) and 13 (peak SNP uncorrected p = 3.4 × 10⁻⁴), together with sporadic associated SNPs on other chromosomes (e.g. chr12 (uncorrected p = 3.4 × 10⁻⁵), chr19 (uncorrected p = 3.9 × 10⁻⁴) and chr10 (uncorrected p = 8.9 × 10⁻⁴)) (Figure 3). The SNPs on chromosomes 14 and 13 were clustered in regions near the Adgrl3 and Dnah14 genes, respectively (Table 1).

Manhattan plot of p-values from the genome-wide test of allele frequency differences between F2-STA (n = 28) and F2-WT (n = 19) rats. The p-values were calculated based on a chi- squared test in a two-by-two contingency table. Blue line indicates the critical value after using a Bonferroni correction.
Genome-wide suggestive genetic variants associated with the STA phenotype.

TG and TNC play a critical role in transmitting cephalic pain and hypersensitivity to the cortex. Using online available RNA-sequencing data from rat TG and TNC, it was discovered that the Adgrl3 gene was expressed in these migraine-relevant tissues (mean transcripts per million: 12.69 for rat TG and 21.12 for TNC), while Dnah14 was not detected (see supplementary material, Table S1). This suggests that Dnah14 expression in these tissues is either absent or very low. Overall, these findings indicate that the Adgrl3 gene is the designator for the STA phenotype.
Adgrl3 is differentially expressed in migraine-relevant tissues at the mRNA level
An investigation on whether Adgrl3 was expressed in tissues associated with migraine and allodynia in the F2-STA and F2-WT groups was performed next. mRNA was extracted from TG, TNC, dura mater, and CBV, and gene expression was analyzed by real-time qPCR (Figure 4a). Based on these expression studies, Adgrl3 was upregulated in TG (ntotal = 37, p = 0.009) and CBV (ntotal = 24, p = 0.019) from F2-STA rats compared to F2-WT. The opposite effect was observed in TNC, where Adgrl3 was significantly downregulated in F2-STA TNC compared to F2-WT (ntotal = 39, p = 0.017). No significant difference was observed in the dura mater (ntotal = 26, p = 0.764).

Investigations of Adgrl3 in the F2 generation. (a) mRNA expression of Adgrl3 relative to Hprt in migraine relevant tissues in F2-WT and F2-STA rats. Adgrl3 was significantly upregulated in TG (p = 0.008, F2-WT n = 12, F2-STA n = 25), TNC (p = 0.016, F2-WT n = 13, F2-STA n = 26) and CBV (p = 0.019, F2-WT n = 8, F2-STA n = 16). No significant difference in the dura mater was observed (p = 0.764, F2-WT n = 10, F2-STA n = 16). (b) Protein expression of Adgrl3 in migraine-relevant tissue in F2-WT and F2-STA (TG (F2-WT n = 18, F2-STA n = 18), TNC (F2-WT n = 18, F2-STA n = 18), dura mater (F2-WT n = 9, F2-STA n = 15) and CBV (F2-WT n = 8, F2-STA n = 12)). No significant difference was observed in any of the tissues analyzed. See supplementary Figure S1a–d, for representative western blots for all tissues. Data represent the mean ± SEM. For each tissue, F2-WT was compared to F2-STA, and statistical significance was tested using an unpaired t-test. *P < 0.05, **P < 0.01.
In rats, Adgrl3 is proteolytically cleaved into two subunits, resulting in an extracellular subunit and a seven-transmembrane subunit (28). Protein lysates were analyzed by western blots and a band was observed at approximately 115 kDa in all tissues, corresponding to the extracellular subunit of Adgrl3 (see supplementary material, Figure S1a–d). No differences in Adgrl3 protein expression were identified between the WT and STA, in contrast to the identified changes in mRNA expression levels in tissues collected from TG, TNC, dura mater and CBV, despite using two different antibodies targeting Adgrl3 at the N-terminal and C-terminal (Figure 4b; see also supplementary material, Figures S1 and S2). In summary, Adgrl3 mRNA regulation was found to be altered in F2-STA TG, TNC and CBV compared to F2-WT. The up- or down-regulation was not evident at the protein level.
ADGRL3 is expressed in the trigeminovascular system and is significantly associated with migraine in humans
To assess whether ADGRL3 associates with migraine pathology in humans, its expression in parts of the human trigeminovascular system (TG, MMA, MCA and CBV) was investigated. ADGRL3 was found to be expressed at both mRNA and protein levels in all the analyzed tissues (Figure 5a and b). The ADGRL3 mRNA and protein expression found in TG was further supported by the available mRNA-sequencing data online. DNAH14 expression was only detected at low levels in mRNA-sequencing data online (see supplementary material, Table S1).

ADGRL3/ADGRL3 is expressed in the human trigeminovascular system. (a) mRNA levels of ADGRL3 in human TG (n = 2), MMA (n = 2), MCA (n = 2) and CBV (n = 1) relative to the housekeeping gene. (b) Relative amount of ADGRL3 protein in human TG (n = 2), MMA (n = 2), MCA (n = 2) and CBV (n = 1). Quantified by western blot (see supplementary material, Figure S4).
Next, whether rare variants (MAF < 5%) in the ADGRL3 gene were associated with migraine in humans was investigated. Using F-SKAT-analysis to calculate the disease–variant associations in 155 families with clustering of migraine revealed a significant burden of rare variants in the ADGRL3 gene segregating with migraine within these families (p = 0.046). By contrast, DNAH14 did not harbor enough rare variants (n < 2) in these families to perform a statistically meaningful F-SKAT analysis.
By investigating specifically ADGRL3 in the recent genome wide analyses including rare variants from more than one million individuals on migraine and subtypes, (9) it was discovered that 11 rare gene variants had a CADD-score ≥ 20 and were associated with migraine in general (p < 0.05) (see supplementary material, Table S2). In addition, one of these variants was also associated with migraine with aura (rs775577125, p = 0.027, migraine in general/0.037 migraine with aura) and one variant with migraine without aura (rs982519546, p = 0.016, migraine in general/0.031 migraine without aura).
Discussion
Despite the identification of several genes associated with migraines, these genes only explain a portion of the overall heritability, leaving a significant amount unaccounted for (29). In the present study, a translational approach was adopted using a dominant negative migraine trait in the STA rat model, which led to the possible discovery of a previously unidentified migraine gene: Adgrl3. Interestingly, our human data support that ADGRL3 is involved in migraine pathology, with expression in the trigeminovascular system and an increased burden of rare gene variants that segregate in families, as well as associations with specific variants in the currently largest migraine population study (10).
Based on a double backcrossing with WT rats and subsequent whole genome sequencing of F2-STA and F2-WT rats, two clusters of SNPs located on chromosome 13 (peak SNP p = 3.4 × 10⁻⁴) and 14 (peak SNP p = 2.9 × 10⁻⁵) were identified (Figure 3). The nearest genes to these two SNP clusters were Dnah14 and Adgrl3 at chromosomes 13 and 14, respectively (Table 1). The DNAH14 gene encodes the dynein, axonemal, heavy chain 14 protein (30), which generates force and movement on microtubules by utilizing ATP hydrolysis. In a recent study, variants of DNAH14 were found to be associated with neurodevelopmental disorders (31). The other gene identified from the whole genome sequencing data is the ADGRL3 (LPHN3) gene. ADGRL3 is a member of the small gene family latrophilins coding for three adhesion G protein-coupled receptors (aGPCRs) (32). The latrophilin family is composed of two adhesion protein domains, followed by a hormone-binding domain next to a GPCR autoproteolytic inducing (GAIN) domain. The GAIN domain of ADGRL3 has been shown to dissociate under mechanical forces down to the 1–10 piconewton range (33). Importantly, latrophilins have been shown to modulate the sensitivity of neuronal mechanosensation using different genetically modified model organisms (34–37). In this respect, it is interesting to note that the electronic von Frey method used in this study utilizes mechanical nociception to measure the pain thresholds.
The TG and TNC are part of the trigeminovascular system, which is central to migraine pathophysiology and cephalic pain (29). Based on available RNA-sequencing data from migraine relevant tissues, no expression or very low expression of Dnah14 was found, while Adgrl3 was expressed in TNC and TG from both humans and rats (see supplementary material, Table S1). Accordingly, the ADGRL3 gene and protein were found to be expressed throughout the human trigeminovascular system. Other studies have similarly found ADGRL3 to be expressed in the human brain, (38) including the amygdala, caudate nucleus, cerebellum and cerebral cortex (39), as well as in dorsal root ganglia neurons (40), all of which are associated with pain processing. Moreover, ADGRL3 is also associated with gout pain in humans and in a mouse model (41).
Further establishing the possible role of ADGRL3 in migraine, an increased burden of rare variants (MAF < 5%) was found in the gene significantly segregating with migraine in humans (p = 0.046). Moreover, specific rare and functional variants of ADGRL3 were associated with migraine in the recent GWAS that included more than a million individuals. Hence, it is likely that the phenotype manifested in the STA rat has a human variant through ADGRL3. Intriguingly, migraine has repeatedly been comorbid with attention-deficit/hyperactivity disorder (ADHD) (42–47). The ADGRL3 gene has similarly been associated with increased ADHD susceptibility (48,49) with the Adgrl3 knockout mouse exhibiting a hyperactive phenotype (50). While this link is interesting, analyses of the behavior of the STA rats have not identified any differences compared to WT rats (3).
A particular strength of this study lies in its translational design, which utilizes a dominant negative trait in the STA rat model to identify a previously unrecognized gene associated with migraine in humans, ADGRL3. Despite the variability in periorbital thresholds between F2-STA and F2-WT rats illustrated in Figure 1(b), we consider the behavioral method for determining a STA phenotype to be reliable. However, it could be enhanced by exploring additional behavioral endpoints such as light sensitivity and/or pharmacological sensitivity to migraine-specific drugs such as sumatriptan (3,4,51). A certain limitation is that the precise mechanistic role of ADGRL3/Adgrl3 in migraine and the STA cephalic hypersensitivity phenotype remains to be fully elucidated. The expression of Adgrl3 mRNA was significantly altered in the F2-STA rats compared to the F2-WT rats across the majority of the examined migraine-relevant tissues. However, it was not possible to identify similar alterations at the protein level, despite the use of two different antibodies targeting either the N- or C-terminal region. This observation suggests that the transcriptional changes may be due to several reasons. First, differences in translational efficiency could mean that mRNA is not being converted into protein at the same rate in both groups (52,53). Second, variations in protein stability and degradation rates might result in similar protein levels even with different mRNA levels. (54) Additionally, post-transcriptional regulation, including the influence of microRNAs or RNA-binding proteins, could affect mRNA stability and translation, maintaining consistent protein levels (55). Lastly, cellular feedback mechanisms might adjust protein synthesis rates to maintain homeostasis, counteracting changes in mRNA levels (56). Further studies are required to clarify this inconsistency.
In conclusion, the present study has utilized an unique approach to translate the migraine-like phenotype of STA rats to increased migraine susceptibility in humans, identifying Adgrl3/ADGRL3 as a promising candidate gene that warrants further investigation in the context of migraine pathophysiology.
Article highlights
Adgrl3 may drive the hypersensitive phenotype in STA rats and is expressed in TG, TNC, CBV, and dura mater in rats. Adgrl3 mRNA was upregulated in F2-STA rats in TG and CBV and downregulated in TNC. ADGRL3 is expressed in migraine relevant tissue (TG, MMA, MCA and CBV) in humans. F-SKAT-analysis showed that rare variants with a MAF < 5% in ADGRL3 were significantly associated with migraine in families. Re-assessing ADGRL3 in the recent genome wide analyses of rare variants in migraine and subtypes revealed 14 rare variants associated with migraine (p < 0.05) and with a CADD-score ≥ 20.
Supplemental Material
sj-docx-1-cep-10.1177_03331024251352844 - Supplemental material for Genome sequencing reveals the Adgrl3 (ADGRL3) gene as a possible cause of cephalic hypersensitivity in the STA rat and migraine in humans
Supplemental material, sj-docx-1-cep-10.1177_03331024251352844 for Genome sequencing reveals the Adgrl3 (ADGRL3) gene as a possible cause of cephalic hypersensitivity in the STA rat and migraine in humans by Brian Skriver Nielsen, Hongru Wang, Tanya Ramdal Techlo, Lisette Kogelman, Sarah Louise Christensen, Sanne Hage la Cour, Sabrina Prehn Lauritzen, Gordon Munro, Steffen Petersen, Marlene Danner Dalgaard, Morten Erik Allentoft, Thomas Folkmann Hansen, Rasmus Nielsen, Jes Olesen, Inger Jansen-Olesen and David Møbjerg Kristensen in Cephalalgia
Supplemental Material
sj-docx-2-cep-10.1177_03331024251352844 - Supplemental material for Genome sequencing reveals the Adgrl3 (ADGRL3) gene as a possible cause of cephalic hypersensitivity in the STA rat and migraine in humans
Supplemental material, sj-docx-2-cep-10.1177_03331024251352844 for Genome sequencing reveals the Adgrl3 (ADGRL3) gene as a possible cause of cephalic hypersensitivity in the STA rat and migraine in humans by Brian Skriver Nielsen, Hongru Wang, Tanya Ramdal Techlo, Lisette Kogelman, Sarah Louise Christensen, Sanne Hage la Cour, Sabrina Prehn Lauritzen, Gordon Munro, Steffen Petersen, Marlene Danner Dalgaard, Morten Erik Allentoft, Thomas Folkmann Hansen, Rasmus Nielsen, Jes Olesen, Inger Jansen-Olesen and David Møbjerg Kristensen in Cephalalgia
Footnotes
Acknowledgments
We thank Neslihan Bicen for excellent laboratory assistance with sample preparation for the DNAseq of the rats. We are also extremely grateful to Professor Jørgen Tranum Jensen, the former Head of the Body Donation programme at Copenhagen University, for helping us with the dissection and collection of the human tissues used in this study.
Author contributions
BSN, JO, IJ-O, SHLC and DMK designed the research. SHLC and MDD prepared rat DNA for sequencing. HW and RN performed the subsequent analysis of the data. SHLC, SPL and BSN performed RT-qPCR and western blot analyses of human and rat tissue. SLC, GM and SP performed the periorbital thresholds of rats. TRT and TFH performed analysis on human whole genome sequencing data. LK performed analysis on RNAseq data. BSN, SHLC, TFH, IJ-O and DMK drafted the manuscript. All authors have read and approved the final version of the manuscript submitted for publication.
Data availability
The corresponding author will provide the required data and materials to interested researchers upon reasonable request. This is to facilitate reproducibility and further scientific investigation.
Declaration of conflicting interests
The authors declare the following potential conflicts of interest with respect to the research, authorship and/or publication of this article: JO owns stocks in the biotech start-up company Cephagenix. All other authors have declared no potential conflicts of interest.
Funding
The authors disclosed receipt of the following financial support for the research, authorship and/or publication of this article: This work was supported by the Aase of Ejnar Danielsens Fond, Candys foundation (CEHEAD).
ORCID iDs
Supplemental material
Supplemental material for this article is available online.
References
Supplementary Material
Please find the following supplemental material available below.
For Open Access articles published under a Creative Commons License, all supplemental material carries the same license as the article it is associated with.
For non-Open Access articles published, all supplemental material carries a non-exclusive license, and permission requests for re-use of supplemental material or any part of supplemental material shall be sent directly to the copyright owner as specified in the copyright notice associated with the article.