
Abstract
Background
Headache is a common symptom following mild traumatic brain injury (mTBI). Post-traumatic headache (PTH), a secondary headache disorder that develops after mTBI, often persists for months or years. To identify potential recovery mechanisms and prognostic biomarkers, the present study investigated whether longitudinal changes in pain-induced brain activation differ between healthy controls (HC) and PTH participants showing headache improvement and those without improvement.
Methods
Thirty-three participants who met International Classification of Headache Disorders, 3rd edition, criteria for acute PTH within 59 days post-mTBI and 33 HC participants were included with no significant differences in demographics. All participants underwent functional magnetic resonance imaging scans at baseline, four weeks, and 16 weeks post-enrollment using a thermal stimulation paradigm with noxious and non-painful heat stimuli. ‘Painful vs. Non-Painful Heat’ contrasts were generated using SPM12. PTH improvement was assessed at three months post-enrollment via electronic headache diaries. Two-sample t-tests compared the brain activation between HC and PTH at baseline. Linear mixed-effects models examined longitudinal changes for HC, PTH improvement and non-improvement groups across visits. Generalized linear models compared these groups within visits.
Results
Baseline analysis revealed several regions with significantly higher activation in acute PTH compared to HC, including bilateral postcentral gyrus, right superior temporal gyrus, right middle temporal gyrus, left inferior parietal gyrus, right superior parietal gyrus, left ventral striatum, left olfactory cortex, left gyrus rectus, and left middle occipital gyrus. Over time, the PTH improvement group demonstrated progressive normalization across all identified brain regions, whereas the non-improvement group showed only partial normalization in left ventral striatum, left olfactory cortex, and left gyrus rectus. Sustained elevated activation in specific regions distinguished PTH participants without headache improvement from those with headache improvement, suggesting potential biomarkers for persistent PTH.
Conclusions
Our findings demonstrate significantly altered pain-induced brain activations in participants with acute PTH compared to HC. Longitudinal analysis revealed distinct recovery trajectories: progressive normalization in the improvement group versus persistent alterations in the non-improvement group. These neuroimaging patterns may serve as biomarkers for identifying individuals at risk for persistent PTH, with implications for early intervention and personalized treatment approaches.
This is a visual representation of the abstract.
Keywords
Introduction
Post-traumatic headache (PTH), a secondary headache disorder that develops following mild traumatic brain injury (mTBI), can significantly impact daily functioning and cause considerable pain and disability.1–3 While some patients experience symptom improvement in the short-term, others develop persistent headaches that can last for months or even years.4–7 This heterogeneous recovery pattern presents challenges in clinical practice, as currently available tools cannot reliably predict individual patient outcomes regarding headache persistence or improvement, making it difficult to provide accurate prognosis and design effective treatment strategies.
Previous studies have demonstrated that functional magnetic resonance imaging (fMRI) has potential in headache research, detecting altered functional connectivity in various headache disorders, including migraine and PTH,8–12 and facilitating development of classification models for migraine.13–16 Moreover, several investigations using heat pain stimulation tasks have revealed task-related brain activation patterns in migraine.17–21 Additionally, longitudinal analysis using fMRI can capture the patterns of brain activation associated with disease progression or recovery and treatment response in headache disorders.22–24
The present study used fMRI to investigate group differences in pain-induced brain activation patterns between participants with PTH and healthy controls (HC). Longitudinal changes within each group over three visits and group comparisons at each of three visits were examined to determine whether clinical improvement in PTH is reflected in pain-induced brain activation. Identifying these brain activation signatures could provide insights into PTH recovery mechanisms and potential prognostic biomarkers.
Methods
Participant enrollment
This observational longitudinal study was approved by the Mayo Clinic and Phoenix VA Institutional Review Boards, as well as the United States Department of Defense Human Research Protection Office. Each research participant engaged in an informed consent process and signed an informed consent form approved by the Institutional Review Board. All participants were enrolled from the Mayo Clinic in Arizona or the Phoenix VA Health Care System between 2019–2024. All enrolled participants with PTH met the International Classification of Headache Disorders, 3rd edition (ICHD-3) diagnostic criteria for acute PTH attributed to mTBI. 25 Enrollment occurred within 0–59 days post-mTBI. Participants with a history of headaches prior to mTBI were eligible. Those with a history of moderate or severe TBI were excluded. For HC, participants were enrolled during their normal state of health. HC who experienced occasional tension-type headaches (fewer than three per month) were eligible, whereas any HC with a history of other headaches, such as migraine, or a history of TBI was excluded. Group differences on participant demographics were calculated using the Mann–Whitney U-tests for age and chi-squared tests for sex.
fMRI image acquisition
Participants underwent fMRI scanning at three time points: baseline (visit 1), four weeks after baseline (visit 2), and 16 weeks after baseline (visit 3). All scans were performed using a 3 Tesla Skyra machine (Siemens) at Mayo Clinic. Brain activation in response to noxious heat was assessed using an event-related blood oxygen level-dependent (BOLD) paradigm consisting of three nine-minute runs. Images were acquired with the following parameters: repetition time = 2.5 seconds, echo time = 27 ms, flip angle = 90°, 38 interleaved slices, resolution = 4 mm isotropic, field of view = 256 × 256 × 152 mm, and a 64 × 64 × 38 matrix.
Thermal stimulation paradigm
Thermal stimulation was applied to the left ventral medial forearm using a Medoc Pathway thermode (30 × 30 mm) under three conditions: no stimulation, non-painful heat (2°C below pain threshold), and moderate intensity painful heat (temperature eliciting a pain intensity rating between 4–7 out of 10) (Figure 1). The temperatures used for the non-painful heat and moderately intense heat pain stimuli were individualized for each participant during quantitative sensory testing that was completed prior to each MRI session. The ramp-and-hold method was employed to increase the thermode temperature from 32°C at a rate of 1°C per 0.125 s until reaching the target temperature, which was maintained for 7.5 s. To avoid order effects, stimuli and no stimulation conditions were randomized with jittered intertrial intervals averaging 45 s. An auditory cue preceded each stimulus to distinguish alerting effects from heat and pain responses.

Stimulation paradigm. Each stimulus is maintained for 3 magnetic resonance frames. The intertrial interval averages 18 frames. The total duration of each functional magnetic resonance imaging run is less than nine minutes.
Pain-induced activation fMRI data preprocessing
Preprocessing and analysis of fMRI data were performed using SPM12 (Statistical Parametric Mapping, Wellcome Department of Imaging Neuroscience) and MATLAB (MathWorks). 26 Preprocessing steps included realignment of functional images to the mean volume, motion correction, and co-registration to each participant's structural images. Spatial smoothing was applied using an 8-mm full width at half maximum Gaussian kernel. Scans with excessive motion (≥3 mm of movement) were designated for exclusion. However, none exceeded this threshold, and no scans were removed.
First-level analyses were performed for each participant using a general linear model (GLM) with 12 regressors: nine for the three different heat conditions from each run and three constant terms for each run. The BOLD response to each stimulus was modeled using an event-related design with a response duration of 12.5 seconds (five repetition times) beginning at stimulus onset. Activation maps for the ‘Painful vs. Non-Painful Heat’ contrast were generated by comparing moderately intense heat pain against non-painful heat stimulation. Participant's activation maps were normalized to standard stereotaxic space using high-resolution T1-weighted anatomical images and the Montreal Neurological Institute (MNI) template.
Headache improvement definition
All participants with PTH completed a daily headache diary during the first three months post-enrollment, which was used to assess headache improvement or headache non-improvement at three months. In each daily entry, participants recorded whether they experienced a headache (1 = headache; 0 = no headache). Headache improvement was determined using a novel algorithm that considered both the participant's headache history prior to their mTBI and their headaches following the most recent mTBI. ‘PTH improvement’ was defined in two ways: (1) For participants with pre-existing headaches, ‘PTH improvement’ was classified as either a 50% or greater reduction in the number of additional headache days following the most recent mTBI or a decrease to 2.5 or fewer additional headache days at three months post-enrollment. (2) For participants without prior headache history, ‘PTH improvement’ was defined as a 50% or greater reduction in headache day frequency when comparing the third month to the first month post-enrollment. Based on these criteria, participants were categorized into either the PTH improvement group or PTH non-improvement group. The complete algorithm for this classification is provided in detail elsewhere. 27
Statistical analysis
Group-level analysis
A one-sample t-test was performed using SPM12 to examine the main effect of painful stimulation in all participants. This analysis employed a GLM that included age and sex as covariates. 28 Significant activation was determined using a family-wise error (FWE) correction with p < 0.001 and a cluster-forming threshold of 50 voxels. To compare brain activation between HC and PTH at visit 1, a two-sample t-test was performed using a GLM with age and sex as covariates and accounting for unequal variance. 28 For this group comparison, significant clusters were identified using an uncorrected voxel-wise threshold of p < 0.005 and a cluster-forming threshold of 30 voxels. The statistical thresholds for both analyses were selected based on our previous studies,18,23 with more lenient thresholds applied to the group comparison due to the reduced sample size.
The identified clusters were anatomically labeled using the Automated Anatomical Labeling atlas 3 (AAL3) in SPM Toolbox for gray matter regions, whereas white matter regions were labeled using the Johns Hopkins University (JHU) ICBM-DTI-81 white matter atlas.29,30
Longitudinal changes across visits
The t-statistics and clusters were first obtained using SPM12, and additional analyses were then performed in Python 3.7.10 using the Statsmodels library (version 0.13.5). For each group, a linear mixed-effects model was employed to investigate longitudinal changes in average voxel activation across visits.
31
The dependent variable yit represents the average voxel activation for participant i at visit t, and the model is formulated as:

The model includes an intercept (β0) and a fixed effect of visit (βv) to account for changes across visits as well as those of age (βa) and sex (βs) to control the covariates for each participant. Additionally, a random intercept (ui) was included to account for between-participant variability, and ϵit represents the residual error. The primary interest lies in the fixed effect βv, and two-sided t-tests were used to assess its statistical significance in determining temporal changes.
Group comparisons and association analyses at each visit
For each visit, a GLM was utilized to analyze group differences in average voxel activation. 28 The average voxel activation yi for participant i is modeled as:

This model included an intercept (β0) and a fixed effect of group membership (βg) of the participant, which was represented as a binary variable for pairwise comparisons: HC vs. PTH Improvement and HC vs. PTH non-improvement. Age (βa) and sex (βs) were included as covariates to control the influence on voxel activation. For the comparison between PTH improvement and non-improvement, an additional covariate representing time passed between trauma and first visit (βt) measured in days was included. The model was specified as:

To address potential unequal variances between groups, a heteroskedasticity-consistent covariance structure was employed to obtain robust standard errors (ϵi). 32 One-sided t-tests were used to assess the statistical significance of the fixed effect of group membership (βg), with the direction of testing predetermined based on previously observed voxel activation differences between HC and PTH groups.
To further investigate the association between headache frequency and brain activation, another GLM was applied using the average number of headache days over the four weeks prior to visits 2 or 3 as predictors instead of group membership. The model included the same covariates and was restricted to PTH participants, with statistical analyses conducted to assess the significance of this association.
Results
The flow of participants and MRI completion across visits is illustrated in Figure 2. Of the 71 enrolled participants, two HC and one PTH participant were screen failures and withdrawn from the study. Additionally, two PTH participants attended only the non-imaging portions of the study and therefore did not have MRI data collected.

Participant flow and functional magnetic resonance imaging (fMRI) completion across study visits. HC = healthy controls; PTH = participants with post-traumatic headache.
At visit 1, 33 HC participants (median age = 36.6 years; Q1–Q3 = 26.6–52.2 years; range = 19.7–70.8 years; 21 females, 12 males) and 33 PTH participants (median age = 37.3 years; Q1–Q3 = 25.7–58.6 years; range = 18.2–70.0 years; 20 females, 13 males) were included. The two groups did not differ significantly in age (p = 0.868) or in sex (p = 1.0). Among the 33 PTH participants, 16 individuals had no other TBI prior to the most recent TBI, five had one prior TBI, six had two prior TBIs, four had three prior TBIs, and two had four prior TBIs. In total, 27 participants reported no pre-existing headaches, whereas six individuals reported experiencing at least one headache in a month before the most recent TBI. The median time between trauma and the first visit was 25 days (Q1–Q3 = 20–37 days; range = 0–55 days). The mechanism of the most recent TBI was as follows: six participants were involved in motor vehicle accidents, 17 sustained TBIs due to falls, and 10 suffered TBIs due to other causes. After excluding five participants with missing outcome data and six who had been randomized into a PTH treatment clinical trial, 13 participants (median age = 37.3 years; Q1–Q3 = 28.5–57.0 years; range = 21.8–69.2 years; nine females, four males) were classified as PTH improvement and nine (median age = 34.8 years; Q1–Q3 = 23.9–56.2 years; range = 23.1–60.2 years; six females, three males) as PTH non-improvement.
At visit 2, three HC and three PTH participants were lost to follow-up; two HC and one PTH participant had incomplete fMRI scans; and one PTH participant had not yet undergone the fMRI scan. The final sample consisted of 28 HC participants (median age = 37.3 years; Q1–Q3 = 28.2–56.2 years; range = 19.7–70.8 years; 16 females, 12 males) and 28 PTH participants (median age = 37.5 years; Q1–Q3 = 27.2–59.3 years; range = 18.2–70.0 years; 18 females, 10 males). No significant differences were found between HC and PTH in terms of age (p = 0.98) or sex (p = 0.784). Among PTH participants, 13 (median age = 37.3 years; Q1–Q3 = 28.5–57.0 years; range = 21.8–69.2 years; nine females, four males) were classified as PTH improvement and eight (median age = 34.7 years; Q1–Q3 = 23.8–56.9 years; range = 23.1–60.2 years; five females, three males) as PTH non-improvement, and seven participants were excluded due to one having missing outcome data and six being randomized in a PTH treatment clinical trial.
At visit 3, six HC and seven PTH participants were lost to follow-up, one PTH participant had an incomplete fMRI scan, and one PTH participant had not completed fMRI. The final sample comprised 27 HC participants (median age = 37.1 years; Q1–Q3 = 27.5–56.9 years; range = 19.7–70.8 years; 15 females, 12 males) and 24 PTH participants (median age = 40.6 years; Q1–Q3 = 27.2–59.3 years; range = 18.2–70.0 years; 15 females, nine males). No significant differences were observed between HC and PTH in terms of age (p = 0.873) or sex (p = 0.827). After excluding one participant with missing outcome data and five who had been randomized into the clinical trial, the PTH group consisted of nine PTH improvement (median age = 29.5 years; Q1–Q3 = 27.7–57.0 years; range = 21.8–69.2 years; six females, three males) and nine PTH non-improvement (median age = 34.8 years; Q1–Q3 = 23.9–56.2 years; range = 23.1–60.2 years; six females, three males) participants. Detailed participant information for each visit is presented in Table 1.
Demographic characteristics across visits.

Q1–Q3 = interquartile range; range = minimum – maximum; HC = healthy controls; PTH = participants with post-traumatic headache.
Note: Statistical significances were calculated using two-sided Mann–Whitney U-tests for age and two-sided chi-squared tests for sex.
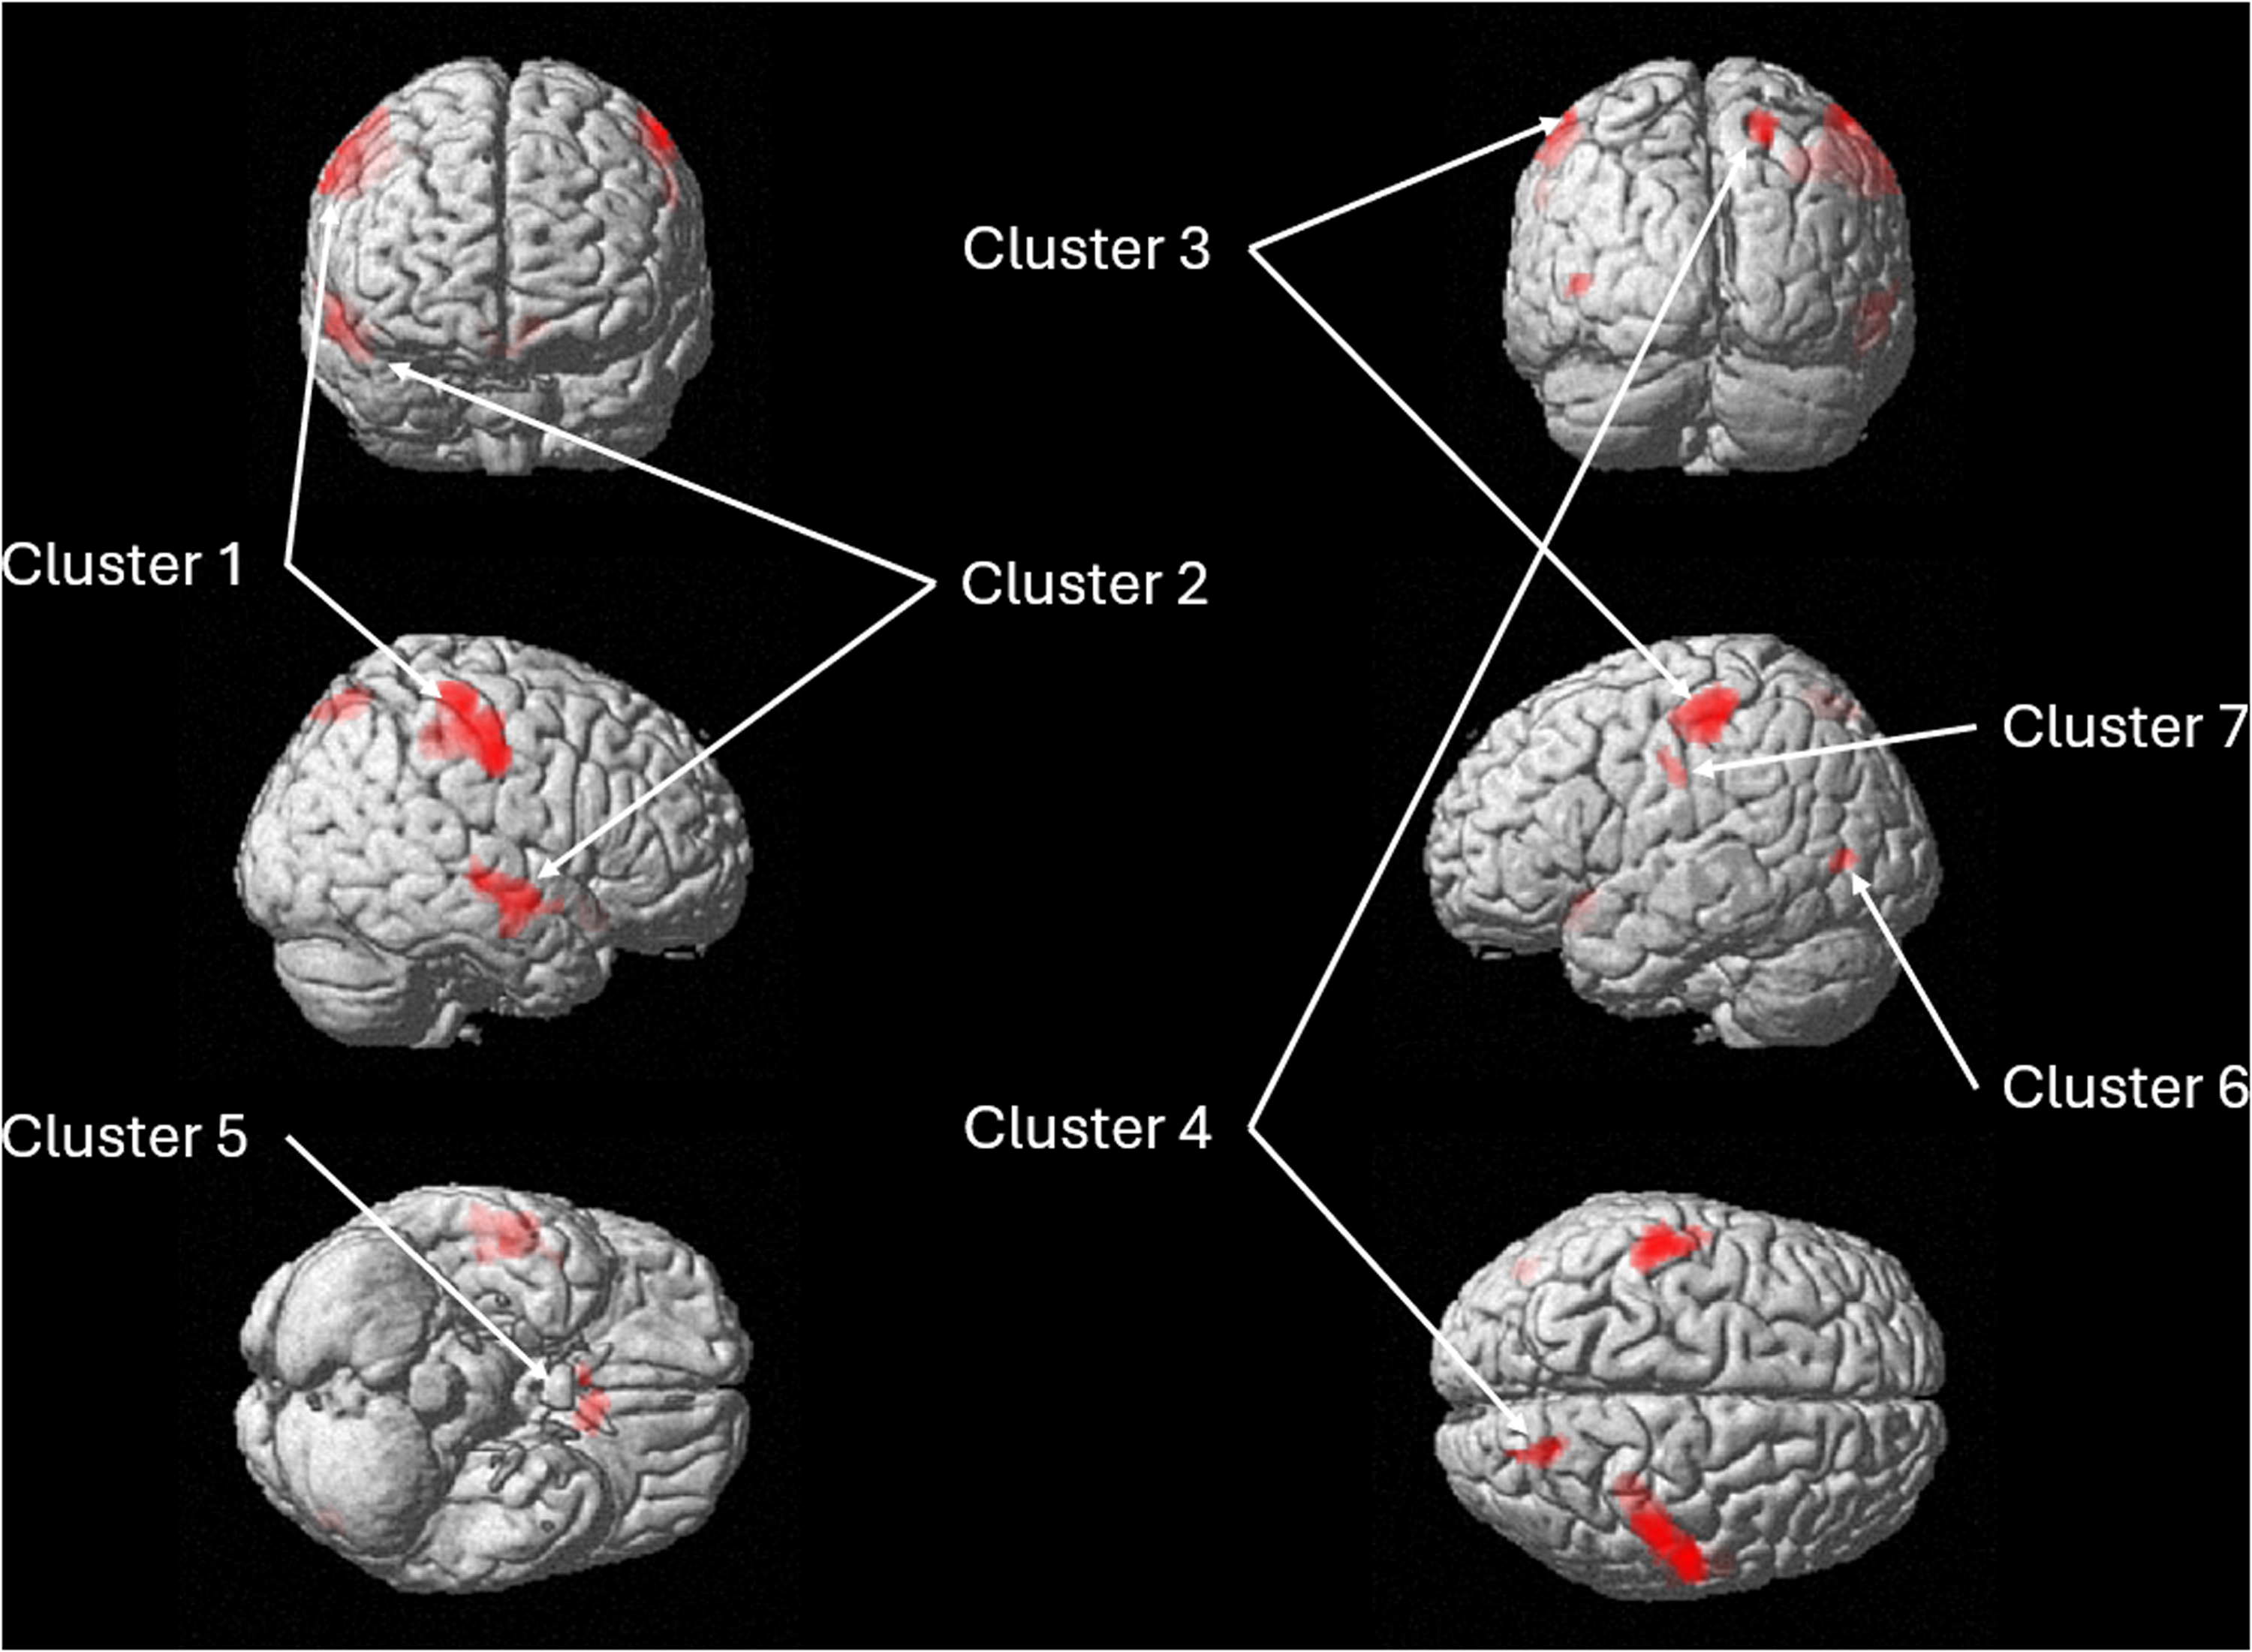
Main effect of pain-induced brain activation
To establish a baseline of pain-related brain activation patterns, the main effect of painful heat stimulation was examined across all participants at visit 1. Figure 3 and Table 2 present the cluster-level results, which revealed eight significant clusters (all p < 0.001, FWE-corrected). Brain regions included the bilateral insula, right inferior frontal gyrus (opercular part), bilateral supramarginal gyrus, bilateral ventral lateral nucleus, right posterior limb of internal capsule, bilateral middle cingulate and paracingulate gyri, and left lobule VI of the cerebellum.

Main effect analysis of pain-induced 3D brain activation rendered in SPM12: cluster-level results at baseline. Detailed cluster information is provided in Table 2.
Main effect analysis of pain-induced brain activation: cluster-level results.
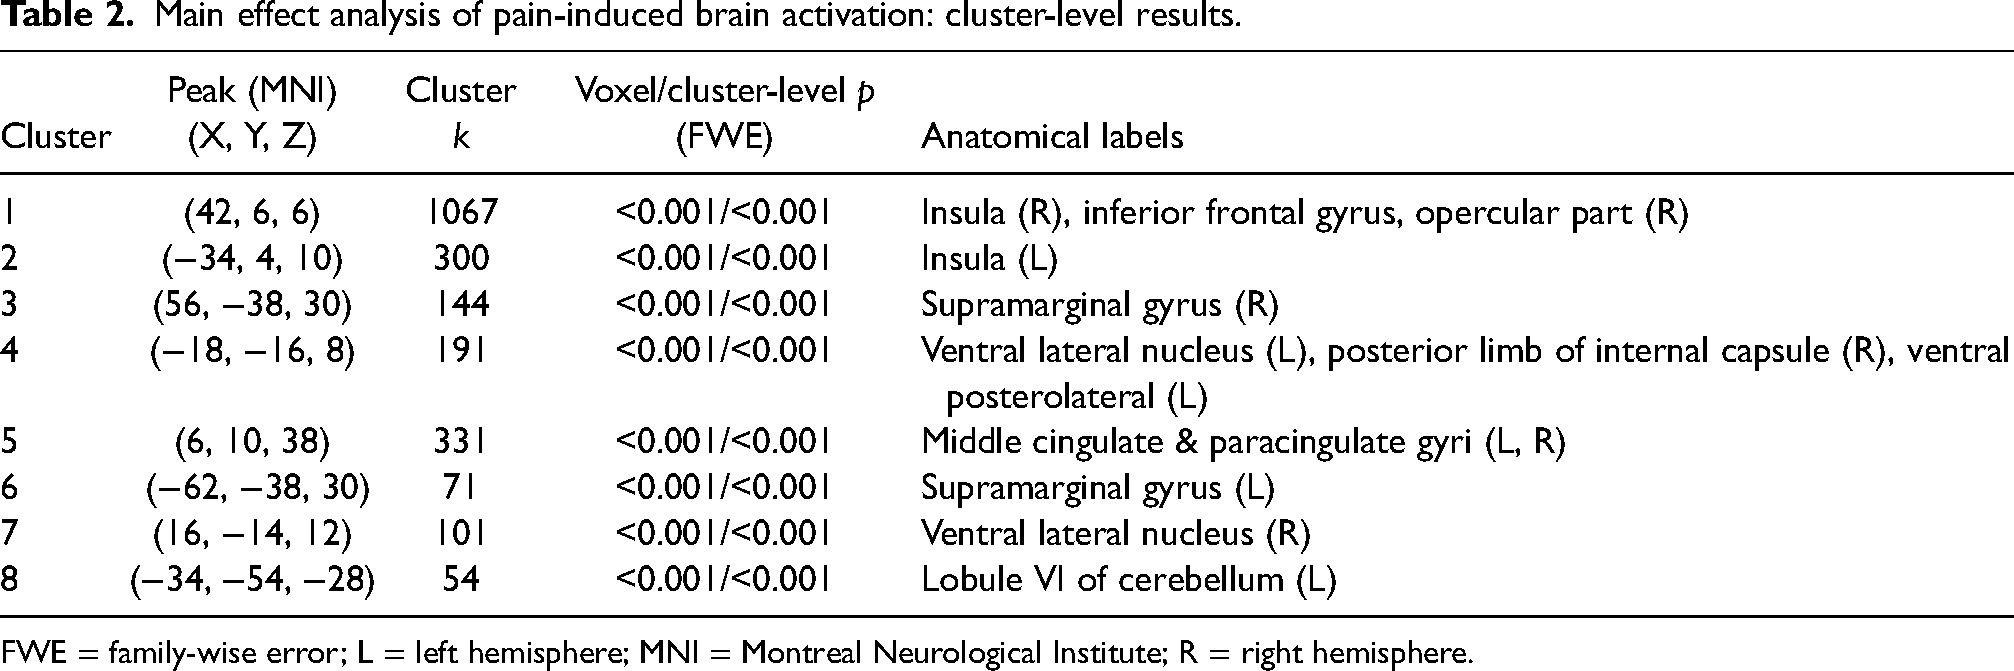
FWE = family-wise error; L = left hemisphere; MNI = Montreal Neurological Institute; R = right hemisphere.
Group differences in pain-induced brain activation at baseline
Group differences in brain activation between HC and PTH at visit 1 are summarized in Figure 4 and Table 3. All clusters showed greater activation in the PTH group compared to HC. These clusters were primarily located in bilateral postcentral gyrus, right superior temporal gyrus, right middle temporal gyrus, left inferior parietal gyrus, right superior parietal gyrus, left ventral striatum, left olfactory cortex, left gyrus rectus, and left middle occipital gyrus. The group differences at visit 1 provided baseline clusters for examining temporal changes in activation patterns associated with recovery or persistent symptoms.
Group differences pain-induced 3D brain activation rendered in SPM12: cluster-level results at baseline. Detailed cluster information is provided in Table 3.
Group differences in pain-induced brain activation: cluster-level results.

L = left hemisphere; MNI = Montreal Neurological Institute; R = right hemisphere.
Longitudinal tracking and group comparisons: brain activation across visits
Longitudinal changes in brain activation were assessed, and the corresponding results and statistical significance are summarized in Figure 5. The PTH improvement group showed significant decreasing trends across all clusters (colored in orange), indicating that brain activation progressively decreased toward HC levels. In cluster 5, both PTH improvement and non-improvement groups showed significant improvement (p = 0.034 and 0.045, respectively). However, the non-improvement group represented a flattened decreasing trend (colored in blue), indicating a milder decline in activation over time. The HC group had no significant temporal trends, maintaining stable activation levels across visits. These temporal patterns provide insights into the recovery patterns of the PTH group.

Pain-induced brain activations: longitudinal changes and group comparisons across three visits. Brain regions in each cluster are listed in Table 3. Note: Trend lines for post-traumatic headache (PTH) improvement and non-improvement are displayed only where statistical significance was observed.
Group comparisons of brain activation were analyzed using GLM at each visit. HC showed significantly lower activation than PTH improvement for all clusters and PTH non-improvement for clusters 1, 2, 4, and 5 at visit 1. At visit 2, HC had significantly lower activation than PTH non-improvement in cluster 3. By visit 3, PTH improvement demonstrated significantly lower activation than PTH non-improvement in clusters 1, 2, 3, and 4. This pattern suggests a pattern of recovery in PTH improvement, while PTH non-improvement demonstrated less consistent improvement, suggesting differential recovery trajectories between two groups.
The association between headache frequency and brain activation was assessed using GLM at visits 2 and 3, respectively. No significant associations were observed at visit 2. However, at visit 3, clusters 1, 2, 4, 6, and 7 showed significant association between headache frequency and brain activation (p = 0.030, p < 0.001, p = 0.017, p = 0.036, and p = 0.047, respectively), with lower headache frequency consistently associated with lower regional brain activation.
Discussion
The primary finding of this study is that participants with PTH exhibit significantly altered pain-induced brain activations compared to HC, highlighting distinct changes in pain processing. Through longitudinal analysis and group comparisons, we identified different normalization patterns in pain-related brain activation between participants with PTH who experienced improvement compared to those who had not improved.
Several regions found to have altered pain-induced activation amongst those with PTH in our study have previously been shown to participate in pain processing. The bilateral postcentral gyrus (clusters 1 and 7) demonstrated increased responses to noxious heat stimulation, consistent with its role in sensory-discriminative processing of pain and its role in detecting thermal pain intensity.33–35 The right superior and middle temporal gyri (cluster 2) showed increased activation in response to painful heat compared to non-painful heat, reflecting their involvement in monitoring and regulating sensory response to pain, including affective and cognitive components. 36 It is possible that greater pain-induced activation of the superior and middle temporal gyri relates to memory of prior pain experiences that lead to enhanced affective-emotional response to the current pain stimulation. 37 The inferior parietal gyrus (cluster 3) is commonly activated by pain, likely playing roles in sensory-discriminative processing and pain expectations.34,38 The right superior parietal gyrus (cluster 4) displayed higher activation across weak, moderate, and painful stimuli compared to rest for healthy participants undergoing thermal stimulation, highlighting a role in pain processing regardless of stimulus intensity. 39 The left ventral striatum (cluster 5), encompassing the ventral putamen and nucleus accumbens, showed significant responses to laser-heat pain in healthy females. 40 Although the ventral striatum is typically associated with processing of reward, it also activates in response to pain, perhaps exerting antinociceptive/analgesic effects.41,42 The middle occipital gyrus (part of cluster 6) has been demonstrated to have abnormal structure and function in those with migraine, perhaps due to visual imagery of pain.43,44 Although the potential roles of the olfactory cortex and gyrus rectus (cluster 5) in pain processing and PTH require further investigation, there is some evidence for the gyrus rectus participating in emotional processing amongst those with chronic pain.45,46
Several regions with altered pain-induced activation amongst those with PTH in our study have previously been demonstrated to have altered activity amongst those with headaches. Headache-free individuals with episodic migraine demonstrated distinct patterns of activation in cognitive and sensory pain processing regions compared to HC, including increased activation in the right postcentral gyrus during painful heat stimulation. 18 Our current findings similarly indicate that this region may play an important role in PTH. However, although individuals with episodic migraine showed weaker activation in the right superior temporal gyrus (cluster 2), in this study, participants with PTH exhibited stronger activation, suggesting a potential biomarker differentiating episodic migraine from PTH. The nucleus accumbens, part of the ventral striatum (cluster 5), exhibited increased activation in those with episodic migraine who were scanned within 24 hours before a migraine attack, during acute noxious orofacial stimulation. 21 This region is integral to the mesolimbic reward pathway and pain relief.47,48 The left inferior parietal gyrus (cluster 3) showed stronger activation in individuals with migraine aura compared to HC during trigeminal noxious heat stimulation. 49 This region, which was also found to have increased activation in our study, could serve as a shared biomarker for both individuals with migraine aura and participants with PTH.
The longitudinal analysis revealed clear patterns of decreasing/normalizing activity in the PTH improvement group, partial reduction in the PTH non-improvement group, and stable activation in HC. The decreasing trend in the PTH improvement group suggests a trajectory toward baseline or healthy levels, whereas the limited decrease in the PTH non-improvement group may indicate ongoing hyperresponsiveness to pain stimuli. By visit 3, PTH improvement participants have already reached a state of clinical improvement. By contrast, PTH non-improvement participants continued to exhibit elevated activation levels, which may be indicative of incomplete recovery mechanisms. This sustained hyperactivation may reflect an impaired ability to modulate pain, ultimately preventing a return to normal state. Meanwhile, HC maintained stable activation patterns across all visits, indicating the expected consistent pain processing responses.
The PTH improvement group demonstrated significant decreasing trends across all brain regions, revealing normalization of pain-related brain activity. By contrast, the PTH non-improvement group showed a significant decreasing trend only in the left ventral striatum, olfactory cortex, and gyrus rectus (cluster 5), highlighting partial neural recovery that was not sufficient for clinical improvement. This suggests that, while partial recovery of neural function may occur even without symptomatic improvement, complete PTH clinical recovery may require normalization across all the pain-processing regions.
Group comparisons across visits revealed evolving patterns that provide insight into potential biomarkers and recovery predictors. At baseline (visit 1), both PTH improvement and non-improvement groups displayed significantly higher activation than HC. By visit 2 (4 weeks), the left postcentral gyrus and left inferior parietal gyrus (cluster 3) maintained significantly higher activation in the PTH non-improvement group compared to HC. At visit 3 (16 weeks), sustained differences between PTH improvement and non-improvement groups in multiple regions, including the right postcentral gyrus (cluster 1), right superior temporal gyrus, right middle temporal gyrus (cluster 2), left postcentral gyrus and left inferior parietal gyrus (cluster 3), right superior parietal gyrus (cluster 4), emerged as potential biomarkers of persistent PTH.
The selection of statistical thresholds in neuroimaging research could influence the results and their interpretation. While stringent thresholds reduce false positives, they increase the risk of missing important findings. Conversely, adopting lenient thresholds not only increases sensitivity but the risk of false positives, making it difficult to identify meaningful results. Incorporating minimum cluster-size alongside p-value thresholds has been shown to mitigate false positives while maintaining statistical power. 50 However, even more conservative approaches can increase type II errors in exploratory neuroscience research. 51 Based on previous studies and the need to detect both robust and subtle effects, we employed a threshold of p < 0.005 with a 30-voxel cluster-extent threshold in the group-level analysis.18,23
This study has several limitations. Despite enrolling 71 participants, the sizes of the PTH improvement and non-improvement subgroups were reduced by missing outcome data and exclusion of participants who were randomized into a PTH clinical trial. While subgroup classification was determined based on a three-month headache diary, our longitudinal imaging was obtained at four (visit 2) and 16 weeks (visit 3). Including additional imaging sessions, particularly around three months, could yield more precise insights into how the PTH improvement and non-improvement subgroups diverge over time. Although we adjusted for confounders such as age and sex, there may be additional unmeasured factors that may influence the observed activation patterns. The decrease in the proportion of participants in the PTH improvement group from visit 2 (62%) to visit 3 (50%) suggests a potential selective dropout of participants experiencing improvement, which could introduce attrition bias in our longitudinal analyses. In addition, headache improvement definition partially relied on self-reported frequency of pre-existing headaches, which may be subject to recall bias. More comprehensive investigations, including correlation analyses with structural MRI data and assessments of functional connectivity, are needed to advance our understanding of the brain mechanisms underlying PTH recovery. These developments could refine clinical decision-making based on prognostic biomarkers and improve interventions for PTH.
Conclusions
Participants with PTH showed higher pain-induced brain activation across multiple regions compared to HC. Longitudinal analysis revealed distinct recovery patterns: the PTH improvement group demonstrated progressive normalization across all identified brain regions, while the non-improvement group showed only partial normalization in specific regions. These sustained activation differences may function as neuroimaging biomarkers for identifying individuals at risk of developing persistent PTH, offering opportunities for targeted early intervention. Future studies with larger samples are needed to validate these potential biomarkers and establish their clinical utility.
Footnotes
Clinical implications
Declaration of conflicting interests
The author(s) declared the following potential conflicts of interest with respect to the research, authorship, and/or publication of this article: D.K., L.M., S.N., K.B.R., M.H., T.A., F.P., E.N., and J.L. declare that they have no conflict of interest. G.D. has received funding from the American Brain Foundation/the American Academy of Neurology funded by Amgen. A.S. has received consulting fees from AbbVie, Allergan, Amgen, Amneal, Axsome Therapeutics, Eli Lilly, eNeura, Everyday Health, Impel, Lundbeck, MedIQ, Medscape, Miller Medical, Neurolief, Novartis, Pfizer, Salvia, Satsuma, Teva, Theranica, WebMD. T.W. has received research funding from National Institutes of Health, National Science Foundation and U.S. Department of Defense. She serves as a Associate Editor for Journal of Alzheimer's Disease. C.D.C. has received research funding from Amgen, National Institutes of Health, and U.S. Department of Defense. She serves as a Junior Editor on the Editorial Board of Cephalalgia. Within the prior 36 months, T.J.S. has received compensation for consulting with AbbVie, Allergan, Amgen, Axsome, Collegium, Eli Lilly, Linpharma, Lundbeck, Salvia, Satsuma, Scilex, and Theranica and royalties from Up To Date. He has or had stock options in Allevalux, Aural Analytics, and Nocira. His institution has received grants for his research from American Heart Association, Flinn Foundation, Henry Jackson Foundation, National Headache Foundation, National Institutes of Health, Patient Centered Outcomes Research Institute, Pfizer, Spark Neuro, and United States Department of Defense.
Funding
The author(s) disclosed receipt of the following financial support for the research, authorship, and/or publication of this article: This work was supported by the United States Department of Defense W81XWH-15-1-0286.
Ethical statement
This observational longitudinal study (IRB approval number: 19-003200) was approved by the Mayo Clinic and Phoenix VA Institutional Review Boards as well as the United States Department of Defense Human Research Protection Office. Each research participant engaged in an informed consent process and signed an informed consent form approved by the Institutional Review Board.