
Abstract
Abstract
Background
Post-traumatic headache is very common after a mild traumatic brain injury. Post-traumatic headache may persist for months to years after an injury in a substantial proportion of people. The pathophysiology underlying post-traumatic headache remains unknown but is likely distinct from other headache disorders. Identification of brain areas activated in acute and persistent phases of post-traumatic headache can provide insights into the underlying circuits mediating headache pain. We used an animal model of mild traumatic brain injury-induced post-traumatic headache and c-fos immunohistochemistry to identify brain regions with peak activity levels across the acute and persistent phases of post-traumatic headache.
Methods
Male and female C57BL/6 J mice were briefly anesthetized and subjected to a sham procedure or a weight drop closed-head mild traumatic brain injury . Cutaneous allodynia was assessed in the periorbital and hindpaw regions using von Frey filaments. Immunohistochemical c-fos based neural activity mapping was then performed on sections from whole brain across the development of post-traumatic headache (i.e. peak of the acute phase at 2 days post- mild traumatic brain injury), start of the persistent phase (i.e. >14 days post-mild traumatic brain injury) or after provocation with stress (bright light). Brain areas with consistent and peak levels of c-fos expression across mild traumatic brain injury induced post-traumatic headache were identified and included for further analysis.
Results
Following mild traumatic brain injury, periorbital and hindpaw allodynia was observed in both male and female mice. This allodynia was transient and subsided within the first 14 days post-mild traumatic brain injury and is representative of acute post-traumatic headache. After this acute post-traumatic headache phase, exposure of mild traumatic brain injury mice to a bright light stress reinstated periorbital and hindpaw allodynia for several hours – indicative of the development of persistent post-traumatic headache. Acute post-traumatic headache was coincident with an increase in neuronal c-fos labeling in the spinal nucleus of the trigeminal caudalis, primary somatosensory cortex, and the nucleus accumbens. Neuronal activation returned to baseline levels by the persistent post-traumatic headache phase in the spinal nucleus of the trigeminal caudalis and primary somatosensory cortex but remained elevated in the nucleus accumbens. In the persistent post-traumatic headache phase, coincident with allodynia observed following bright light stress, we observed bright light stress-induced c-fos neural activation in the spinal nucleus of the trigeminal caudalis, primary somatosensory cortex, and nucleus accumbens.
Conclusion
Examination of mild traumatic brain injury-induced changes in peak c-fos expression revealed brain regions with significantly increased neural activity across the acute and persistent phases of post-traumatic headache. Our findings suggest mild traumatic brain injury-induced post-traumatic headache produces neural activation along pain relevant pathways at time-points matching post-traumatic headache-like pain behaviors. These observations suggest that the spinal nucleus of the trigeminal caudalis, primary somatosensory cortex, and nucleus accumbens may contribute to both the induction and maintenance of post-traumatic headache.
Keywords
Introduction
Post-traumatic headache (PTH) is a secondary headache disorder that commonly occurs as a result of mild traumatic brain injury (mTBI), also known as concussion (1,2). Mild TBIs account for greater than 75% of the over 60 million TBIs that occur worldwide each year (3–5). PTH is the most common symptom after a mTBI occurring in 47–95% of patients, it often has symptoms that resemble those of migraine, and it can be highly debilitating (1,2,4,6–10). For some, PTH resolves acutely in the days or weeks that follow a mTBI, but for 30–58% of patients their headaches persist beyond three months – a condition known as persistent post-traumatic headache (PPTH) (6,7,11,12). Extensive pre-clinical and clinical research has helped define the neural circuit involved in generation of migraine attacks (13–16) and resultant headache pain (15,17). However, in contrast to migraine, the pathophysiology of PTH is more poorly understood; traditional migraine therapies are often ineffective, and no evidence-based PTH-specific treatment exists (18,19). Recent human imaging studies have shown differences in brain structure and functional connectivity between PTH and migraine patients (20,21) suggesting there may also be differences in the underlying pathophysiology and mechanisms involved in the generation and maintenance of headache pain.
The aim of this study was to investigate time-dependent neural activity in an animal model of acute post-traumatic headache (APTH) and PPTH induced by mTBI. We used immunohistochemical staining of the immediate early gene (IEG) c-fos which is rapidly and transiently expressed in response to neuronal activation (22,23). C-fos mapping is particularly useful for identification of widespread neural activity (24,25) including nociceptive responses in neurons (26–28) and has been used in other headache models (29) and after TBI (30–33). To induce PTH we used a weight drop closed-head injury model of mTBI in naïve mice (34–36). This weight drop method effectively reproduces a clinically relevant “concussion-like” mTBI including replication of the biomechanics reported in humans (e.g. unrestrained head, linear and rotational acceleration) and without induction of significant gross or histological brain damage, no skull fractures and minimal loss of consciousness (34,37,38). We have recently used this mTBI model to demonstrate transient acute cephalic and hindpaw allodynia that can be reinstated by stress and is a surrogate for APTH and PPTH, respectively (35,36,39). The presence of hindpaw allodynia indicates development of central sensitization in our animal model and is consistent with the clinical observation of low pain thresholds and allodynia in humans (40–43). We hypothesized that mTBI induces neural activity in the APTH phase in pain relevant brain areas that can be captured using c-fos neural activity mapping and that the same areas would be re-activated by exposure of the animals to bright light stress (BLS) during the PPTH phase. We further hypothesized that c-fos activation in these brain regions in both the APTH and PPTH phases would correlate with pain behavior. Understanding the brain regions activated by mTBI across APTH and PPTH can help to define the underlying neural circuit that drives initiation and maintenance of PTH and may represent future targets for therapeutic intervention.
Materials and methods
Animals
Male and female C57Bl/6J adult mice were used in all studies. Mice aged 6–10 weeks old were kept on a 14/10-hour light/dark cycle (6 am to 8 pm lights on) with food and water ad libitum. All experimental procedures and studies were approved by the University of Arizona Institutional Animal Care and Use Committees and conducted in accordance with the Guide for the Care and Use of Laboratory Animals (44) with efforts to minimize pain and suffering and reduce the number of animals used.
Mild traumatic brain injury
The mouse model of experimental mTBI was adapted from Kane et al. (34) as previously reported (36,39,45). In brief, mice were lightly anaesthetized with 3% isoflurane and placed with their ventral surface on an elevated tissue paper stage. The paper was stretched tight over a plexiglass apparatus, secured with tape and was sufficient to support the animal’s body weight with an unrestrained head. A metal guide tube was centered to the midline of the skull and positioned between the ears to calibrate and standardize the weight drop impact location. A weight (100 g) was released from a height of 94 cm. Upon impact with the animal, the weight produced a downward 180-degree rotational flip of the animal through the tissue paper before landing on a soft foam sponge. The result was a concussion-like impact to the head, with induction of rotational and linear head forces. Note that after impact, the weight falls through the apparatus ensuring no secondary impacts with the animal occur. Sham animals were anesthetized and placed on the tissue paper stage but did not undergo the weight drop or rotational flip. Following the sham or mTBI procedures, animals were given supplemental oxygen and the righting reflex time was recorded. All animals awoke within five minutes of the procedure and no obvious signs of neurological complications were observed. Individual experimenters were blinded to the injury status of the animals.
Behavioral assessment of cutaneous allodynia
Mice were initially placed in elevated Plexiglass chambers that contained meshed flooring and allowed to acclimate for two hours a day for three consecutive days. Beginning on day 0 (pre-mTBI baseline) and at periodic timepoints thereafter, cephalic (periorbital) and extracephalic (hindpaw) allodynia was measured in the same mice after a two-hour acclimation period. To assess periorbital allodynia, a 0.4 g (3.61) von Frey filament was applied 10 times, with enough force to result in the filament forming a slight arch to the periorbital region, with 20–30 sec between each application. A positive allodynic response was considered to include swiping of the face, shaking of the head, and/or turning away from stimuli. To assess hindpaw allodynia, a 0.6 g (3.84) von Frey filament was applied to the left hindpaw 10 times with enough force to result in the filament forming a slight arch, with 20–30 sec between each application. Positive responses included withdrawal of the paw, shaking and/or licking the paw. Frequency response was calculated as ([number of positive responses/10] × 100%). All behavioral data were collected under blinded conditions by the same experimenter.
Bright light stress challenge
Unrestrained mice were placed in a rectangular plastic chamber and exposed to BLS induced by LED strips (calibrated to 1000 lux output) placed on both sides of the chamber. BLS consisted of one 15-minute exposure on day 14 after mTBI or sham impacts.
Tissue harvesting for immunohistochemistry
Immunohistochemical tissue processing was performed as we have previously described (45). In brief, mice were deeply anesthetized with 3% isoflurane and perfused transcardially with 4% paraformaldehyde. Brains were extracted, post-fixed for 24 hrs at 4°C and placed into 30% sucrose solution overnight. Mice were perfused during the APTH (i.e. two days post-mTBI) or PPTH (i.e. 14 days post-mTBI) phases. For mice subjected to BLS, they were perfused 2 h, 4 h, or 24 h following BLS. These timepoints were selected based on previous findings that suggest allodynia peaks in the APTH phase at two to four days after mTBI and in the PPTH phase at 2–4 h after BLS (36). Frozen brain tissue was sectioned on a cryostat (25 µm), and serial brain sections were mounted onto slides. Adjacent slides from each brain were processed for c-fos/NeuN double-labeling.
Immunohistochemistry
To determine activity-dependent mechanisms implicated in transition from APTH to PPTH in male and female mice, we performed fluorescent immunohistochemical double-labeling of c-fos and NeuN. Sections were first washed in 1X phosphate-buffered saline (PBS), then blocked for 1 hr in 8% normal donkey serum and 0.2% Triton X-100 in 1X PBS. Sections were then incubated simultaneously with rabbit anti-c-fos (226-008, 1:1,000 dilution; Synaptic Systems) and unconjugated mouse anti-NeuN (MAB377, 1:1000 dilution; Millipore) at 4°C for 24 hr. This primary antibody has been validated by us and numerous other groups to have high specificity and limited non-specific staining (46–48). Slides were then incubated with AlexaFluor 488 goat anti-rabbit (ab150073, 1:500 dilution; Abcam) and AlexaFluor 647 goat anti-mouse (ab150107, 1:1,000 dilution; Abcam) for 2 hr. After washing slides with 1X PBS, coverslips were applied with Vectashield antifade mounting medium (Vector Laboratories, Newark, CA).
Modified stereological quantification
Tissue sections were imaged using a Zeiss Axioscope with a 20x objective lens and were digitized using a color digital camera. Whole brain sections were examined for consistent mTBI induced increases in c-fos positive immunoreactivity. A thresholding standard was then applied and brain regions displaying at least two standard deviations (SD) above average sham values were included in further analysis. This allowed identification of peak areas of c-fos activation after mTBI while ensuring distinction from detection of sham or background c-fos activity. The number of c-fos/NeuN double-labelled neurons were quantified using ImageJ software (NIH), and the analysis was conducted using a modified stereology counting procedure as described previously (49,50). A grid of 30 squares (0.0075 mm2) was superimposed on 2–3 adjacent SpVc, NAc, or SSp sections bilaterally from each subject. Double-labeled neurons were counted in a grid of 15 random squares such that labelled cells intersecting the bottom or right lines of each square were included, while cells intersecting the top or left lines of the square were excluded from the analysis. Double-labelled cell density (in mm2) was calculated by averaging the bilateral counts across sections, then dividing the total number of counted cells by the total area that was assessed (0.111 mm2).
Statistical analyses
Across all experiments, the results are expressed as mean ± standard error (SEM) and a p value ≤.05 was considered significant. GraphPad Prism (GraphPad Prism) was used to perform all statistical analyses. First, a two-way ANOVA was used to analyze response frequency (%) to periorbital and hindpaw tactile stimulation, with “time” as within subject factor and “treatment” as between subject factor. Sidak post-hoc test for multiple comparisons was used to assess differences between the groups at each time point. In Experiment 1, a two-way ANOVA was used to analyze c-fos/NeuN immunohistochemical data in mTBI vs sham animals at the 2-and 14-d time points, with “time” and “treatment” as between subject factors. Tukey’s post-hoc test for multiple comparisons was used to assess differences between the groups at each time point. In Experiment 2, a one-way ANOVA was used to assess immunohistochemical differences in mTBI animals following BLS. Results of statistical analyses are summarized in Table 1.
Summary of statistical analyses.

Results
Experimental design
Experiment 1: mTBI induced APTH and PPTH
Male and female mice were subjected to a sham or mTBI procedure followed by mechanical sensitivity measurement. Consistent with our previous findings, only animals previously subjected to a mTBI (n = 10 males, n = 10 females) exhibited cutaneous allodynia (CA) in periorbital (Figure 1A [top]) and hindpaw (Figure 1A [bottom]) regions. In contrast, no significant change in response to tactile stimulation was observed over the same period in sham injured animals (n = 10 males, n = 9 females). Specifically, in the APTH phase, male mTBI animals, compared to sham, demonstrated significantly greater responsiveness to periorbital and hindpaw stimuli at days 1–7 post-mTBI, which returned to baseline by day 14 (**p < 0.005; Figure 1A). During the PPTH phase (>14 days post-mTBI), exposure to BLS re-instated this mechanical sensitivity to periorbital and hindpaw tactile stimulation
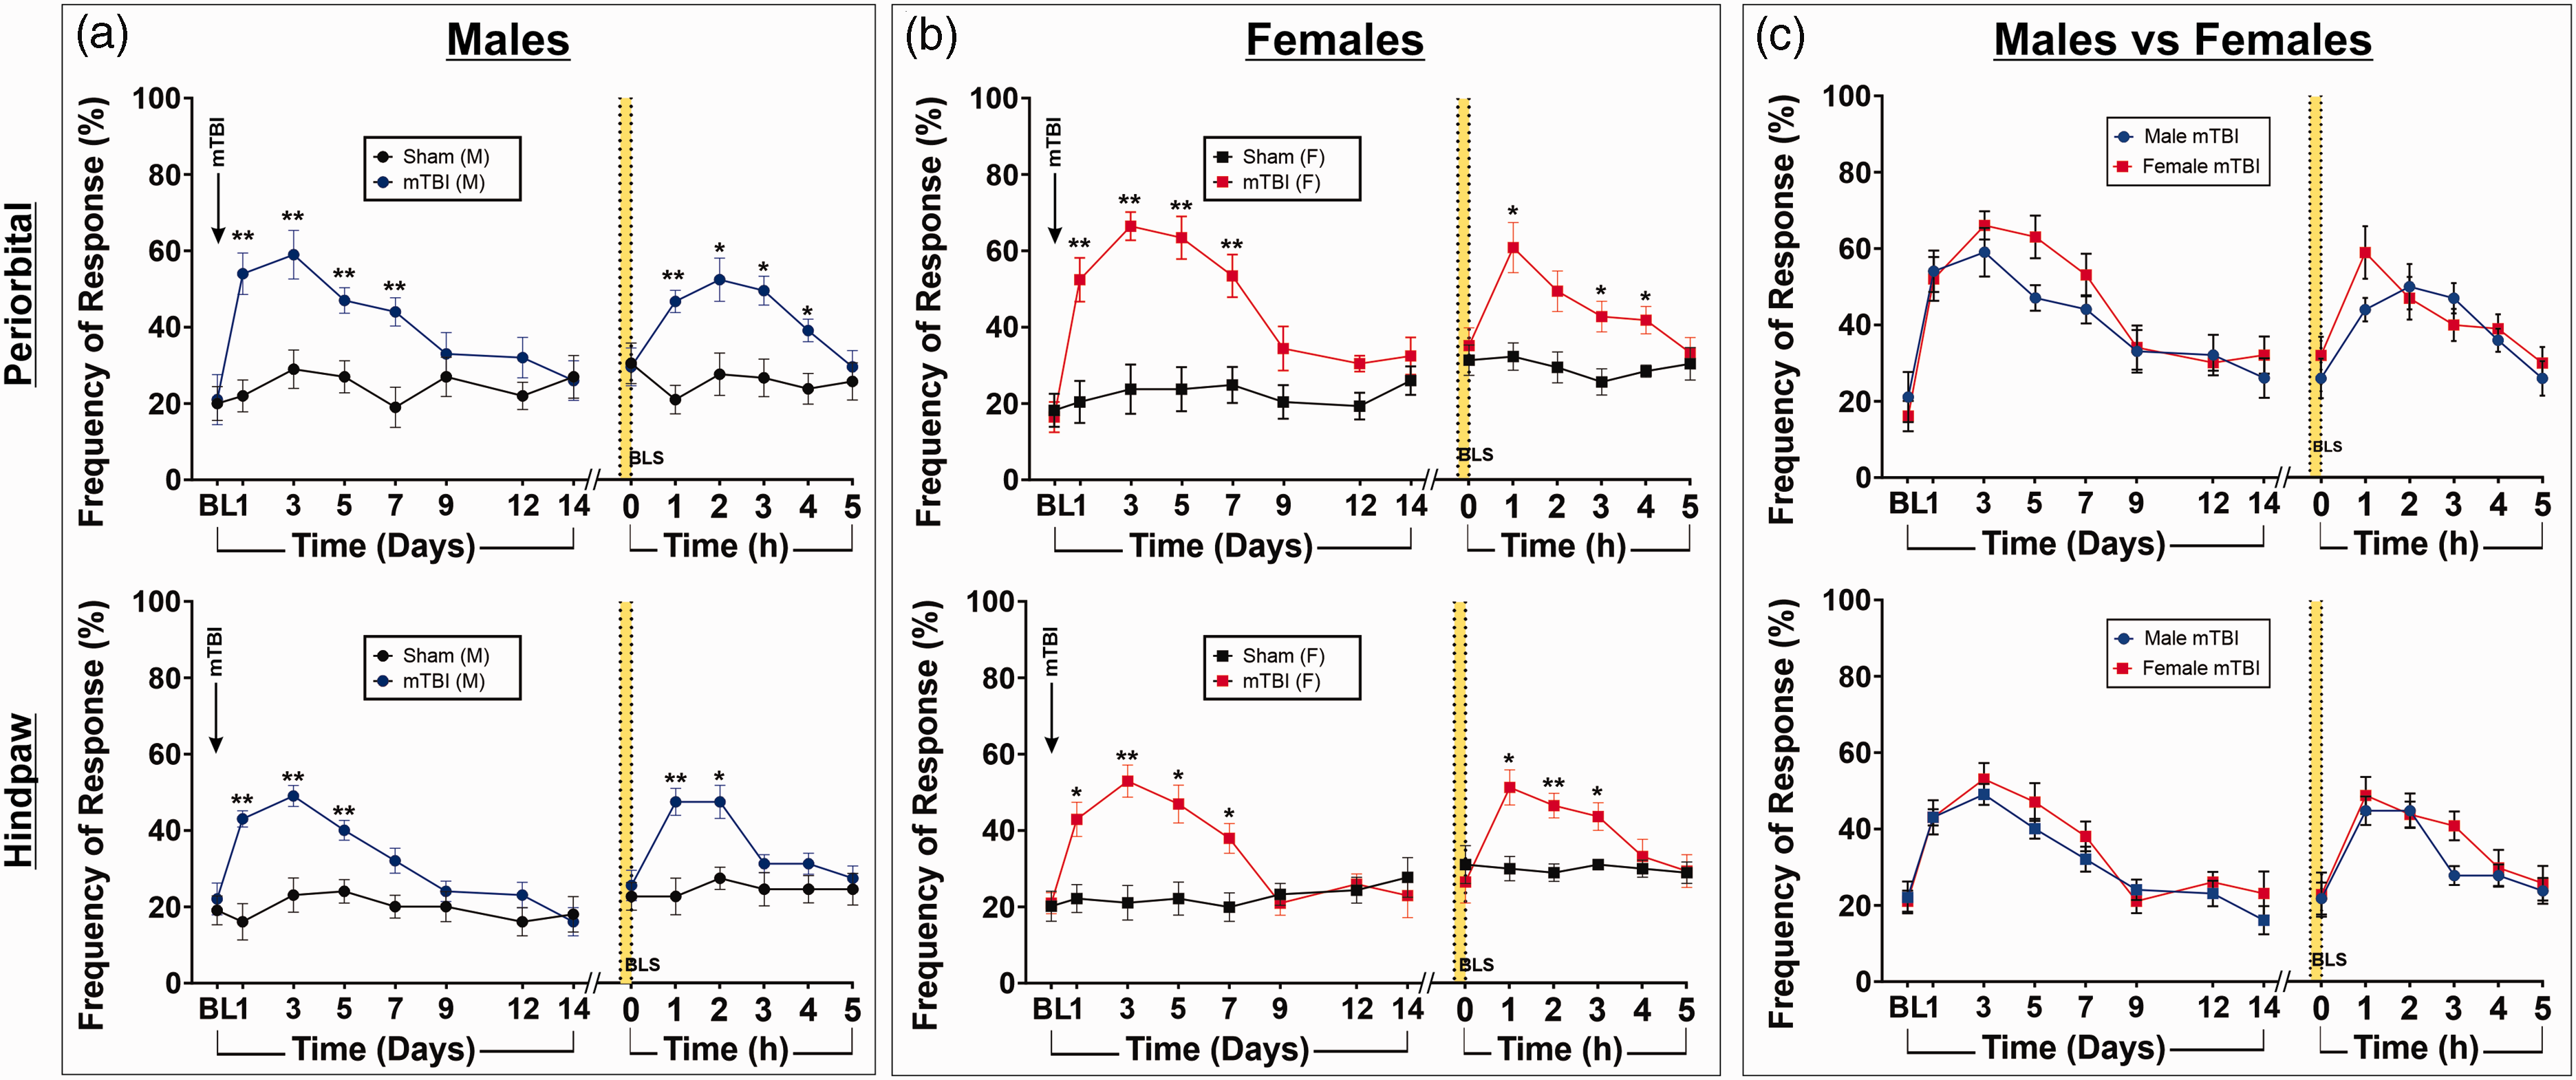
mTBI induces cutaneous allodynia to periorbital and hindpaw tactile stimulation during APTH and PPTH phases, with no differences in response between males and females. (a) In male mice (n = 20), frequency of response to periorbital (top) and hindpaw (bottom) tactile stimulation was significantly higher in mTBI mice compared to sham mice one to seven days after mTBI and then returned to baseline by day 14. BLS exposure 14 days following mTBIs induced heightened allodynic responses, indicated by significantly higher tactile response frequency in mTBI mice compared to sham, which peaked one to three hours following BLS exposure (**p < 0.005, *p < 0.05). (b) In female mice (n = 19) frequency of response to periorbital (top) and hindpaw (bottom) tactile stimulation was significantly higher in mTBI mice compared to sham mice one to seven days after mTBI and then returned to baseline by day 14. BLS exposure 14 days following mTBIs induced heightened allodynic responses, indicated by significantly higher tactile response frequency in mTBI mice compared to sham, which peaked one to three hours following BLS exposure (**p < 0.005, *p < 0.05) and (c) To test for differences in allodynic responses following mTBI between males and females, response frequency to periorbital (top) and hindpaw (bottom) tactile stimulation in male and female mice subjected to mTBI were plotted on the same graph. No differences in response frequency between male and female mice were observed at any time point (p > 0.05).
Experiment 2: Characterization of neural activity across the APTH Phase
We first examined for changes in whole brain c-fos expression during the known peak of behavioral allodynia (i.e. two days post-mTBI) and at the termination of the APTH phase (i.e. 14 days post-mTBI). Of note, the two-day time-point was also carefully chosen to be outside of the majority of the early c-fos activity induced directly by TBI itself (30–33), as TBI has been found to induce a transient increase in c-fos expression that peaks and subsides within the first 24 h after injury (30,33,51,52). Both male and female mice were used throughout the study and, where possible, equally assigned across groups. As no sex-dependent differences were observed in the behavioral data across the APTH and PPTH phases in Experiment 1 data were herein combined. Sex-matched groups were randomly assigned to one of four conditions based on two experimental factors: time-point for data collection after mTBI (2d vs 14d) and behavioral treatment (sham injury vs. mTBI). Specifically, the groups were sham-2d (n = 4–5), sham-14d (n = 4–6), mTBI-2d (n = 5–6), mTBI-14d (n = 4–6). Animals were euthanized at the appropriate time points and the brains collected for processing. An experimental timeline is depicted in Figure 2A.

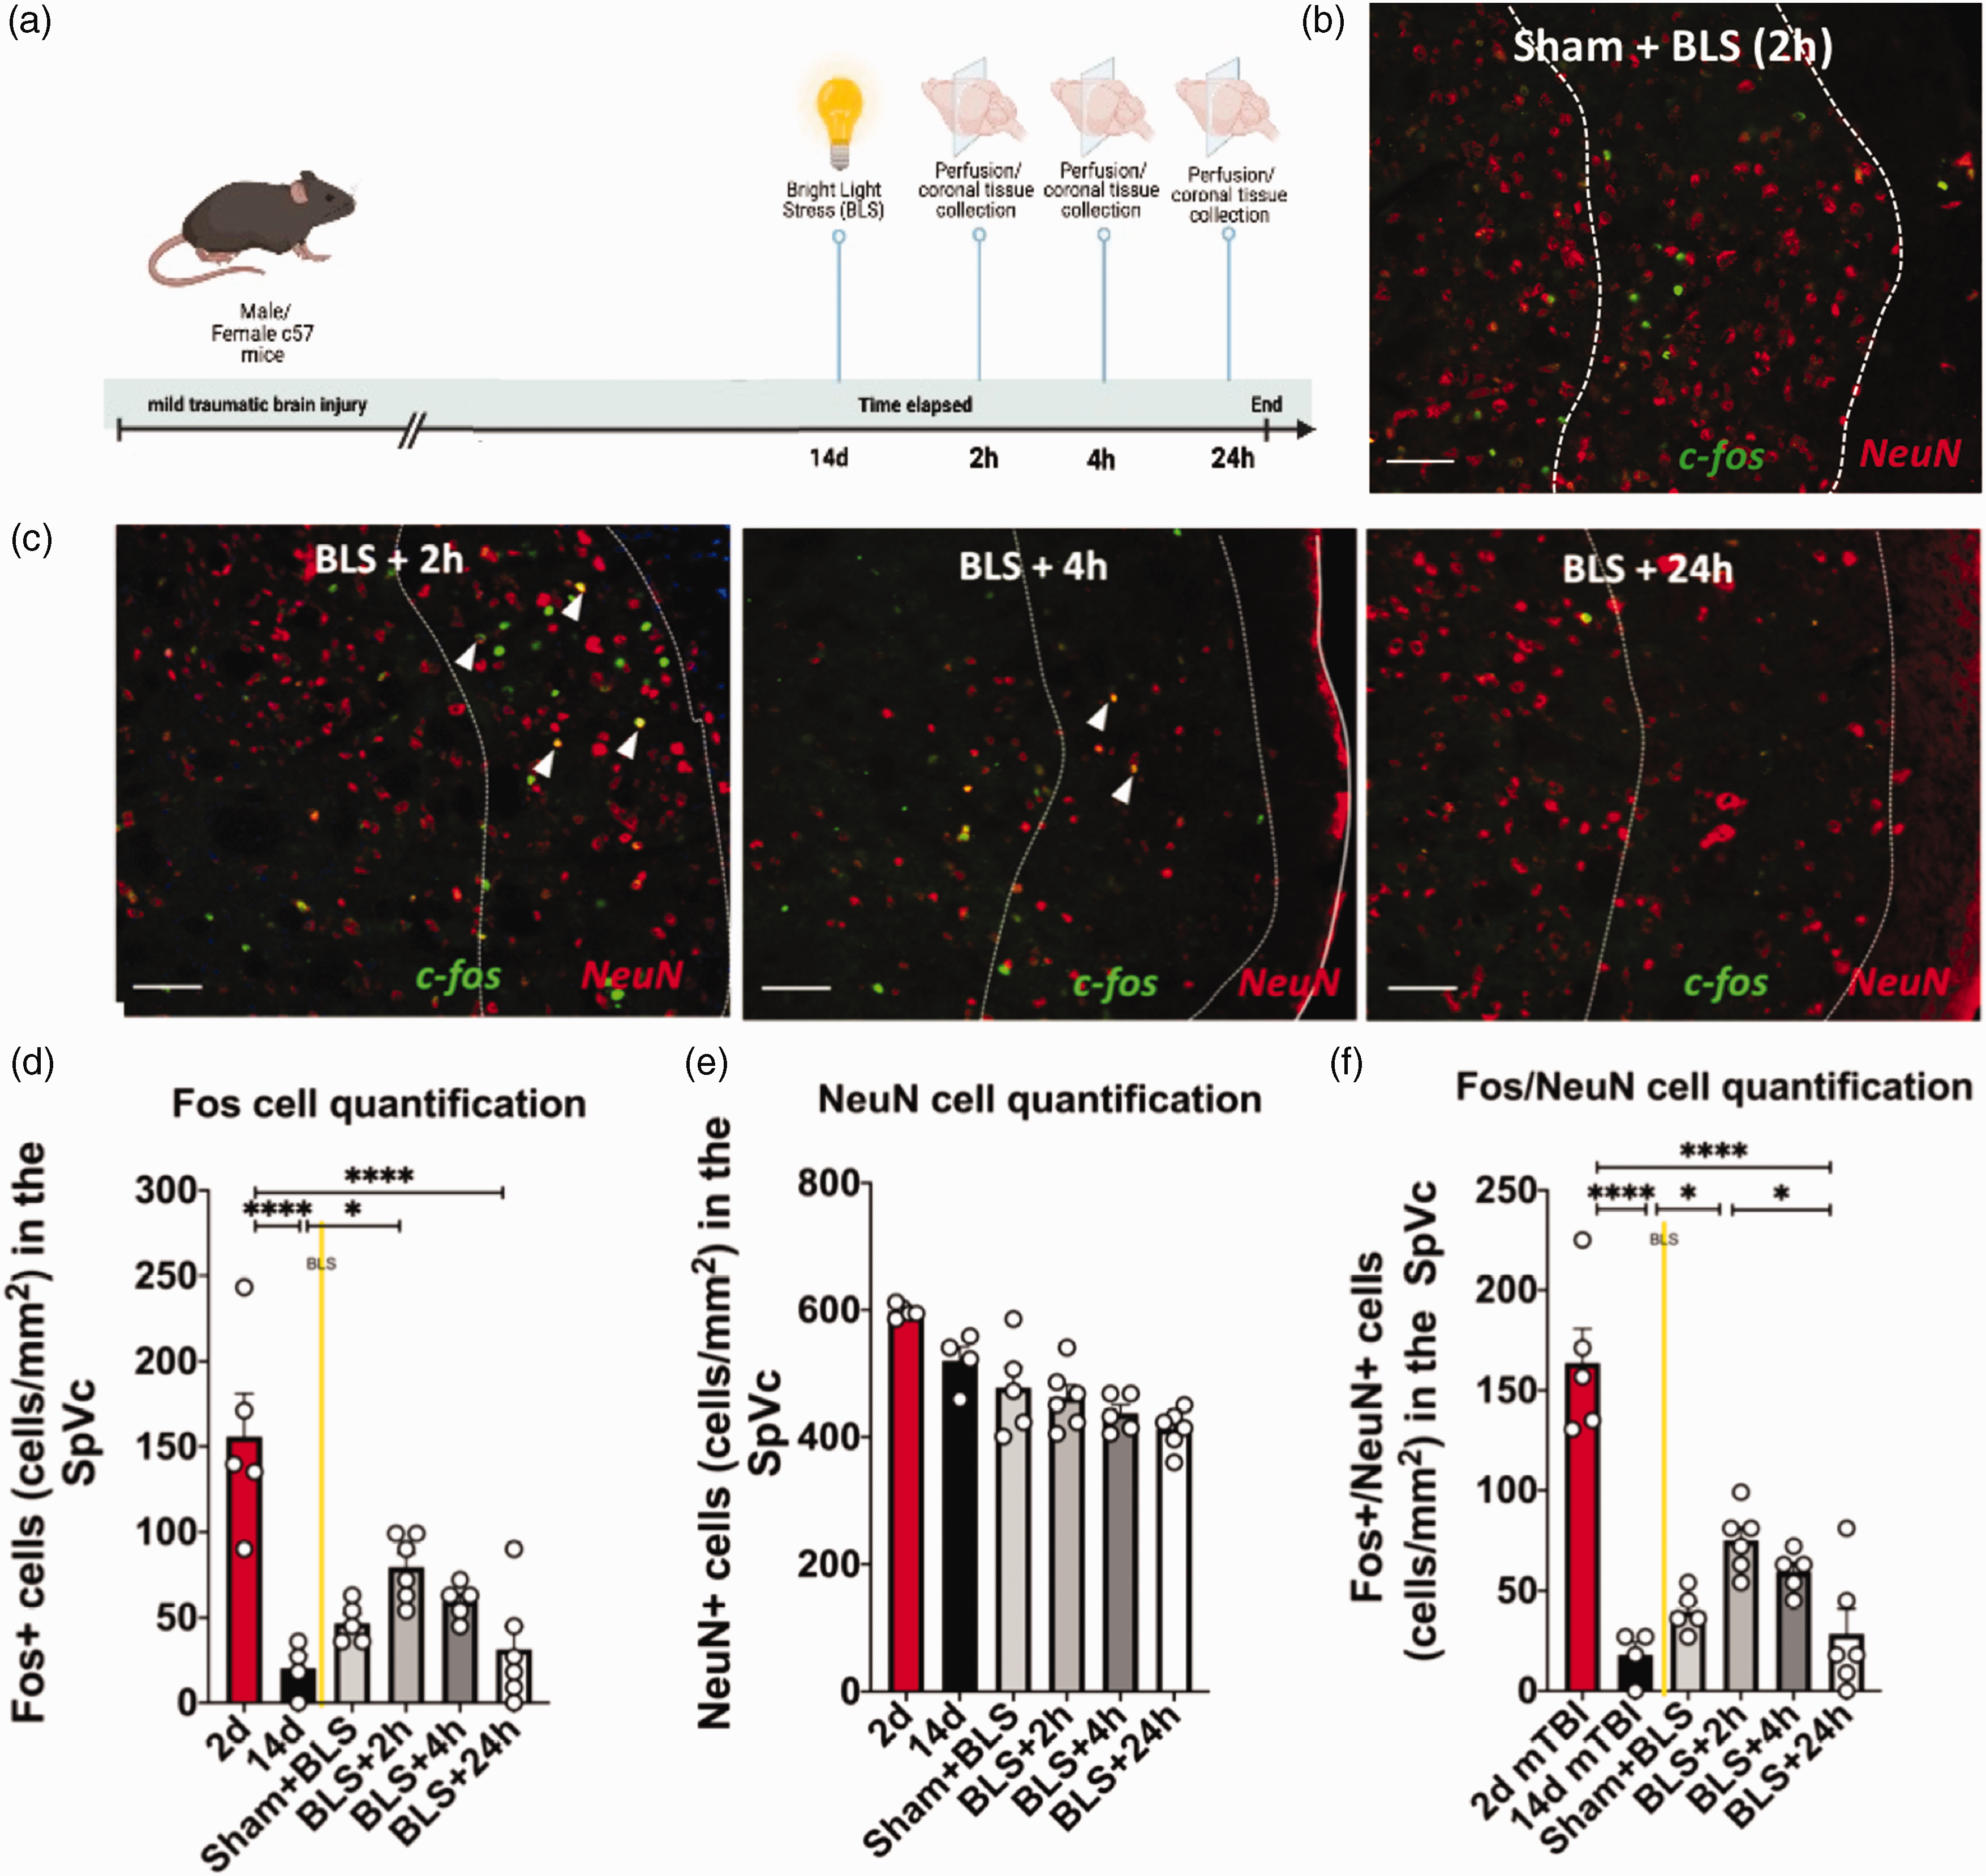
mTBI induces increased c-fos expression in SpVc neurons at 2 days after mTBI, which resolves 14 days after mTBI. (a) Timeline of mTBI induction and immunohistochemical tissue collection procedures in adult male and female C57 mice (n = 18 animals); (b) Schematic depicting tissue collection regions, where the SpVc is highlighted in blue. (c) Representative images of fluorescent c-fos labeling (left), NeuN labeling (center), and c-fos/NeuN double-labeling (right) in sham (top) or mTBI (bottom) animals, 2d (left) or 14d (far right) after mTBI; bar = 100 µM; white arrow: c-fos/NeuN double-labeled cell; yellow box: 40x zoomed image of c-fos/NeuN labeling. (d) Quantification of c-fos labeling. C-fos labeling is significantly higher in animals subjected to mTBI compared to sham animals 2d following mTBI, and mTBI mice showed significantly higher c-fos expression in SpVc 2d following mTBI compared to 14d following mTBI (****p < 0.0001). (e) Quantification of NeuN labeling. There is no difference in NeuN labeling between sham and mTBI-treated mice, or between the 2-and 14-day timepoints and (f) Quantification of double-labeled cells. C-fos/NeuN double-labeling in SpVc is significantly higher in animals subjected to mTBI compared to sham animals 2d following mTBI, and mTBI mice showed significantly higher c-fos/NeuN double-labeling in SpVc at the 2d timepoint compared to the 14d timepoint (****p < 0.0001).
mTBI increases neuronal activation in multiple pain relevant brain regions during the APTH phase
Immunohistochemistry was performed to examine for mTBI induced changes to c-fos and NeuN labeling across brain sections and regions. Brain regions and sections displaying heightened mTBI induced c-fos expression included the spinal trigeminal nucleus caudalis (SpVc), the somatosensory cortex (SSp) and nucleus accumbens (NAc). In some mTBI animals, increased c-fos was also observed in the parabrachial nucleus (PB) and periaqueductal gray (PAG) but this was inconsistent across animals (PB = three of six animals, PAG = one of five animals) and, for this reason, excluded from further analysis. Of note, no mTBI induced c-fos expression was observed at any time-point in the ventroposterior nuclei of the thalamus (Online Supplemental Figure 1).
Spinal trigeminal nucleus caudalis
To characterize mTBI induced neural activity double-labeling fluorescent immunohistochemistry was performed on SpVc sections (AP −7.5 to −8.0 mm from bregma) from mice subjected to mTBI or control sham injury at 2d and 14d timepoints (Figure 2B–C). Fluorescent immunohistochemistry revealed that mTBI increased single-labeling c-fos expression in SpVc neurons at 2d following injury compared to shams. This increase in c-fos expression resolved by 14d following injury and was not statistically different when compared to shams (p > 0.05) (Figure 2D). A two-way ANOVA demonstrated significant main effects of injury (n = 18, F1,14 = 28.06, p < 0.0.001) and experimental time-point (2d vs 14d; F1,14 = 47.07, p < 0.0001), and an interaction between the two factors (F1,14 = 26.21, p < 0.0005 (Table 1). No significant difference in the number of NeuN positive cells between sham and mTBI animals was observed (p > 0.05) (Figure 2E), consistent with our previous reports after mTBI in rats (45). We next examined for neuron specific c-fos expression changes by analyzing c-fos/NeuN double labeling which revealed mTBI mice also exhibited significantly higher c-fos/NeuN immunoreactivity compared to sham animals at 2d following injury (p < 0.0001) (Figure 2F). Furthermore, a majority of the fos+ cells were also NeuN+ across experimental time-points (∼80%) indicating a predominantly neuronal phenotype. A two-way ANOVA demonstrated significant main effect of injury (n = 18, F1,14 = 32.33, p < 0.0001) and experimental timepoint (2d vs 14d; F1,14 = 49.91, p < 0.0001), and an interaction between the two factors (F1,14 = 30.13, p < 0.0001; Table 1). While the c-fos/NeuN double-labeling was significantly higher at 2d vs 14d in mTBI mice (p < 0.0001) consistent with the resolution of allodynia there was no statistically significant difference between mTBI and sham mice at the 14d time-point (p > 0.05) (Figure 2F). Thus, SpVc neurons displayed significantly higher mTBI induced neuronal activation (i.e. c-fos/NeuN expression) early in the APTH phase (i.e. 2d) when compared to sham animals.
Somatosensory cortex
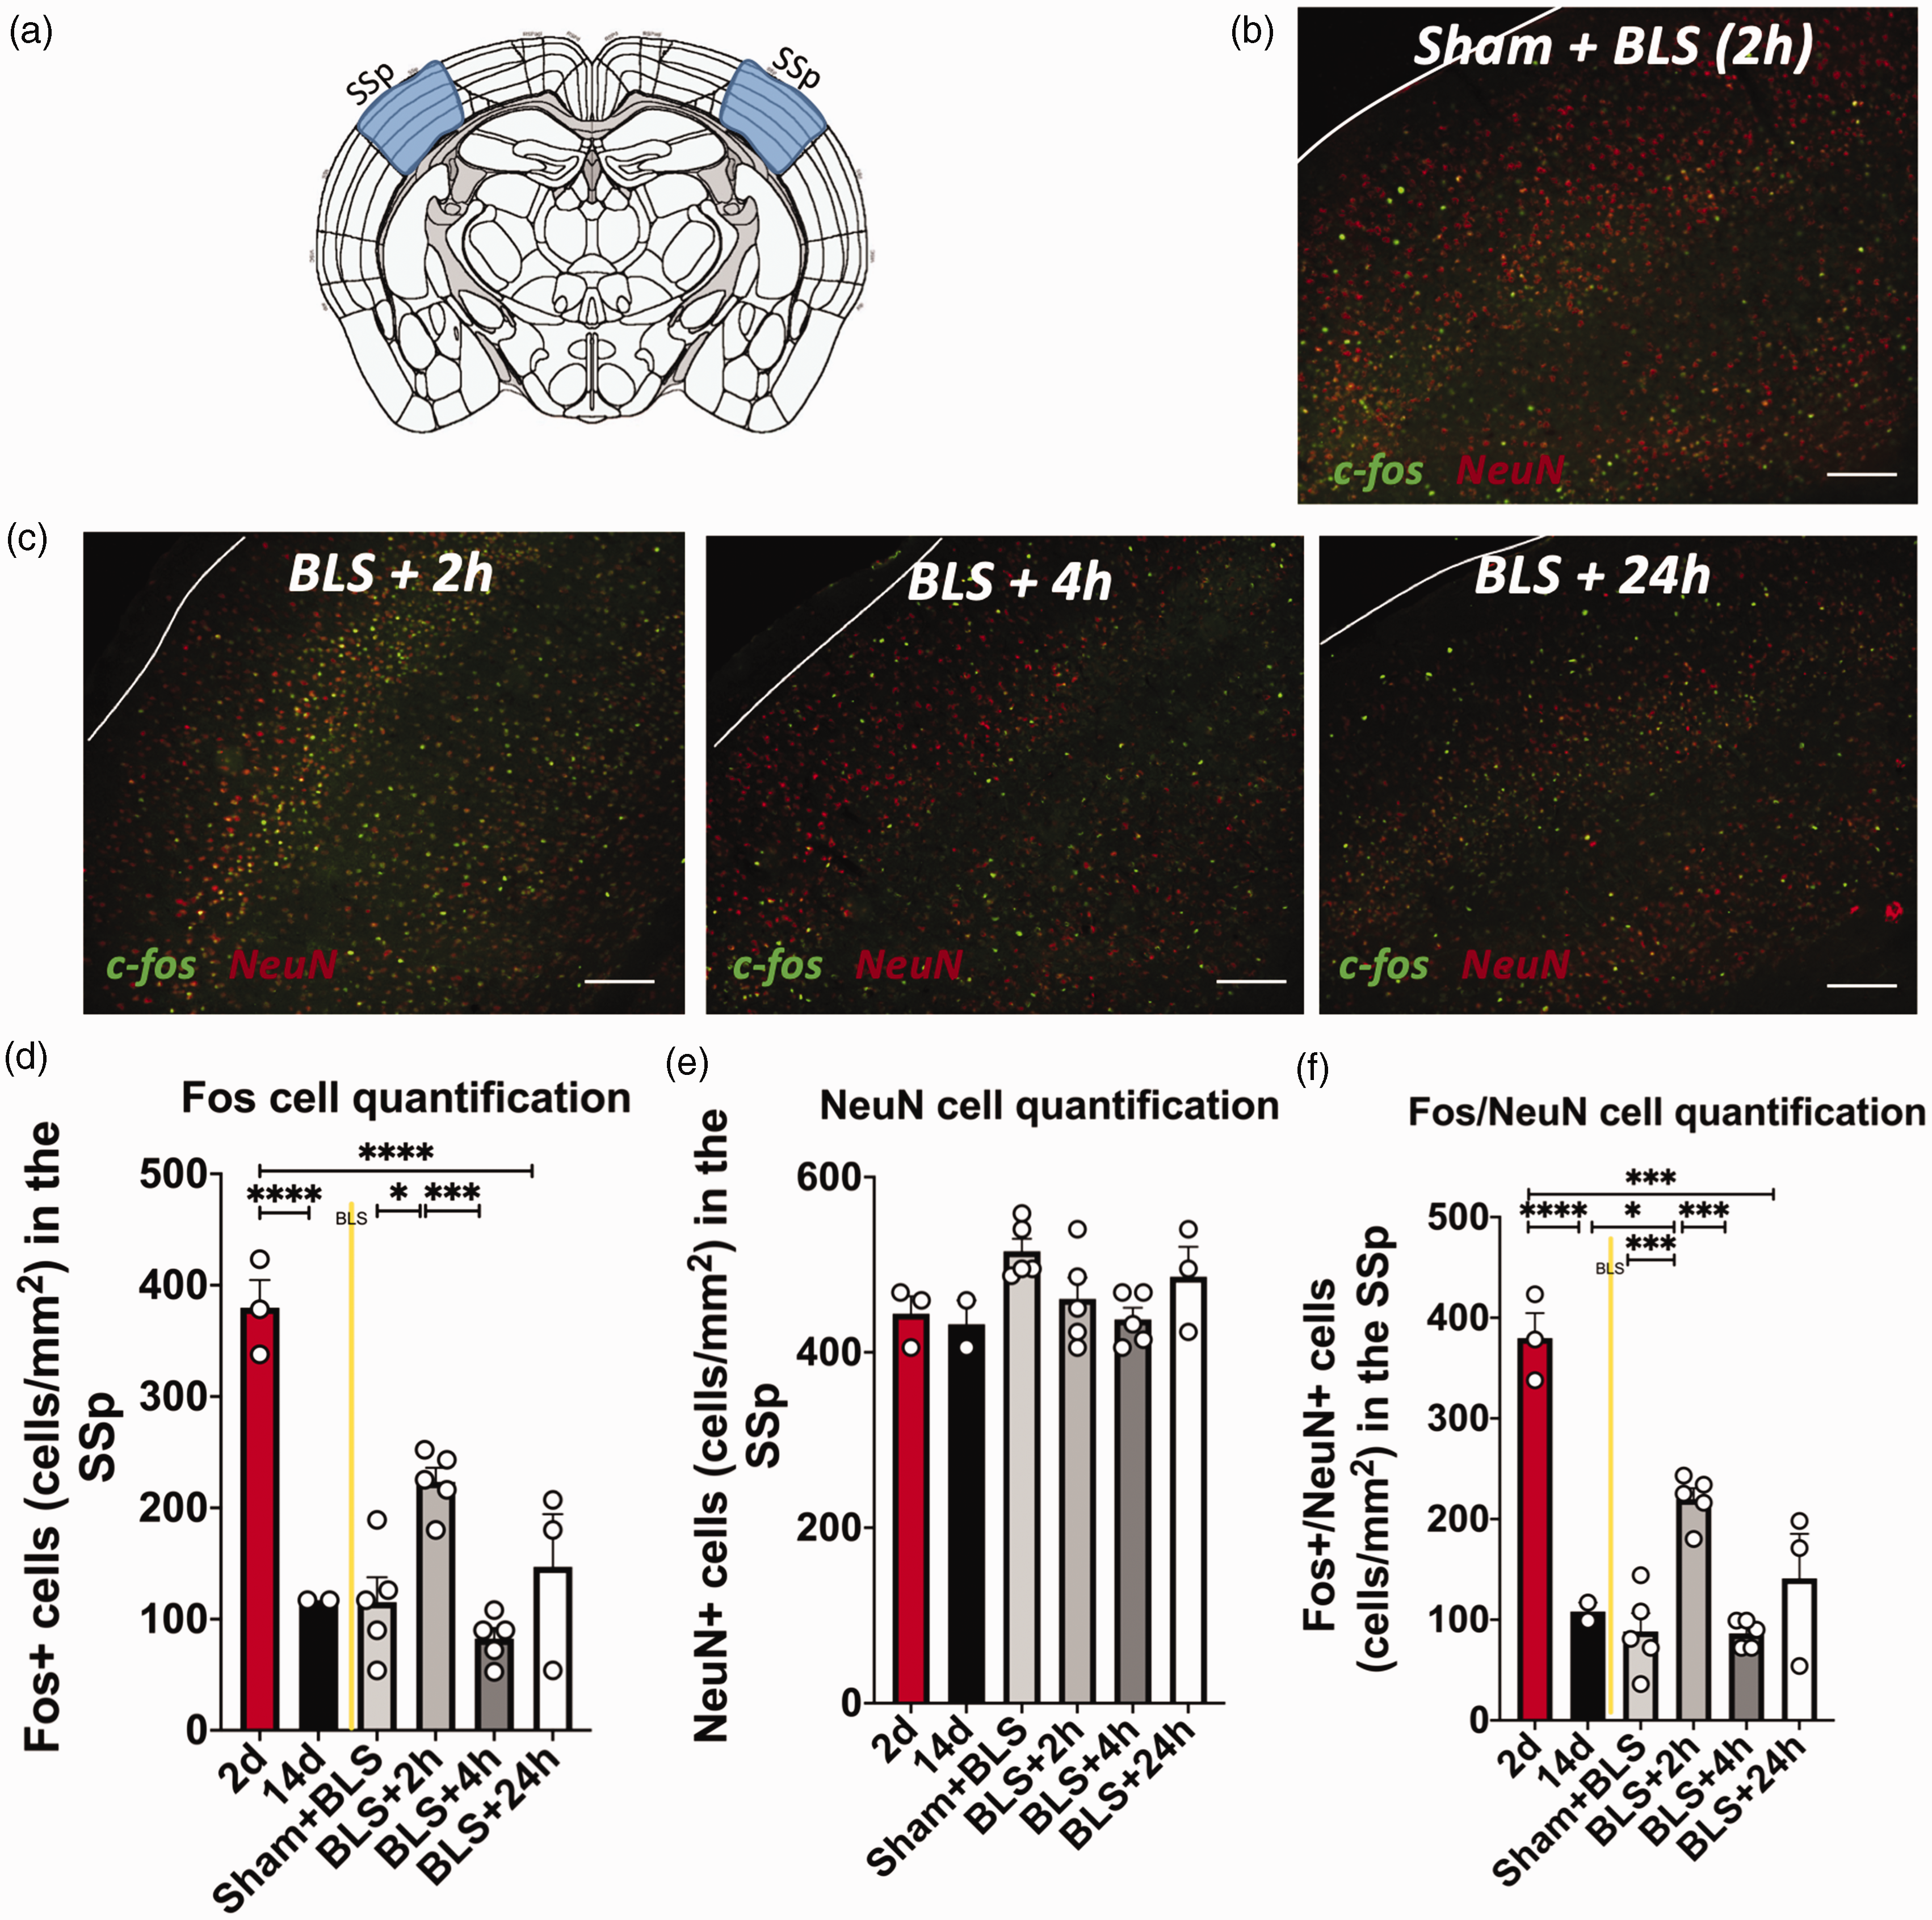
Next, we examined double-labeling fluorescent immunohistochemistry in the somatosensory cortex (SSp) of mice subjected to mTBI or sham injuries. Fluorescent immunohistochemistry revealed that mTBIs increased c-fos expression in SSp (AP −1.5 to −1.8 mm from Bregma) at 2d following injury, which again resolved by 14d following injury (Figure 3A–D). A two-way ANOVA demonstrated significant main effects of injury (n = 20, F1,16 = 69.91, p < 0.0001) and experimental time point (F1,16 = 64.50, p < 0.0001) and interaction between the two factors (F1,16 = 25.87, p < 0.0005) (Figure 3B, Table 1). As observed with SpVc, no significant difference in NeuN expression was observed between sham and mTBI animals at either the 2d or 14d time-points (p > 0.05)(Figure 3C). Mice subjected to mTBI also had significantly higher c-fos/NeuN double-labeling in the SSp at 2d following injury compared to 14d mTBI animals (p < 0.0001) as well as compared to both 2d and 14d time-points in sham animals (p < 0.0001). In addition, there was no significant difference in c-fos/NeuN double-labeling between mTBI and sham mice at the 14d time point (p > 0.05) (Figure 3D) indicating a return to near baseline c-fos expression levels at a time when allodynia had resolved. To determine whether these changes in c-fos expression were specific to the SSp and not due to mechanical forces during injury, we also qualitatively examined c-fos labeling in the motor cortex (MO), where we observed little to no c-fos labeling after mTBI compared to that of the SSp (Online Supplemental Figure 2).

mTBI induces increased c-fos expression in primary somatosensory cortex (SSp) neurons at 2 days following mTBI, which resolves 14 days following mTBI. (a) Timeline of mTBI induction and immunohistochemical tissue collection procedures in adult male and female C57 mice (n = 20 animals); (b) Schematic depicting tissue collection regions, where the SSp is highlighted in blue; (c) Representative images of fluorescent c-fos labeling (left), NeuN labeling (center), and c-fos/NeuN double-labeling (right) in sham (top) or mTBI (bottom) animals, 2d (left) or 14d (far right) after mTBI; bar = 100 µM; white arrow: c-fos/NeuN double-labeled cell (n = 20 animals). (d) Quantification of c-fos labeling. c-fos labeling is significantly higher in animals subjected to mTBI compared to sham animals 2d following mTBI, and mTBI mice showed significantly higher c-fos expression in SSp 2d following mTBI compared to 14d following mTBI (****p < 0.0001). (e) Quantification of NeuN labeling in SSp of mTBI compared to sham animals. There was no significant difference in NeuN labeling in SSp neurons in mTBI mice compared to sham mice 2d or 14d after injury and (f) Quantification of c-fos/NeuN double labeling in the SSp of mice subjected to mTBI or sham injuries 2d or 14d following injury. C-fos/NeuN double-labeling was significantly higher in the SSp of mTBI mice compared to sham mice 2d following experimental impacts and was significantly higher 2d following injury compared to 14d following injury (****p < 0.0001, ***p < 0.005).
Nucleus accumbens
The next region that displayed significant c-fos/NeuN double-labeling following mTBI was the NAc (AP 1.2 to 1.0 mm from bregma) (Figure 4A–D). Fluorescent immunohistochemistry revealed that mTBI increased c-fos expression in the NAc at 2d following injury, which was statistically reduced by 14d following injury but remained elevated over 14d sham values (Figure 4B). A two-way ANOVA demonstrated significant main effects of injury (n = 21, F1,17 = 42.89, p < 0.0001) and experimental time point (F1,17 = 16.22, p = 0.0009) but no interaction between the two factors (F1,17 = 1,656, p < 0.05) (Figure 4B, Table 1). Again, no significant difference was observed in the number of NeuN labeled cells between sham and mTBI mice and across the 2d and 14d time-points (p > 0.05) (Figure 4C). We next examined for neuron-specific c-fos expression changes by again analyzing c-fos/NeuN double labeling. mTBI mice exhibited significantly higher c-fos/NeuN double-labeling compared to sham animals at 2d following injury (p < 0.0001) (Figure 4D). A two-way ANOVA revealed significant main effects of injury (n = 21, F1,17 = 9.377, p < 0.05) and experimental time point (F1,17 = 30.00, p < 0.0001), but no interaction between the two factors (F1,17 = 2.246, p > 0.05) (Table 1). Further, mTBI animals also expressed more c-fos/NeuN double-labeling in the NAc at 2d compared to 14d following mTBI (p < 0.05) (Figure 4D). At the 14d time point c-fos/NeuN double-labeling remained significantly elevated in the NAc compared to sham animals (p < 0.05) (Figure 4D). This is in contrast to the results from the SpVc and SSp where c-fos/NeuN levels had returned to near baseline by 14d after the mTBI.

mTBI induces increased c-fos expression in nucleus accumbens (NAc) neurons at two days following mTBI, which is reduced but remains elevated 14 days following mTBI. (a) Timeline of mTBI induction and immunohistochemical tissue collection procedures in adult male and female C57 mice (n = 21 animals); (b) Schematic depicting tissue collection regions, where the NAc is highlighted in blue and red dashed squares indicate regions where cell density was analyzed. (c) Representative images of fluorescent c-fos/NeuN double-labeling 2d (left) vs 14d (right) following sham (top) or mTBI (bottom) injuries. scale bar = 50 µM; white arrow = c-fos/NeuN double-labeled cell. (d) Quantification of c-fos labeling. C-fos labeling is significantly increased in the NAc of animals subjected to mTBI compared to sham animals at two days (2d) following mTBI. Mice subjected to mTBI also showed significantly higher c-fos expression in NAc two days (2d) compared to 14 days (14d) following mTBI (****p < 0.0001, **p < 0.005). (e) Quantification of NeuN labeling in NAc of mTBI compared to sham animals. There was no significant difference in NeuN labeling in NAc neurons in mTBI mice compared to sham mice at 2d or 14d after injury and (f) Quantification of c-fos/NeuN double labeling in the NAc of mice subjected to mTBI or sham injuries at 2d or 14d following injury. Note c-fos/NeuN double-labeling is significantly increased in the NAc in mTBI animals compared to sham animals at both the 2d and 14d time-points. Additionally, c-fos/NeuN double-labeling in mice subjected to mTBI is significantly higher at 2d compared to 14d following mTBI (***p < 0.001, *p < 0.05).
Experiment 3: Effect of bright light stress on neural activation in the PPTH phase of mice subjected to mTBI
Based upon our current and previous work exposure to known headache triggers, including stress (i.e. BLS) induces pain-like behaviors in mTBI but not sham animals (Figure 1) (35,36). We examined c-fos based neural activation following BLS in the PPTH phase of animals subjected to mTBI or sham procedures. Specifically, all experimental mice were subjected to mTBI or sham injuries and 14 days later they were exposed to bright light stress (BLS, 1000 lux for 15 minutes). Mice subjected to mTBI were then euthanized at 2 h, 4 h, (or 24 h after BLS exposure, and sham mice were euthanized at 2 h after BLS exposure, and brains were collected for immunohistochemical processing to examine for c-fos/NeuN double-labeling as described above. An experimental timeline of this procedure is depicted in Figure 5A.
Bright light stress (BLS) induces significantly increased c-fos expression in SpVc at two and four hours following BLS exposure. (a) Timeline of mTBI induction, bright-light stress (BLS) exposure (1000 lux, 15 minutes) and subsequent immunohistochemical tissue collection procedures. Adult male and female C57 mice were subjected to 15 min of BLS at 14 days post-mTBI induction. Mice were sacrificed and perfused 2 h (n = 6), 4 h (n = 5), or 24 h (n = 6) following BLS and brain tissue collected for immunohistochemical procedures. (b) Representative image of fluorescent c-fos/NeuN double-labeling in sham animals 2 h following BLS exposure; bar = 100 µM; white arrow: c-fos/NeuN double-labeled cell. (c) Representative images of fluorescent c-fos/NeuN double-labeling at 2 h (left), 4 h (middle), or 24 h (right) following exposure to BLS; bar = 100 µM; white arrow: c-fos/NeuN double-labeled cell. (d) Quantification of c-fos labeling indicating a significant increase at 2 days following mTBI compared to 24 h following BLS exposure at the 14d time-point (BLS + 2 h) (****p < 0.0001). (e) Quantification of NeuN labeling. There is no significant difference in NeuN labeling between any of the time-points (p > 0.05) and (f) Quantification of c-fos/NeuN double-labeling indicating significantly increased double-labeling at 2 h following BLS compared to the 14d time-point with no BLS exposure. C-fos/NeuN double-labeling is also significantly increased at two hours following BLS (BLS + 2 h) compared to 24 h following BLS exposure (BLS + 24 h) (****p < 0.0001, *p < 0.05).
BLS induces increased c-fos expression in neurons of the primary somatosensory cortex of mice subjected to mTBIs. (a) Schematic depicting tissue collection regions, where the SSp is highlighted in blue. (b) Representative image of fluorescent c-fos/NeuN double-labeling in sham animals 2 h following BLS exposure (n = 5; bar = 100 µM. (c) Representative fluorescent cortical slice images of BLS mice 2 h (n = 5; left), 4 h (n = 5; center), or 24 h (n = 3; right) following BLS exposure. (d) Quantification of c-fos labeling in the SSp. c-fos expression in the SSp trended to increase at two hours following BLS (BLS + 2 h) compared to the 14d time-point without BLS (14d)(p = 0.0631). c-fos expression in mTBI animals at two hours following BLS (BLS + 2 h) was significantly increased compared to sham animals following BLS (Sham + BLS) and compared to 4h following BLS (BLS + 4 h) (***p < 0.001, **p < 0.005) (e) Quantification of NeuN labeling in the SSp following BLS. There was no significant difference in NeuN labeling of the SSp across all time-points or BLS exposure (p > 0.05) and (f) Quantification of Fos/NeuN double-labeling in the SSp. Fos/NeuN double-labeling is significantly higher in mTBI animals at two hours following BLS (BLS + 2 h) compared to sham animals following BLS (Sham + BLS) and compared to 4 h following BLS (BLS + 4 h). In addition, BLS induces significantly higher Fos/NeuN double-labeling 2 h following BLS exposure compared to the 14d time-point without BLS and the 4 h time-point (****p < 0.0001, ***p < 0.001, **p < 0.005).
A transient increase in neuronal activation is observed across multiple pain relevant brain regions in the PPTH phase
Exposure to BLS in mTBI animals at day 14 post-mTBI in the PPTH phase consistently induced an increase in c-fos expression across multiple brain regions. Similar to the results at the 2d time-point in the APTH phase, brain regions with significant c-fos expression induced by BLS in the PPTH phase included the SpVc, the SSp and the NAc. Details of these results are described below.
Spinal trigeminal nucleus caudalis
The SpVc double-labeling fluorescent immunohistochemistry revealed that, in comparison to 14-day baseline levels, BLS induced a transient but intense increase of c-fos expression in mice previously subjected to mTBI (Figure 5). A one-way ANOVA showed BLS increased c-fos expression in the SpVc within 2 h of exposure that reduced by 4 h and returned to near 14d baseline levels within 24 h (F5,25 = 27.13, p < 0.0001) (Figure 5D, Table 1). While somewhat reduced, there was no statistical difference in NeuN cellular labeling between the groups, indicating no effect of injury or BLS on neural density (p > 0.05) (Figure 5E). In examining double-labeling of c-fos/NeuN expression it was significantly higher 2 h following BLS compared to the mTBI mice at the 14d time-point without BLS (p < 0.05. In addition, mTBI mice subjected to BLS had significantly higher c-fos/NeuN double-labeling 2 h following BLS exposure (BLS + 2 h) compared to 24 h following BLS exposure (BLS + 24 h; p < 0.05; Figure 5F). Furthermore, a majority of the fos+ cells were also NeuN+ across experimental time-points (∼90%), indicating a predominantly neuronal phenotype.
Somatosensory cortex
Fluorescent immunohistochemistry revealed that BLS increased c-fos expression of neurons in the SSp, especially at 2 h following BLS treatment (BLS + 2 h; n = 5) (Figure 7A–D) without any significant changes in NeuN expression (p > 0.05) (Figure 7E). A one-way ANOVA revealed a significant effect of BLS treatment on c-fos/NeuN double-labeling at the p < 0.05 level for the three conditions (F5,17 = 29.89, p < 0.0001) (Figure 7F, Table 1). c-fos/NeuN expression was significantly higher in mTBI mice at 2 h following BLS compared to the mTBI mice at the 14d time-point without BLS exposure (n = 2; p < 0.05) and compared to sham mice with BLS exposure (sham+BLS; n = 5; p = 0.0006). In addition, c-fos/NeuN double-labeling was significantly higher at 2 h compared to 4 h following BLS exposure (BLS + 4 h; n = 5; p < 0.001) (Figure 7F, Table 1).

BLS induces significantly increased c-fos expression in NAc neurons from mice subjected to mTBIs. (a) Schematic depicting tissue collection regions, where the NAc is highlighted in blue and red dashed squares indicate regions where cell density was analyzed. (b) Representative image of fluorescent c-fos/NeuN double-labeling in sham animals 2 h following BLS exposure (n = 5; bar = 100 µM. (c) Representative fluorescent images showing c-fos/NeuN double-labeling in the NAc of mice subjected to mTBIs at (left) two hours following BLS (BLS + 2 h; n = 4); (center) four hours following BLS (BLS + 4 hours; n = 4), or (right) 24 hours following BLS (BLS + 24 h; n = 3) (aca = anterior commissure; VL = lateral ventricle; scale bar = 50 µm). (d) Quantification of c-fos labeling in the NAc following BLS. C-fos labeling is significantly higher 2d following mTBIs compared to 14d following mTBIs. In addition, c-fos labeling is significantly higher at two hours compared to 4 h following BLS (BLS + 2 h vs BLS + 4 h) or compared to sham mice 2 h following BLS (Sham + BLS) or the 14d time-point without BLS exposure (14d) (****p < 0.0001, ***p < 0.001, **p < 0.005, *p < 0.05). (e) Quantification of NeuN labeling following BLS. There was no significant difference in NeuN labeling in the NAc across experimental time-point or BLS exposure (p > 0.05) and (f) Quantification of c-fos/NeuN double-labeling in the NAc following BLS. C-fos/NeuN double-labeling is significantly higher at 2d compared to 14d following mTBIs. In addition, c-fos/NeuN double-labeling is significantly higher at 2 h compared to 4 h following BLS (BLS + 2 h vs BLS + 4 h) and compared to sham mice 2 h following BLS exposure (BLS + 2 h vs Sham + BLS) (****p < 0.0001, ***p < 0.001, **p < 0.005).
Nucleus accumbens
In addition to the SSp and SpVc, fluorescent immunohistochemistry also revealed that BLS increased c-fos expression of neurons in the NAc of mTBI mice (Figure 7A–C). Again, the increase in c-fos expression was largest at the 2 h (n = 4) time-point after BLS and was significantly increased over the 4 h (n = 4) and 24 h (n = 3) time-points (p < 0.01) (Figure 7D). No significant difference in NeuN expression of the NAc was observed across any of the time-points (p > 0.05) (Figure 7E). In examining the neuron specific double-labeling of c-fos/NeuN expression it was significantly higher 2 h following BLS compared to mTBI mice with no BLS exposure at 14d (p < 0.0001) and compared to sham animals 2 h following BLS exposure (n = 5; p = 0.0003) (Figure 7F). A one-way ANOVA revealed a significant effect of BLS treatment at the p < 0.05 level for the three conditions (F5,18 = 16.47, p < 0.0001) c-fos expression was significantly higher at 2 h following BLS compared to both the 4 h (p < 0.001) and 24 h time-points (Figure 7F).
Discussion
Summary
In the present study, we examined the brain areas activated in a clinically relevant model of mild traumatic brain injury (mTBI) during the acute and persistent phases of post-traumatic headache (PTH). Our results show that mTBI in both male and female animals induces a period of acute mechanical allodynia that peaks two to three days after injury and that resolves within 14 days. Our PTH model produces similar results and outcomes as other closed-head injury models (35,36,39,53) with periods of acute PTH behavioral sequalae (allodynia), which transition into a long-lasting persistent phase whereby animals are sensitized and allodynia can be induced by headache “triggers” (e.g. BLS in our model, glyceryl trinitrate (GTN) in other models). Following this acute PTH (APTH) phase, only animals previously subjected to a mTBI displayed sensitivity to the induction of mechanical allodynia by stress, a commonly reported headache trigger. c-fos immunohistochemistry revealed that multiple brain regions are commonly activated across
Development of PTH is the most common symptom following a mild traumatic brain injury (mTBI). Through our previous work we have validated a closed head injury weight drop model that recapitulates the biomechanics of a mTBI in humans without induction of significant neuropathology (34,37,38). In accordance with our previous work, even a single mTBI is capable of inducing acute pain-like behaviors (e.g. mechanical allodynia) (35,36) and pain-relevant pathophysiology (e.g. loss of diffuse noxious inhibitory control [DNIC]) (39). In our PTH model both cephalic and hindpaw allodynia are induced, peak at two to four days after a mTBI, resolve by day 14 and can then be provoked by exposure to stress (bright light stress), a commonly reported migraine trigger (35,36). This is similar to reports from other investigators using closed-head injury mTBI models who show induction of allodynia and long-lasting sensitivity to other migraine triggers (e.g. NTG) (53–56). Of note, models using more restricted head motion (i.e. stereotaxically fixed (57–59) or weight-drop onto a foam pad (60,61) appear less likely to induce hindpaw allodynia which may specifically reflect differences in injury dynamics (e.g. shearing forces, rotational acceleration). The importance of injury dynamics to induction of hindpaw allodynia is supported by recent work by Wattiez et al. in 2021 (62) in which multimodal TBI (with less restricted head motion and acceleration/deceleration forces similar to our PTH model) produced extracephalic (i.e. hindpaw) hypersensitivity that was not observed following a more restricted head motion TBI induced by a weight drop onto a foam pad. Similarly, no sex differences were observed in our PTH model across outcomes similar to findings reported by Wattiez et al., in 2021 (62). This is in contrast to some reports in other TBI and PTH models (60,61), which again may be due to differences in injury dynamics, injury severity (e.g. more severe and non-closed head fluid percussion injuries (63) and/or age and species of animal. While it remains an open question, in contrast to other headache disorders such as migraine that are highly sex-dependent (64–66) the influence of sex on PTH outcome in patients appears less significant to other risk factors (e.g. history of migraine, medication overuse, injury outcome/degree of loss of consciousness) (67).
mTBI induces neural activation in the SpVc, SSp, and NAc during the APTH phase
Examining changes in the expression of the immediate early gene c-fos has been previously shown as an effective means of mapping neural activity across numerous neurological conditions including pain disorders (24,25,29). We therefore employed a similar approach to identify brain regions that display the most robust neural activity across the acute and persistent phases of PTH. Following a mTBI, numerous brain regions are activated by the initial primary injury and ensuing secondary injury processes (68,69). To capture neural activity most relevant to the development of PTH, we carefully chose to first examine for neural activity in the APTH phase at two days after induction of the mTBI for two specific reasons. First, the two-day time-point is outside of the reported temporal window of more widespread direct primary mTBI induced activity that peaks within ∼2 hours after injury before subsiding to baseline levels within 24 hours (30,33,52). Second, the two-day post-mTBI time-point allows capturing of neural activity near the peak of the induced mechanical allodynia. At this two-day post-mTBI time-point we observed significantly higher neural activation (c-fos/NeuN double-labeling) in regions of the SpVc, SSp, and NAc in mTBI versus sham injured animals. This increase returned to baseline levels in the SpVc and SSp by the end of the APTH phase (i.e. day 14 post-mTBI) but remained elevated in the NAc. Of note, in contrast to frequent reports implicating ventral posterolateral (VPL) nucleus and ventral posteromedial (VPM) nucleus of the thalamus in migraine (70,71) and pain processing (13,15) we observed no increase in c-fos expression in either the VPL or VPM. Consistent with our results in this PTH model, previous c-fos based neural activity mapping in migraine models (72,73) similarly reported c-fos increases in SpVc and SSp. However, neither study reported changes in the NAc and therefore this may represent a unique area activated by mTBI induced PTH. Further study directly comparing time-points across PTH and other headache models is needed to directly assess this question.
The SpVc, SSP and NAc have all been previously implicated in the pathophysiology of headache and in pain processing (74–77). Meningeal nociceptive afferents enter the brainstem via the trigeminal tract and pass caudally while giving off collaterals that terminate in the SpVc (13,74,78). In the somatosensory cortex (SSp) studies have shown that cortical regions may be involved in pain modulation through processing of afferent nociceptive information as well as descending pain modulatory projections (76,79) including projections that innervate the deep and superficial layers of the SpVc (76). Within the SpVc itself previous work suggests segregation of pain signaling with superficial layers more involved in acute pain and deeper layers more involved in chronic pain (80,81). While we did not perform a detailed laminar analysis c-fos labeling was observed across SpVc laminae in both after mTBI and BLS. However, this does not rule out the potential of preferential laminar activation within the SpVc that could have an important role across the acute and persistent phases of PTH.
Interestingly, the NAc displayed tonic activation, evidenced by high c-fos/NeuN double-labeling at the two-day time-point, which, while reduced, remained elevated and did not return to baseline by 14 days following experimental injuries. The NAc has previously been implicated in the chronification of migraine, including longer disease duration and higher frequency attacks (82,83), and in the persistence of PTH. The NAc also plays a critical role in anxiety and depression (84–86) that is also frequently reported in approximately 24–27% of adult TBI patients (87–89) and has been shown to be more prominent in patients with PTH (12). As affective disorders may enhance pain severity and increase attention to pain, pain also triggers anxiety and may contribute to a reciprocal feed forward mechanism (90). Further study will be required to directly address the functional role of the activated brain areas.
Brain regions activated during APTH can be reactivated during provoked PPTH attacks
As previously reported, stress can act as a “trigger” or “aggravator” of PTH (6,91). Exposure of rodents to bright light is a well-established mechanism of inducing acute stress (35,36,39,92,93). As with other common pre-clinical headache “triggers” (e.g. GTN (60,94,95), umbellulone (96,97), BLS is therefore an experimental method of inducing headache by targeting a known and clinically reported sensitivity in headache patients. Similar to what we have previously published (35,36,91), following the APTH phase (>14 days post-mTBI)
Limitations
This study identifies brain areas of enhanced neural activity (i.e. increased c-fos expression) at time-points of demonstrated acute and persistent PTH pain-like behavior. Important limitations of this study include that, while highly selective, the use of a c-fos antibody and immunostaining has detection limits. Important brain regions to the PTH process may have been activated but remained below the antibody or imaging detection threshold. Similarly, while c-fos is validated as a detector of neural activity and nociception, it is possible that some neurons fail to elicit a change in c-fos expression or their activity engages other IEGs (e.g. pERK, Arc). As noted, we also carefully chose time-points across the APTH (i.e. two days post-mTBI) and PPTH (i.e. 14 days post-mTBI) timeline to maximize detection of behaviorally relevant PTH specific neural activity and minimize capturing c-fos activity driven by the primary mTBI itself that is generally reported to have subsided within the first 24 hours (30,33,52). However, it remains possible other brain regions were activated outside of the tested time-points and/or the detected activity may not be specific to production of PTH and drive other non-PTH sequelae of mTBI. Finally, this study was focused on identifying neural activity changes in the brain but other regions including the spinal cord and peripheral nervous system may be important to the development of PTH, especially central sensitization and development of hindpaw allodynia.
Conclusions
In this study we undertook immediate early gene (IEG) based immunohistochemistry to identify brain regions with peak neural activity across the APTH and PPTH phases. Here, we found that mTBI in both males and females induces a period of acute and persistent cutaneous allodynia. Accompanying these periods of allodynia in
Article highlights
c-fos immunohistochemistry is effective at defining brain regions activated across the development of mTBI induced PTH.
Brain areas implicated in pain processing, including the SpVc, SSp and NAc are uniquely activated in both the APTH and PPTH phases.
Activity in the SpVc, SSp and NAc mirrored the timing of PTH induced allodynia suggesting their potential involvement in the production of PTH-related pain behaviors.
Supplemental Material
sj-pdf-1-cep-10.1177_03331024231217469 - Supplemental material for Identification of brain areas in mice with peak neural activity across the acute and persistent phases of post-traumatic headache
Supplemental material, sj-pdf-1-cep-10.1177_03331024231217469 for Identification of brain areas in mice with peak neural activity across the acute and persistent phases of post-traumatic headache by Megan Rudolph, Caroline Kopruszinski, Chen Wu, Edita Navratilova, Todd J. Schwedt, David W. Dodick, Frank Porreca and Trent Anderson in Cephalalgia
Supplemental Material
sj-pdf-2-cep-10.1177_03331024231217469 - Supplemental material for Identification of brain areas in mice with peak neural activity across the acute and persistent phases of post-traumatic headache
Supplemental material, sj-pdf-2-cep-10.1177_03331024231217469 for Identification of brain areas in mice with peak neural activity across the acute and persistent phases of post-traumatic headache by Megan Rudolph, Caroline Kopruszinski, Chen Wu, Edita Navratilova, Todd J. Schwedt, David W. Dodick, Frank Porreca and Trent Anderson in Cephalalgia
Footnotes
Declaration of conflicting interests
The authors declared no potential conflicts of interest with respect to the research, authorship, and/or publication of this article.
Funding
The authors disclosed receipt of the following financial support for the research, authorship, and/or publication of this article: National Institute of Health, NINDS, R01 NS114888 and Department of Defense, PRMRP, PR180415.
References
Supplementary Material
Please find the following supplemental material available below.
For Open Access articles published under a Creative Commons License, all supplemental material carries the same license as the article it is associated with.
For non-Open Access articles published, all supplemental material carries a non-exclusive license, and permission requests for re-use of supplemental material or any part of supplemental material shall be sent directly to the copyright owner as specified in the copyright notice associated with the article.