
Abstract
Background
Our prior work demonstrated that questionnaires assessing psychosocial symptoms have utility for predicting improvement in patients with acute post-traumatic headache following mild traumatic brain injury. In this cohort study, we aimed to determine whether prediction accuracy can be refined by adding structural magnetic resonance imaging (MRI) brain measures to the model.
Methods
Adults with acute post-traumatic headache (enrolled 0–59 days post-mild traumatic brain injury) underwent T1-weighted brain MRI and completed three questionnaires (Sports Concussion Assessment Tool, Pain Catastrophizing Scale, and the Trait Anxiety Inventory Scale). Individuals with post-traumatic headache completed an electronic headache diary allowing for determination of headache improvement at three- and at six-month follow-up. Questionnaire and MRI measures were used to train prediction models of headache improvement and headache trajectory.
Results
Forty-three patients with post-traumatic headache (mean age = 43.0, SD = 12.4; 27 females/16 males) and 61 healthy controls were enrolled (mean age = 39.1, SD = 12.8; 39 females/22 males). The best model achieved cross-validation Area Under the Curve of 0.801 and 0.805 for predicting headache improvement at three and at six months. The top contributing MRI features for the prediction included curvature and thickness of superior, middle, and inferior temporal, fusiform, inferior parietal, and lateral occipital regions. Patients with post-traumatic headache who did not improve by three months had less thickness and higher curvature measures and notably greater baseline differences in brain structure vs. healthy controls (thickness: p < 0.001, curvature: p = 0.012) than those who had headache improvement.
Conclusions
A model including clinical questionnaire data and measures of brain structure accurately predicted headache improvement in patients with post-traumatic headache and achieved improvement compared to a model developed using questionnaire data alone.
Keywords
Introduction
Post-traumatic headache (PTH) is one of the most common symptoms following mild traumatic brain injury (mTBI) (1). Whereas for some patients headaches resolve quickly, for others, PTH can continue for months or years, causing significant disability and health care burden (2,3). This uncertainty about headache recovery adds to patient anxiety and is problematic for clinicians when determining treatment strategies.
Previously we investigated the utility of clinical questionnaire answers for predicting headache improvement/non-improvement for patients with acute PTH. Our results indicated that trimming down an extensive headache questionnaire battery to only three questionnaires that assess psychosocial symptoms (Sports Concussion Assessment Tool-symptom checklist, Pain Catastrophizing Scale, and the Trait Anxiety Inventory Scale [4–8]) achieved reasonable cross-validation accuracy for predicting headache improvement at three months (0.72 AUC) and at six months (0.77 AUC) following mTBI (9).
The objective of this follow-up study was to determine whether the prediction accuracy for headache improvement/non-improvement at three months and at six months could be improved when combining these three questionnaire subscores and summary scores with measures of regional brain volume, thickness, mean curvature, and area from T1-weighted magnetic resonance imaging (MRI). In addition, we investigated the accuracy of imaging and questionnaire data for predicting individuals’ headache patterns (or headache trajectories) over the first three months post-enrollment. We included a healthy control cohort in this study to interpret group differences in the brain structure components derived from MRI data between those who had headache improvement and those who did not have headache improvement.
Methods
Subject enrollment
All individuals were enrolled from the Mayo Clinic in Arizona or the Phoenix VA Health Care System between 2019-2022. Participants provided written informed consent prior to participation. All participants were between the age of 18–70. Inclusion/exclusion criteria for PTH: Individuals were enrolled between 0–59 days post-mTBI. Individuals with a history of moderate or severe TBI were excluded from study participation. Consistent with ICHD-3 diagnostic criteria for PTH, those with a history of headache prior to mTBI were eligible for enrollment. All individuals had headaches that began or worsened within seven days of injury and met criteria for acute PTH attributed to mTBI in accordance with the 2018 ICHD-3 diagnostic criteria (10). Criterion B-D were used to phenotype the headaches. Aura was defined using a headache questionnaire. Inclusion/exclusion criteria for healthy controls: Individuals were enrolled during their normal state of health. Occasional tension-type headache (<3 tension-type headaches per month) was allowed. Individuals with history of neurological disorder (including migraine) were excluded. A subset of individuals included in this study were included in prior publications (11), yet this is the primary analysis aimed at predicting headache improvement in individuals with PTH based on clinical questionnaires and imaging data completed within the first couple of months post-mTBI.
Questionnaires
All individuals completed the following three questionnaires at the time of enrollment: the Sports Concussion Assessment Tool (SCAT-5)-Symptom Checklist, the Pain Catastrophizing Scale (PCS), and the TRAIT Anxiety Inventory Scale (5–7). Based on our previously published results (9) the following five variables were the most predictive of headache improvement and were thus included in the models of this study: SCAT-5 Symptom Evaluation: total score and total number of symptoms, PCS: total score and subdomain score for helplessness, and Trait anxiety: total score.
Headache diary
Individuals with PTH completed an electronic daily headache diary over the first three months after enrollment and over 30 days prior to their six-month follow-up visit. The headache diary was used to determine headache improvement/non-improvement at three months and at six months follow-up. Headache improvement was calculated using a novel rule that considered (i) an individuals’ headaches prior to the most recent mTBI (pre-TBI headaches), and (ii) individuals’ headaches after the most recent mTBI (post-TBI headaches). Specifically, an individual with pre-existing headaches before mTBI was considered to have ‘headache improvement’ if the number of additional headaches (i.e., difference between post-TBI headaches and pre-TBI headaches) was reduced by 50% or more, OR if the additional headaches reduced to 2.5 or less at the time of assessment. An individual with no pre-TBI headaches was considered to have ‘headache improvement’ if the individual’s headaches in the first month post-enrollment was reduced by 50% or more at the time of assessment. We refer interested readers to Mao et al. (9) for more details of this algorithm.
In addition to the binary outcome of headache improvement/non-improvement, we aimed to predict individuals’ trajectories of headache frequency over the course of three months post-enrollment. This outcome variable, which we refer to as the headache frequency trajectory, was extracted as a continuous variable as a function of time, yt, for t = 1…84 days (three months). The headache frequency trajectory at time t was computed as the percentage of days with any headaches within the seven-day window starting at day t. The headache frequency trajectory complements the binary headache assessment with more temporal granularity of headache patterns over time.
Image acquisition and post-processing
Imaging was acquired at Mayo Clinic using a 3-Tesla Siemens Scanner (Siemens Magnetom Skyra, Erlangen, Germany) and a 20-channel head coil with the following parameters:
T1-weighted imaging: TE = 3.03 ms, TR = 2400 ms, voxel size = 1 × 1 × 1 mm3, FOV = 256 × 256 mm, flip angle = 8 degrees. T2-weighted imaging: TE = 84 ms, TR = 6800 ms, voxel size = 1 × 1 × 4 mm3, flip angle = 150 degrees. Structural MRIs were reviewed by a Neurologist and Neuroradiologist. Individuals with abnormal imaging (n = 0) were excluded from data analysis.
T1-weighted imaging was post-processed using the ‘recon-all’ pipeline of the imaging analysis software FreeSurfer, Version 7.2 (http://surfer.nmr.mgh.harvard.edu/) (12–16). All T1-weighted imaging was post-processed using a high-performance computing cluster at the National Center for Supercomputing Applications (NCSA). Data were manually checked for post-processing errors prior to inclusion in the final analysis. Left and right hemisphere regional estimates of brain thickness (total number of regions = 68), brain curvature (total number of regions = 68), brain area (total number of regions = 68), and brain cortical and subcortical volume (total number of regions = 86) were automatically extracted from T1-weighted MRI using the FreeSurfer Desikan-Killiany atlas, for automatically segmenting and labeling a total of 290 imaging features. Regional estimates of brain volume and area were adjusted for head size by dividing each measure by the estimated total Intracranial Volume (eTIV) (17).
Statistical analysis
Patient characteristics were summarized by computing the mean and standard deviation for continuous variables and frequency counts for categorical variables. Group differences in age and sex between PTH patients and HC were assessed using two-sided t-test and chi-square test. Significance level of 0.05 was used in all statistical tests. Features extracted from clinical questionnaires and structural MRI were used to develop machine learning models to classify headache improvement and to model headache frequency trajectory, which we discuss in detail next. An overview of our analysis pipeline is shown in Figure 1.

Schematic flowchart of the methodology.
MRI feature modelling
As cohort variabilities of age and sex have an effect on measures of brain structure (17), we used confound regression (18) to remove the brain differences related to age and sex to better study the contribution of imaging features to the prediction of headache improvement. Specifically, imaging data of healthy controls were used to fit a linear regression on each thickness, volume, area, and curvature measure with age and sex as regressors. The estimated regression coefficients were then applied to remove the effect of age and sex from the imaging data of PTH patients. The resulting residuals were used as inputs for machine learning models downstream.
Dimension reduction
In our study, the number of features (290 imaging measures and five questionnaire variables) exceeded the number of participants, which can lead to an overfitted model (19). Thus, partial least squares (PLS) was used to find lower-dimensional and predictive components of the data. PLS is a common method for dimension reduction with capability to handle high-dimensional problems with correlated variables and a limited number of observations (20). Compared to Principal Component Analysis (PCA), PLS can provide more supervision by pooling features into components that are correlated with the classes of cohorts, which is desired given the complexities of structural MRI data. We first standardized imaging and questionnaire variables across the PTH cohort then trained PLS models for questionnaire variables, thickness, mean curvature, volume, and area, respectively. We retained only the first component from each PLS model as inputs into the prediction pipeline because i) the remaining components contain less information about the original data and are less predictive than the first component, and ii) we wanted to minimize overfitting risk by using fewer predictors. Take thickness measures as an example, the thickness component obtained from PLS is a linear combination of original thickness measures and can be interpreted as a ‘super-thickness’. Note that ‘super-thickness’ is not on the same scale as original thickness measures because of standardization. For interpretation convenience, PLS was trained using the headache improvement vs non-improvement label at three months and the same PLS loadings were used in three-month, six-month, and functional regression models. To internally validate the results, PLS was trained via the leave-one-out cross-validation (LOOCV) scheme, i.e., each time the model was trained using all except one patient and applied to the out-of-sample patient.
Prediction model of headache improvement at three and at six months
Logistic regression was used to classify headache improvement/non-improvement using the first PLS component from questionnaire data, the first imaging component, age, sex, and enrollment time post-mTBI (measured in days) as predictors. Logistic regression was chosen because it can provide probabilistic predictions and it is a linear model less prone to overfitting compared to more complex nonlinear models. The rationale for re-including age and sex at the classification stage in addition to the preprocessing stage of structural brain measures is that age and sex may also impact the headache improvement outcome in addition to their effect on brain measures. Prediction models were trained separately for thickness, mean curvature, volume, and area measures to investigate the predictive ability of each imaging modality alone. Then, we pooled imaging measures of the most predictive modalities to obtain the best model. The PLS followed by logistic regression pipeline was trained within the LOOCV scheme and the Area Under the Curve (AUC) was computed over the LOOCV predictions.
Functional regression model of headache frequency trajectory
In addition to classifying headache improvement/non-improvement, we aimed to predict the headache frequency trajectory over the first three months post-enrollment. Function-on-scalar regression was used to model headache frequency trajectory as a functional response, and PLS components, age, sex, and enrollment time post-mTBI as scalar predictors. The imaging component and questionnaire component were modeled with functional coefficients assuming their relationship with headache frequency changes over time. The functional terms of the model were represented using penalized cubic splines with five evenly spread knots (21). Age, sex, and enrollment time post-mTBI were modeled using scalar coefficients. For convenient interpretation of the regression coefficients, age was mean-centered and PLS components were scaled to [0, 1] within the PTH cohort. Functional regression was run using the pffr-function from the refund R package (22).
Group comparison of imaging components
The assumption behind our modeling pipeline is that PLS can find a direction to combine the imaging features such that the resulting component is helpful for or can be used as a biomarker for predicting headache improvement versus non-improvement. To further validate this assumption, we applied the PLS trained on the PTH cohort as described in the previous section to the imaging data of HCs. If the PLS components are predictive of headache improvement, we would expect the components of healthy subjects to be closer to the component of improved PTH than non-improved PTH patients. Thus, we conducted group comparison between imaging components of HCs versus the improved and non-improved subgroups of PTH subjects via two-sided t-test.
Feature contribution analysis
As each PLS component is a weighted combination of original features, the PLS loadings can be interpreted as each original feature’s contribution to the prediction. We considered an original feature to be significantly contributing to the component if its loading was greater than one standard deviation above the mean of all loadings. The loadings of significantly contributing features in a component were then multiplied by the sign of regression coefficient of that component to obtain the direction of contribution to the prediction.
Results
Subject characteristics
A total of 104 participants were enrolled, including 43 individuals with acute PTH (mean age = 43.0, SD = 12.4; 27 females/16 males) and 61 healthy controls (mean age = 39.3, SD = 12.8; 39 females/22 males). There were no significant differences between groups for age (p = 0.145) or sex (p = 0.774). Among the individuals with PTH, 27 patients had a single lifetime mTBI, eight patients had two mTBIs, six patients had three mTBIs, one patient had four mTBIs, and one patient had five mTBIs. The mechanism of the most recent mTBI was as follows: 20 subjects had motor vehicle accidents, 17 subjects had falls, one subject had a sports-related injury, and five subjects suffered mTBIs due to other mechanisms. The timing of PTH onset relatively to the most recent mTBI was less than one hour (n = 22), between 1–9 hours (n = 10), between 10–23 hours (n = 2), between 24–47 hours (n = 5), between 48–71 hours (n = 2) and between 72 hours to seven days (n = 2). Aura was defined using a headache questionnaire. Headache phenotypes of PTH were as follows: 23 patients had migraine-like, nine patients had probable migraine-like, 11 patients had tension-type headache-like. Nine patients reported having aura associated with their PTH. A total of 27 PTH patients reported having headaches prior to their most recent mTBI; 14 patients had migraine, three patients had probable migraine, and 10 patients had tension-type headaches. Nine patients reported aura with their prior headaches. At the three-month assessment, 26 individuals with PTH had headache improvement and 17 individuals did not have headache improvement. At the six months follow-up, 26 of the PTH patients had headache improvement and 13 patients did not have headache improvement. Four patients did not have six-month improvement status due to loss of follow-up or due to individuals not yet having completed their six-month follow-up visit at the time of analysis and were excluded from the six-month model. The clinical characteristics of individuals with PTH are summarized in Table 1.
PTH subject demographics, headache characteristics, and baseline questionnaire scores.
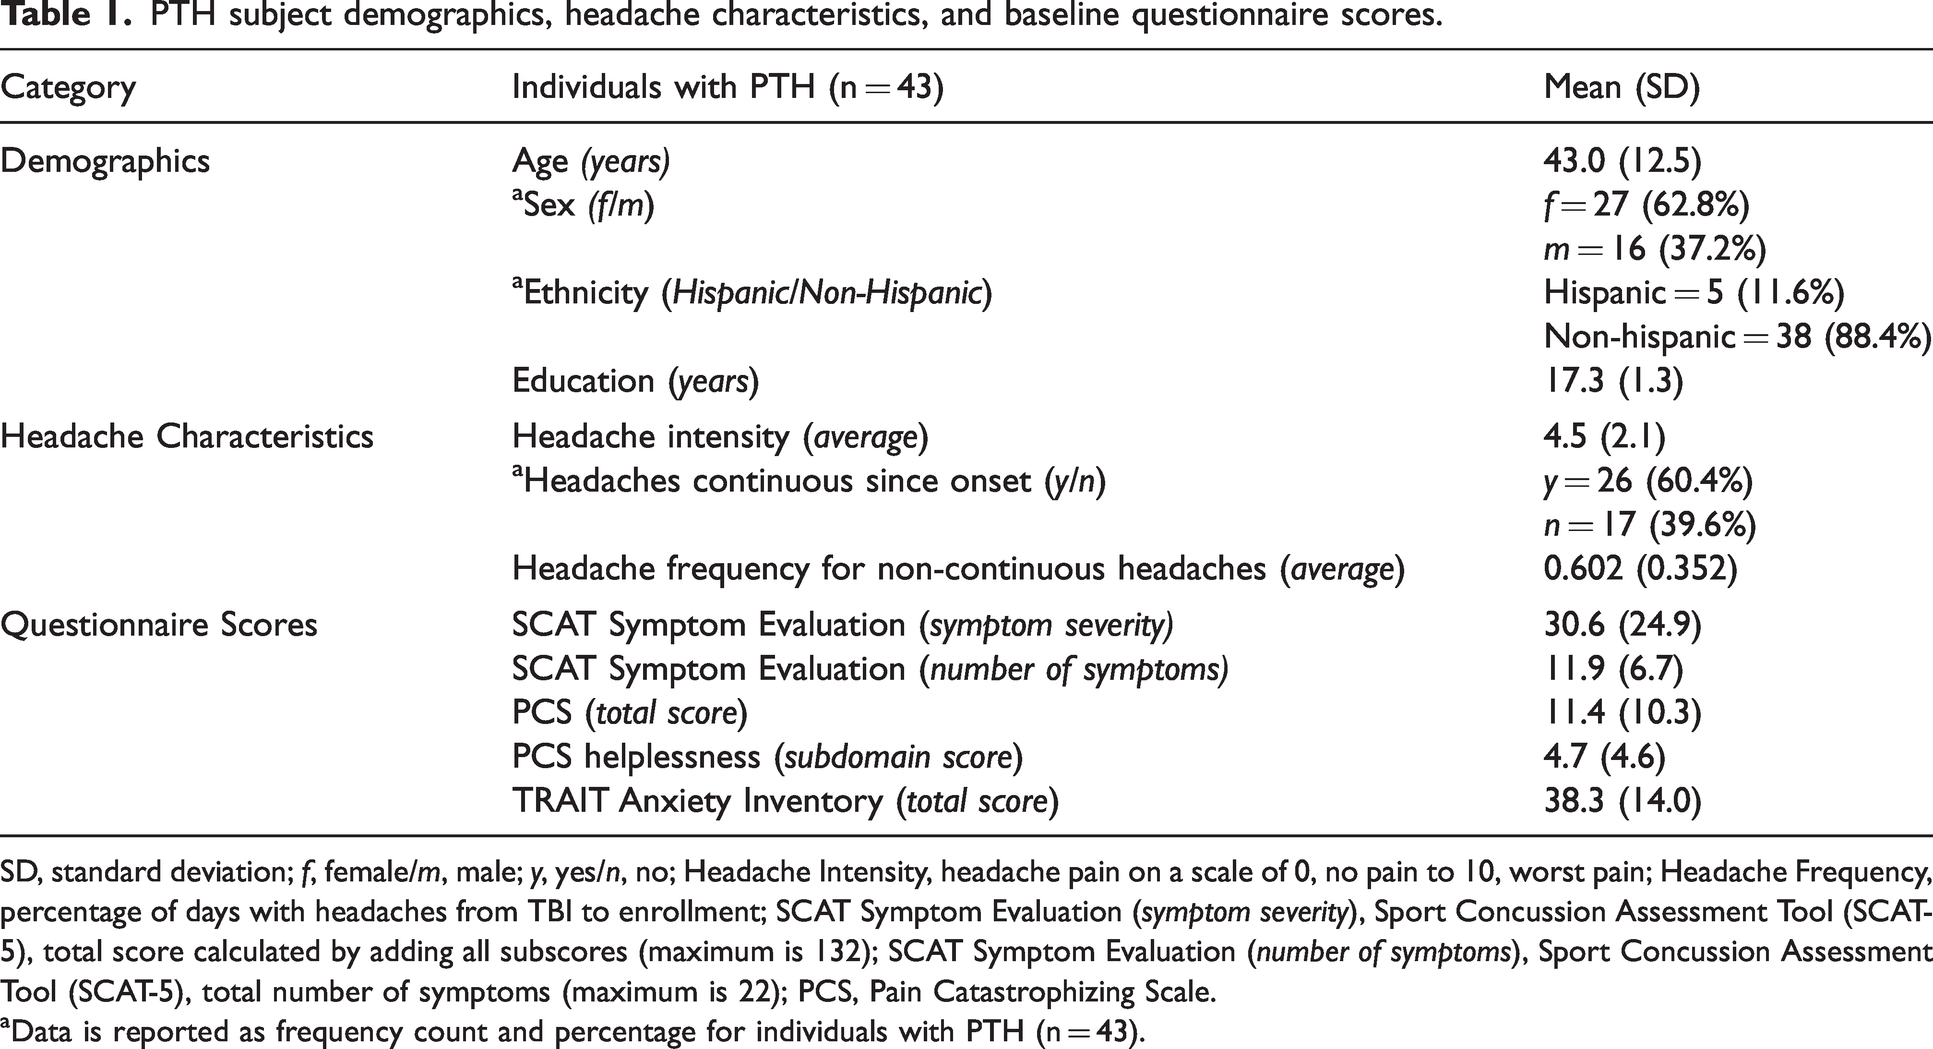
SD, standard deviation; f, female/m, male; y, yes/n, no; Headache Intensity, headache pain on a scale of 0, no pain to 10, worst pain; Headache Frequency, percentage of days with headaches from TBI to enrollment; SCAT Symptom Evaluation (symptom severity), Sport Concussion Assessment Tool (SCAT-5), total score calculated by adding all subscores (maximum is 132); SCAT Symptom Evaluation (number of symptoms), Sport Concussion Assessment Tool (SCAT-5), total number of symptoms (maximum is 22); PCS, Pain Catastrophizing Scale.
aData is reported as frequency count and percentage for individuals with PTH (n = 43).
One individual with PTH had missing headache diary data for one seven-day time window. The headache frequency trajectory at this time point was imputed using linear interpolation of the two windows nearest in time. Two individuals were excluded from the functional regression analysis because they had approximately three weeks of headache diary missing. There were no missing data for the five questionnaire variables.
Prediction accuracy of headache improvement at three and at six months post-enrollment
The prediction model of headache improvement at three months based on the questionnaire component coupled with the component from curvature, thickness, area, and volume features resulted in 0.794, 0.776, 0.629, and 0.548 AUC, respectively (Table 2). The best performing model was the one that used the two most predictive imaging components, i.e., curvature and thickness components, and questionnaire data achieving 0.801 AUC. Similarly, the prediction model of headache improvement at six months based on the questionnaire component together with thickness, curvature, area, and volume components achieved 0.805, 0.731, 0.740, and 0.710 AUC, respectively (Table 3). In both three-month and six-month predictions, adding imaging measures significantly improved the prediction of questionnaire-only models. In the three-month prediction models, the imaging component was a more significant predictor (p < 0.01) than the questionnaire component; whereas in the six-month prediction models, the questionnaire component was the main driver of the improved prediction accuracy (p < 0.01) and the imaging component was a less significant predictor. This is consistent with our previous results that questionnaire data predicted six-month headache improvement better than the three-month improvement (9). Age, sex, and enrollment time post-mTBI were not significant predictors in all models (p > 0.05).
Prediction accuracies for headache improvement at three months.

Result of the best performing model is bolded.
Prediction accuracies for headache improvement at six months.
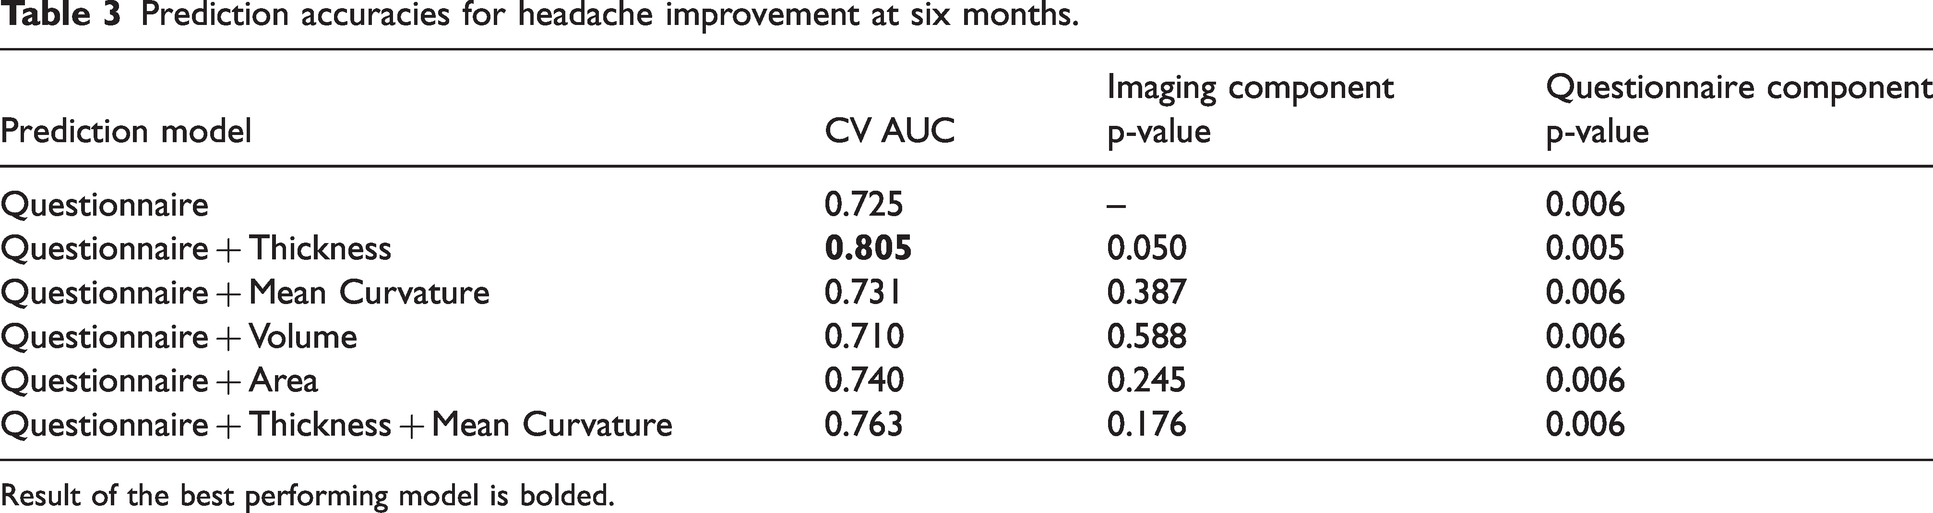
Result of the best performing model is bolded.
Brain regions significantly contributing to the prediction of headache improvement
The significantly contributing regions of curvature and thickness models are shown in Figure 2 and their 3D locations are visualized in Figure 3.

PLS loadings of imaging measures significantly contributing to the (a) Curvature component and (b) Thickness component. Measures are sorted in descending order by the magnitude of their contribution. Color blue indicates contributing in a positive direction with respect to headache improvement, i.e. larger values are predicted with higher probability of headache improvement. The color red indicates contributing in a negative direction with respect to headache improvement, i.e. larger values are predicted with higher probability of headache non-improvement.

Brain regions significantly contributing to the Curvature component (top) and Thickness component (bottom).
Mean curvature model
Fifteen brain regions contributed to the prediction of headache improvement, i.e., higher mean curvature values were predictive of headache non-improvement.
Cortical thickness model
Fourteen brain regions contributed to the prediction of headache improvement, i.e., greater thickness values were predictive of headache improvement.
The top contributing regional estimates for mean curvature and thickness included: superior, middle, and inferior temporal, fusiform, inferior parietal, and lateral occipital regions. The top contributing regional estimates for mean curvature (but not thickness) included: frontal (bilateral precentral, bilateral rostral middle frontal, left superior frontal, left paracentral) and parietal (postcentral) regions, and the top contributing regions for thickness (but not curvature) included temporal (inferior temporal and transverse temporal) and parietal (superior parietal and precuneus) regions.
Group differences for imaging components
The group comparison of thickness and curvature components are visualized in Figure 4. PTH patients without headache improvement had significantly higher mean curvature component (p = 0.002) and lower thickness component (p < 0.001) than PTH patients with headache improvement. Additionally, there were no significant differences (p > 0.05) between the imaging components of HCs and PTH patients who had headache improvement at three months; whereas PTH individuals whose headaches did not improve had significantly lower thickness component (p = 0.012) and higher mean curvature component compared to HCs (p = 0.001). These results show that components found by PLS were helpful for distinguishing headache improvement, and the direction of these components is consistent with the HC cohort whose data were not used during the training of PLS.
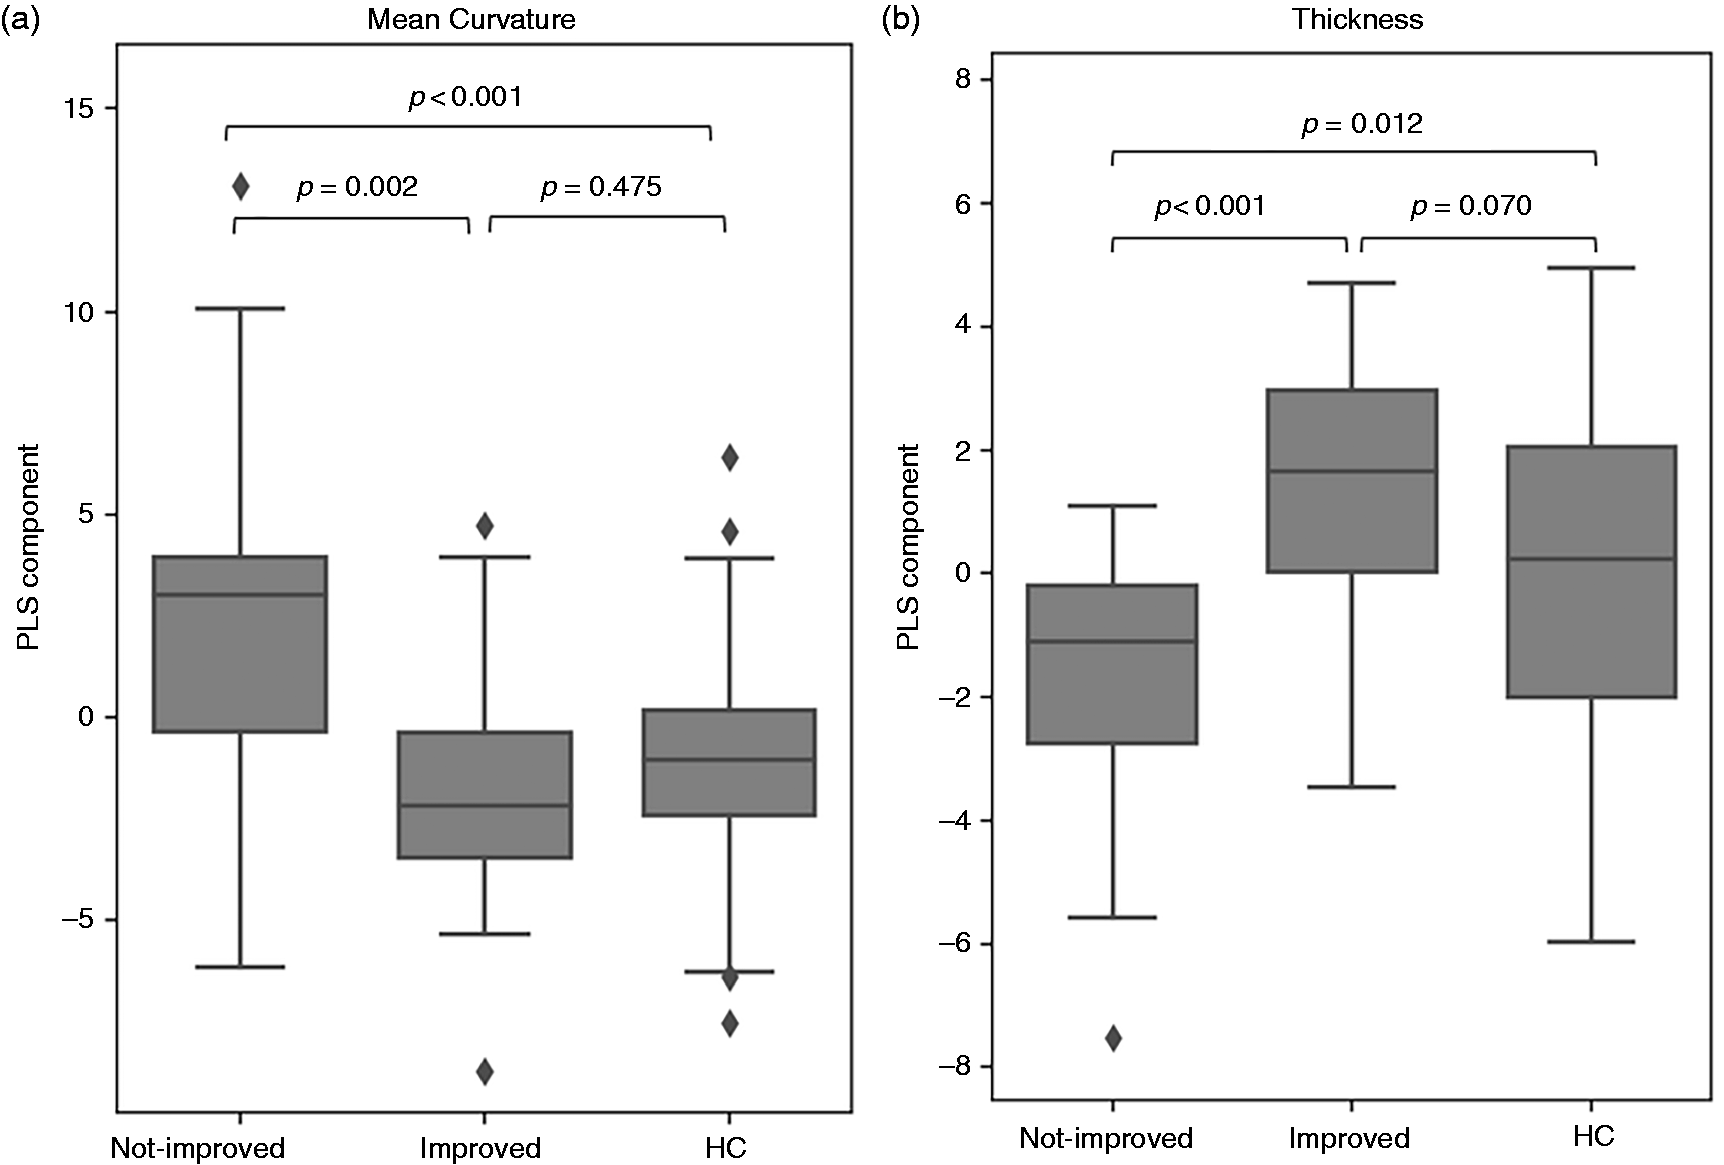
Boxplots and group comparison (two-sided t-test) of (a) Curvature component and (b) Thickness component for individuals with PTH with and without headache improvement at three months post-enrollment. The imaging components found by PLS were helpful to separate PTH patients who had headache improvement and who had not. Those who improved by three months had baseline curvature and thickness measurements similar to healthy controls.
Prediction accuracy robust to hyperparameters
Although only the first PLS component was used as predictor in all models to reduce the risk of overfitting, we conducted an experiment to investigate the extent the prediction accuracy of headache improvement is affected by the number of components. Results showed that adding more components did not improve prediction AUC for the three-month model; and in the six-month model, the simplest model using only one component achieved comparable prediction performance compared to the best possible model (Figure 5).

Performance of prediction models of headache improvement at (a) three months and (b) six months post-enrollment using different number of PLS components. The simplest model using only the first imaging component achieved the best or comparable to the best performance.
Functional regression to model headache trajectory
The functional regression model for predicting patients’ headache frequency trajectory over the course of three months using the questionnaire component and thickness, curvature, volume, and area components achieved adjusted
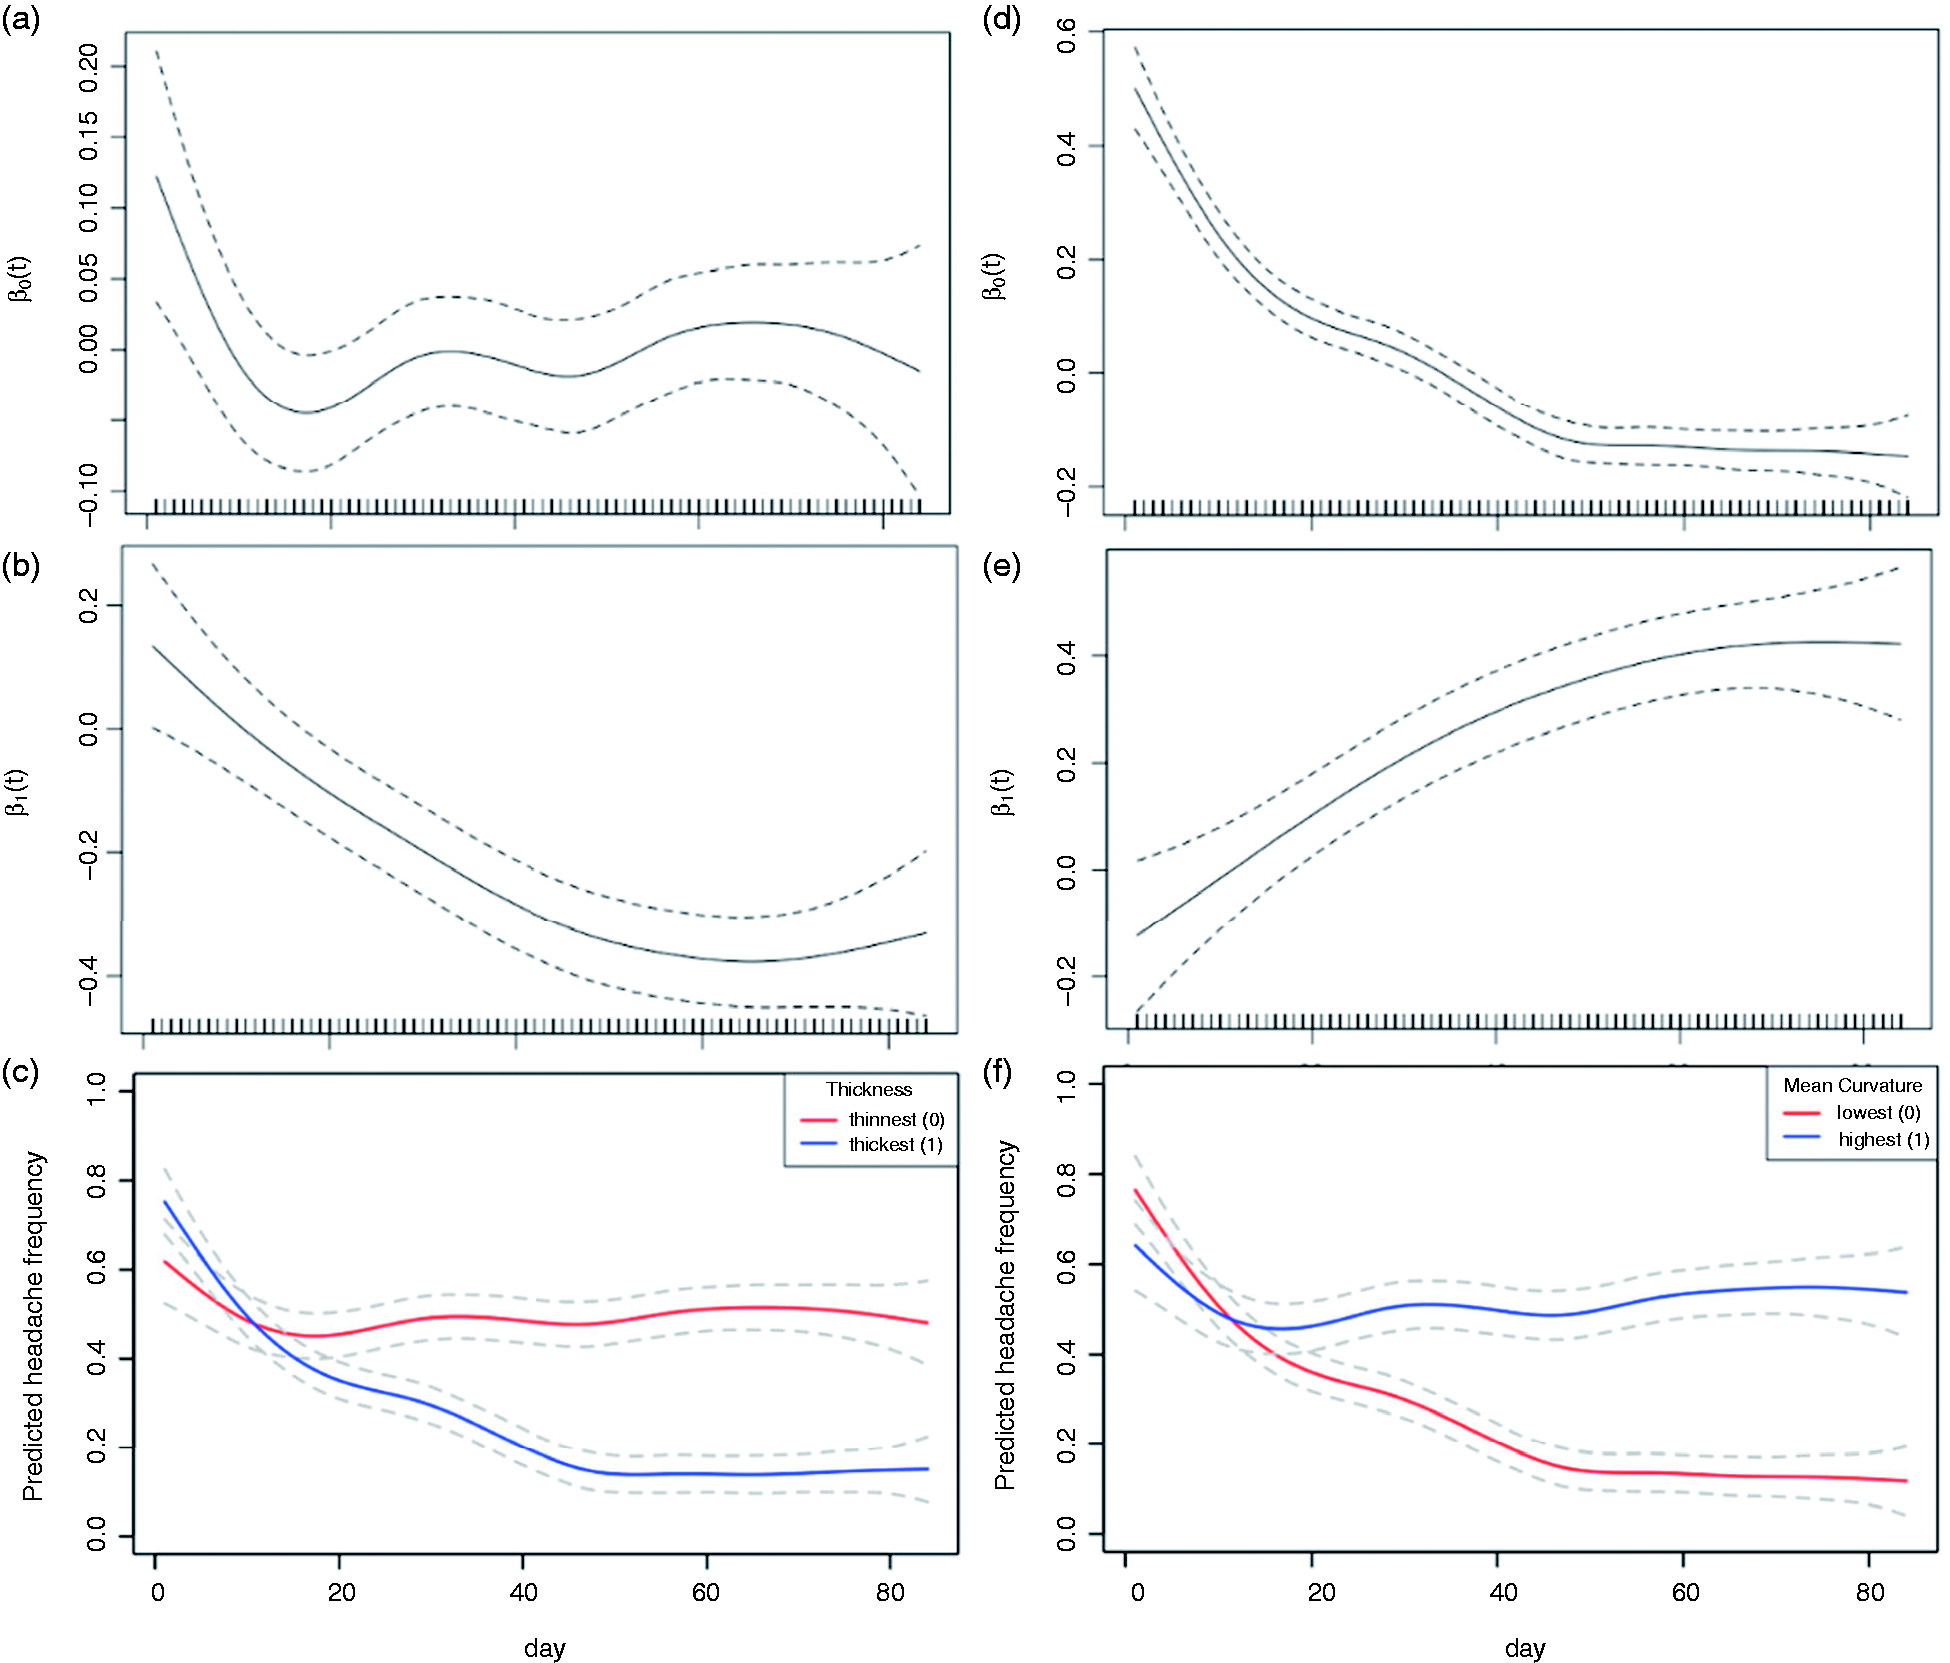
Estimated functional coefficients of the thickness model: (a) time-varying intercept, (b) time-varying coefficient of the thickness component, and (c) predicted headache frequency trajectory comparison for two hypothetical patients of average age, female sex, and average enrollment time but different thickness measures. Estimated functional coefficients of the mean curvature model: (d) time-varying intercept, (e) time-varying coefficient of the mean curvature component, and (f) predicted headache frequency trajectory for two hypothetical patients of average age, female sex, and average enrollment time but different mean curvature measures. Headache frequency was measured as the percentage of days with headaches within each sliding seven-day window. 95% confidence intervals of the coefficients are shown in dashed lines.
Discussion
For patients with PTH, baseline testing (between 0-59 days post-mTBI) which included structural imaging and completion of three clinical questionnaires that assessed psychosocial symptoms predicted headache improvement at three months and at six months following mTBI with an accuracy of 0.801 and 0.805 AUC and adjusted R2of 0.498 for the headache frequency trajectory during the first three months post-enrollment.
The following regional estimates of mean curvature and thickness were most predictive of headache improvement including temporal (superior, middle, and inferior temporal and fusiform), inferior parietal, and lateral occipital regions. Regional estimates of frontal lobe curvature (bilateral precentral, bilateral rostral middle frontal, left superior frontal and left paracentral) but not frontal lobe thickness contributed to the prediction accuracy. Cortical curvature is a measure of how the cortex folds in the surrounding space and alterations in cortical curvature have been demonstrated in several neurological disorders including migraine and TBI (23–26). Results by King et al. (27) showed higher cortical curvature in veterans with TBI compared to heathy controls, resulting in steeper trajectory in sulci and gyri in superior and inferior frontal, precentral and superior and inferior temporal regions. A study by Planchuelo-Gómez et al. (26) found higher cortical curvature in patients with chronic and episodic migraine relative to healthy controls in the left cingulate, right paracentral, right precuneus, and right lateral occipital region and less cortical thickness in the right and left inferior temporal and right fusiform area. These results of less cortical thickness in migraine and steeper cortical curvature in migraine and TBI are in line with our current findings and may suggest involvement of these regions in both mTBI and headache.
Group comparison of component values indicated the PLS was able to find a single-dimensional component that is helpful for distinguishing individuals with PTH improvement from those who did not have PTH improvement. Additionally, p-values of the model coefficients suggest that the questionnaire component was a relatively stronger predictor of PTH improvement at six months, whereas the imaging components were stronger predictors for improvement at three months, suggesting that structural measures can help predict headache improvement during the acute phase after mTBI whereas psychosocial measures from questionnaires are more predictive of headache improvement during the chronic stage of mTBI.
The prediction of PTH persistence is an important goal and several studies have made progress in elucidating the neuromechanisms underlying PTH (28–31). Naugle et al. (29) found that acute PTH pain intensity and pain inhibitory capacity on the conditioned pain modulation test predicted persistent PTH classification as well as greater depression and pain catastrophizing scores in PTH patients tested 1–2 weeks post-mTBI that developed persistent PTH compared to those who did not develop persistent PTH, which are in line with our findings of psychosocial questionnaire domain scores having utility for predicting PTH persistence. Results by Lemme et al. (28) found higher scores on self-reported symptoms of pain-perception and altered functional connectivity using resting-state imaging in regions including frontal, temporal, and cerebellar regions, as well as sub-cortical regions including the amygdala and nucleus accumbens in pediatric patients that had persisting headache compared to those whose headaches resolved after one-month post-mTBI. Pediatric patients with persisting PTH compared to those who had headache resolution had weaker functional connectivity between the occipital pole and frontal-parietal connectivity and stronger functional connectivity between the frontal-parietal and salience network. A study by Niu and colleagues (30) found that connectivity strength between the periaqueductal gray and regions of the default mode network (right precuneus and right inferior parietal lobule) predicted patients with persistent PTH three months after mTBI. Holmes and colleagues (31) compared pediatric patients with PTH to age-balanced healthy controls to assess the accuracy of distinguishing individuals with PTH from healthy controls using questionnaire data and regional brain cortical and subcortical volume measures (FreeSurfer version 5.3). Authors reported the highest prediction accuracy score of 0.85 in a model that included three questionnaires (Pediatric Pain Screening Test, Fear of Pain Questionnaire, Pain Catastrophizing Scale) and regional brain volume measures including the caudal middle frontal, cuneus, entorhinal, fusiform, parahippocampal, temporal pole, caudal anterior cingulate and superior temporal sulcus.
The study had several limitations. We purposely enrolled individuals between 0-59 days post-mTBI to achieve enrollment success. Within this two-month range, individuals that were enrolled after a longer interval post-mTBI are more likely to develop PTH persistence compared to individuals that had an earlier enrollment time post-mTBI. We tried to account for this heterogeneity using enrollment time post-mTBI as a covariate in the prediction models. Additionally, four out of the 43 PTH patients did not have six-month improvement status, which were due to loss of follow-up or due to individuals not yet having completed their six-month follow-up visit at the time of analysis. Furthermore, despite the internal measures taken to avoid overfitting, future studies using larger sample size and an external test dataset should be used to validate the findings and explore more complex models to leverage the prediction power of high-dimensional structural imaging measures.
Conclusion
This study developed prediction models for the prognosis of headache improvement/non-improvement for patients with aPTH attributed to mTBI. Using questionnaire data only, the logistic regression yielded an accuracy of 0.681 and 0.725 AUC for predicting headache improvement at three and at six months and the functional regression model for predicting headache trajectory yielded an adjusted R2 of 0.419. Results of our present study which included a larger patient cohort show that combining questionnaire with structural imaging data improved the accuracy of headache improvement prediction at three months and at six months to 0.801 and 0.805 AUC, and of headache trajectory to adjusted R2 of 0.498. These results suggest that structural measures of thickness and curvature and targeted questions pertaining to psychosocial symptoms following mTBI are useful for predicting PTH improvement at three and six months.
Clinical implications
Patients with acute PTH who do not have headache improvement at three-months post-mTBI have less cortical thickness and steeper brain curvature. Clinical questionnaire data and measures of brain structure accurately predicted headache improvement in patients with PTH at three months following mTBI with an accuracy of 0.801 AUC.
Footnotes
Acknowledgments
We are grateful to the study participants and coordinators for their dedication to this project.
Declaration of conflicting interests
The authors declared the following potential conflicts of interest with respect to the research, authorship, and/or publication of this article: Lingchao Mao, Jing Li, Devin Nikjou, Teresa Wu, and Katherine Ross declare no competing interests. Gina Dumkrieger declares research funding from Amgen and American Brain Foundation. Catherine Chong has received research funding from Amgen, National Institutes of Health, and US Department of Defense. Visar Berisha is co-founder and has equity in Aural Analytics, Inc. Within the last 12 months, Todd Schwedt has served as a consultant for Abbvie, Allergan, Amgen, Axsome, Collegium, Eli Lilly, Linpharma, Lundbeck, Satsuma, and Theranica. He has stock options in Aural Analytics and Nocira. He has received royalties from UpToDate. He has received research funding from: Amgen, American Migraine Foundation, Henry Jackson Foundation, National Institutes of Health, Patient Centered Outcomes Research Institute, and U.S. Department of Defense. He serves on the Board of Directors for the American Headache Society and the American Migraine Foundation.
Funding
The authors disclosed receipt of the following financial support for the research, authorship, and/or publication of this article: This study was funded by the National Institutes of Health, National Institute of Neurological Disorders and Stroke, Award Number 1R61NS113315–01 and the Department of Defense, W81XWH-19-0534.