
Abstract
Introduction
Visual disturbances are the most common symptoms of migraine aura. These symptoms can be described systematically by subdividing them into elementary visual symptoms. Since visual symptoms of migraine aura are not easy to describe verbally, we developed a collection of images illustrating previously reported elementary visual symptoms.
Objectives
To test a standardised visual migraine aura iconography in a large population of migraine with aura patients and to improve it based on the participants’ feedback.
Methods
We created a set of images representing 25 elementary visual symptoms and a web-based survey where participants could report whether they recognised these images as part of their visual aura. Elementary visual symptoms could also be recognised via a corresponding text description or described in a free text by participants. Individuals with migraine aura recruited from four tertiary headache centres (in Switzerland, Denmark, Norway and Italy) were invited to complete the survey.
Results
Two hundred and fifteen participants completed the study (78.9% women, median age 36). They recognised a total of 1645 elementary visual symptoms from our predefined list. Of those, 1291 (78.4%) where recognised via standardised iconography images. A new type of elementary visual symptom was reported by one participant.
Conclusion
Most elementary visual symptoms experienced by participants were recognised via the standardised iconography. This tool can be useful for clinical as well as research purposes.
Introduction
Migraine with aura is a common disorder that affects 8% of the general population (1). Visual disturbances are the predominant symptoms of migraine aura (MA), occurring in 98–99% of MAs (2). These visual disturbances can be categorised into specific elementary visual symptoms (EVSs), such as scotoma, bright dots, and zig-zag lines. Often, multiple EVSs can occur simultaneously during a single visual migraine aura (2). A systematic review of MA-related visual disturbances identified a total of 25 distinct EVSs, with considerable variation among patients (3). Additionally, some EVSs exhibit additional features like intermittence/flickering or varying colours (3). Describing these EVSs verbally or in writing can be challenging for both clinicians and individuals experiencing MA (4).
To address this issue, a standardised set of images, a so-called standard migraine aura iconography (SMAI), is highly needed. Some patients have created visual depictions of their MA-related disturbances, which are freely available online (5). Clinicians can use these images to assist in diagnosing MA. However, these depictions are limited in number and lack standardisation, including a consistent background. Moreover, to our knowledge, visual representations of MA have never been systematically organised and tested within a patient cohort.
The present study had three main objectives: i) to develop and evaluate the recognisability and representativeness of a standardised migraine aura iconography 1.0 (SMAI 1.0) using a large, multicentre, international cohort of individuals with MA, ii) to specifically document the colours and intermittence/flickering quality of EVSs, and iii) to create an improved SMAI 2.0 with updated images based on participant feedback.
Methods
Study design and participants
We conducted an international, multicentre, cross-sectional study with four participating sites across Switzerland (M.V. C.Z., S.S. and C.G.), Denmark (A.H., T.P.D. and M.M.K.), Norway (I.G.W., M.F. and E.T.), and Italy (A.A. and A.P.) from April 2019 to June 2021. Participants were invited to fill out a web-based survey, either via computer or a mobile device, at the end of a routine visit at one of the study sites. The survey took approximately 10 minutes to complete. The survey was created and presented using the software SurveyXact (Rambøll Group A/S, Copenhagen). The study was approved by local ethics committees where required and all participants signed an informed consent form prior to completing the study. Questionnaire data were stored on a high security, encrypted, fully activity-logged server administered by the Center for Information Technology, Capital Region of Denmark. Data storage and handling was approved by the Data Processing Authority of the Capital Region of Denmark (File no. VD-2018-404).
Eligible participants were individuals aged ≥18 years old diagnosed with migraine with aura according to the International Classification of Headache Disorders, 3rd edition (6) and with normal (or corrected-to-normal) vision. Exclusion criteria were inability to understand and complete the survey and last occurrence of MA ≥5 years prior to study participation.
Study size
Each EVS occurs in 1–30% of the MA patients (3). The sample size should be at least twice the minimum number for detecting the EVD with the lowest frequency (1%). We therefore aimed to reach the number of 200 patients to be recruited.
Demographical information and baseline characteristics
Baseline data were collected for all participants including age, sex, body mass index, smoking status, occurrence of headache with MA, age of onset of MA, frequency of migraine attacks with aura, frequency of migraine attacks without aura, duration of visual aura, visual field involvement of visual aura (unilateral or bilateral/crosses midline), intravariability of visual aura (i.e. whether visual auras were identical in every attack or not), family history of migraine with aura and/or migraine without aura, history of arterial hypertension, previous stroke, transient ischemic attack, or other major ischemic events.
Development of a standardised aura iconography
We identified 25 distinct EVSs through a systematic review published previously (3). To create a comprehensive list of written descriptions for these EVSs, we engaged in a consensus process involving three investigators (M.V., A.H., and T.P.D.). These, together with collection of MA depictions of patients reported in papers (7,8) and online (5), were used as the basis for a graphical representation of each EVS with a standardized background and reference images. Graphical representations were edited using Adobe Photoshop (Version 19, Adobe Inc).
To ensure accuracy and consistency, we underwent several iterations, during which the three investigators collaboratively achieved consensus on the graphical depiction of each EVS. The final versions of these images, which can be viewed in Online Supplementary Figure S1, were then included in a web-based survey presented to the participating patients.
Structure of the web-based survey
When participants accessed the web-based survey, they encountered an introductory page available in their preferred language, which included information about the survey’s purpose. The language options included English, Italian, Danish, or Norwegian. Participants were instructed to recall all the various EVSs they had previously experienced during MA episodes. Subsequently, participants were presented with the individual EVS images, one at a time. Each EVS image was accompanied by a reference image displaying a corresponding normal background image, representing normal vision (see Figure 1). If the participant recognised an EVS image as part of their visual aura experience, the survey proceeded to the next EVS image. However, if the participant did not recognise the EVS image, they were then provided with a corresponding written description (EVS text) of the visual disturbance. At this point, participants were asked whether they had ever experienced this particular type of visual disturbance in the past. If participants recognised the EVS text, they were prompted to provide a more detailed description of this visual disturbance using free-text input. Additionally, they were asked to explain how the EVS image differed from their own perception of the visual disturbance. We sought further details regarding EVSs exhibiting positive symptoms (such as zig-zag lines and coloured dots) that participants recognised, whether through images or written descriptions. Specifically, we requested information regarding: i) colour, which participants could select from a list of 14 options, with the possibility of choosing multiple colours; and ii) the intermittent or flickering quality of these symptoms, which we assessed through the following question: “Is it/are they sparkling (like stars or flashing lights) and/or flickering (with rapid movements like the wings of a butterfly)?”

Example of the flow of the web-based survey based on one EVS (named: “bright light”).
An example of the process for a single EVS Is illustrated in Figure 1. After reviewing all the EVS images and EVS descriptions (in cases where the images were not recognised), participants were asked whether they had experienced visual symptoms that were not depicted in the survey images or mentioned in the provided descriptions. If participants acknowledged experiencing such unrepresented symptoms, they were invited to furnish a written description of those symptoms. The visual representation (EVS-i) and its corresponding written description (EVS-t) are provided in Online Supplementary Figure S1 and Supplementary Table S1.
The survey text was developed in English and subsequently translated to Italian, Danish, and Norwegian by researchers from each country. We followed guidelines reported in “Translation, and the preservation of original meaning, of materials developed to improve headache management: Translation Protocol for Hybrid Documents (2nd edition)” (9) to ensure a high quality of translation. The first accepted version of the survey in the four languages was back-translated into English by a translator to check for appropriateness of translation and finally creating the back-checked consensus-based translation for each of the four languages.
Outcomes and statistical analyses
The primary outcome was the proportion of EVSs that were recognised by participants via SMAI 1.0 out of all EVSs reported by participants (either via SMAI 1.0, text recognition or text description). This was calculated as follows: First, we defined the number of “all EVS reporte” for each participant as the sum of A) the number of EVS recognised among the 25 possible EVS images, B) the number of EVS recognised among the 25 corresponding text descriptions, and C) the number of EVS reported as free text. For the purpose of this calculation, we assumed that recognising an EVS image is equivalent to recognising the corresponding EVS text, i.e. that participants have essentially the same visual symptom as part of their aura if they recognise an image as if they recognise the corresponding image. This assumption was made while acknowledging that participants would only be presented with an EVS text description if they replied that they did not recognise the corresponding EVS image as part of their aura and that images and text cannot be considered completely equivalent. For A, B, and C to be summable, we further assumed that the EVS are mutually exclusive, i.e. that no participant uses more than one EVS to describe the exact same visual symptom. Finally, regarding C), we only counted EVS described in free text if we deemed the descriptions substantially different from our existing list of 25 EVS.
As an example, a participant who does not recognise the “bright light” EVS image, but does recognise the “bright light” EVS text description, who recognises the “zig-zag lines” EVS image and no other images or text descriptions, and enters descriptions in free text only of visual disturbances that we deem similar to EVS already on our list, we calculate the number of “all EVS reported” as A + B + C = 1 + 1 + 0 = 2. We note that we here conclude that the participant's free text descriptions correspond to EVS already on our list, despite the fact that the participant did not recognise the descriptions provided in free text among the EVS images or EVS text descriptions.
Following calculation of “all EVS reported”, we calculated the proportion of EVS recognised via SMAI 1.0 (i.e. EVS images) out of “all EVS reported”, i.e. A/(A + B + C).
Secondary outcomes were: i) the proportion of participants recognising at least one EVS via EVS images proposed; ii) the proportion of participants that provided descriptions of new EVSs - not included in the survey; iii) the distribution of recognised EVS according to centre, age and gender.
We further evaluated frequencies of reported colours and flickering/intermittence of EVS with positive features; general features of visual symptoms, including duration, visual field involvement, stereotypy, and co-occurrence of headache and/or somatosensory and/or dysphasic aura; participant descriptions of symptoms not included in the survey; and occurrence of any EVS substantially different from those identified in a prior systematic review of migraine aura visual disturbances (3).
We used descriptive statistics to present survey demographics and outcomes, calculating medians and interquartile range (IQR) or total number and percentage as appropriate. Descriptive analyses were conducted using R statistical software version 4.0.1.
Results
Study population and baseline characteristics
Two hundred and fifteen individuals with migraine with aura completed the study. Of those, 62 (28.8%) were recruited in Switzerland, 70 (32.6%) in Norway, 53 (24.7%) in Denmark and 30 (14.0%) in Italy. Demographics and clinical characteristics of the participants are provided in Table 1.
Demographical and clinical data of 215 patients with migraine with aura.
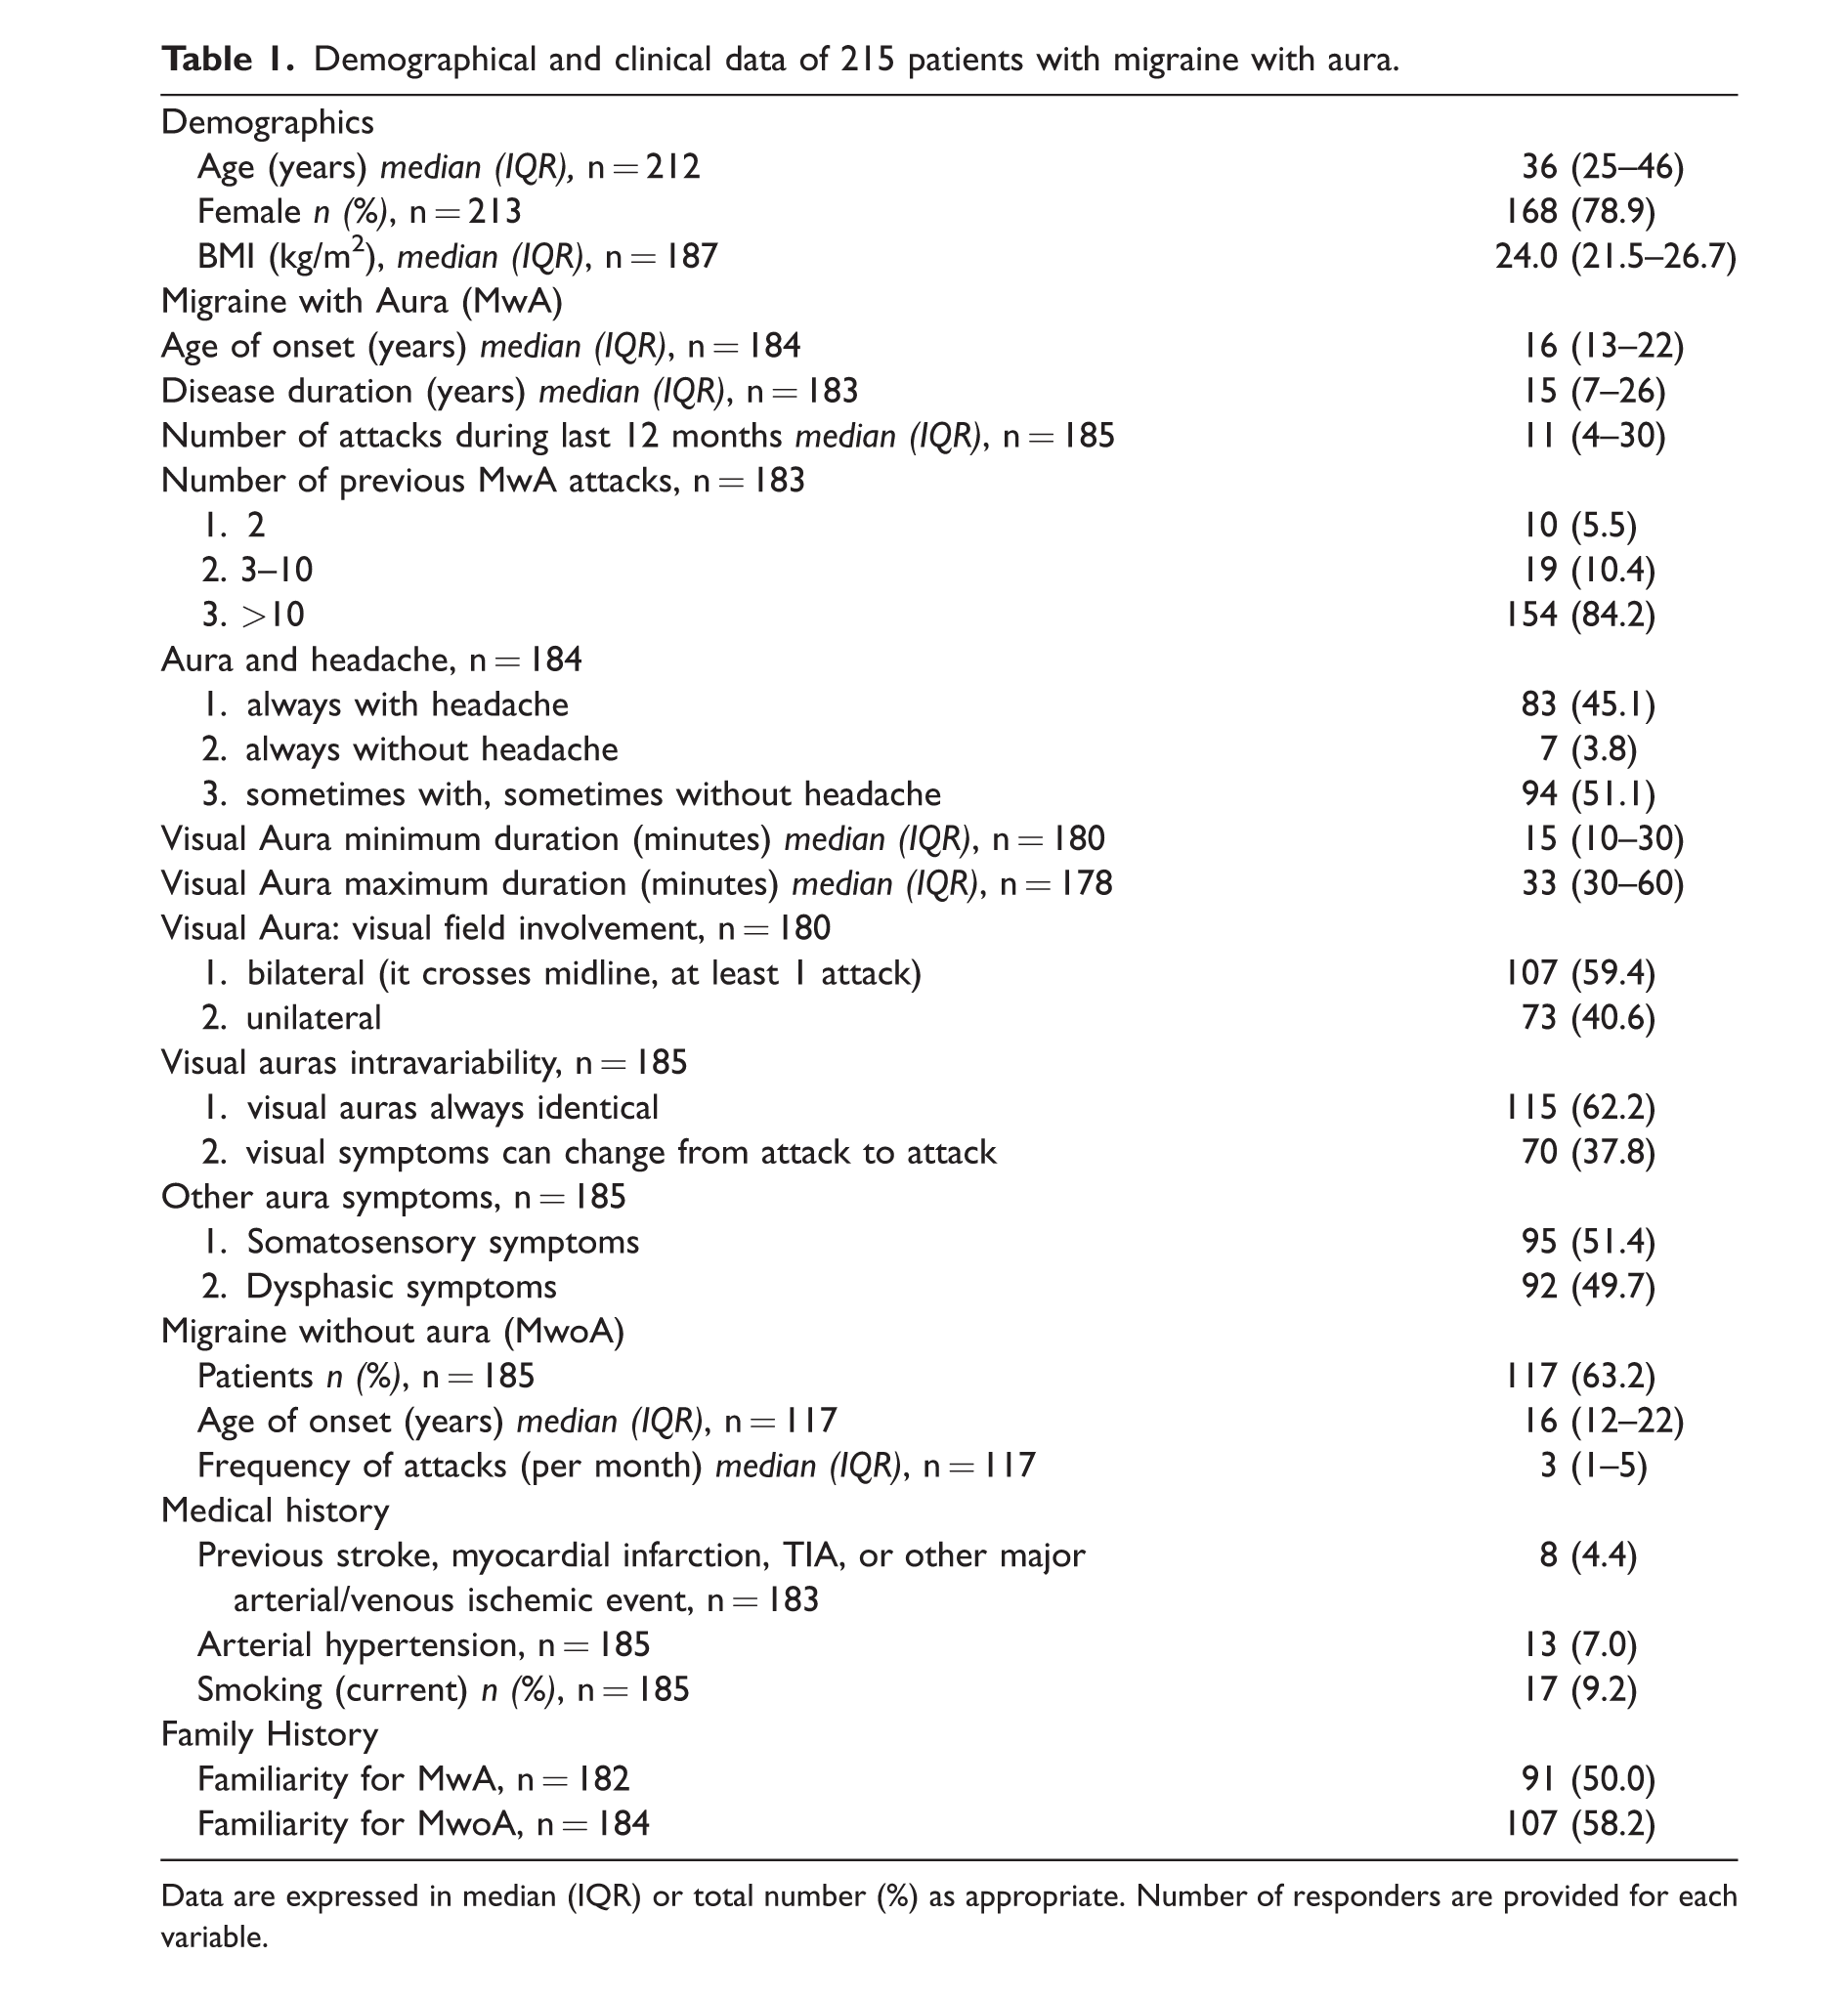
Data are expressed in median (IQR) or total number (%) as appropriate. Number of responders are provided for each variable.
Standardised aura iconography
The 215 participants reported to have experienced overall a total of 1645 EVS (Table 2). Of those, 1291 (78.4%) were recognised via EVS images, while 353 (21.5%) were recognised via EVS text.
Elementary Visual Symptom (EVS) as recognised by 215 migraine with aura patients via images included in the Standardised Migraine Aura Iconography (SMAI) or text descriptions. Patients were first presented with an EVS image. If they did not recognise this as part of their visual disturbances they were presented with a text description of the EVS (EVS-text).

NA, not applicable.
The distribution of recognised EVS was similar according to study site (Switzerland, Denmark, Italy, or Norway), gender, and age group, except for a possible difference in recognising image 2, “blurred vision”, between men and women (16 of 45 men (36%) recognised this EVS compared to 97 of 168 women (58%)) (Online Supplementary Figure S3, S4, S5).
Two-hundred eleven of 215 patients (98.1%) recognised at least one EVS image. Among the remaining four participants who did not recognise any images, three recognised one, two, and four text descriptions respectively, and one participant did not recognise any EVS via images or text descriptions. This participant described his visual aura symptoms as an inability to see the outlines of faces and objects (see description for participant no. 14, Online Supplementary Table S2).
Seventy-eight participants provided text descriptions of EVS which they did not recognise among EVS images nor EVS text descriptions (Online Supplementary Table S2). We considered one of these descriptions, reported by one participant, substantially different from the EVS in our current list. This participant described a “curtains phenomenon” (“similar to tunnel vision, but instead of looking through a circle it was like having two curtains on the sides”), (participant no. 48 in Online Supplementary Table S2).
The remaining descriptions (Supplementary Table S2) did not qualify as new EVS as they included: i) complex visual scenarios consisting of multiple EVSs already present in the survey, ii) EVS already reported in SMAI 1.0 but with a specific localisation in the visual field (different from that depicted in the EVS image), iii) EVS already part of the SMAI 1.0 and for which the participant only added intermittence quality of the image iv) EVS indicating altered distance perception, which actually belongs to higher cortical dysfunctions, v) EVS already included in the SMAI 1.0, but participants did not find that the EVS image or the EVS text described the visual disturbances in a proper way.
The median number of EVS recognised by participants via either image or text description was seven (IQR 4–11) while the median number of EVS recognised via the SMAI 1.0 was five (IQR 3–8).
The three most frequently EVS reported by participants were foggy/blurred vision (62.8%), bright light (50.7%), and small white dots (50.2%).
Prevalence of various colours and intermittent/flickering quality are provided in Table 3. An intermittent/flickering quality was described in most cases in which this aspect was applicable (bright light, zig-zag lines, small bright dots, white dots/round forms, coloured dots, coloured lines, geometrical images, tiny flickering dots, ‘bean-like’ forms, and corona effect). Participants reported specific colours of their EVS where this feature was applicable (zig-zag lines, coloured dots, coloured lines, geometrical images, ‘bean-like’ forms). The most frequently reported colours were generally silver, black, white, and grey. Of non-grayscale colours, yellow was most frequently reported.
Prevalence of additional features of some elementary visual symptoms (EVS): intermittence/flickering quality, and colour.

NA, not applicable.
Based on the results of the present study, we amended the SMAI 1.0, created from an expert consensus, to the SMAI 2.0 including the reported new EVS. Moreover, we optimised some features of EVS images, particularly modifying their colours, based on the participants answers in the survey (EVS n. 3, 8, 9, 10, 13 in Online Figure S1 and S2). Finally, we changed the background image as some participants found it too complex to clearly detect changes related to the EVS. The SMAI 2.0 is available as supplementary material (Online Supplementary Figure S2).
Discussion
In our current study, we conducted the first-ever test to assess the recognisability of a collection of standardised images that depict visual disturbances associated with MA. Our study involved a significant clinical population consisting of participants with migraine with aura, recruited from European tertiary headache centres. We want to highlight that 98.1% of participants in our study were able to identify at least one image from the SMAI 1.0 as representing a visual disturbance they had experienced during their MA episodes. Moreover, nearly 80% of the EVSs recognised by the participants were identified through the SMAI 1.0 images. The distribution of recognised EVS was overall similar according to study site, gender, and age group.
Of note, one participant’s participation led to the identification of a previously unreported EVS, termed the “curtains phenomenon”. These findings highlight the possibility of using a set of pre-defined images constituting a representative proportion of existing visual aura phenotypes in aiding participants in recognising and relating their visual disturbances during MA episodes.
Our findings may help clarify certain characteristics of visual auras that were previously subject to debate. First, our findings revealed that a significant proportion (60%) of participants reported experiencing bilateral visual field involvement during their MA episodes. This aspect had been a topic of discussion in previous clinical studies, with one prospective study and one retrospective study reporting bilateral visual field involvement in at least some MA attacks for 41% and 54% of participants, respectively (2,8). Our findings are contrary to the preconception that aura symptoms are commonly unilateral, a perspective also emphasised in the ICHD-3 criteria (6). Second, we observed a considerable degree of variability among different migraine attacks within the same individuals. Approximately 40% of subjects reported non-stereotypical auras, aligning with findings from another prospective study that utilised diary records (2). Third, for the first time, we systematically examined the occurrence of specific features related to EVSs, such as intermittence/flickering and colour, in a large population of participants. These characteristics hold clinical relevance due to their distinct and easily detectable nature, with a high frequency of occurrence (59% of cases for intermittence/flickering and 88% for colour). Previously, Crotogino et al. (10) assessed the perceived rate of flicker (temporal frequency) observed during visual auras in a small and selected group of 11 individuals with MA. Additionally, Queiroz et al. (11) investigated the colours observed during visual aura, categorising them into three groups: i) black-and-white, ii) black-and-silver and iii) colourful. However, to the best of our knowledge, no prior studies have explored visual auras with the goal of classifying them across a spectrum of 14 distinct colours.
The clinical data we gathered In our present study, along with the identification of new EVS, has enabled us to further develop our SMAI 1.0 into an updated version 2.0 (see Online Supplementary Figure S2). It is important to note that SMAI 2.0 needs to be tested in a further feasibility study. Indeed, we have strong confidence that SMAI 2.0 may have significant and far-reaching implications in both clinical practice and research. This upgraded iconography can support the identification of MA symptoms, not only in neurological contexts but also in broader healthcare settings, such as general practice or gynaecology. Early detection of a history of MA holds particular importance in these fields, particularly for stratifying patients based on vascular risk categories. Furthermore, SMAI 2.0 holds the potential to improve the characterisation of MA patients within clinical settings. It can assist healthcare professionals in better phenotyping MA patients and monitoring potential changes in MA features over time during follow-up. Additionally, in research endeavours, SMAI 2.0 can serve as a valuable tool for standardising patient populations with respect to their MA phenotype allowing for homogenous research cohorts.
Strengths and limitations
Strengths of the present study include a large population of patients, recruited by neurologists with expertise in the headache field and coming from four independent headache centres in different European countries.
The study was limited by recruitment of patients only from tertiary referral centres, which could lead to selection bias. Also, aura symptoms involve dynamic features, such as gradual spreading, that may not be captured by our SMAI 1.0 tool consisting of static images.
Only patients who did not recognise EVS images were asked whether they had experienced the corresponding EVS based on a text description. For this reason, we were not able to determine how well the images and text descriptions corresponded based on the patients’ evaluation.
Finally, patients included in this study are mainly European Caucasian individuals. Therefore, applicability should be tested and validated in other populations, languages, and cultures, particularly in order to promote future visual aura research using this tool.
Conclusions
In conclusion, most of the visual aura disturbances experienced by patients throughout their lives during MA attacks were recognised using the SMAI 1.0. We identified one new, rare EVS of MA and recorded the occurrence of important features of MA such as intermittence/flickering and colour. For the first time, a tested set of images representing the visual aura spectrum phenotypes is available that can be used to describe MA better and more accurately both clinically and in the research setting. Moreover, SMAI 2.0, which needs being tested in a further feasibility study, is a possible practical resource that can enhance the understanding and management of MA across various healthcare disciplines and research domains.
Clinical Implications
Visual disturbances are the most common symptoms of migraine aura (MA) consisting of at least 25 different elementary visual symptoms (EVSs). Most EVSs are not easy to describe, and this may negatively impact prompt diagnosis and proper patient classification in the research setting. We developed a set of aura images representing visual aura basic phenotypes (standardised MA iconography 1.0 – SMAI 1.0), and tested it in large, multicentre international population of MA patients (n = 215). Nearly 80% of the EVSs reported by the participants were identified through the SMAI 1.0, and only 0.3% of patients did not recognise any SMAI 1.0 images as part of their aura. We amended SMAI 1.0 with feedback from patients developing a SMAI 2.0 version. For the first time, a tested set of images representing the visual aura spectrum phenotypes is available and can be used to describe and recognise MA both clinically and in the research setting.
Supplemental Material
sj-pdf-1-cep-10.1177_03331024241234809 - Supplemental material for Visual migraine aura iconography: A multicentre, cross-sectional study of individuals with migraine with aura
Supplemental material, sj-pdf-1-cep-10.1177_03331024241234809 for Visual migraine aura iconography: A multicentre, cross-sectional study of individuals with migraine with aura by Michele Viana, Anders Hougaard, Erling Tronvik, Ingunn Grøntveit Winnberg, Anna Ambrosini, Armando Perrotta, Thien Phu Do, Mohammad Al-Mahdi Al-Karagholi, Mikhail Fominykh, Shairin Sihabdeen, Claudio Gobbi and Chiara Zecca in Cephalalgia
Supplemental Material
sj-pdf-2-cep-10.1177_03331024241234809 - Supplemental material for Visual migraine aura iconography: A multicentre, cross-sectional study of individuals with migraine with aura
Supplemental material, sj-pdf-2-cep-10.1177_03331024241234809 for Visual migraine aura iconography: A multicentre, cross-sectional study of individuals with migraine with aura by Michele Viana, Anders Hougaard, Erling Tronvik, Ingunn Grøntveit Winnberg, Anna Ambrosini, Armando Perrotta, Thien Phu Do, Mohammad Al-Mahdi Al-Karagholi, Mikhail Fominykh, Shairin Sihabdeen, Claudio Gobbi and Chiara Zecca in Cephalalgia
Supplemental Material
sj-pdf-3-cep-10.1177_03331024241234809 - Supplemental material for Visual migraine aura iconography: A multicentre, cross-sectional study of individuals with migraine with aura
Supplemental material, sj-pdf-3-cep-10.1177_03331024241234809 for Visual migraine aura iconography: A multicentre, cross-sectional study of individuals with migraine with aura by Michele Viana, Anders Hougaard, Erling Tronvik, Ingunn Grøntveit Winnberg, Anna Ambrosini, Armando Perrotta, Thien Phu Do, Mohammad Al-Mahdi Al-Karagholi, Mikhail Fominykh, Shairin Sihabdeen, Claudio Gobbi and Chiara Zecca in Cephalalgia
Supplemental Material
sj-pdf-4-cep-10.1177_03331024241234809 - Supplemental material for Visual migraine aura iconography: A multicentre, cross-sectional study of individuals with migraine with aura
Supplemental material, sj-pdf-4-cep-10.1177_03331024241234809 for Visual migraine aura iconography: A multicentre, cross-sectional study of individuals with migraine with aura by Michele Viana, Anders Hougaard, Erling Tronvik, Ingunn Grøntveit Winnberg, Anna Ambrosini, Armando Perrotta, Thien Phu Do, Mohammad Al-Mahdi Al-Karagholi, Mikhail Fominykh, Shairin Sihabdeen, Claudio Gobbi and Chiara Zecca in Cephalalgia
Supplemental Material
sj-pdf-5-cep-10.1177_03331024241234809 - Supplemental material for Visual migraine aura iconography: A multicentre, cross-sectional study of individuals with migraine with aura
Supplemental material, sj-pdf-5-cep-10.1177_03331024241234809 for Visual migraine aura iconography: A multicentre, cross-sectional study of individuals with migraine with aura by Michele Viana, Anders Hougaard, Erling Tronvik, Ingunn Grøntveit Winnberg, Anna Ambrosini, Armando Perrotta, Thien Phu Do, Mohammad Al-Mahdi Al-Karagholi, Mikhail Fominykh, Shairin Sihabdeen, Claudio Gobbi and Chiara Zecca in Cephalalgia
Supplemental Material
sj-pdf-6-cep-10.1177_03331024241234809 - Supplemental material for Visual migraine aura iconography: A multicentre, cross-sectional study of individuals with migraine with aura
Supplemental material, sj-pdf-6-cep-10.1177_03331024241234809 for Visual migraine aura iconography: A multicentre, cross-sectional study of individuals with migraine with aura by Michele Viana, Anders Hougaard, Erling Tronvik, Ingunn Grøntveit Winnberg, Anna Ambrosini, Armando Perrotta, Thien Phu Do, Mohammad Al-Mahdi Al-Karagholi, Mikhail Fominykh, Shairin Sihabdeen, Claudio Gobbi and Chiara Zecca in Cephalalgia
Supplemental Material
sj-xlsx-7-cep-10.1177_03331024241234809 - Supplemental material for Visual migraine aura iconography: A multicentre, cross-sectional study of individuals with migraine with aura
Supplemental material, sj-xlsx-7-cep-10.1177_03331024241234809 for Visual migraine aura iconography: A multicentre, cross-sectional study of individuals with migraine with aura by Michele Viana, Anders Hougaard, Erling Tronvik, Ingunn Grøntveit Winnberg, Anna Ambrosini, Armando Perrotta, Thien Phu Do, Mohammad Al-Mahdi Al-Karagholi, Mikhail Fominykh, Shairin Sihabdeen, Claudio Gobbi and Chiara Zecca in Cephalalgia
Footnotes
Acknowledgements
Liliane Petrini, for EC and administrative support. Anastasia Chernykh helped with images design.
Data availability statement
De-identified data of this study are available from the corresponding author on reasonable request.
Declaration of conflicting interests
The authors declared the following potential conflicts of interest with respect to the research, authorship, and/or publication of this article: A.H. has received honoraria for lecturing and/or writing from Allergan, Novartis, Teva, Lundbeck, and Eli Lilly. He serves as Associate Editor of Headache. A.A. and A.P. received compensation for speaking activities and consulting fees from Novartis, Teva Pharma, Eli-Lilly.
E.T. has received personal fees for lectures/advisory boards: Novartis, Eli Lilly, Abbvie, TEVA, Roche, Lundbeck, Pfizer, Biogen. Consultant for and owner of stocks and IP in Man & Science. Stocks and IP in Nordic Brain Tech. Non-personal research grants from several sources, including EU, Norwegian Research Council, Dam foundation, KlinBeForsk. Commissioned research (non-personal): Lundbeck, Pfizer.
Ente Ospedaliero Cantonale (employer) received compensation for C.Z.’s speaking activities, consulting fees, or research grants from Almirall, Biogen Idec, Bristol Meyer Squibb, Genzyme, Lundbeck, Merck, Novartis, Teva Pharma, Roche.
M.V., T.P.D., M.M.K., M.F., S.S. I.G.W., C.G. declare no conflict of interest.
Funding
The authors received no financial support for the research, authorship, and/or publication of this article.
References
Supplementary Material
Please find the following supplemental material available below.
For Open Access articles published under a Creative Commons License, all supplemental material carries the same license as the article it is associated with.
For non-Open Access articles published, all supplemental material carries a non-exclusive license, and permission requests for re-use of supplemental material or any part of supplemental material shall be sent directly to the copyright owner as specified in the copyright notice associated with the article.