
Abstract
To supplement the traditional ICHD-2 diagnosis for migraine with aura (MA) we developed a diagnostic scale for migraine aura that quantifies the importance of the cardinal characteristics of MA. Since more than 99% of MA patients have visual aura, we developed for simplicity a Visual Aura Rating Scale (VARS). In total 427 patients with MA (ICHD-2) or nonaura visual disturbances were diagnosed in a validated semistructured interview by a trained physician. The patients were separated into a derivation sample and a validation sample. By regression analysis we identified the visual aura characteristics associated with MA in the derivation sample. Based on the identified characteristics we developed VARS and derived a predictive VARS score which was tested in the validation sample. The VARS score is the weighted sum of the presence of five visual symptom characteristics: duration 5-60 min (3 points), develops gradually ≤5 min (2 points), scotoma (2 points), zig-zag lines (2 points), and unilateral (1 point). The maximum score is 10 points. A VARS score of 5 or more diagnosed MA with a sensitivity of 96% (95% CI 92-99%) and a specificity of 98%(95% CI 95-100%) in the derivation sample, and a sensitivity of 91% (95% CI 86-95%) and a specificity of 96% (95% CI 91-100%) in the validation sample. VARS adds evidence based weights to a number of clearly specified characteristics; it is easy to learn, apply and teach and may therefore be a valuable addition to traditional ICHD-2 diagnosis.
Introduction
Migraine with aura (MA) is diagnosed according to the operational diagnostic criteria of the International Classification of Headache Disorders 2nd Edition (ICHD-2) (1). The ICHD-2 criteria for MA were based on aura characteristics selected by the classification committee of the International Headache Society and tested in two large clinical samples (2). The ICHD-2 diagnostic criteria for MA have a high sensitivity and specificity compared to MA diagnosed according to ICHD-1. Because of their explicit nature, they are presumed to have a higher reliability than the ICHD-1 criteria (2, 3). In other fields such as psychiatry, it has been useful to supplement clinical diagnoses with diagnostic rating scales. A rating scale that takes the operationalization of ICHD-2 for MA further may prove valuable when differentiating migraine aura from nonspecific visual disturbances or photophobia. The aim of the present study therefore was to develop a diagnostic scale for migraine aura intended for use in research studies and drug trials. Since approximately 99% of patients with MA have visual aura at least in some attacks (4–7) and since the presence of other aura symptoms and a headache related to the aura are variable features in MA (4, 5), we based the scale exclusively on the visual aura symptoms. By regression analysis of empirical data we identified the various visual aura characteristics associated with an outcome diagnosis of MA. We then developed the Visual Aura Rating Scale (VARS) based on the identified aura characteristics and tested it in an independent sample. We used the largest material of MA patients so far diagnosed by a trained physician in a validated, semistructured telephone interview.
Material and methods
Data collection
The present material was collected for use in clinical and genetic research (2–4, 8–10). Two sources of ascertainment were used: from the National Patient Register of all hospitalized patients, we extracted records of all patients admitted to hospital or seen as outpatients at a department of neurology or paediatrics in a Danish hospital in the years 1994–97 and discharged with a diagnosis of MA or migraine with complication (ICD 10 diagnosis DG431 or DG433) Furthermore, we screened more than 27 000 case records, in the period 1997–99, from headache clinics and practising neurologists in Denmark. A total of 1831 patients were recruited: 1101 from the National Patient Register and 730 from the case records (8). The recruited patients received a posted letter stating that the objective of the study was to study the inheritance of migraine, before they were contacted by telephone. Out of 1831 patients, 85 patients were noncontactable and 381 patients did not participate (8). The remainder 1365 patients (defined as probands) took part in a telephone interview (Fig. 1). Probands with a history of hemiplegic migraine or more widespread sensory symptoms were contacted by a physician whereas the remainder probands were contacted for an initial screening interview by three specially trained medical students (8). A total of 980 probands had MA without hemiplegia and the participants for the present study were recruited among these probands and their relatives.
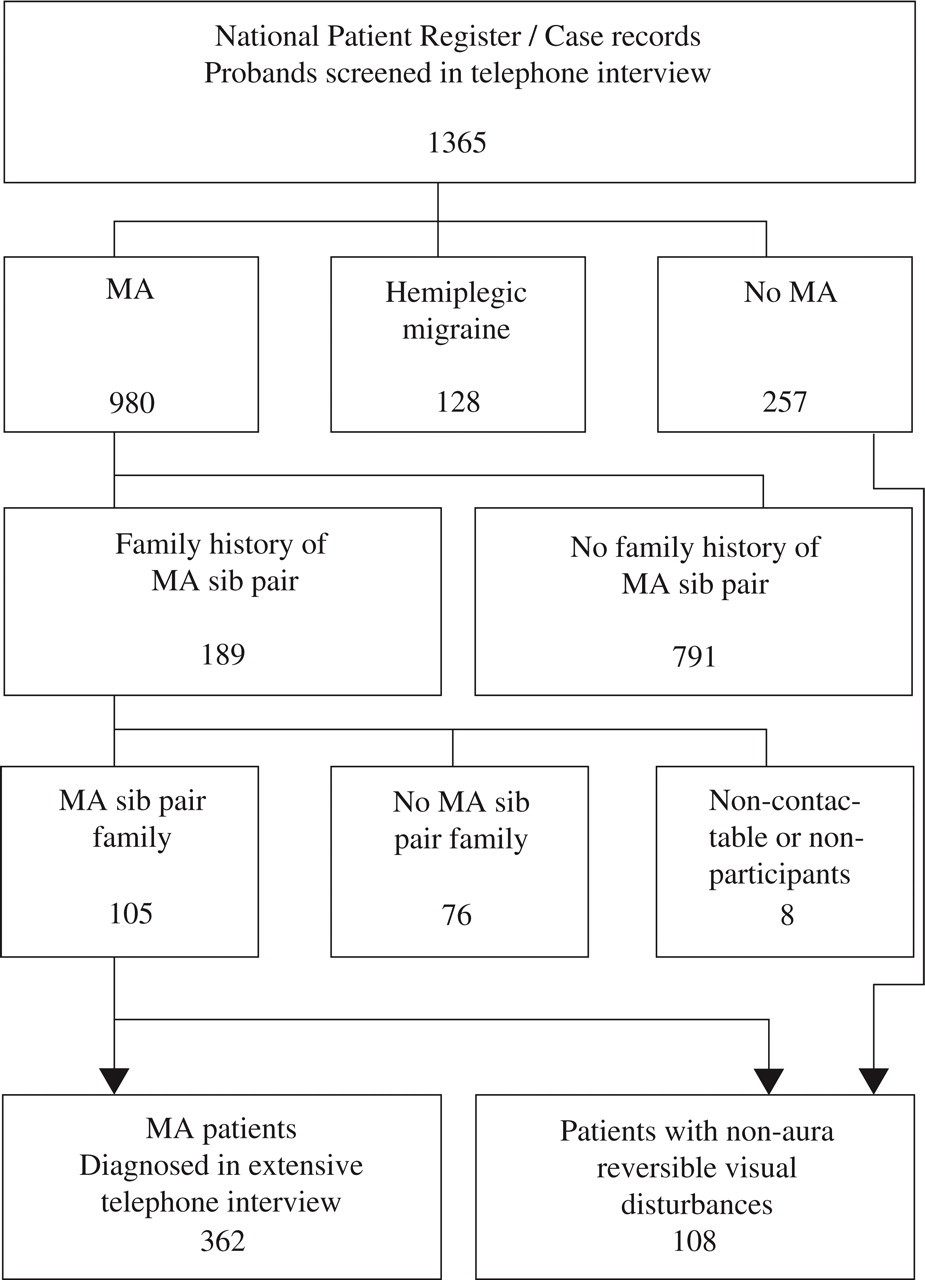
Ascertainment of patients with non-hemiplegic migraine with aura (MA) (n= 362) or non-aura reversible visual disturbances (n= 108).
During the screening telephone interview the MA probands were asked about affected relatives. Of 980 MA probands, 189 probands had a family history of at least one sib pair with both siblings affected with MA in the family. These families were selected for further extension and selected relatives were contacted for an extensive validated semistructured telephone interview (11, 12) performed by a specially trained physician (4). Contact was desirable in 736 living relatives of whom 25 were noncontactable and 68 did not participate (4). In total 643 relatives were interviewed of whom 272 were diagnosed with MA according to the ICHD-1. Out of the 272 relatives with MA 257 persons were part of a MA sib pair family. The probands of the 189 families were also contacted for an extensive interview and diagnosed according to the ICHD-1 by a physician if an affected sibling was identified. A total of 105 families with at least one sib pair with MA were recruited for our genetic studies and exclusively these families participated in the present study (4). Thus, for the present study we recruited 362 MA patients of whom 105 were probands and 257 were relatives. The 362 patients had been diagnosed with MA according to the ICHD-1 but subsequently, the new MA criteria of ICHD-2 were applied to the patients. According to the ICHD-2, 320 patients fulfilled the diagnostic criteria for MA with typical aura (diagnosis 1.2.1–1.2.3) of whom 319 had visual aura and these patients were included in the present study.
Furthermore, 108 patients with other reversible visual disturbances were included. Their visual disturbances were not judged to be visual migraine aura and they did not fulfil the ICHD-2 for MA. The patients with other reversible visual disturbances were identified during the initial screening interview among probands with no kind of migraine aura (39 patients from the National Patient Registry and 17 patients from the case records) and during the extensive interview among relatives (52 patients). Thus, our study population comprised 427 patients: 319 MA patients with visual aura (diagnosed according to the ICHD-2) and 108 patients with other reversible visual disturbances.
The participation rate was 78% (1357/1746) among probands recruited from the two recruitment sources and 90% (643/711) among relatives. The interviews took place from February 1999 to March 2002. The project was approved by the Danish Ethical Committees. Further details about material, nonparticipation and a comparison of patient characteristics to a representative population-based material have been reported elsewhere (4, 8).
Data processing
The 427 participants were separated into two subsamples: A derivation sample of 214 patients for regression analysis and derivation of VARS and a validation sample of 213 patients for validation of VARS. The derivation sample comprised 160 MA patients randomly selected among the 319 MA patients plus 54 patients randomly selected among the 108 patients with other reversible visual disturbances not judged to be visual migraine aura. The validation sample comprised the remainder 159 MA patients plus the remainder 54 patients with other reversible visual disturbances.
Statistical analysis
The aim of the analysis was to identify the visual symptom characteristics (duration, scotoma, flickering light, etc.) that influence the outcome of our diagnosis (the patient has MA/the patient has no MA). The visual symptom characteristics are defined as predictor variables and the outcome of our diagnosis as the outcome variable. We assumed that there is no interaction between the effects of the various predictor variables. The relationship between our predictor variables and the binary outcome variable is described in the logistic regression equation:
Ln(P) = a + b1x1 + b2x2+ … + bkxk.
From this equation we can predict the probability, P, that a patient will be classified into a particular category (MA/no MA); when a is a constant term, x are the predictor variables, and b are the estimated logistic regression coefficients (13).
Therefore, in our derivation sample, using logistic regression analysis we estimated the logistic regression coefficient for each predictor variable. The exponential of a particular coefficient, exp(b), is the odds ratio which is an estimate of relative risk. For each odds ratio we calculated a confidence interval and a Wald test statistic (testing the null hypothesis that the relative risk of MA associated with the predictor variable is unity) and associated P-values with one degree of freedom. We used this information to determine whether each variable is related to a diagnosis of MA and to quantify to which extent this is so. To select the combination of variables making up the best fitting model we used an automatic selection procedure; forward stepwise selection based on the Wald test statistics. In forward stepwise selection variables that contribute most to the model are added until no further variables contribute significantly to the model (14). The goodness-of-fit of the model was assessed by the − 2 log likelihood (−2LL) and the Nagelkerke R2 which is a measure of the proportion of the total variation in the outcome variable explained by the model (14). From the estimated regression coefficients of the selected model we derived a risk score of each predictive variable. Based on these risk scores we developed the VARS and derived a predictive VARS score. The cut-off value of the predictive VARS score was defined as the score with the highest sensitivity and specificity. Since the statistics of our predictive VARS scores were unequivocal we did not perform a receiver operation characteristic (ROC) curve for defining the cut-off value. Subsequently, the sensitivity, specificity and likelihood ratios of the predictive VARS score were assessed in our independent validation sample. The likelihood ratios are reliable measures as they are independent of the prevalence of MA in the study population (as opposed to predictive values). Statistical analyses were performed using SPSS Base System 11.5 for Windows XP Professional. P < 0.05 was considered significant.
Results
Characteristics of patients with migraine with aura
The 319 MA patients comprised 83 men and 236 women. The male : female (M : F) ratio was 1 : 2.8 and the mean age ± SD was 45 ± 16 years (range 12–90). The characteristics of the visual aura are shown in Table 1. Further details about symptom characteristics and the ICHD-2 MA subtypes of the patients have been reported elsewhere (4).
Characteristics of migraine with aura (MA) and other reversible visual disturbances (no MA)
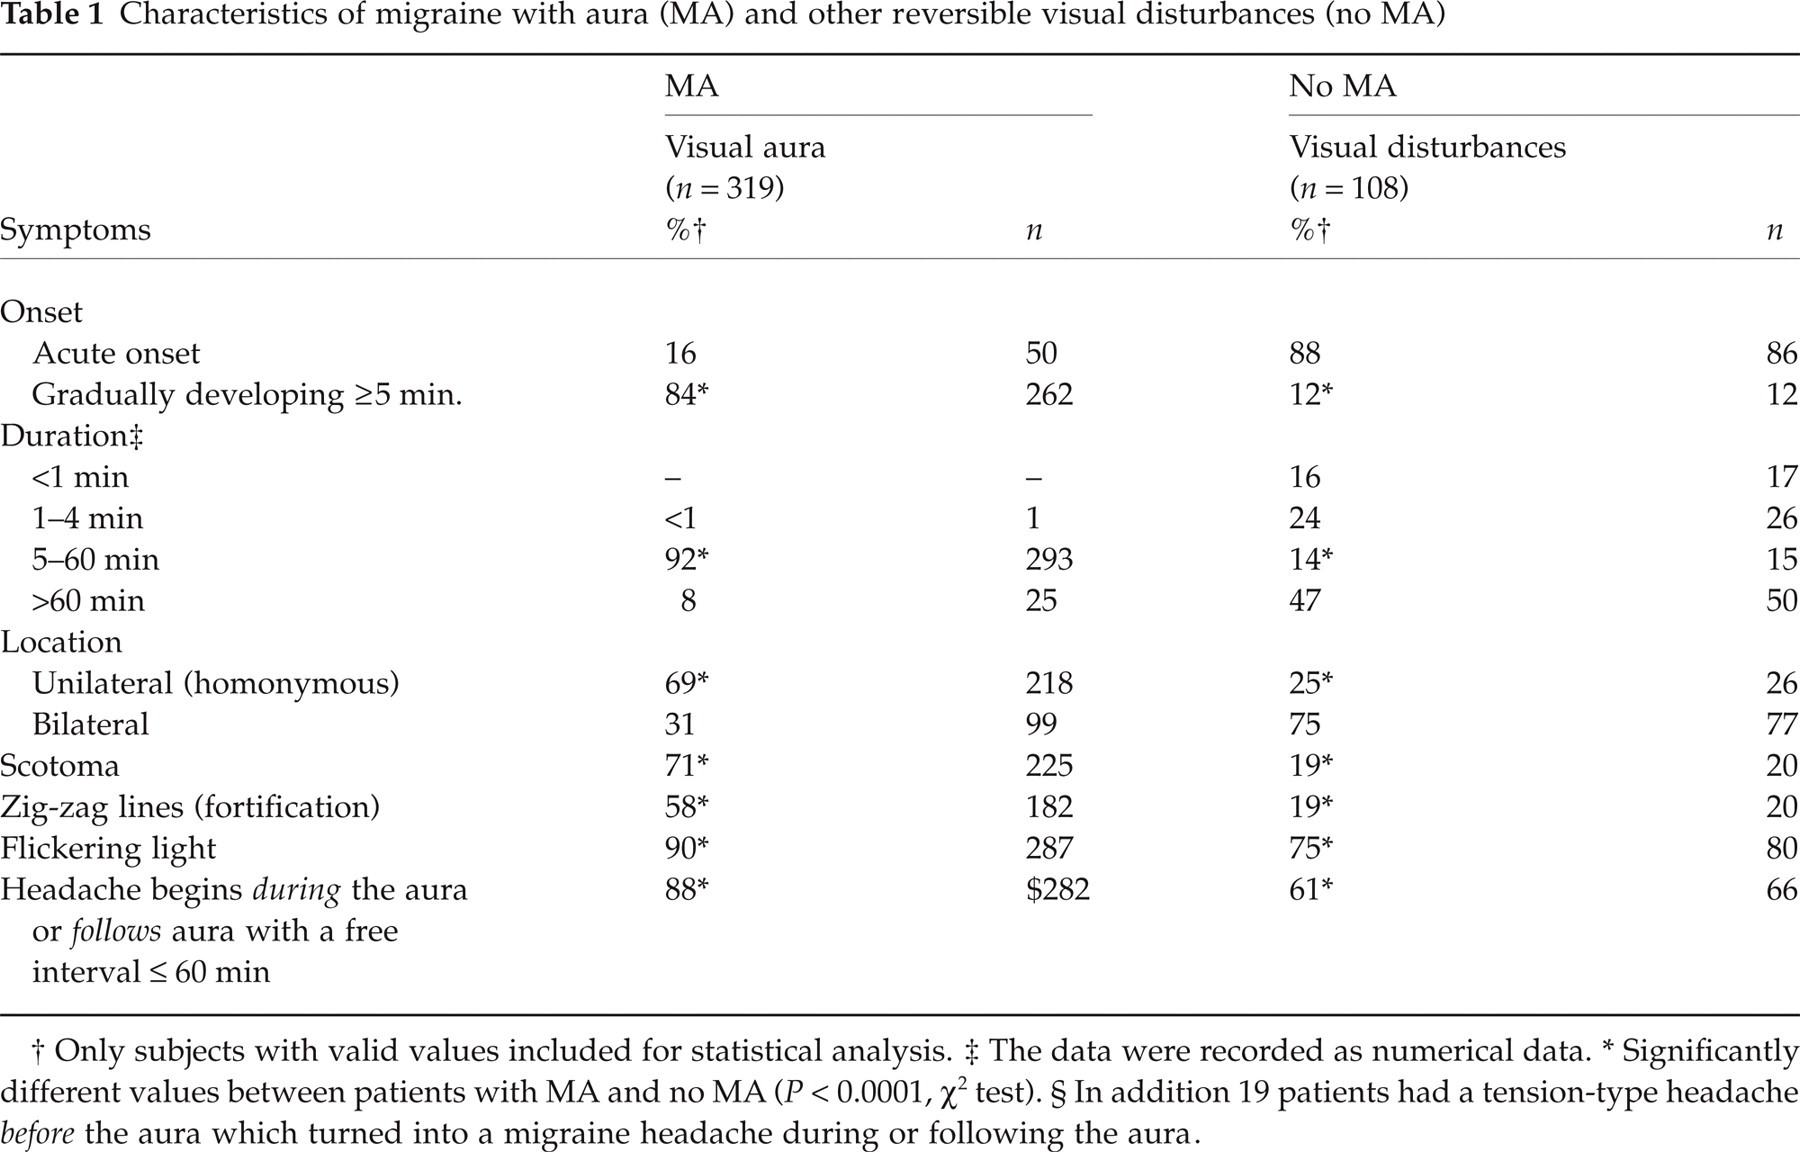
Only subjects with valid values included for statistical analysis.
The data were recorded as numerical data.
Significantly different values between patients with MA and no MA (P< 0.0001, χ2 test). § In addition 19 patients had a tension-type headache before the aura which turned into a migraine headache during or following the aura.
Characteristics of patients with other reversible visual disturbances
The 108 patients with other reversible nonaura visual disturbances comprised 30 men and 78 women. The M : F ratio was 1 : 2.6 and the mean age ± SD was 41 ± 14 years (range 10–78). The characteristics of the reversible visual disturbances are shown in Table 1. The visual disturbances were often characterized by flickering light lasting less than 5 min or by general blurring of vision lasting more than 60 min, but they did not fall into well-defined categories. The headache related to the reversible nonaura visual disturbances fulfilled the ICHD-2 criteria for migraine without aura in 35% (38/108), probable migraine without aura in 4% (4/108) and episodic tension-type headache in 16% (17/108) of patients. However, 42% (45/108) of patients had an unspecified headache and 4% (4/108) had no headache.
Logistic regression analysis of aura characteristics
The logistic regression analysis was based on the empirical data from our derivation sample. The following visual symptom characteristics were included as bimodal predictor variables (the characteristic is present or absent) in the regression analysis since they were significantly associated with the outcome variable (Table 1): duration 5–60 min, gradually developing over ≥ 5 min, scotoma, zig-zag lines (fortification), unilateral (homonymous), flickering light, and a headache begins during the aura or follows aura with a free interval ≤ 60 min.
Initially every predictor variable mentioned above was available for the logistic regression analysis. The statistics of the regression models selected by the forward stepwise selection are shown in Table 2. According to the stepwise selection procedure model 5a was the best fitting model (Table 3). However, in this model the regression coefficients (b) of all variables are very large and therefore, we cannot rely on the Wald statistics for hypothesis testing (14). Consequently, we excluded the predictor variable added in the last step of the selection procedure. That is, we excluded the variable ‘Headache during/following aura’. In the subsequent regression analysis devoid of this variable model 5b was selected as the best fitting model by the stepwise selection procedure (Table 2). Model 5b includes five predictor variables. The presence of these variables are positively correlated to an outcome diagnosis of MA since exp(b), that is the odds ratio, is greater than one for each variable (Table 2). The odds ratio is the chance of having MA compared with the chance of not having MA if the variable is present while adjusting for all other variables. The variables are significantly associated with an outcome diagnosis of MA since the confidence intervals of the odds ratios exclude one and the P-values of the Wald test statistic are significant (Table 2).
Statistics for logistic regression models selected by forward stepwise selection (derivation sample, n = 214)
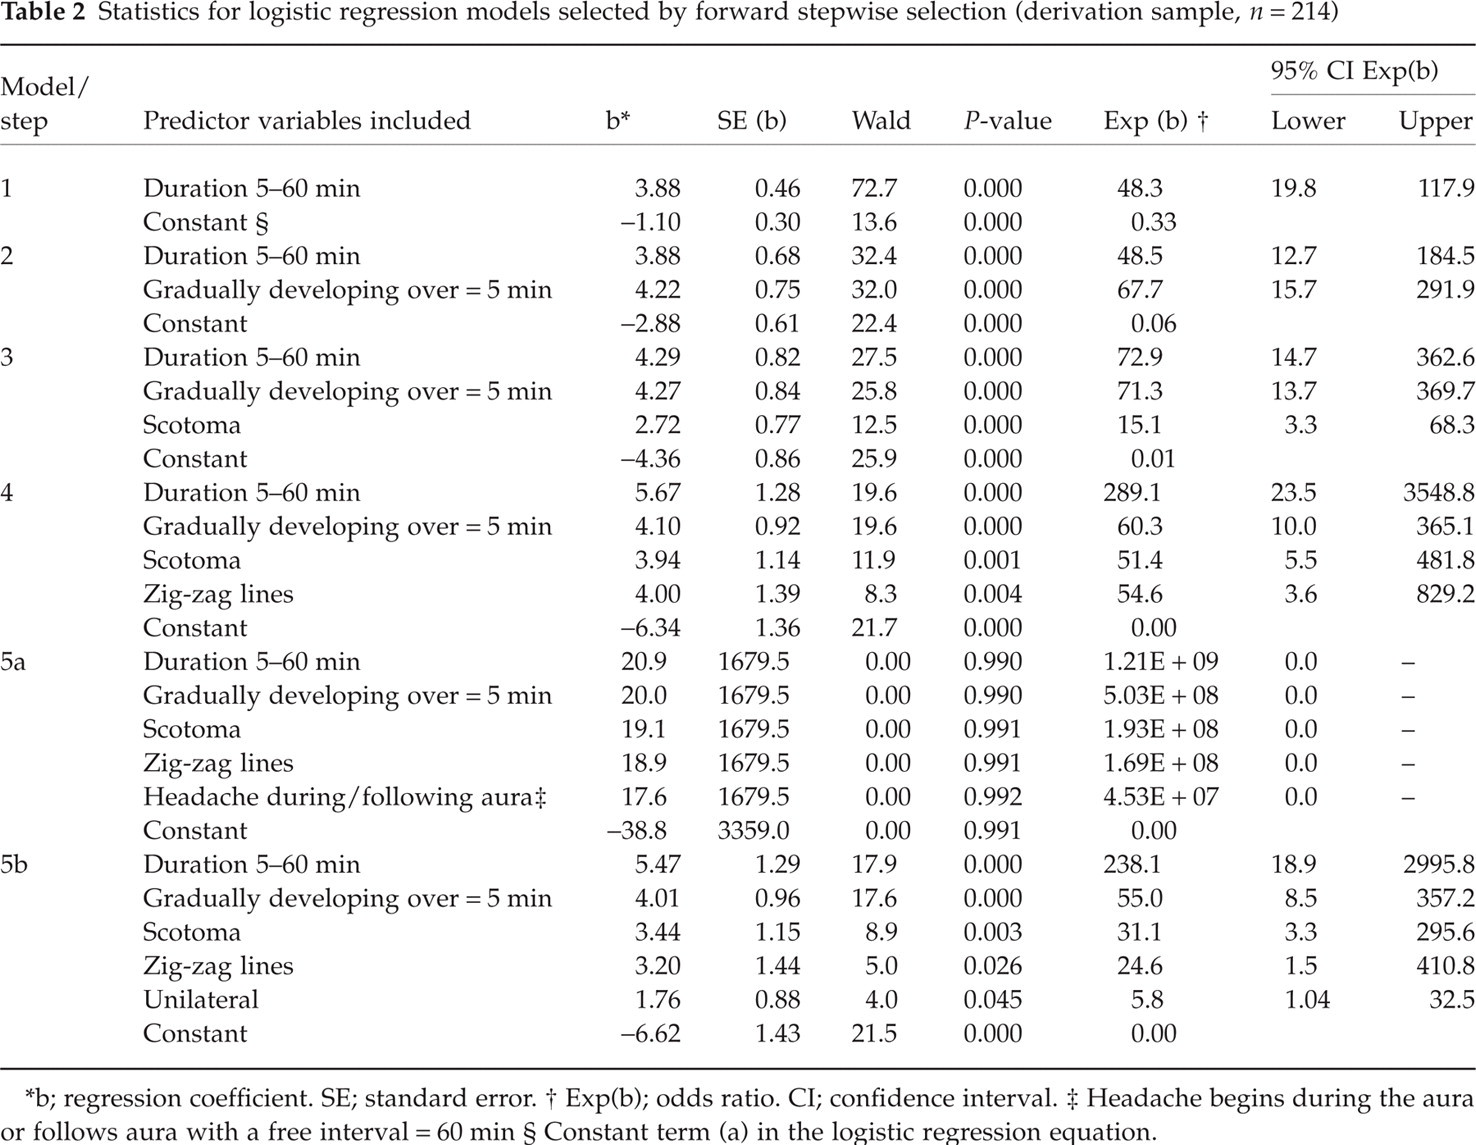
b; regression coefficient. SE; standard error.
Exp(b); odds ratio. CI; confidence interval.
Headache begins during the aura or follows aura with a free interval = 60 min
Constant term (a) in the logistic regression equation.
Classification table and model summary of the logistic regression models outlined in Table 2 (derivation sample, n = 214)

The cut-off value is 0.5; that is, patients with a predicted probability of 0.5 or greater are classified as having migraine with aura.
No MA; reversible visual disturbances not judged to be visual aura.
MA; migraine with aura according to the International Classification of Headache Disorders 2nd Edition (ICHD-2).
To evaluate whether model 5a or 5b is the best fitting model we compared further statistic estimates between these regression models: classification tables, − 2LL and the Nagelkerke R2 (Table 3). The classification table compares the observed diagnoses of ICHD-2 for MA with the predicted diagnoses according to the model. Overall, 95.8% of the patients were correctly diagnosed by model 5a compared to 95.3% by model 5b. The changes in − 2LL is used to determine how the fit of the model changes between models. The lower the − 2LL the better the model fits the data. The − 2LL was 36.6 in model 5a and 43.9 in model 5b. The Nagelkerke R2 quantifies the proportion of the variation in the outcome variable explained by the regression model. If a model fits perfectly the Nagelkerke R2 is 100%. Model 5a explained 91% of the variation in the outcome diagnosis compared to 89% by model 5b. In conclusion, both models performed well. We selected model 5b for the derivation of VARS (see Discussion). The selected model was tested for interactions between the effects of all predictor variables. There was an interaction between the variables ‘zig-zag lines’ and ‘unilateral’. That is, the effect of one variable was influenced by the outcome of the other. However, since the selected model performed well we accepted the present finding.
Derivation of the visual aura rating scale (VARS)
The derivation of VARS was based on the selected logistic regression model derived from our derivation sample (model 5b, Table 2). From the estimated regression coefficients of the selected model we derived a risk score of each predictive variable. The risk score given for each visual symptom characteristic present is the approximated proportion of the regression coefficients: The variable ‘Unilateral’ with a regression coefficient of 1.76 (Table 2) was designated a risk score of one; the score of the remainder variables were designated as the value of their regression coefficient divided by 1.76. That is, the variable ‘Duration 5–60 minutes’ was designated a risk score of 3 (5.47/1.76 = 3.11), ‘Gradually development over ≥ 5 minutes’ a score of 2 (4.01/1.76 = 2.28), ‘Scotoma’ a score of 2 (3.44/1.76 = 1.95), and ‘Zig-zag lines’ a score of 2 (3.20/1.76 = 1.82). The estimated regression coefficients of the predictive variables describe the regression equation. That is, the regression coefficients and consequently the risk scores of the predictive variables are additive (13). Based on the derived risk scores we developed VARS (Table 4). The predictive VARS score is the weighted sum of the number of characteristics present. The maximum predictive VARS score is 10 points.
Visual Aura Rating Scale (VARS)

Figure 2a shows the predictive VARS scores attained by the patients in the derivation sample: A predictive VARS score of 5 or more separates the patients with visual migraine aura from patients with other reversible visual disturbances. The two groups of individuals show little overlap. Thus, the cut-off value of VARS is 5. That is, according to VARS, patients with a predictive VARS score of 5 or more are diagnosed with MA. Table 5 shows the diagnosis of the patients from the derivation sample according to VARS compared with the diagnosis according to ICHD-2. In our derivation sample a VARS score of 5 or more had a sensitivity of 96% (153/160; 95% CI 92–99%) and a specificity of 98% (53/54; 95% CI 95–100%). A cut-off value of VARS of 5 had an optimal combination of sensitivity and specificity compared to a cut-off value of 4 (sensitivity 97% (155/160); specificity 91% (49/54)) and a cut-off value of 6 (sensitivity 83% (133/160); specificity 100% (54/54)) (Fig. 3).

(a) Histogram showing the VARS (Visual Aura Rating Scale) scores of the derivation sample (n= 214). MA; migraine with aura according to the International Classification of Headache Disorders 2nd Edition (ICHD-2); ░ No MA; reversible visual disturbances not judged to be visual aura. (b) Histogram showing the VARS (Visual Aura Rating Scale) scores of the validation sample (n= 213). MA; migraine with aura according to the International Classification of Headache Disorders 2nd Edition (ICHD-2). ░ No MA; reversible visual disturbances not judged to be visual aura.

Diagram showing the sensitivity and specificity of the Visual Aura Rating Scale (VARS) when applied to the derivation sample (♦n= 214) and validation sample (▪n= 213) The numbers in italics indicate the VARS score tested.
Classification table of the derivation sample (bold, n = 214) and the validation sample (not bold, n = 213)

No MA; reversible visual disturbances not judged to be visual aura.
MA; migraine with aura according to the International Classification of Headache Disorders 2nd Edition (ICHD-2).
Validation of the visual aura rating scale (VARS)
VARS was tested in our independent validation sample. Figure 2b shows the predictive VARS scores attained by the patients in the validation sample and Table 5 shows the diagnosis of the patients according to VARS compared with the diagnosis according to ICHD-2. In our validation sample a VARS score of 5 or more had a sensitivity of 91% (144/159; 95% CI 86–95%) and a specificity of 96% (52/54; 95% CI 91–100%) (Fig. 3). The likelihood ratio of a positive result of VARS was 24 (0.91/[1–0.96]) and the likelihood ratio of a negative result was 0.098 ([1–0.91]/0.96). This implies that if a patient has a predictive VARS score of 5 or more the risk that the patient has MA is 24 times the risk that the patient does not have MA. A positive likelihood ratio of 10 or more is considered strongly positive and a negative likelihood ratio of 0.1 or less is considered strongly negative (15).
A total of 22 MA patients from the derivation and validation samples had a VARS score of 4 or less. Among these patients the visual aura had a duration of 5–60 min in 12 patients, was gradually developing over ≥ 5 min in 7 patients, presented a scotoma in 2 patients, zig-zag lines in one patient, flickering light in 21 patients, and was unilateral in 12 patients. In 15 of 22 patients the ICHD-2 for MA were fulfilled because the diagnosis was based on the characteristics of a co-occurring sensory or aphasic aura. In the remainder 7 patients the ICHD-2 for MA was fulfilled based exclusively on the visual aura characteristics (unilateral aura of 5–60 min duration).
Discussion
Main findings
In the present study we identified the visual symptom characteristics associated with migraine with aura (MA) and developed a Visual Aura Rating Scale (VARS). VARS is a simple diagnostic tool that further operationalizes the diagnosis of MA. According to VARS an outcome diagnosis of MA depends on a predictive score based on the presence or absence of five specific characteristics of visual aura (Table 4). The predictive VARS score is the weighted sum of the number of characteristics present. The maximum score is 10 points. A VARS score of 5 or more diagnoses MA with a sensitivity of 91% and a specificity of 96%.
Methodological considerations
The patients were diagnosed according to the International Classification of Headache Disorders 2nd Edition (ICHD-2) (1), in a validated semistructured interview (11, 12) by a physician trained in headache diagnoses in order to secure the highest possible accuracy and adherence to the formal diagnostic criteria (4). The participants did not have a physical or neurological examination, since previous studies have shown that this rarely alters the diagnosis of migraine in epidemiological studies (16). The diagnoses of our MA patients were supported by a long history of MA, a history of previous migraine diagnosis and antimigraine treatment and a strong family predisposition to MA (4, 17). Our MA patients were recruited from a selected material but the visual aura characteristics of our patients were compared to a population-based material diagnosed according to the ICHD-1 (5). The proportion of MA patients with unilateral aura, flickering light and the duration of the aura were identical in the two populations (5). However, our patients more often had a scotoma (71% vs. 50%) and less often zig-zag lines (57% vs. 81%) or a gradually developing aura (83% vs. 97%) (5). Though the population-based material was diagnosed according to the ICHD-1 the findings implies a risk of bias when VARS is applied to population samples. Nevertheless, VARS is ready for use in clinical samples. Further discussion of the representative-ness of the MA patients have been reported elsewhere (2, 4). Our patients with other reversible nonaura visual disturbances were selected among patients with nonspecific visual disturbances related to a primary headache or an unspecified headache. That is, the specificity of VARS is high among this group of patients, but the specificity was not tested among patients with other differential diagnoses such as cerebral vascular events.
Automatic stepwise procedures for selecting regression models seem to provide an objective way of choosing the best fitting model. Nevertheless, it is important that the derivation of the final model is based on an underlying conceptual framework. Only predictor variables known to be associated with the outcome diagnosis should be included in the regression analysis (18). In the present study we included visual symptom characteristics previously described to be associated with MA (4–6, 19, 20). Several potential models should be examined and the final choice of a model should be made with considerations to interpretability, parsimony and ease of variable acquisition (14). In the present study two selected logistic regression models (5a and 5b) performed well (Tables 2 and 3). We selected model 5b for various reasons: Model 5a seemed to be over-fitted since the regression coefficients were large and as a result we could not rely on the Wald test statistics (14) and the proportion of the estimated regression coefficients could not be used for deriving VARS. Furthermore, performing a similar regression analysis in our validation sample, model 5b was selected as the best fitting model. Nevertheless, we tested several different rating scales based on fictive regression coefficients including the same predictor variables as in model 5a. None of these rating scales performed well in predicting the outcome diagnosis. Thus, the predictor variable ‘Headache during/following the aura’ in model 5a seems to be the variable not appropriate for predicting the outcome diagnosis. Though this predictor variable is definitely associated to a diagnosis of MA our finding may be due to the fact that many patients with other reversible nonaura visual disturbances have a headache with onset during or following their visual disturbances (Table 1). Furthermore, we preferred not to include the predictor variable ‘Headache during/following aura’ in VARS because many MA patients have co-occurring attacks of aura without headache (4, 5). Finally, this predictor variable is used for diagnosing the ICHD-2 MA subtypes (1).
When assessing the sensitivity and specificity of a diagnostic test, the validation criteria must be independent from the diagnostic criteria tested. In the present study the ICHD-2 diagnosis of MA was compared with the outcome diagnosis according to the selected logistic regression models. The ICHD-2 of MA and the predictor variables available for the regression analysis shared three diagnostic visual symptom characteristics: ‘Duration 5–60 minutes’, ‘Gradually developing ≥ 5 minutes’ and ‘Unilateral’. Hence, we assumed that these symptom characteristics would be significant predictors of the outcome diagnosis according to the regression models. As expected the predictor variables ‘Duration 5–60 minutes’ and ‘Gradually developing ≥ 5 minutes’ were included first in the regression models by the stepwise selection procedure. However, the predictor variable ‘Unilateral’ was the last variable included in the model. Alternatively, the predictor variables ‘Scotoma’ and ‘Zig-zag lines’ more significantly predicted an outcome diagnosis of MA in the regression models. This may be due to the fact that 25% of patients with other reversible visual disturbances not judged to be visual migraine aura had unilateral symptoms (Table 1). Furthermore, the ICHD-2 criterion ‘Unilateral’ is often fulfilled by a co-occurring sensory aura if not fulfilled by the visual aura (2, 4). In total 64% of our MA patients had a co-occurring sensory or aphasic aura. This may also explain why only 89% of the variation (R2) in the outcome diagnosis was explained by the selected regression model analysing exclusively visual aura. Another reason why the regression model did not explain 100% of the variation in the outcome diagnosis may be the fact that there was an interaction between the effects of two included predictor variables.
With automatic stepwise selection procedures there is always a risk that the derived regression model will give an over-optimistic impression. The P-values will be too small, the R2 will be too high and the regression coefficients will tend to be too large (18). To rule out this possibility it is essential to validate a derived rating scale on an independent sample. We did that and found a slightly lower sensitivity but unchanged specificity. VARS is thus a thoroughly tested tool ready for use in the scientific community. Further discussion regarding the assessment of reliability and validity of diagnostic criteria of migraine has been reported previously (2).
Visual aura rating scale (VARS) vs. ICHD-2 diagnosis
The ICHD-2 has just been published with criteria for MA that are sensitive, specific and easier to understand than the criteria of ICHD-1 (1–3,21). Why then, present a whole new principle of MA diagnosis? VARS is a supplement to ICHD-2 diagnosis and adds a number of advantages. It takes the oprationalization of the ICHD-2 criteria for MA a step further by clearly specifying a limited number of characteristics and by adding evidence based weights to these characteristics. Our calculations resulted in a surprisingly clear bimodal distribution with just a little overlap: those having a VARS score of 5 or more had MA and those having a VARS score of 4 or less did not. Thus, diagnosing MA with VARS means that the patients very likely fulfil ICHD-2 criteria. Furthermore, VARS may be used with a higher cut-off score if false positive diagnoses must be avoided at the expense of sensitivity and the cut-off score may be reduced for complete sensitivity at the expense of specificity (Fig. 3). The specificity increases to 100% if the cut-off score is 6 or more. To explore what kind of patients are included using a higher cut-off score, we compared the clinical and demographic characteristics of MA patients having a VARS score of 5 with those having a score of 6 or more; and MA patients having a score of 5 or 6 with those having a score of 7 or more. The only significant observation was a small increase in age among patients with higher scores (P= 0.03, t-test). Therefore, when diagnosing MA according to VARS in future studies, the cut-off score should depend only on the desired sensitivity and specificity. VARS is extremely easy to learn, apply and teach and may therefore be a valuable addition to traditional diagnosis in order to secure correct application of ICHD-2 criteria in research studies and drug trials. It may also prove valuable in questionnaire diagnosis as well as in aura diagnosis by lay interviewers although such use would have to be further validated. In genetic studies VARS may be used to modulate the phenotype in a precise and reproducible way. A similar use of rating scales has been successful in the field of psychiatry where many rating scales are accepted as important diagnostic or prognostic tools in addition to DSM IV diagnoses, e.g. the Hamilton Depression Rating Scale.
VARS should in future be evaluated in a way reciprocal to the present study: by diagnosing patients from the general population with VARS and compare the findings to ICHD-2 diagnosis by a physician. If further positive results are published with VARS, it may be an option for future classifications to use VARS as a replacement of the aura criteria in the ICHD-2 for MA with typical aura. In conclusion, VARS is an easily administered, highly operational addition to the ICHD-2 diagnosis of MA.
Footnotes
Acknowledgements
The authors thank the participants; the medical students I. Andersen, F. Nazim and S. Roemer; and other colleagues for excellent collaboration. The statistics of the present study were approved by the Department of Biostatistics of the Faculty of Health, University of Copenhagen. The study was supported by grants from the University of Copenhagen, the Lundbeck Foundation, the Jeppe Juhl Foundation, the A.P. Møller Foundation for advancement of medical science, the Foundation for Research in Neurology, the Codan Foundation, the International Headache Society, and the GSK Foundation for headache research.