
Abstract
Background
Pituitary adenylate cyclase-activating polypeptide (PACAP) is a multipotent neuropeptide widely distributed in the trigeminovascular system (TVS) and higher brain regions. At present, the underlying mechanism of PACAP/PACAP type1 (PAC1) receptor in migraine generation remains unclear.
Methods
The rat model of chronic migraine (CM) was established by repeated intraperitoneal injection of nitroglycerin (NTG). Von Frey filaments and hot plate tests were used to measure the mechanical and thermal thresholds. The expression levels of c-Fos, calcitonin gene-related peptide (CGRP), PACAP, PAC1, protein kinase A (PKA) and phosphorylated extracellular signal-regulated kinase (ERK) were assessed by western blotting or immunofluorescence staining. The internalization of PAC1 receptor was visualized by fluorescence microscope and laser scanning confocal microscope.
Results
The results showed that c-Fos and CGRP expression significantly increased after repeated administrations of NTG or PACAP. Pitstop2 notably improved hyperalgesia in CM rats, while PACAP6–38 offered no benefit. In addition, PACAP-induced PAC1 receptor internalization, PKA and ERK pathways activation were blocked by Pitstop2 instead of PACAP6–38.
Conclusions
Our results demonstrate that inhibition of PAC1 receptor internalization could effectively improve allodynia in CM rats by restraining ERK signaling pathway activation in a chronic migraine rat model. Modulation of receptor internalization may be a novel perspective to explore specific mechanisms of PACAP signaling activation in the trigeminal vascular system.
Introduction
Chronic migraine (CM) is a highly disabling neurological disorder characterized by an episodic, recurrent and unilateral throbbing headache for more than three months (1,2). CM affects nearly 2% of the general population, impacting the quality of life in patients and carrying a significant social burden and economic strain (2–4). The pathophysiology of migraine remains to be discovered, but it is generally accepted that it involves the activation of trigeminal afferents. The potential importance of neuropeptide mediators released after trigeminal activation and their downstream effects is increasingly recognized (3,5). Extensive articles reported that neuropeptide calcitonin gene-related peptide (CGRP) plays a crucial role in the pathophysiology of migraine, and the CGRP-targeted therapies produced positive results (6,7). However, up to 50% of patients failed to benefit from CGRP-targeted therapies. Another essential neuropeptide, pituitary adenylate cyclase-activating polypeptide (PACAP), is becoming a much debated topic in migraine (8–10).
PACAP is a neuropeptide originally isolated from the ovine hypothalamus (11). PACAP belongs to the vasoactive intestinal polypeptide (VIP)/secretin/glucagon neuropeptide family and exists in two biologically active forms: PACAP-27 and PACAP-38 (predominant form in brain tissue) (12,13). In this study, PACAP refers to PACAP-38 unless specified otherwise. The three G-protein-coupled receptors of PACAP include pituitary adenylate cyclase-activating polypeptide receptor type1 (PAC1), the vasoactive intestinal polypeptide receptor 1 (VPAC1) and vasoactive intestinal polypeptide receptor 2 (VPAC2). Among them, PAC1 receptor binds PACAP with 1000-fold higher affinity than VIP, while VPAC1 and VPAC2 receptors have similar binding affinity for PACAP and VIP (14). Experimental studies have shown a 20-minute infusion of PACAP induces delayed migraine attacks and extracranial vasodilation for more than four hours, whereas VIP only resulted in a short-lasting vasodilation (8,15). Yet, two recent studies revealed that infusion of VIP over two hours also caused a prolonged dilation of cranial arteries and delayed headache in patients with migraine without aura (16,17). This finding implicates VPAC1 and VPAC2 receptors in the pathogenesis of migraine, but the role of PAC1 receptor in PACAP-induced headache cannot be ruled out. Considering VIP and PACAP are highly homologous and have similar elimination half-lives, the different vasodilatory responses may be attributed to the low affinity of PAC1 receptors for VIP. Therefore, PACAP functions by binding to the PAC1 receptor, and the PAC1 receptor may be a potential target for migraine treatment. There are many studies showing that PACAP can cause migraine, but evidence that blocking PACAP or PAC1 receptors can prevent migraine is limited. The phase II clinical trial results of AMG 301, an antibody against PAC1 receptor, showed that AMG 301 had no significant difference in migraine prevention over placebo (18). Clinical trials of the antibodies against PACAP (ALD 1910) are ongoing, with no results published so far (19). Thus, there are still blind spots in the exact mechanisms of PACAP/PAC1 receptor induced migraine, and PAC1 receptor-targeted therapies still need further exploration.
Several in-vitro studies found that activation of PACAP/PAC1 receptor can significantly enhance the excitability of different neurons through various mechanisms. The excitability of guinea pig cardiac neurons can be modulated by plasma membrane G protein-dependent activation of adenylyl cyclase (AC) and endosomal signaling mechanisms (20,21). Whereas the excitability of hippocampal dentate gyrus granule cells was mediated by PAC1 receptor endocytosis signaling and its downstream extracellular signal-regulated kinase (ERK) signaling pathway instead of AC/cAMP/PKA activation (22). Classically, endocytosis can be divided into clathrin-mediated endocytosis (CME) or clathrin-independent endocytosis (CIE) (23). The different forms of endocytosis make it difficult to find a specific inhibitor blocking the endocytosis of a particular receptor (4,21). Pitstop2 is a potent pharmacological inhibitor of CME, working with a specific effect on blocking the binding of proteins to the N-terminal domain of clathrin (23). In these studies, PACAP-mediated neuronal excitability was suppressed by Pitstop2 through blocking internalization of PAC1 receptor, which emphasizes the importance of endosomal PAC1 receptor signaling in neuronal excitation (4). PACAP can induce migraine headache with activation and sensitization of trigeminovascular system (TVS), but the specific pathways activating trigeminal neurons excitability remain unclear. Researches on PACAP-targeted therapies for migraine are not progressing well (12,18).
In the present study, we administered the rats with repeated nitroglycerin (NTG) or PACAP to explore the mechanisms of endogenous or exogenous PACAP in migraine attacks. Furthermore, we examined whether PACAP6–38 and Pitstop2 could inhibit the endogenous PACAP-induced activation of TVS in CM rats and the effects of PACAP6–38 and Pitstop2 treatments on allodynia and PAC1 receptor internalization and its downstream PAK and ERK signaling pathways in the trigeminal ganglia (TG) were investigated in a CM rat model.
Methods
Animals
To avoid variability of endogenous PACAP resulting from fluctuations in female sex hormones, adult male Sprague-Dawley (SD) rats (body weight 200–250 g; age seven weeks) were used in this study. All rats were obtained from the Laboratory Animal Centre of Renmin Hospital, Wuhan University (Wuhan, China) and kept in specific pathogen-free (SPF) laboratory conditions with a 12 hour light-dark cycle (lights on at 8:00 a.m., humidity 60 ± 5%, temperature 22 ± 2°C) and provided adequate food and water. The rats were randomly assigned to each group using a random-number sequence after a week of acclimatization, and group housed (six per cage) in polycarbonate cages (60 × 38 × 20 cm). A total of 99 rats were used in this study. The investigators were blinded to the group assignment. All experimental processes were approved by the Animal Care and Use Committee of Renmin Hospital of Wuhan University and complied with the National Institutes of Health Guide for the Care and Use of Laboratory Animals. All animal procedures were conducted by the ARRIVE guidelines and the Basel Declaration.
Chronic migraine model
The CM model induced by repeated injection of NTG was established according to the previous study (24,25). A stock solution of 5.0 mg/ml NTG (Runhong, Henan, China) was diluted to 1 mg/ml with 0.9% saline for injection. Rat received intraperitoneal (i.p.) injection of diluted NTG at a dose of 10 mg/kg or an equal volume of 0.9% saline every other day for nine days (five times in total).
Drug administration
PACAP (HY-P0221, MCE), a neuropeptide with 38 amino acid residues, PACAP6–38 (HY-P0220A, MCE), a selective PAC1 receptor antagonist, and Pitstop2 (HY-115604, MCE), a clathrin inhibitor, were used in this study. PACAP and PACAP6–38 were dissolved in a 0.9% saline to make a 1 μg/μl working solution. Pitstop2 was dissolved in a vehicle containing 10% DMSO, 40% PEG300, 5% Tween80 and 45% ddH2O. Intranasal (i.n.) administration of PACAP has been shown to have higher bioavailability and result in higher brain exposure than intravenous and intraperitoneal injection (26). PACAP (30 μg/kg, i.n.) was administered every other day for nine days. PACAP6–38 was given intranasally with a dose of 30 μg/kg, 30 min before NTG treatment and after baseline threshold measurement. Pitstop2 (10 µg/kg, i.n.) was administered in the same route as PACAP6–38. For intranasal administration, one operator placed the rat in a supine position and kept the rat’s head horizontal to prevent the solution from draining into the trachea and esophagus, and the other operator delivered the drug to the nasal cavity of the rat using a microliter syringe. After the final droplet, the rat was held for an additional 30–60 seconds to ensure that the solution was inhaled.
Experimental Design
Experiment 1
To explore the effects of PACAP in CM, rats were randomly divided into three groups: Saline, NTG and PACAP (n = 9/group). The saline group and NTG group received equal doses of 0.9% saline or NTG (10 mg/kg) every other day (on days 1, 3, 5, 7, and 9). The PACAP group was treated every other day with intranasal PACAP. Behavioral tests were performed on rats 20 minutes before and two hours after solutions administration. The expression levels of endogenous CGRP and c-Fos in TG and trigeminal nucleus caudalis (TNC) were evaluated by immunoblotting (n = 3/group) and immunofluorescence staining (n = 3/group). In addition, the cellular co-localizations of PACAP and PAC1 were evaluated using double immunofluorescence staining in Saline, NTG and PACAP group.
Experiment 2
The effects of PAC1 receptor antagonist PACAP6–38 on CM rats were evaluated. Rats were randomly divided into four groups: Saline, NTG, NTG +vehicle and NTG + PACAP6–38 (n = 9/group). The NTG + PACAP6–38 group was treated with PACAP6–38 (30 μg/kg, i.n.) and then 30 minutes later NTG was injected. Saline was i.n. injected as vehicle for PACAP6–38. Behavioral tests were performed 20 min prior i.n. administration and two hours post i.p. injection. The rats were sacrificed to collect TG and TNC tissues for western blot (n = 3/group) or immunofluorescence staining (n = 3/group) after the last behavioral tests on day 9.
Experiment 3
To assess the potential molecular pathway of PAC1 receptor in TVS activation effect, the clathrin inhibitor, Pitstop2, was administered to CM rats. The groups included Saline, NTG, NTG + vehicle and NTG + Pitstop2 (n = 9/group). The NTG + Pitstop2 group was given with Pitstop2 (i.n.) every other day, followed by NTG (i.p.) 30 minutes later. Behavioral tests were performed 20 minutes before i.n. administration and two hours after i.p. injection. TG and TNC tissues of these rats were collected for western blot (n = 3/group) to measure expression levels of phosphorylated ERK (p-ERK), PKA, and for immunofluorescence staining (n = 3/group) to detect PAC1 receptor internalization.
In all experiments, investigators were blind to animal grouping.
Behavioral tests
All behavioral tests were performed between 10:00 a.m. to 16:00 p.m. in a quiet environment. To acclimatize to the test environment, rats were placed in the test chamber for two hours a day for three days prior to the first test and were transferred to the test chamber at least 30 minutes before the experiments. All behavioral tests including mechanical thresholds and thermal withdrawal latency were performed in the same groups of rats. The two investigators performing all tests were blind to the grouping of experimental rats. Basal responses to mechanical and thermal stimuli were tested 20 minutes before each initial administration to rats. Post-treatment responses to mechanical allodynia and thermal hyperalgesia were tested two hours after each NTG or saline injection. Our experimental design is summarized in Figure 1.
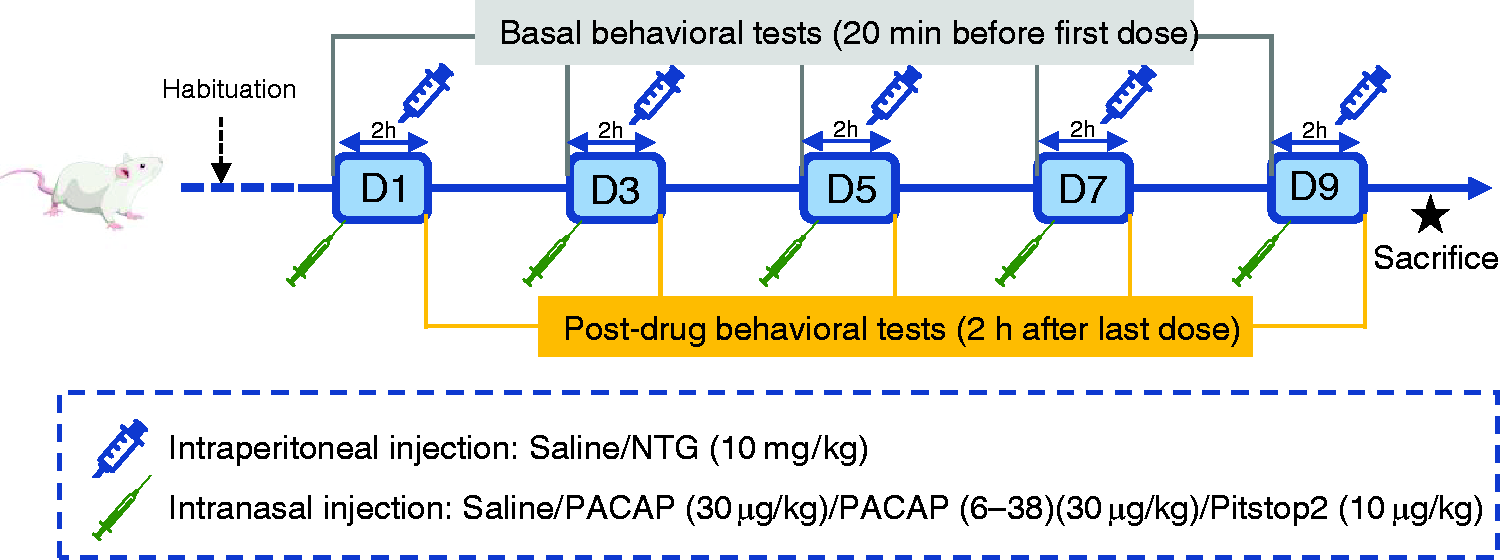
Schematic timeline diagram of drug administration and behavioral assessment in rats. Abbreviations: NTG, nitroglycerin; PACAP, pituitary adenylate cyclase-activating peptide. D: days.
Mechanical allodynia
The mechanical allodynia was assessed using calibrated von Frey filaments (Aesthesio, Italy) according to previous studies (27–29). Briefly, rats were placed on a metal mesh platform in a clear cylindrical plastic cage. To assess periorbital mechanical allodynia, Von Frey filaments were placed perpendicular to the caudal regions of the eyes to approximately the midline. Positive reactions were quick withdrawing of head or scratching the face with the front paw. To measure the paw mechanical allodynia, Von Frey monofilaments were placed perpendicular to the mid-plantar surface of the hind paw. Positive responses were lifting or shaking of the paw. Stimuli were always presented in a continuous manner testing with an initial stimulation strength of 2.0 g. If positive responses were observed, the filament strength was decreased. Otherwise, the filament strength was increased until a positive reaction occurs. The threshold was recorded as the lowest force to evoke a positive response and averaged from three repetitive measurements. Each rat was tested at least three times, and there was an interval of one to two minutes between successive stimuli.
Thermal hyperalgesia
According to the method described by Hargreaves et al. (30), thermal hyperalgesia was assessed with some modifications. Briefly, the rat was placed within a plexiglass enclosure on a plate. The temperature of the other identical hot plate was set to 55°C. A cut-off time of 30 s was set to avoid injury. After the rat was placed on the hot plate, the time of licking or raising the paw or jumping off the hot plate was recorded as paw withdrawal incubation period reflecting thermal hyperalgesia. The mean of three tests with five minutes intervals was used to be the final withdrawal latency.
Cells culture and treatment
Highly differentiated PC12 cells were cultured in H-DMEM supplemented with 10% fetal bovine serum, 1% penicillin–streptomycin solution in a 5% carbon dioxide (CO2) incubator at 37°C. In PACAP treatments, the cultures were exposed to 25nM PACAP for 20 min at 37°C. In Pitstop2 experiments, the cultures were pre-treated with 20 µM Pitstop2 for 15 min at 37°C before the addition of PACAP. PACAP was applied directly to the bath solution from frozen concentrated stocks prepared in phosphate buffer saline (PBS). Pitstop2 was made up as stock solutions with DMSO and aliquots were diluted to a final concentration of 0.1% DMSO in incubation medium. As Pitstop2 is light sensitive, care was taken to avoid light in these studies.
Collection and processing of tissue samples
The rats were euthanized by inhaling a lethal dose of CO2 after the last behavioral tests on day 9. The brain tissues were collected, and the TNC and TG were separated immediately on ice and stored at −80°C for immunoblot (n = 3 in each experimental group). Other rats (n = 3 in each experimental group) were sacrificed for histological analysis. Brain tissues were harvested after transcardial perfusion with saline, 4% paraformaldehyde, and then fixed in 4% paraformaldehyde solution overnight.
Western blot analysis
The brain tissue or cell samples were homogenized in RIPA mixed with phosphatase inhibitor cocktails A and B, protease inhibitor and PMSF at 4°C, the lysates were centrifuged at 12000 × g for 15 minutes and supernatant collected. Membrane and cytosol protein was extracted according to the instructions of Membrane and Cytosol Protein Extraction Kit (P0033, Beyotime, Shanghai). The protein concentration was determined by BCA Protein Assay Kit (Beyotime). The protein samples were boiled at 100°C for 15 minutes and stored at −80°C. Equal quantities of protein (20 µg) were separated on 10% or 12.5% PAGE Gels Fast Preparation Kit (Epizyme Biotech) and electro-transferred to polyvinylidene difluoride (PVDF) membranes (Millipore). After being blocked in Protein Free Rapid Blocking Buffer (PS108P, Epizyme Biotech) for 30 minutes, the membranes were incubated overnight at 4°C with the following primary antibodies: mouse anti-PACAP, mouse anti-CGRP, mouse anti-c-fos, rabbit anti-PAC1, rabbit anti-ERK, rabbit anti-pERK, rabbit anti-PKA, rabbit anti-GAPDH and rabbit anti-Na+, K+-ATPase. The details of all the antibodies used in this study are listed in Table 1. After overnight incubation, membranes were washed with 1 × TBST (three times for 10 minutes each) and incubated with the corresponding horseradish peroxidase (HRP)-conjugated secondary antibody for one hour at room temperature. Membranes were visualized using the Enhanced chemiluminescence (ECL) substrate (Biosharp). Image J software was used to measure the chemiluminescence intensity of the protein bands.
Antibodies used in western blot and immunofluorescence staining assays.

Immunofluorescence staining
Brain tissue and trigeminal nerves were embedded in wax blocks and cut into 4 μm paraffin sections. The sections were dewaxed, hydrated and heat-induced antigen retrieval with sodium citrate. Cell climbing slices were fixed with 4% polyformaldehyde solution for 15 minutes at room temperature. The tissue sections and cell were permeabilized using 0.3% Triton X-100 for 10 minutes and then blocked with 5% bovine serum albumin (BSA) solution at room temperature for one hour. Sections and cells were incubated with primary antibodies overnight at 4°C. After rinsing with PBS, sections and cells were incubated with corresponding fluorescent secondary antibodies. Finally, the slides were sealed with antifade mounting medium for Fluorescence (BL739B, Biosharp) and then imaged with a fluorescence microscope (Olympus BX53; Olympus, Japan) and a laser scanning confocal microscope (Olympus FV1200, Olympus, Japan).
Statistical analysis
GraphPad Prism 8.0 and SPSS version 22.0 (SPSS) were used for statistical analyses. All data were presented as mean ± standard error of the mean (SEM), where n = the number of animals. The group size requirement to obtain significance at α = 0.05 and statistical power of 0.8 was determined by previous studies (31,32) and based on the 3R principle using G*Power analysis. Before statistical analysis, the Shapiro-Wilk (S-W) normality test and Bartlett test were applied to conform with normality and homogeneity of variance. Two-way ANOVA with the Bonferroni post hoc test was performed for behavioral data because of multiple factors, including drug and time. The one-way ANOVA with Dunnett’s post hoc test was used for statistical comparisons among groups. P values less than 0.05 were considered to be statistically significant.
Results
Repeated NTG or PACAP administration induced hyperalgesia and upregulation of CGRP, c-fos in rats
In experiment 1, rats were randomly divided into three groups to receive saline, NTG or PACAP administration respectively. Compared with the saline group, both the baseline mechanical thresholds and latencies to heat were reduced significantly in a time varying manner on days 5, 7 and 9 in the NTG group and PACAP group (Figure 2a to c). Acute hypersensitivity was indicated by the post-treatment mechanical thresholds and paw withdrawal latencies decreased compared with the saline group (Figure 2d to f). The results of western blot and immunofluorescence staining using rat tissues on day 9 after behavioral tests showed that the expression of CGRP and c-Fos in TNC and TG were significantly increased in the NTG group and PACAP group, compared with that in the saline group (Figure 3 and online Supplementary Figure 4). These behavioral results and expressions of CGRP and c-Fos showed that both central and peripheral sensitization occurred after repeated NTG or PACAP administration.

Repeated NTG or PACAP administration induced hyperalgesia and upregulated CGRP and c-Fos expression. (a–f). Basal and post-treatment responses of periorbital (a, d) and hind paw (b, e) mechanical and thermal thresholds (c, f) in each group. Mean ± SEM, n = 9/group. Two-way ANOVA with the Bonferroni post hoc test; (a). Time F(4,120) = 39.56; Treatment F(2,120) = 32.25; *p(NTG) = 0.0175(5d), *p(PACAP) = 0.0194(5d); ***p(NTG) = 0.0003(7d), ***p(PACAP) = 0.0002(7d); ***p(NTG) = 0.0001(9d), ***p(PACAP) = 0.0002(9d). (b). Time F(4,120) = 15.82; Treatment F(2,120) = 33.68; **p(NTG) = 0.0033(5d), **p(PACAP) = 0.0064(5d); ***p(NTG) = 0.0002(7d), ***p(PACAP) = 0.0003(7d); ***p(NTG) = 0.0004(9d), ***p(PACAP) = 0.0004(9d). (c). Time F(4, 120) = 29.75; Treatment F(2,120) = 59.27; **p(NTG) = 0.0047(5d), **p(PACAP) = 0.0039(5d); **p(NTG) = 0.0065(7d), ***p(PACAP) = 0.0006(7d); ***p(NTG) = 0.0003(9d), ***p(PACAP) = 0.0002(9d). (d). Time F(4,120) = 13.05; Treatment F(2,120) = 89.26; *p(NTG) = 0.0273(1d), *p(PACAP) = 0.0257(1d); **p(NTG) = 0.0053(3d), **p(PACAP) = 0.0042(3d); ***p(NTG) = 0.0002(5d), **p(PACAP) = 0.0039(5d); **p(NTG) = 0.0064(7d), ***p(PACAP) = 0.0003(7d); ***p(NTG) = 0.0001(9d), ***p(PACAP) = 0.0002(9d). (e). Time F(4,120) = 4.325; Treatment F(2,120) = 75.04; **p(NTG) = 0.0073(1d), **p(PACAP) = 0.0057(1d); *p(NTG) = 0.0133(3d), **p(PACAP) = 0.0072 (3d); **p(NTG) = 0.0065(5d), ***p(PACAP) = 0.0004(5d); **p(NTG) = 0.0045(7d), ***p(PACAP) = 0.0003(7d); ***p(NTG) = 0.0003(9d), ***p(PACAP) = 0.0002(9d) and (f). Time F(4,120) = 14.08; Treatment F(2, 120) = 109.4; *p(NTG) = 0.0116(1d), **p(PACAP) = 0.0024(1d); **p(NTG) = 0.0023(3d), ***p(PACAP) = 0.0007(3d); **p(NTG) = 0.0025(5d), ***p(PACAP) = 0.0009(5d); ***p(NTG) = 0.0004(7d), ***p(PACAP) = 0.0002(7d); ***p(NTG) = 0.0002(9d), ***p(PACAP) = 0.0002(9d). *p < 0.05; **p < 0.01; ***p < 0.001 compared with the saline group. Abbreviations: NTG, nitroglycerin; PACAP, pituitary adenylate cyclase-activating peptide. TG, trigeminal ganglion; TNC, trigeminal nucleus caudalis.

(a–c). Representative immunoblots and quantitative analysis of c-Fos and CGRP in TG and TNC and (d). Representative images of CGRP and c-Fos positive (green) fibers in TG and TNC of different groups. The average numbers of CGRP and c-Fos-positive cells in the NTG and PACAP group were significantly increased compared to the saline group. Raw western blots are presented in Supplementary Figure 4. Mean ± SEM, n = 6/group. One-way ANOVA with Dunnett’s post hoc test. (b). TG: F(2,24) = 22.37, *p(NTG) = 0.0149, **p(PACAP) = 0.0068; TNC: F(2,24) = 116.7, **p(NTG) = 0.0049, **p(PACAP) = 0.0073; (c). TG: F(2,24) = 28.77, *p(NTG) = 0.0118, *p(PACAP) = 0.036; TNC: F(2,24) = 56.37, **p(NTG) = 0.0097, *p(PACAP) = 0.0084; *p < 0.05; **p < 0.01; ***p < 0.001 compared with the saline group. Abbreviations: NTG, nitroglycerin; PACAP, pituitary adenylate cyclase-activating peptide. TG, trigeminal ganglion; TNC, trigeminal nucleus caudalis.
PACAP induced internalization of membrane PAC1 receptor and activation of downstream PKA and ERK signaling pathways in TG neurons of CM rats
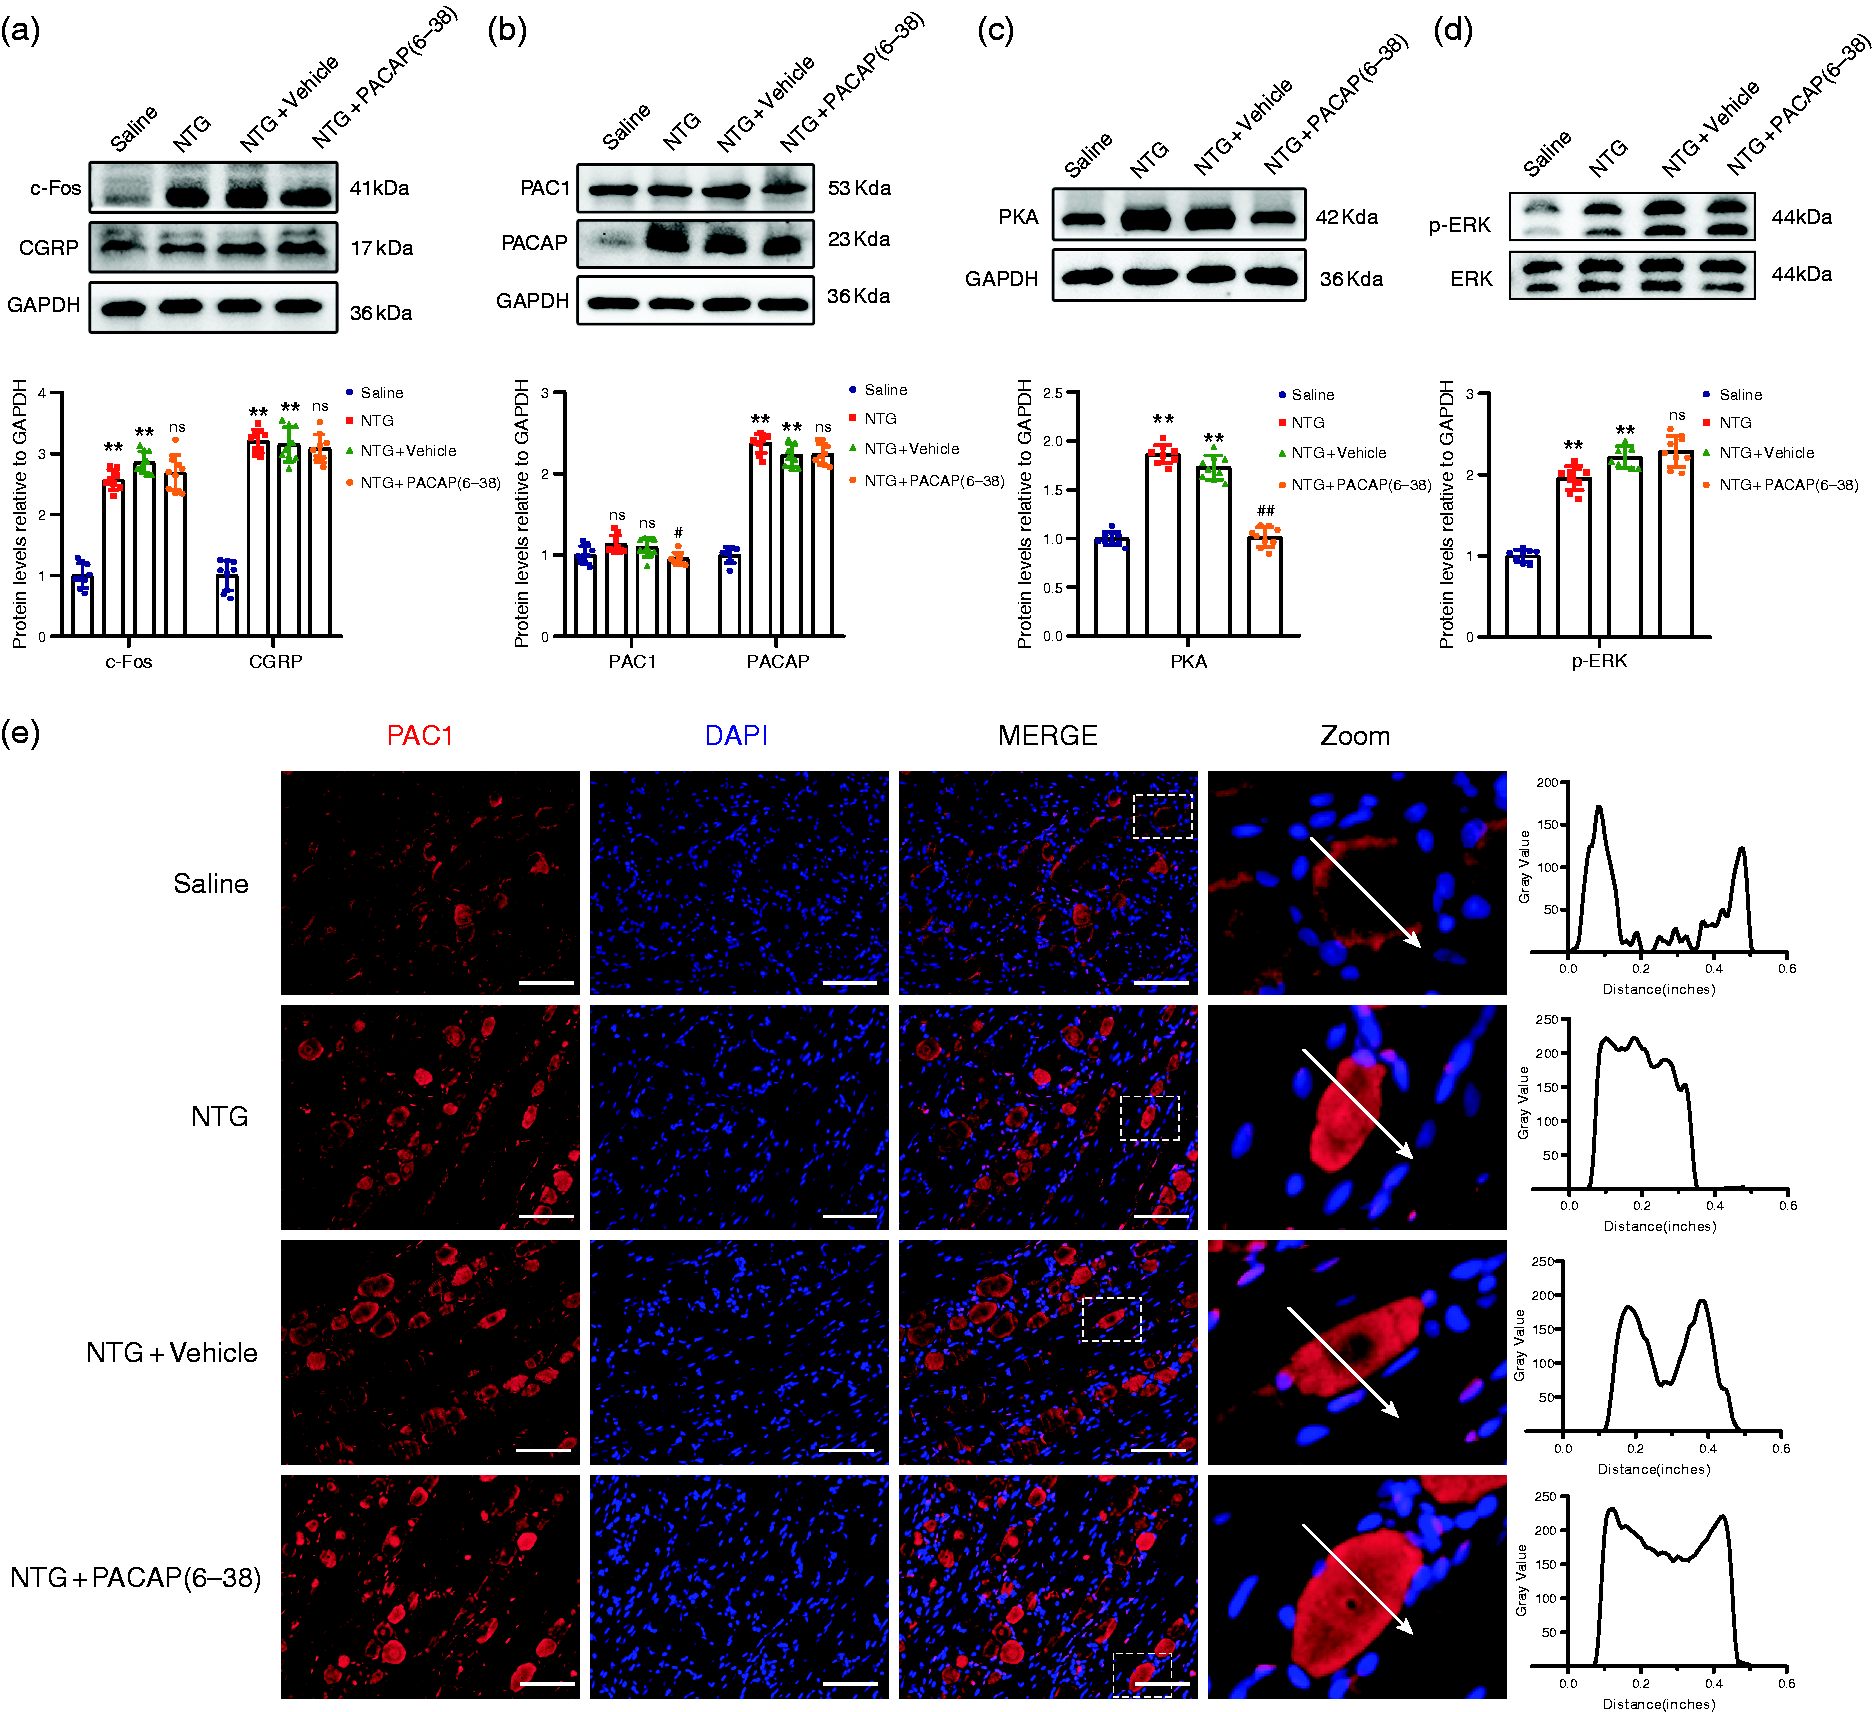
Previous in-vitro experiments demonstrated that the PACAP-induced PAC1 receptor internalization could significantly increase the excitability of neurons through multiple pathways (22,33). Therefore, we assessed whether PACAP could induce PAC1 receptor internalization and certain signal channels after repeated NTG or PACAP administration. The expression levels of PACAP, p-ERK and PKA in TG were significantly increased in both the NTG group and PACAP group, compared with the saline group (Figure 4a to c, and online Supplementary Figure 5), indicating that exogenous PACAP could trigger hyperalgesia in rats by activating the PKA and ERK pathways, and additionally PACAP was released endogenously during NTG-induced migraine attacks. In addition, western blot results showed the expression of PAC1 receptor increased in cytosol and decreased in cytomembrane in the NTG and PACAP group compared to the saline group (Figure 4d and online Supplementary Figure 5). Immunofluorescence double staining showed that both PACAP and PAC1 were co-localized with neurons (NeuN positive) rather than glial cells in the TG (Figure 4e and f and online Supplementary Figure 3). Moreover, in NTG or PACAP-treated rats, the immunoreactivity of PAC1 receptors dissipated from the plasma membrane and was observed in the cytoplasm within the TG neurons (Figure 4f), illustrating that PAC1 receptor was internalized after NTG or PACAP administrated.

Increased expression of PACAP induced PAC1 receptor internalization and pathways activation in TG neurons after repeated NTG or PACAP administration. (a–c). Representative immunoblots and quantitative analysis of PACAP (F(2,24) = 28.37, *p(NTG) = 0.0432, *p(PACAP) = 0.0184), PKA (F(2,24) = 18.97, **p(NTG) = 0.0032, *p(PACAP) = 0.0469) and phospho-ERK(F(2,24) = 47.63, **p(NTG) = 0.0073, *p(PACAP) = 0.0247). (d). Representative western blot images and analysis showing the expression of PAC1 Continued.receptor increased in cytosol and decreased in cytomembrane after repeated NTG or PACAP administration (Cytosol: F(2, 24) =16.81, *p(NTG) = 0.0238, *p(PACAP) = 0.0419; Cytomembrane: F(2,24) = 49.97, **p(NTG) = 0.0018, **p(PACAP) = 0.0036). Raw western blots are presented in Supplementary Figure 5. (e). Double immunofluorescence staining showed that PACAP (red) was co-localized within neurons (NeuN positive (green)) in the TG and (f). Double immunofluorescence staining showed that PAC1 receptor (red) was co-localized within neurons (NeuN positive (green)) in the TG. Immunohistochemistry analysis showed that PAC1 receptors were present on the cell surface (white arrows) in the saline group, plasma membrane translocation (white asterisks) of PAC1 receptor occurred after NTG or PACAP-treated. Scale bar: 50 μm. Insets show a higher magnification view (Zoom). Mean ± SEM. One-way ANOVA with Dunnett’s post hoc test, n = 3/group. *p < 0.05; **p < 0.01; ***p < 0.001 compared to the saline group. Abbreviations: TG, trigeminal ganglion; NeuN, neuronal nuclei.
The clathrin inhibitor Pitstop2, rather than PAC1 receptor inhibitor PACAP 6–38, effectively improved hyperalgesia in CM rats
Given the upregulation of PACAP, PAC1 receptor internalization and activation of its downstream PKA/ERK signaling pathway in the NTG-induced migraine rats, PACAP/PAC1 receptor may be a potential effective therapeutic target. Behavioral results suggested that basal mechanical and thermal pain thresholds were notably increased with multiple treatments of Pitstop2 (Figure 5a to c). Moreover, NTG-induced acute mechanical and thermal hyperalgesia were reversed markedly with a single treatment of pitstop2 (Figure 5d to f) compared with the NTG + vehicle group. Therefore, the clathrin inhibitor Pitstop2, rather than PAC1 receptor inhibitor PACAP6–38, effectively improved NTG-induced mechanical and thermal hyperalgesia.

(a–e). Behavioral testing after Pitstop2 and PACAP6–38 treatments in the rat model of CM. Pitstop2 ameliorated mechanical allodynia and thermal hyperalgesia after CM. Pretreatment of PACAP6-38 showed no improvement compared to NTG + vehicle group. Mean ± SEM. Two-way ANOVA, Bonferroni. n = 9/group. (a). Time F(4,160) = 68.05, treatment F(3,160) = 25.67, *p = 0.0347(5d), **p = 0.0076(7d), ***p = 0.0003(9d); (b). Time F(4,160) = 36.45, treatment F(3,160) = 21.36, *p = 0.0433(3d), *p = 0.0218(5d), *p = 0.0369(7d), **p = 0.0037(9d); (c). Time F(4,160) = 47.59, treatment F(3,160) = 23.83, *p = 0.0218(3d), **p = 0.0043(5d),**p = 0.0031(7d), ***p = 0.0002(9d); (d). Time F(4, 160) = 116.46, treatment F(3, 160) = 49.52, **p = 0.0047(1d), *p = 0.0268(3d), *p = 0.0657(5d), **p = 0.0097(7d), ***p = 0.0004(9d); (e). Time F(4,160) = 56.69, treatment F(3, 160) = 34.67, *p = 0.0428(1d), *p = 0.0118(3d), *p = 0.0275(5d), **p = 0.0075(7d), **p = 0.0037(9d); (f) and Time F(4,160) = 69.57, treatment F(3, 160) =29.43, **p = 0.0056(1d), **p = 0.0086(3d), *p = 0.0134(5d), **p = 0.0029(7d), *p = 0.0187(9d); *p < 0.05; **p < 0.01; ***p < 0.001 compared with NTG + vehicle group. Abbreviations: CM, chronic migraine.
PACAP6–38 block the plasma membrane PAC1 receptor-mediated activation of the AC/cAMP/PKA pathway, but failed to reverse PAC1 receptor endocytosis/endosomal signaling and hyperalgesia in CM rats
In experiment 2, to explore the signaling pathways activated by PACAP/PAC1 receptor in CM rats, PACAP6–38, an effective pharmacological antagonist of the PAC1 receptor, was administered intranasally to rats 30 min before NTG injection. Immunoblotting analysis revealed that PAC1 receptor expression and PKA activation were significantly inhibited in the NTG + PACAP6–38 group compared to that in the NTG + vehicle group, while the expression levels of CGRP and c-Fos were not notably different between the two groups (Figure 6a to c, and online Supplementary Figure 6). Furthermore, PACAP6–38 failed to block activation of the ERK pathway (Figure 6d and online Supplementary Figure 6).
Modulation of CGRP, c-Fos, PACAP, PKA and p-ERK protein expression levels and activation of PKA, ERK signaling pathways by PACAP6-38 treatment in TG. (a–d). Representative western blot bands and quantitative analysis showed that PACAP6-38 couldn’t reverse overexpression of CGRP, c-Fos, PACAP and activated p-ERK in CM rats, and PACAP6-38 significantly inhibited the PAC1 receptor expression (F(3,32) = 46.89, #p = 0.0462) and PKA activation (F(3,32) = 36.44, ##p = 0.0017). Raw western blots are presented in Supplementary Figure 6 and (e). Representative images of immunofluorescence staining showed that PAC1 receptor was localized in the cytoplasm of TG neurons after PACAP6-38-treated. The fluorescent intensity of PAC1 receptor across representative cells (indicated by arrows) is shown.Insets show a higher magnification view (Zoom). Scale bar: 50 μm. Mean ± SEM. One-way ANOVA with Dunnett’s post hoc test, n = 6/group. *p < 0.05; **p < 0.01; ***p < 0.001 compared with saline group, #p < 0.05; ##p < 0.01; ###p < 0.001 compared with NTG + vehicle group. Abbreviations: TG, trigeminal ganglion; CM, chronic migraine.
In NTG + PACAP6–38 treated group, the immunoreactivity of PAC1 receptor was observed in the cytoplasm within the trigeminal ganglia neurons, like the NTG + vehicle group, which indicated that PACAP (6–38) did not reverse PACAP-mediated PAC1 receptor internalization in the TG of CM rats (Figure 6 and online Supplementary Figure 6). Combined with the behavioral data, these findings indicated PAC1 receptor endocytosis/endosomal signaling and downstream ERK pathway activation appeared to be a more key mechanism PKA signaling pathway underlying the effect of PACAP/PAC1 receptor on neuronal excitability.
Pitstop2 inhibited PACAP-induced PAC1 receptor internalization and attenuated the activation of TVS by restraining the ERK signaling pathway
In experiment 3, behavioral results showed NTG-induced hyperalgesia was partially prevented by pretreatment with Pitstop2. We found that Pitstop2 could significantly reduce the expression of CGRP, c-Fos in the TG compared with the NTG + vehicle group (Figure 7a and online Supplementary Figure 7), suggesting that TVS activation of CM rats was alleviated by Pitstop2 pretreated. The addition of Pitstop2 notably downgraded PACAP expression in the TG after NTG injection (Figure 7b and online Supplementary Figure 7), and the expressions of PKA and p-ERK were significantly reduced in NTG + Pitstop2 rats compared to NTG + vehicle rats (Figure 7b, c and online Supplementary Figure 7).

Pitstop2 inhibited PACAP-induced PAC1 receptor internalization and attenuated TVS activation with restraining the ERK pathway. (a–c). Representative western blot bands and quantitative analysis showed Pitstop2 treatment reduced overexpression of CGRP (F(3,32) = 48.09, #p = 0.0127), c-Fos (F(3,32) = 104.62, #p = 0.0176), PACAP (F(3,32) = 82.47, #p = 0.0145), PKA (F(3,32) = 64.39, #p = 0.0215) and p-ERK (F(3,32) = 79.89, #p = 0.0152) after CM. (d). The cytosol and the cytomembrane PAC1 receptor were determined by western blotting assays. Representative immunoblots and quantification of four groups were shown (Cytosol: F(3,32) = 19.43, #p = 0.0412; cytomembrane: F(3,32) = 32.79, #p = 0.0417). Raw western blots are presented in Supplementary Figure 7 and (e). Representative images of immunofluorescence staining of PAC1 (red) and DAPI (blue) in the TG. Pitstop2 treatment inhibited PACAP-induced PAC1 receptor internalization after CM. The fluorescent intensity of PAC1 receptor across representative cells (indicated by arrows) is shown. Insets show a higher magnification view (Zoom). Scale bar: 50 μm. Mean ± SEM. One-way ANOVA with Dunnett’s post hoc test, n = 6/group. *p < 0.05; **p < 0.01; ***p < 0.001 compared with saline group, #p < 0.05; ##p < 0.01; ###p < 0.001 compared with NTG + vehicle group. Abbreviations: TG, trigeminal ganglion; CM, chronic migraine.
Internalization of membrane PAC1 receptor in trigeminal neurons of CM rats was inhibited by Pitstop2, evidenced by decreased expression of PAC1 receptor in cytoplasmic and increased expression in cytomembrane after Pitstop2 treatment (Figure 7d and online Supplementary Figure 7). In addition, the internalization of PAC1 receptor was investigated intuitively by immunofluorescence microscope. In Pitstop2-treated rats, the immunoreactivity of PAC1 receptor was primarily concentrated at the plasma membrane of the trigeminal ganglia neurons, preventing PACAP-stimulated PAC1 receptor internalization in the TG neurons of CM rats (Figure 7e), which was consistent with the results of western blot.
PACAP activated the endosomal ERK pathway in PC12 cells via inducing PAC1 receptor internalization
To further validate the effect of Pitstop2 on PACAP-induced PAC1 receptor internalization and downstream ERK signaling activation in cells, the PC12 cells were treated with 25 nM PACAP for 20 min at 37°C in this study. The results indicated PACAP can potently stimulate ERK phosphorylation, which was diminished observably by 20 µM Pitstop2 pretreatment (Figure 8a and online Supplementary Figure 8). Immunofluorescence assay results showed that PAC1 receptor internalized into intracellular vesicles 20 min after PACAP treated at 37°C, and Pitstop2 pretreatment could markedly restrain PAC1 receptor internalization (Figure 8b).

Pitstop2 blocked PACAP-mediated PAC1 receptor internalization and endosomal ERK pathway activation in TG and PC12 cells. (a). Representative immunoblots and quantitative analysis showed Pitstop notably inhibited PACAP-induced ERK activation in PC12 cells (F(2,24) = 56.73, **p = 0.0172, &&p = 0.0279). Raw western blots are presented in Supplementary Figure 8 and (b). Representative images of immunofluorescence staining of PAC1 receptor (red) and DAPI (blue) in PC12 cells derived from different groups. PAC1 receptors (red) were expressed predominantly on the cell surface (double arrows) of PBS-treated PC12 cells. After 20 min exposure to 25 nM PACAP at 37°C, internalized PAC1 receptors (red) were present in numerous endocytic vesicles (double asterisks). In the PC12 cells pretreated with 20 µM Pitstop 2, the PAC1 receptors (red) remained on the cell surface (double arrows) after exposure to PACAP for 20 min at 37°C. Scale bar: 10 µm. Mean ± SEM. One-way ANOVA with Dunnett's post hoc test. *p < 0.05; **p < 0.01 compared with the PBS group. &p < 0.05; &&p < 0.01 compared with the PACAP-treated group. +, significantly different from PACAP-treated samples. Abbreviations: PBS, Phosphate Buffer Saline.
Discussion
In this current study, we presented several novel findings as follows. Firstly, prolonged intranasal administration of PACAP to rats resulted in hyperalgesia similar to that of NTG injection. Secondly, we observed that PACAP-induced PAC1 receptors internalization in the trigeminal neurons of rats and reported the beneficial effect of internalization inhibition on hyperalgesia alleviation for the first time. Furthermore, we showed the first in-vivo experiment that PAC1 receptor was transferred from the membrane into the cytoplasm in trigeminal neurons of CM rats to activate the downstream PKA and ERK pathways, and that inhibition of receptor internalization by Pitstop2 could alleviate hyperalgesia in CM rats through negatively regulating ERK signaling pathway. Our data suggested that PACAP6–38 failed to improve NTG-induced hyperalgesia in CM rats, and regulation of PAC1 receptor internalization might be a novel mechanism by which PACAP modulated allodynia in migraine.
Physiology of PACAP in migraine
The onset of headache relies on the activation of meningeal nociceptors at the origin of the TVS (34). The neuropeptide PACAP is released from the peripheral and central nerve terminals, and is secreted within the trigeminal ganglion (12). PACAP infusion was found to trigger delayed migraine-like headaches and a long-lasting dilatation of extracranial arteries in humans (8,15). Prior to a delayed migraine attack, plasma PACAP was increased significantly due to endogenous release or de novo synthesis (8). In the present study, we observed that repeated intranasal PACAP administration, like NTG injection, could decrease the pain thresholds and cause activation of TVS, with the overexpression of c-Fos and CGRP in TG and TNC. NTG injection was reported to produce photophobia and meningeal vasodilatation in wildtype (PACAP+/+) mice, but not in PACAP gene-deleted (PACAP−/−) mice (34), indicating PACAP is a critical mediator of TVS sensitization in NTG-induced migraine. Our results also support this conclusion. Furthermore, PACAP is the only migraine trigger in animal model to date that does not exclusively rely on CGRP signaling and KATP channels (35), meaning that other mechanisms may be involved in PACAP-induced hyperalgesia and PACAP-targeted drugs will be useful for migraine patients who have no response to CGRP and glibenclamide therapies.
Effects of the PACAP6–38 on PACAP induced allodynia
PACAP6–38 is the N-terminal truncated form of PACAP, and considerable evidence have indicated that it acts as an antagonist of specific PAC1 receptor, blocking PACAP-induced effects. Previous study showed that paraventricular nucleus of the hypothalamus (PVN) injections of PACAP6–38 depressed PACAP-induced activation and sensitization of TNC (36). To explore the underlying mechanism of PACAP/PAC1 receptor in TVS activation, PACAP6–38 was administrated prior NTG injection in rats. Our data indicated that although PACAP6–38 inhibited AC/cAMP/PKA pathway activation, it failed to reduce pain sensitization in CM rats and reverse the increase expression of c-Fos and CGRP. Our finding contrasts with previous studies reporting that PACAP6–38 inhibits NTG induced allodynia. The potent agonistic effect of PACAP6–38 on trigeminal primary neurons in vitro may explain this issue (37). Both peptide forms are potent mast cell degranulators with agonistic effects on the MrgB3 receptor expressed in oocytes (38). Furthermore, our study also showed that the repeated intranasal administrations of PACAP6–38 gradually reduced basal mechanical and thermal thresholds compared to saline group (online Supplementary Figure 2). PACAP6–38 is a competitive antagonist with the C-terminal extension playing a highly favorable role for recognition. Thus, the effects of PACAP6–38 seem to be target tissues/cells- dependent based on these studies and our findings.
Effects of the PACAP-induced PAC1 receptor internalization
Receptor internalization is a critical regulator of GPCRs signaling (39). It is generally accepted that GPCRs signal from the cell surface to second messengers such as cAMP and are internalized upon repeated or prolonged stimulation (40). Internalization of activated GPCRs was previously regarded as simply turning off signaling. Nowadays, it is clear that the process stops signaling to second messengers but may trigger the activation of other pathways (41). The mechanisms of PACAP signaling have not been elucidated and are further complicated by the potential interactions between PACAP receptors and between PACAP receptors and non-GPCRs. Meanwhile, there are reportedly around 10 PAC1 splice variants in rats. PACAP-responsive receptors in primary TG neurons and glia cells exhibit “agonist bias”, meaning that different agonists can induce distinct active receptor conformational states and different signaling pathways (23,42).
Research into PAC1 receptor-transfected cells revealed that PACAP could trigger the recruitment of β-arrestin and internalization of the PAC1 receptor. In our in-vivo study, we demonstrated that PACAP evoked PAC1 receptor internalization and downstream PKA and ERK signaling pathways activation. Pitstop2 pre-treatment could effectively improve PACAP-enhanced hyperalgesia in CM rats by blocking the internalization of PAC1 receptor and inhibiting the activation of ERK signaling pathway (21,43). Considering the failure of PAC1 receptor antibodies in a phase II clinical trial (18), we raise the possibility that the membrane PAC1 receptor mediating the AC/cAMP/PKA pathway might not be directly involved in PACAP-induced trigeminovascular activation but internalized and activated other pathways.
Furthermore, our results suggested that although plasma membrane AC/cAMP/PKA generation and endosomal ERK signaling may work in synergy to regulate activation of the TVS, the internalization of PAC1 receptor and downstream activated ERK signaling seemed to be a more critical mechanism for the PACAP effect on TVS sensitization (Figure 9).
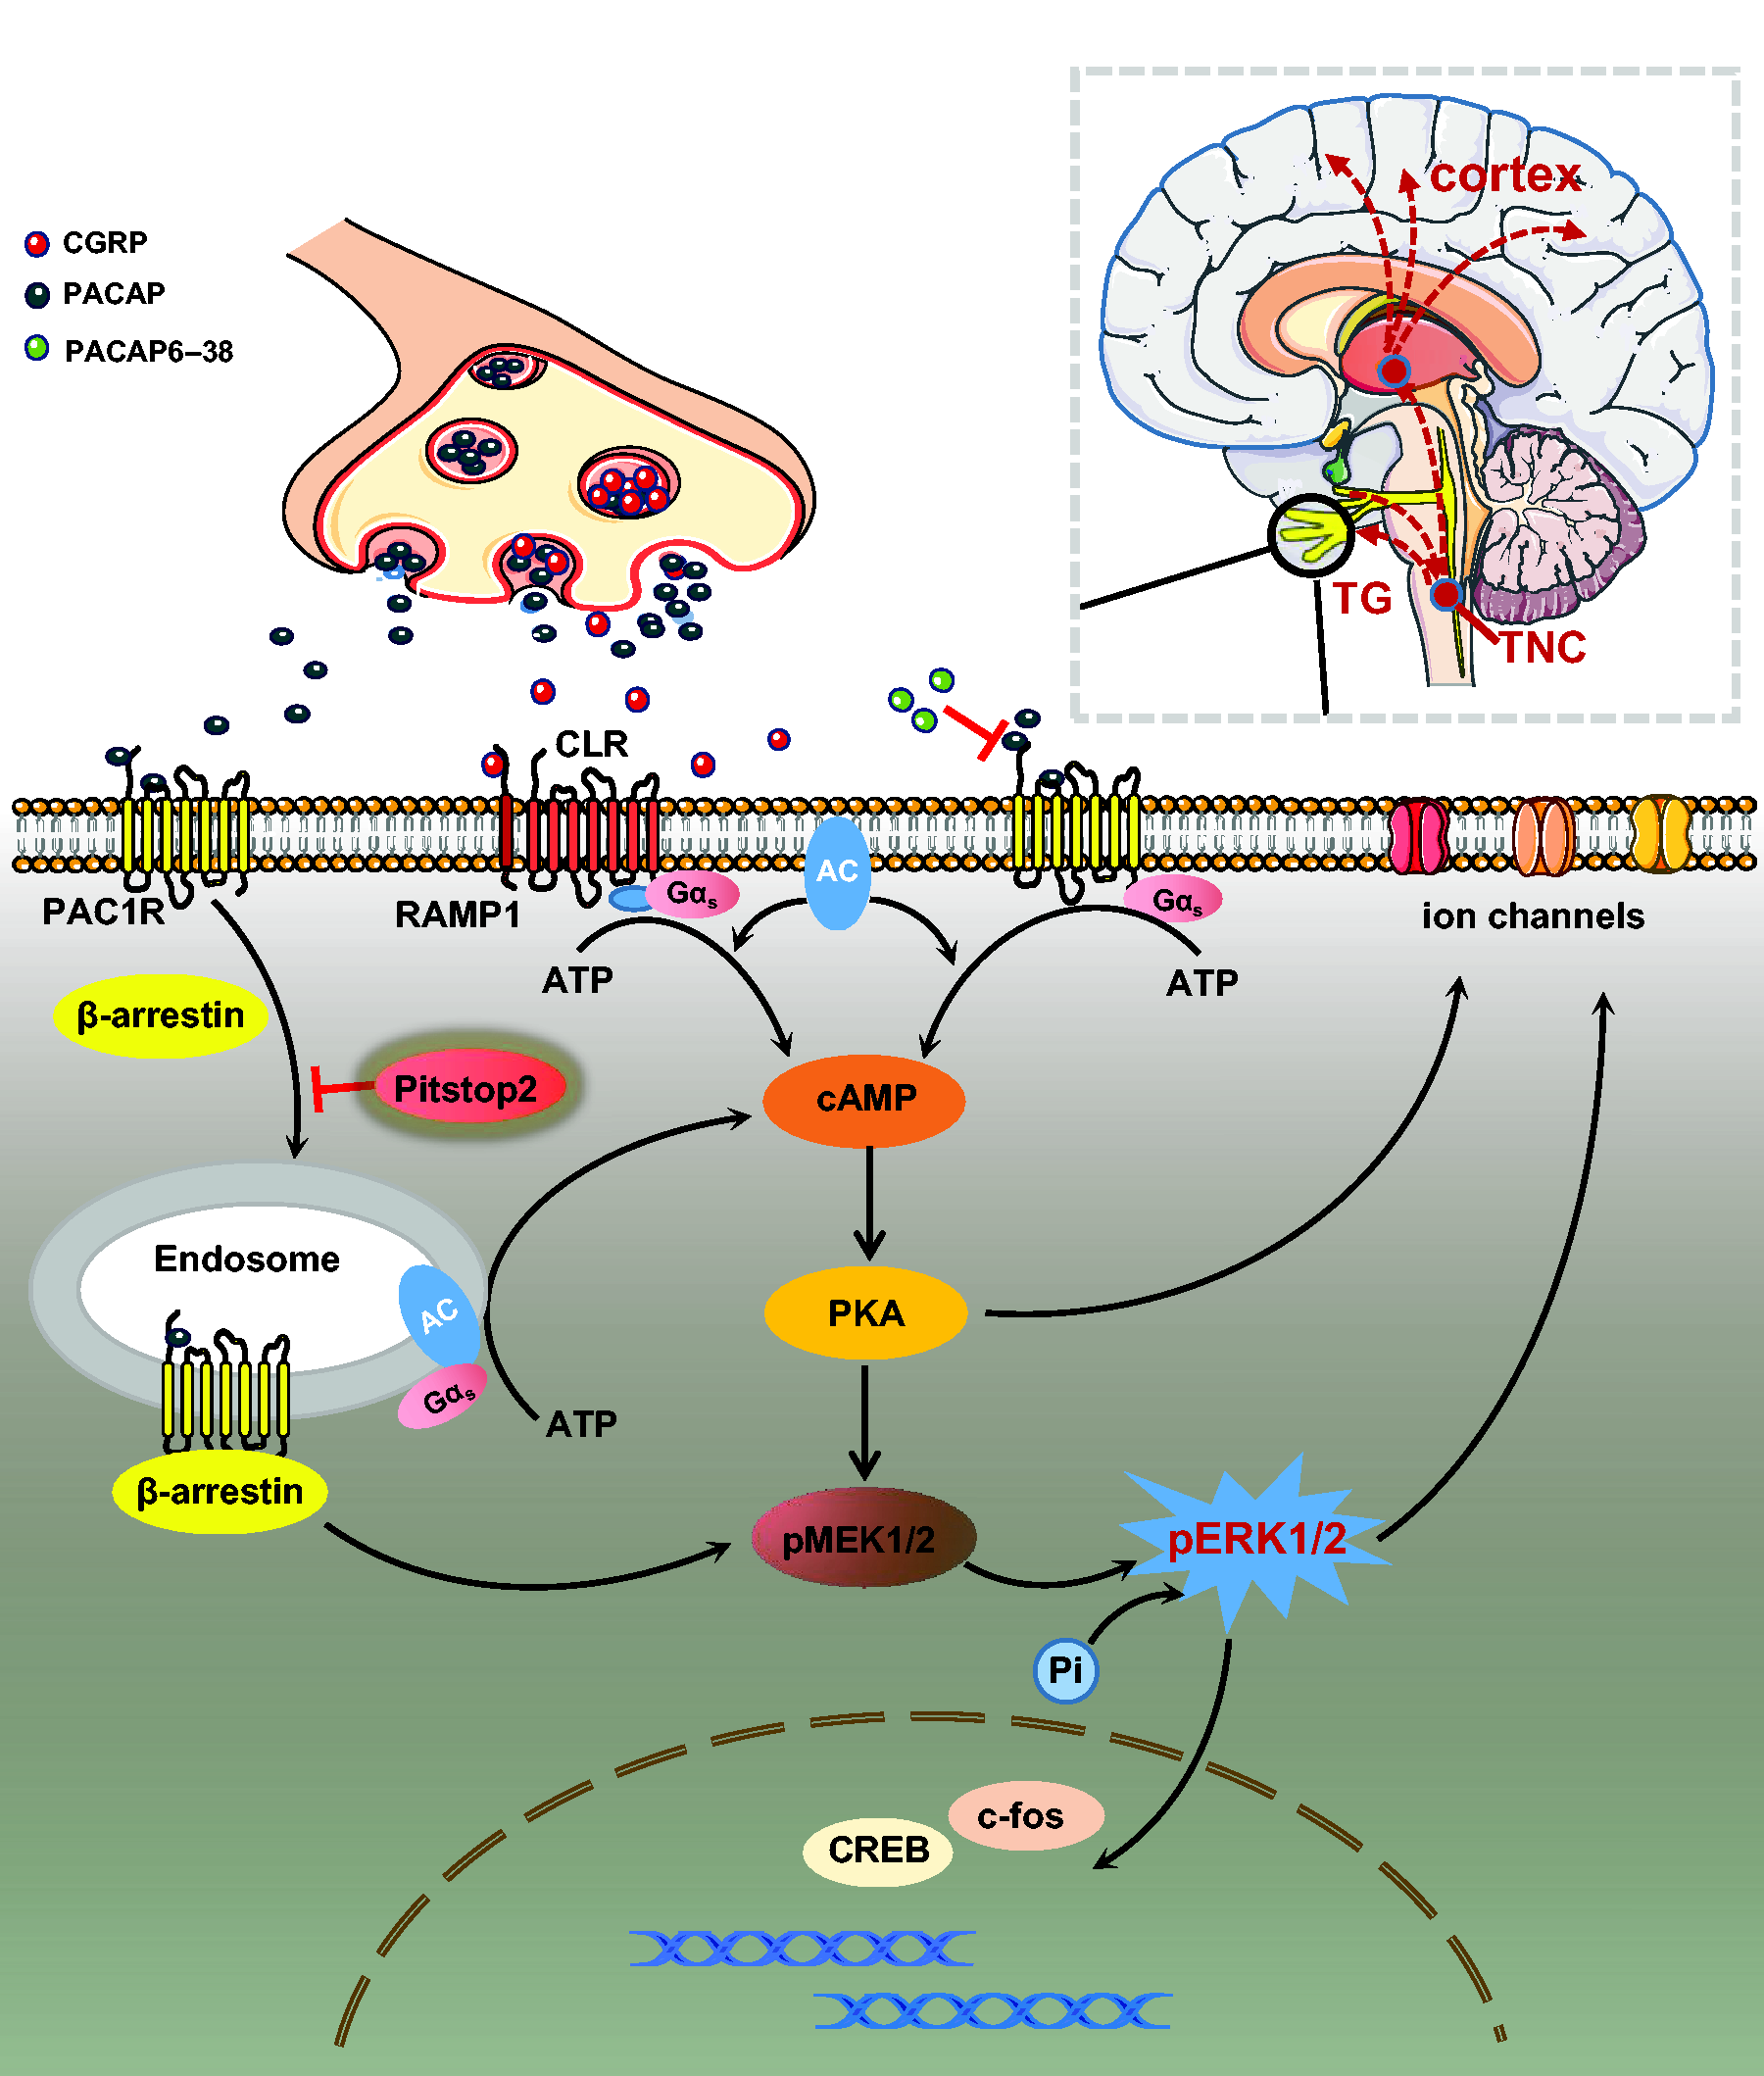
Schematic diagram for the mechanisms of PACAP/PAC1 receptor activation in the regulation of downstream signaling pathways in the brain. PACAP released from the presynaptic membrane after TVS activation binds to PAC1 receptors in the postsynaptic membrane. PACAP/PAC1 receptor can generate plasma membrane boundaries and endosomal signals after β-arrestin-mediated receptor internalization. PACAP/PAC1 receptor-mediated production of AC/cAMP/PKA is primarily from the plasma membrane, even though a small portion also be derived from endosomes. ERK pathway activation may result from β-arrestin-mediated PACAP/PAC1 receptor internalization. PACAP6–38, binding competitively to the PAC1 receptor, blocked the ability of PACAP/PAC1 receptor in plasma membrane to cause AC/cAMP/PKA activation. Pitstop2 blocks PAC1 receptor/β-arrestin internalization and endosomal PKA and ERK signaling to improve migraine.
Strengths and limitations
Substantial in-vivo experiments have reported that PACAP/PAC1 receptor internalization could significantly raise the excitability of different neurons through various mechanisms. Our study is the first to reveal that PACAP can induce internalization of PAC1 receptor and activation of the downstream pathways in CM rats. Blocking membranal PACAP/PAC1 receptor internalization improved PACAP-enhanced hyperalgesia of CM rats. These results deepen the understanding of the role of GPCRs internalization in migraine, fill the gap in the research of PACAP/PAC1 receptor internalization in TVS activation of migraine.
Meanwhile, we must be aware of the limitations of this study. Firstly, considering that PACAP expression is influenced by the function of the hypothalamic-pituitary-ovarian system and fluctuates during the estrous cycle in the female rat (online Supplementary Figure 1), no female rats were used in this study, which can be considered a limitation. Secondly, although numerous studies have revealed that phosphorylated ERK is involved in pain and nociceptive pathways, the specific mechanism by which it causes TVS activation in our study requires further exploration. In addition, despite PAC1Rs being predominantly expressed in neurons of the TG region, we cannot completely exclude possible effects of PAC1R internalization in the cortex and TNC. In our study, PACAP6–38 and Pitstop2 were administered intranasally, which differs from intravenous infusions used in human provocation studies (8,15). Therefore, species differences in metabolism, pharmacokinetics and dynamics between rats and humans also need to be taken into consideration. Lastly, Pitstop2 is not a specific inhibitor of PAC1 receptor internalization and its inhibition of other receptors internalization cannot be ruled out. However, the purpose of this study was to investigate potential signaling mechanisms by improving allodynia in rats, a long way from reflecting human therapeutic doses. More specific inhibitors need to be developed, and the results from the clinical trial of anti-PACAP antibody (ALD1910) are expected to offer the ultimate conclusion on the process of PACAP in migraine pathophysiology.
Conclusions
In summary, our study demonstrated that repeated intranasal PACAP administrations resulted in mechanical and thermal hyperalgesia similar to NTG injections. The internalization of PAC1 receptor and activation of PKA and ERK signaling pathways were found to be involved in the effect of PACAP on migraine attacks. To our knowledge, this report is the first to present that inhibition of PACAP-induced PAC1 receptor internalization could effectively improve hyperalgesia in CM rats by restraining ERK signaling pathway. Further work is required to reveal the precise mechanism of PACAP-induced trigeminal vascular activation and to identify new targets modulating the internalization of PAC1 receptor with specificity.
Article highlights
Repeated intranasal PACAP administrations result in mechanical and thermal hyperalgesia like NTG. PACAP evoked PAC1 receptor internalization and downstream PKA and ERK signaling pathways activation. Pitstop2 could inhibit PACAP/PAC1 receptor internalization and attenuated the activation of TVS by restraining the ERK signaling pathway.
Supplemental Material
sj-pdf-1-cep-10.1177_03331024231163131 - Supplemental material for Inhibiting PAC1 receptor internalization and endosomal ERK pathway activation may ameliorate hyperalgesia in a chronic migraine rat model
Supplemental material, sj-pdf-1-cep-10.1177_03331024231163131 for Inhibiting PAC1 receptor internalization and endosomal ERK pathway activation may ameliorate hyperalgesia in a chronic migraine rat model by Lily Zhang, Yanjie Zhou, Yajuan Wang, Liu Yang, Yue Wang, Zhengming Shan, Jingjing Liang and Zheman Xiao in Cephalalgia
Footnotes
Acknowledgements
The authors would like to thank the Central Laboratory, Renmin Hospital of Wuhan University (Wuhan, China) for providing relevant experimental facilities and technical support.
Authors contributions
This study was designed by LZ, YZ and ZX. The experiments were conducted by LZ, YJW, YZ, LY, JL, ZS and YW. Statistical analysis was performed by LZ, ZS and YZ. LZ wrote the manuscript, JL and ZX provided useful advice on the modification of this study. All the authors read and approved the final manuscript.
Funding
The authors disclosed receipt of the following financial support for the research, authorship, and/or publication of this article: This work was supported by grants from the National Natural and Science Foundation of China (81971055, 81471133, 82101292) and the Natural Science Foundation of Hubei Province (2020CFB226), the Health China·BuChangZhiYuanPublic welfare projects for heart and brain health (HIGHER2022094).
Declaration of conflicting interests
The authors declared no potential conflicts of interest with respect to the research, authorship, and/or publication of this article.
Research ethics
Animal protocols were approved by the Institutional Animal Care and Use Committee (IACUC) of Renmin Hospital of Wuhan University, with the IACUC issue No. WDRM animal (welfare) 20201101.
References
Supplementary Material
Please find the following supplemental material available below.
For Open Access articles published under a Creative Commons License, all supplemental material carries the same license as the article it is associated with.
For non-Open Access articles published, all supplemental material carries a non-exclusive license, and permission requests for re-use of supplemental material or any part of supplemental material shall be sent directly to the copyright owner as specified in the copyright notice associated with the article.