
Abstract
Background
Several neurotransmitters are expressed in the neurons of the trigeminal ganglion. One such signalling molecule is the pituitary adenylate cyclase-activating peptide (PACAP). PACAP signalling has been suggested to have a possible role in the pathophysiology of primary headaches.
Objective
The present study was designed to investigate the relationship between PACAP and calcitonin gene-related peptide, currently the two most relevant migraine peptides.
Methods
In the current study, we used ELISA to investigate PACAP and calcitonin gene-related peptide release in response to 60 mM K+ or capsaicin using a rat hemi-skull model. We combined this analysis with qPCR and immunohistochemistry to study the expression of PACAP and calcitonin gene-related peptide receptors and ligands.
Results
Calcitonin gene-related peptide (CGRP) is released from the trigeminal ganglion and dura mater. In contrast, PACAP is only released from the trigeminal ganglion. We observed a weak correlation between the stimulated release of the two neuropeptides. PACAP-38 immunoreactivity was expressed alone and in a subpopulation of neurons in the trigeminal ganglion that also store calcitonin gene-related peptide. The receptor subtype PAC1 was mainly expressed in the satellite glial cells (SGCs), which envelop the neurons in the trigeminal ganglion, in some neuronal processes, inside the Aδ-fibres and in the outermost layer of the myelin sheath that envelopes the Aδ-fibres.
Conclusion
Unlike CGRP, PACAP is only released within the trigeminal ganglion. This raises the question of whether a migraine therapy aimed at preventing peripheral PACAP signalling would be as successful as the CGRP signalling targeted treatments.
Introduction
The pathogenesis of primary headaches, such as migraine, is still unresolved but the trigeminal system has a prominent role in some aspects of the disease, most likely related to associated symptoms such as headache. Presently, much work suggests that already in the premonitory phase (day before the migraine attack) there is an early activation within the hypothalamus (1) and subsequently, during the attack this activation connects to thalamus and main centres in the brainstem, the trigeminal nucleus caudalis (TNC) and the trigeminovascular system (2,3). This pattern correlates well with different phases of the migraine attacks (4,5). The trigeminal ganglia (TG) represent a neuromodulatory system, composed of various cell types such as pseudo-unipolar neurons and satellite glial cells (SGCs), putatively implicated in the progression of cranial pain (6).
In the trigeminovascular system, both PACAP-38 and PACAP-27 are present as products of PACAP precursor processing (7), with PACAP-38 being the predominant subtype also expressed in brain tissue (8). Throughout the manuscript we use the term “PACAP” when the methods, or paper that the term refers to, do not differentiate between PACAP-27 and PACAP-38. When it is specified, it indicates that the subtype was known. PACAP-38 has many roles and has been reported to pass the blood-brain barrier (BBB) by active transport (8), while PACAP-27 is believed to cross via passive diffusion (9) though both are subject to active efflux mechanisms (10). Several studies have demonstrated the cytoprotective and neuroprotective properties of PACAP in vitro (11–14). The in vivo evidence of PACAP’s neuroprotective capabilities has been shown in ischemic animal models where treatment with PACAP reduced cerebral infarct size (15,16). PACAP-38 has also been reported to have neuroprotective effects (17), to act as an immunomodulant (18), has anti-oxidative effects (19) and is implicated in several stress-mediated neuropsychiatric disorders (20). PACAP-27 and PACAP-38 are known to bind to the G-protein coupled receptors, PACAP type I receptor (PAC1) and vasoactive intestinal peptide (VIP)/PACAP receptors 1 and 2 (VPAC1 and VPAC2) (21).
In migraine attacks, CGRP has been shown to be released in excess in plasma while the PACAP-38 release was less marked (22). Why has PACAP signalling then been suggested to have a possible role in the pathophysiology of primary headaches? This is based on (i) localization in a subpopulation of TG neurons (7,23,24), (ii) PACAP-38 being relatively increased in migraine and cluster headache attacks (from a significantly lower baseline) (22,25,26), and (iii) systemic infusion of PACAP-38/PACAP-27 (for 20 minutes) inducing migraine-like headache in migraine patients (27,28). For a more detailed review on the possible link of PACAP and the PAC1 receptor to migraine pathophysiology see Rubio-Beltrán and colleagues (21).
Unlike PACAP, VIP infusion does not lead to a headache response when administered in migraine patients (29,30). Both PACAP and VIP can bind VPAC1 and VPAC2 receptors with similar affinity, but the PAC1 receptor binds PACAP with around ∼100-fold higher affinity than for VIP (31). This would suggest that the induction of migraine by PACAP most likely occurs through the PAC1 receptor. In line with the available data, the putative role of PACAP-38 and its receptor PAC1 are under clinical studies with specific monoclonal antibodies (mAbs) developed towards PACAP-38 (ALD1910, Alder Co, USA) or the PAC1 receptor (AMG301, Amgen, CA) in attempts to find new anti-migraine treatments (32).
Although data on expression of PACAP in the trigeminovascular system is plentiful, stimulated PACAP release has never been investigated. The present study was designed to investigate if there was any correlation between PACAP and CGRP, the two most significant migraine-related peptides. Here we present data showing that PACAP is only released from the TG and not the dura mater; this will add to the complexity of migraine pathophysiology.
Methods
Animals
The study followed the guidelines of the European Communities Council (86/609/ECC) and all of the following procedures are approved by the Danish Animal Experimentation Inspectorate. Male Sprague-Dawley rats (250–400 g), purchased from Taconic (Ejby, Denmark) were maintained at a 12/12 h light-dark cycle (with dark beginning at 7 pm) and housed at a constant temperature (22 ± 2°C) and humidity (55 ± 10%), with food and water ad libitum. Rats were generally housed in Eurostandard cages (Type VI with 123-Lid) two to six together.
CGRP/PACAP release
Seventeen rats were anaesthetized by CO2 inhalation and decapitated around 13.00 pm. The protocol is described in detail elsewhere (33,34). The skull was cut mid-sagittally and the brain halves were carefully removed while the cranial dura was left attached to the skull, and the TG was dissected out. For the buffer system, 300 µL of synthetic interstitial fluid (SIF, composition: 108 mM NaCl, 3.5 mM KCl, 3.5 mM MgSO4, 26 mM NaHCO3, NaH2PO4, 1.5 mM CaCl2, 9.6 mM NaGluconate, 5.6 mM glucose and 7.6 mM sucrose; pH 7.4) at +37°C was used. TGs were randomized, placed in Eppendorf tubes in a heating block at +37°C and washed. For the skull halves, these were also randomized and placed in a humid chamber above a water bath to maintain temperature at +37°C. For the sumatriptan experiments, the skull halves were paired, one being treated with 30 µM sumatriptan and other one with vehicle for 20 min; 200 µL samples for measuring CGRP/PACAP content were collected from both tissues 10 min after stimuli. These were mixed with 50 µL enzyme immunoassay buffer (containing protease inhibitors) and stored at –20°C until analysis, within a week of the experiment being performed. The release of CGRP/PACAP was induced by 60 mM potassium, 100 nM capsaicin or subsequent addition of 1 µM capsaicin. To maintain equal osmolarity in the 60 mM K+ buffer, a proportional amount of Na+ was removed from the buffer.
The samples (100 µL for CGRP and 100 µL for PACAP) were processed using commercial EIA kits, Human CGRP ELISA KIT (SPIbio, Paris, France) to study CGRP release with limit of detection being 0.7 pg/mL and specificity for rat CGRP-α/β at 120%. For PACAP release, the rat PACAP ELISA Kit (LS-Bio, LS-F16956, WA, USA) with detection rate: 6.25–400 pg/mL and sensitivity: 6.25 pg/mL was used. This kit does not differentiate between PACAP-27 and PACAP-38, hence the term “PACAP release”. Determination of CGRP/PACAP content was calculated based on a standard curve that was run in duplicates. The protocol was performed following the manufacturer’s instructions and the optical density was measured at 410 nm using a micro-plate photometer (Tecan, Infinite M200, software SW Magellan v.6.3, Männedorf, Switzerland).
Dataset for RNA sequencing (RNAseq)
We obtained the data from the supplementary file of the paper by Hougaard Pedersen et al. (35). In this study, a total of 12 male Rattus Norvegicus (Sprague-Dawley) weighing 320–340 g (Taconic M&B, Denmark) were used. In the study by Hougaard Pedersen et al. 15 genes were significantly regulated; since the genes of interest to us were not among these, we pooled all their acute treatment groups.
Quantitative PCR (qPCR)
Six rats (of the same strain and from the same supplier as for the previously published RNAseq dataset above) were anaesthetized by CO2 inhalation and decapitated. TGs were dissected out for mRNA analysis. The tissue was homogenized on dry ice for 6 × 20 sec in lysing matrix D tubes containing 1.4 mm ceramic spheres (MP Biomedicals, USA) and lysis buffer (ML buffer) from the NucleoSpin miRNA isolation kit (Macherey-Nagel, Germany) using a FastPrep-24TM 5G instrument (MP Biomedicals, USA). The NucleoSpin miRNA isolation kit was used to extract total RNA according to the manufacturer’s protocol. A ratio of sample absorbance at 260 nm and 280 nm in the range of 1.9 to 2.2 was acceptable. RNA from TG was synthesized into cDNA using the RT2 First Strand Kit (Qiagen, USA) according to the manufacturer’s protocol. qPCR was performed in a 10 µl reaction volume containing RNAase free water, 20× TaqMan gene expression assay (ThermoFisher Scientific, USA), 2× TaqMan universal PCR master mix (ThermoFisher Scientific, USA) and 2 µl cDNA using the QuantStudio 12K Flex real-time PCR system (ThermoFisher Scientific, USA) with ROX as a passive reference. The thermal cycling condition included an initial denaturation step at 50°C for 2 min and 95°C for 10 min followed by 45 PCR cycles at 95°C for 15 sec and 60°C for 1 min. A no-template was used as negative control for all TaqMan gene expression assays, where RNAse free water was added instead of cDNA. All TaqMan gene expression assays were run in triplicate for each sample. Genes of interest: PACAP (does not separate between PACAP-27 and PACAP-38, Adcyap1; Rn00566438_m1), PAC1 receptor (Adcyap1r1; Rn01763128_m1), CGRP (Calca; Rn00569199_m1), CLR (Calcrl; Rn00562334_m1) and RAMP1 (Ramp1; Rn01427056_m1). TATA-box binding protein (Tbp) (Rn01455646_m1), beta-2-microglobulin (B2m, Rn00560865_m1), hypoxanthine phosphoribosyltransferase 1 (Hprt1, Rn01527840_m1) and glyceraldehyde-3-phosphate dehydrogenase (Gapdh) (Rn01749022_g1). Tbp, B2m, Hprt1 and Gapdh were used as reference genes. All TaqMan gene expression assays are commercially available at ThermoFisher Scientific and not custom-made.
Immunohistochemistry
TGs and segments of dura mater, from 6 additional rats, were carefully dissected. The dura segments (from inside the temporal area of the skull) were after a wash in PBS-T buffer, spread out on microscope slides (Superfrost, ThermoFisher) and allowed to dry. The dried dura mater spreads and TGs were then fixated with 4% paraformaldehyde (Sigma, St Louis, USA) diluted in phosphate buffered saline (PBS) for 2–4 hours. Subsequently, the tissues were washed in rising concentrations of 10% and 25% of sucrose in Sorensen’s phosphate buffer (pH 7.2) to ensure cryo-protection. The microscope slides with dura mater spreads were dried of excess fluid and stored at −20°C. Finally, the TGs were embedded in a gelatine medium (30% egg albumin, 3% gelatine), sectioned at 10 µm, and stored at −20°C.
TG sections and dura mater spreads were washed in PBS containing 0.25% Triton-X (PBS-T) for 15 minutes followed by application of the primary antibody with incubation overnight at +4°C in moisturised incubation chambers. The following day, the sections were washed twice in PBS-T for 15 minutes prior to incubation with secondary antibodies for 1 hour at room temperature. Finally, the sections were washed for 2 × 15 minutes and mounted with Vectashield mounting medium containing 4’,6-diamidino-2-phenylindole (DAPI) (Vector Laboratories, Burlingame CA, USA). The antibodies and concentrations used are given in Table 1.
Primary and secondary antibodies used.

For double immunohistochemistry, the procedure was repeated twice. The first primary antibody was matched with its appropriate secondary antibody. This procedure was repeated with another primary antibody, its secondary antibody, and lastly mounted. Negative controls were performed for each set by omitting the primary antibody. Any resulting immunofluorescence would suggest unspecific binding of the secondary antibodies. The sections were examined in a light and epifluorescence microscope (Nikon 80i, Tokyo, Japan) equipped with a Nikon DS-2MV camera. Finally, images were processed using Adobe Photoshop CS3 (Adobe Systems, Mountain View, CA, USA).
Quantification of PACAP-38/CGRP double stained cells was performed by identification of the thickest part of the ganglion in the microscope. By using the 10× objective, the thickest part of the ganglion covered the screen, showing 0.75 mm2. All immunoreactive CGRP, PACAP-38 and double stained cells were counted. The mean percentage of PACAP-38/CGRP positive neurons in three slides of three rats was calculated.
Statistics
Data for CGRP/PACAP release are shown with individual data points and their mean ± SEM, where n = the number of animals. The p-values obtained with Student’s t-test are depicted in the graph. For the correlation, data are shown as individual data points with p-values and R2 obtained from the correlation analysis in GraphPad 8. Relative amounts of mRNA transcript were determined as Ct (threshold cycle) values. Data is presented as median and interquartile range and n = the number of animals.
Results
CGRP/PACAP release
To investigate the relationship between PACAP and CGRP, we opted for detecting the two peptides from the same sample using commercially available ELISA kits. We chose to focus on the dura mater and the TG as they are both outside the BBB and therefore the most likely origin of the peripheral pain symptoms in migraine. When stimulating with 60 mM K+, there was no increase in the dural PACAP level (38.1 ± 6.1 pg/mL, p = 0.5) but a significant increase was seen from the TG (75.5 ± 22.8 pg/mL, p = 0.040). This shows that PACAP release by depolarization in the trigeminovascular system only occurs in the TG. We compared the data to CGRP levels from the same samples (Figure 1(a)). The baseline values were similar as previous results from both the dura (27.1 ± 3.5 pg/mL) and the TG (37.1 ± 4.7 pg/mL) (36). When applying 60 mM K+, CGRP was significantly increased in both the dura (120.5 ± 7.6 pg/mL, p < 0.001) and from the TG (121.7 ± 14.6 pg/mL, p < 0.001). We looked further into the consistency of the release, and it is apparent from Figure 1(b) that the PACAP release is not very consistent compared to the CGRP release, which was increased in all samples.

In situ PACAP and CGRP release from the dura or trigeminal ganglion. (a) The addition of 60 mM KCl (K+) caused no PACAP release from the dura (n = 10) but a significant release was seen from the TG (n = 10). CGRP release was much stronger both from the dura and the TG. (b) Graphical illustration of the sample pairing. (c) The addition of 100 nM capsaicin (C) or subsequent addition of 1 µM capsaicin (C2nd) caused no PACAP release from the dura (n = 7) but a significant release was seen from the TG (n = 7). CGRP release was again much stronger both from the dura and the TG. (d) Graphical illustration of the sample pairing. B: baseline.
Since CGRP is well known to be released after stimuli with the transient receptor potential vanilloid 1 (TRPV1) agonist capsaicin, we wanted to examine whether the results were similar to those for the depolarization. Again, there was no release of PACAP from the dura mater samples with either 100 nM capsaicin (p = 0.095) or a subsequent addition of 1 µM capsaicin (p = 0.46); if anything, the level was reduced. For CGRP, the release was high and consistent (p < 0.001). With the second stimulus of 1 µM capsaicin, there was still a high release from the dura, although significantly lower that the first stimulus (p = 0.028), suggesting that the sensory nerves are “emptied”. For the TG, there was a significant release of PACAP (68.1 ± 9.6 pg/mL, p = 0.025) and with a slight increase compared to the second stimulation of capsaicin (102.4 ± 43.9 pg/mL, p = 0.073). For CGRP the trend was similar, with a strong release after 100 nM (181.7 ± 13.2 pg/mL, p > 0.001) which was even higher after 1 µM capsaicin (298.7 ± 40.3 pg/mL, p = 0.017). As for the depolarization stimulus, the CGRP release was much more consistent than that of PACAP (Figure 1(d)). Interestingly, stimulating TG with capsaicin generated a significantly higher CGRP release than for the 60 mM K+ stimulus (p = 0.01). This was not the case for PACAP (p = 0.80).
Effects of the 5-HT1B/1D agonist sumatriptan
Since sumatriptan is the current “gold standard” anti-migraine drug, we applied 30 µM of sumatriptan in a subgroup of samples to test if it was possible to inhibit PACAP release from the TG after a depolarization stimulus (Figure 2(a)). We observed a weak inhibition of the PACAP release from the TG (74.4 ± 15.5 pg/mL vs. 48.3 ± 5.6 pg/mL, p = 0.11). It is evident that the main reason for the lack of significant effect is due to the inconsistent PACAP release. In the four (out of six) animals with high PACAP release in the TG (Figure 2(b)), there was a significant reduction in the PACAP release from the TG (p = 0.005, n = 4). This suggests that sumatriptan may limit the PACAP release within the TG. In a similar setup, 30 µM sumatriptan inhibited CGRP release (37), and this was not repeated here. Since there was slightly higher absolute release with capsaicin, we performed similar experiments with sumatriptan. We did not observe significant reduction in either PACAP release (p = 0.63) or CGRP release (0.49). For the second stimulation with 1 µM capsaicin, there was a tendency to inhibit the release for both PACAP (p = 0.24) and CGRP (p = 0.11). The lack of significant inhibition of CGRP release in the same setup has been seen before (38) and suggests that the capsaicin stimulus might be too potent for it to be inhibited with sumatriptan.
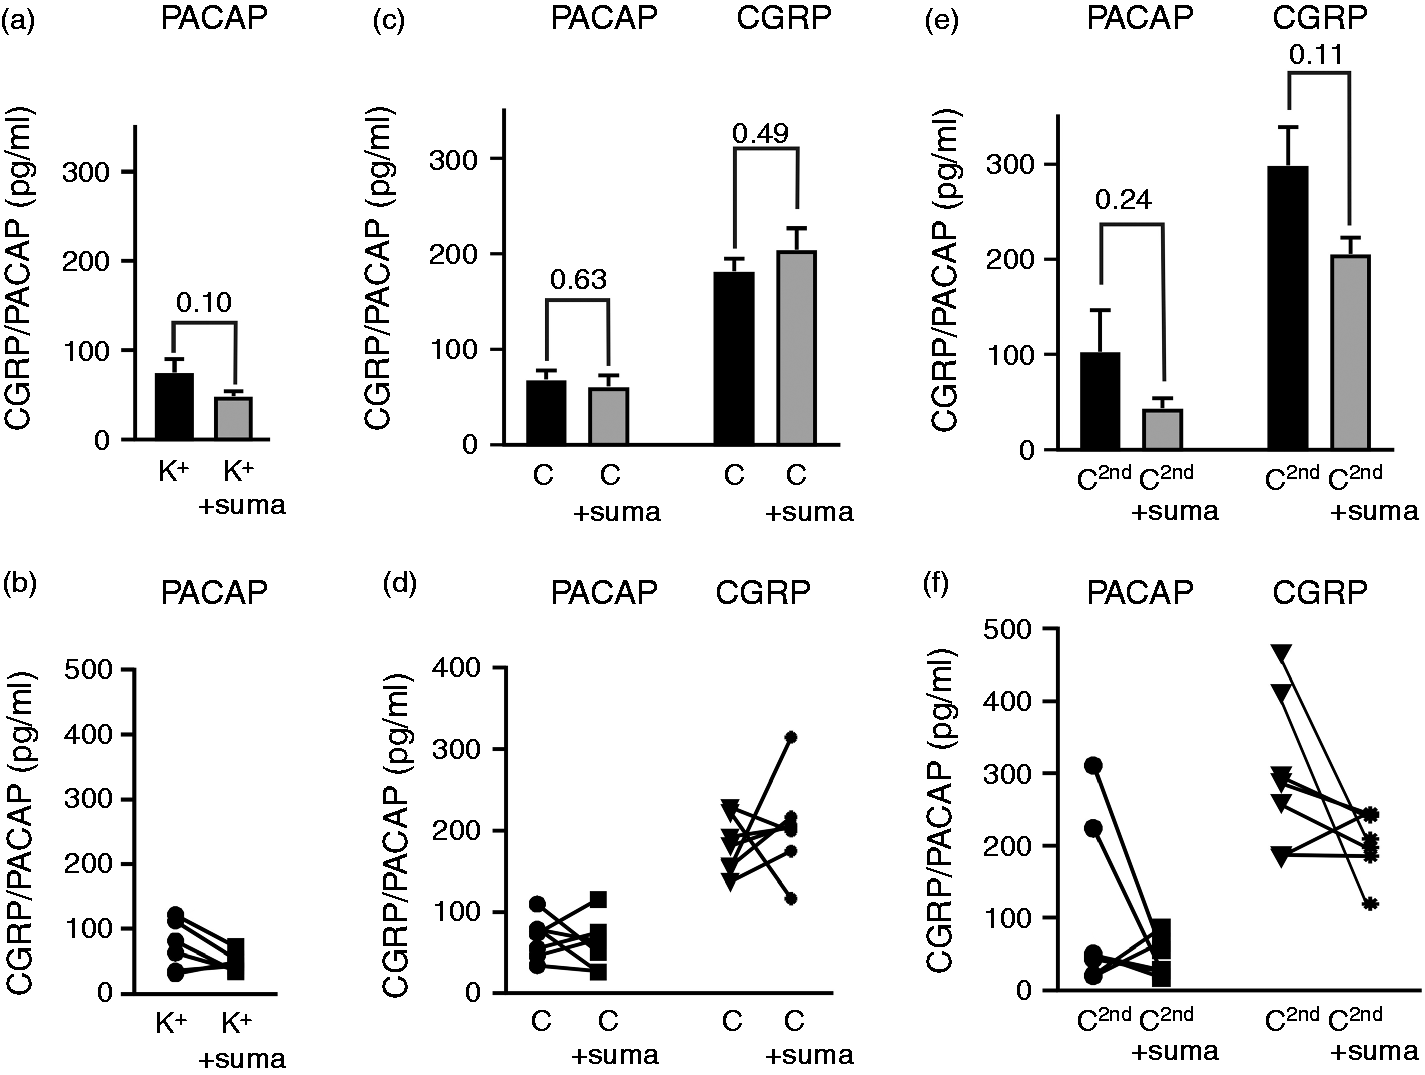
Effects of sumatriptan on in situ PACAP and CGRP release. (a) In a paired experiment, the addition of 60 mM KCl (K+) caused a weak PACAP release which was lower with the addition of 30 µM sumatriptan from the TG (n = 6). (b) The reduction was only observed in samples from animals with high PACAP release, seen in the figure with animal pairing. (c) For the initial 100 nM capsaicin (C) addition we did not observe significant inhibition, data shown with animal pairing (d). (e) For the subsequent 1 µM capsaicin (C2nd), there was a tendency to inhibition, particularly in from the animals with high release (f).
CGRP/PACAP release correlation
Since we had data from both the CGRP and PACAP contents from the same samples, we performed a correlation analysis. Firstly, we correlated baseline or “constitutive” release from all the samples. There was no significant correlation in the constitutive release for the dura mater samples (Figure 3(a), R2 = 0.021, p = 0.871) or the TG (Figure 3(b), R2 = 0.251, p = 0.390). Secondly, there was no correlation between the samples collected after stimulation (either for K+ or for capsaicin) of the two peptides from the dura (Figure 3(c), R2 < 0.001, p = 0.958 for K+, R2 = 0.083, p = 0.420 for capsaicin). In the TG, we observed correlation for both the depolarization (Figure 3(d), R2 = 0.630, p = 0.033) and for the capsaicin stimulus (Figure 3(d), R2 = 0.645, p = 0.005). For the second higher capsaicin stimulation, the correlation was even more robust (Supplemental Figure 1, R2 = 0.894, p = 0.0013).
Analysis of mRNA expression
The low level of release of PACAP could have an origin in less expression of PACAP in the trigeminovascular system. RNAseq has previously been performed on TG from the same rat strain and breeding facility (35) as in the current study. We re-analysed the data from this RNAseq, aiming to confirm the data using qPCR. The reference genes chosen were similarly expressed across the two data sets (Figure 4(a) and 4(b)). Further, the RNAseq data showed that the CGRP expression was 44 times higher than the PACAP expression (Figure 4(c)). We confirmed the data and showed that although PACAP is relatively strongly expressed (Ct = 24.5 ± 0.03), compared to the expression of CGRP (Figure 4(d)), there is around 60 times more mRNA for αCGRP (Ct = 22.7 ± 0.19) than of PACAP.

Correlation of in situ PACAP and CGRP release from the same dural or trigeminal ganglion samples. Correlations of constitutive release (the baseline measurement) from the dura (a) or the TG (b). No significant correlation was observed. The stimulated (addition of 60 mM KCl, K+ or 100 nM Capsaicin (C) release of PACAP and CGRP from the same dura (c) or TG (d). Significant correlation was observed for the TG data. Data are shown as individual data points with p-values and R2 obtained from the correlation analysis.

mRNA expression in the trigeminal ganglion. Expression of reference genes (Hprt1, Tbp, Gapdh, and B2m) from the RNAseq (a) data set (35) or the data from this work (b). Expression of mRNA for CGRP and PACAP from the RNAseq data set (c) or the current work (d). Data are shown as normalized counts of mRNA (RNAseq) or Ct values (current qPCR) with median and interquartile range (n = 6).
Immunohistochemistry
Although there are data on CGRP and PACAP system expression, new antibodies are available, which is why we wanted to add more data on the relationship between these two signalling peptides and to visualise and quantify these in the trigeminovascular system (Figure 5(a)). CGRP immunoreactivity was mainly found in the neuronal cell somas. In addition, pearl-like CGRP immunoreactivity was detected in unmyelinated C-type sensory fibres. PACAP-38 expression was observed in some neuronal cell somas and occasional SGCs. Neurons positive for CGRP and/or PACAP-38 were counted in six sections per rat, from three individual rats. A total of 745 neurons were positive for either PACAP, CGRP or both. Out of the 745 counted neurons, 507 neurons were positive only for CGRP (68%), 173 were positive only for PACAP (23%) and 65 were positive for both CGRP and PACAP-38 (9%, Figure 5(b)).

Expression of CGRP and PACAP-38 in the trigeminal ganglion. (a) CGRP (mouse, Abcam) immunoreactivity was mainly found in the neuronal cell soma visualized as positive grains in the cytoplasm (thin arrow). The cellular CGRP is packed in vesicles that are surrounded by the endoplasmic reticulum/Golgi apparatus. Pearl-like CGRP immunoreactivity was detected in fibres that are of the C-type of sensory unmyelinated nerves (thick arrow). PACAP-38 expression (guinea pig, Peninsula Laboratories) was observed in neuronal cell soma (arrow) and SGCs (arrow heads). Co-localization was observed in a few neurons (thin arrow). (b) The mean percentage of PACAP-38/CGRP positive neurons in three slides from three rats was counted and the data are summarized in the diagram, with the total PACAP-38 or CGRP positive neurons being 745.
Regarding the receptors, the PAC1 (Ct = 29.4 ± 0.19) receptor is expressed at similar levels to the CGRP receptor elements CLR (Ct = 28.9 ± 0.12) and RAMP1 (Ct = 27.9 ± 0.15). The data are presented in Supplemental Figure 2. qPCR does not say anything of the localization of the receptors, and since there was some correlation in the CGRP/PACAP release we therefore asked if there could be common targets for CGRP and PACAP. The CGRP receptor component RAMP1 was expressed mainly in large neurons (together with CLR (24)). In addition, expression was seen in the thick fibres, typical for Aδ-fibres (Figure 6, panel 1). For the PAC1 receptor expression, it was found in SGCs and fibre-like structures (Figure 6, panel 1). We did not observe any co-localization between RAMP1 and PAC1 immunoreactivity.[AQ8]

Expression of RAMP1 and PAC1 in the trigeminal ganglion. (Panel 1) The CGRP receptor component RAMP1 (goat, Merck & Co) was expressed in mainly the large neurons (thick arrow). In addition, expression was seen in the thick fibres, typical for Aδ-fibres (thin arrow). PAC1 (rabbit, Abcam) immunoreactivity was found in the SGCs (arrowhead) and in structures spanning along the fibres (asterisk). No co-localization was found between RAMP1 and PAC1. (Panel 2) Myelinated Aδ-fibres displayed MBP (mouse, Thermo Fisher Scientific) immunoreactivity (arrows, green). PAC1 (rabbit, Abcam) immunohistochemistry showed staining that seemed to be localized between the MBP positive fibres (arrow heads, red). No obvious co-localization was found between MBP and PAC1. (Panel 3) Transversal fibre sections show MBP immunoreactivity ensheathing the neuronal processes (arrow, green). Some neuronal processes were PAC1immunoreactive (asterisk, red). In addition, the surface of the fibres expressed PAC1 (arrowhead). PAC1 positive cells, found in the space between the fibres, were also observed (two asterisks).
Since we observed that PAC1 receptor staining aligned with what appeared to be neuronal Aδ-fibres cores in the TG, we investigated the link with the myelinated Aδ- fibres displayed by myelin basic protein (MBP) immunoreactivity. PAC1 receptor immunohistochemistry showed staining that seemed to be localized between the MBP positive fibres (Figure 6, panel 2). Applying transversal fibre sections, we observe immunoreactivity at the surface of the fibres, indicative of Schwann cell staining. We also detected PAC1 positive cell bodies, found in the space between the fibres. Some neuronal processes were also immunoreactive (Figure 6, panel 3).
We did not observe any stimulated release from the dura preparations. To confirm the absence of PACAP, we performed immunohistochemistry on dura mater spreads (Figure 7). In these dura samples, we could not observe any clear PACAP-38 immunoreactive fibres unlike that for CGRP where many fibres were clearly observed (Figure 7, panel 1). Regarding the receptor expression, we only observed expression of the CGRP receptor element (RAMP1) and did not detect any clear PAC1 receptor staining in the dura mater samples (Figure 7, panel 2). Combined with the release data, this shows that the TG soma is the only origin of the PACAP peptide and cells expressing the PAC1 receptor. Therefore, if PACAP plays a role in migraine, the signalling most likely originates in the TG itself.

Expression of CGRP and PACAP system elements in the dura.(Panel 1) In these dura mater samples, we could not observe any clear PACAP-38 (guinea pig, Peninsula) fibres unlike for CGRP (mouse, Abcam) which were clearly observed. (Panel 2) Further, we only observed expression of the CGRP receptor element RAMP1 (goat, Merck & Co) and did not detect any clear PAC1 (rabbit, Abcam) staining in the dura.
Discussion
This is the first study designed to examine stimulated PACAP release from the trigeminovascular system in situ. The data demonstrate that there is no PACAP release from the dura mater, but a small but significant release occurs from the TG. We also detected some overlap between the cells expressing PACAP and CGRP, and there is a correlation in the release of the peptides when the TG is stimulated with K+ or capsaicin. Below, we will discuss this in the light of current understanding of migraine pathophysiology and current clinical developments.
Physiology of PACAP release
Is it possible to extrapolate the knowledge and success on the CGRP system and primary headache pathophysiology (39) to PACAP? Available clinical data does not suggest a significant role of PACAP release occurring in conjunction with a migraine attack, as only CGRP levels has been shown to be elevated in migraineurs compared to healthy volunteers (40). Nevertheless, there are data showing that PACAP is increased during a migraine attack, but notably this is from a significantly lower baseline (22,26), and migraine-like attacks can be induced in humans by IV infusion of both PACAP-38 and PACAP-27 (28,41).
Our data show there is a strong release of CGRP both from the dura mater and from the TG (Figure 1), most likely from C-fibres and cell soma (Figures 5 and 7), which contrasts to a minor release of PACAP only occurring from the TG and not from the dura, and possibly directly from neuronal soma, as no PACAP positive fibres were observed (Figure 1, 5 and 7). PACAP-38 was seen in few of the CGRP positive neurons (about 13%) and in occasional SGCs, which is similar to previous reports (23,42). CGRP release from both dura and TG is well established (37,38,43,44). CGRP release was stronger with capsaicin stimulation compared to 60 mM K+, unlike that of PACAP, suggesting different triggering and/or pools of release. Indeed, it has been suggested that there exist two pools for CGRP release (44), which does not appear to be the case for PACAP in our study.
In the dura mater, we did not observe any evident PACAP-38 immunoreactivity. Rice et al. found no PACAP staining in the dura (45), which contrasts with the data from Frederiksen et al. and Eftekhari et al., where some immunopositivity was observed (23,42). We do observe a weak constitutive dural level of PACAP in the hemi-skull model (Figure 1), but this could be an overflow from parasympathetic nerves where PACAP expression is stronger than in sensory fibres (24). We conclude, based on both release data and expression data, that PACAP is only present in and released from the soma of TG neurons.
What is the possible target of released PACAP in the TG? Our data suggest that PACAP released within the TG might target PAC1 receptors located primarily on the SGCs in the TG (Figure 6, panel 1 and 2). Interestingly, our study revealed that PAC1 receptors are also located specifically on the outer lay of the Schwann cells surrounding the Aδ-fibres, with an additional staining in a few of the cores of the Aδ-fibres (Figure 6, panel 3). Combined, this indicates that a PAC1 receptor blocker would be less effective at treating episodic migraine pain than, for example, anti-CGRP treatments or triptans. Indeed, the preliminary results from the human anti-PAC1 antibody trial appears to be negative when it comes to migraine prophylaxis (46).
Clinical relevance
Results from isolated blood vessels or in vivo studies in rats suggest that VIP, PACAP-38 or PACAP-27 mainly act on the VPAC1 or VPAC2 receptors on the vascular smooth muscle cells (47,48). This contrasts, however, to the data by Syed et al., which did not show that the PAC1 receptor antagonist PACAP6-38 could inhibit dilatation in response to picomolar concentrations of PACAP-38 (49). Nevertheless, vasodilation of the dural vasculature is not associated with any activation of the central trigeminovascular neurons in the TNC (50). However, PACAP-38 induced central activation in the brainstem after a delay of 2 hours, a phenomenon in accord with the clinical experiments (27). These responses were unmodified by any available VIP/PACAP receptor blockers (50). Regarding further potential relevance of PACAP in central structures, concentrations of PACAP and CGRP has been determined simultaneously in the TNC from the same samples in the complete Freund’s adjuvant model. The two neuropeptides showed similar expression patterns and their increase in expression manifested in the level of hyperalgesia. The central effect of PACAP and CGRP is therefore not excluded in the pathophysiology of migraine, but their provoking mechanisms and the strength of the effect may be different (51).
There is therefore, in light of our and previous results, a possibility that dysregulation of the PACAP system could be linked to migraine pathophysiology, as we showed that PACAP can be released in the TG and previous data suggest that it is increased under a migraine attack, although from a low baseline (22,25). In addition, we cannot exclude that PACAP has a central effect, as PACAP has been shown to possibly cross the BBB, and this could explain the triggering of migraine-like attacks by PACAP-38 or PACAP-27 (27,28). Unfortunately, antibody medications will not cross the BBB (52), and similar difficulty in reaching central nervous system (CNS) targets applies to many types of anti-migraine drugs.
In the periphery, PACAP has been shown to be released from human mast cells (53) and further degranulate mast cells via a receptor that is unrelated to those known from detailed classifications of the VIP/PACAP family of peptides (31,54). It has been postulated that this response is caused by activation of the orphan MrgB3-receptor (55) or the Mrgprx2 receptor (56). These receptors are nearly undetectable in the TG, around ∼ 300 times less then PAC1 (35). This is confounding as histamine release in the periphery is coupled to an inflammatory response with pain or irritation. Currently the relevance of neurogenic inflammation and its impact on migraine is unclear (57).
Is there then a role for PACAP in migraine pathophysiology? The role of the PAC1 receptor in pain generation is a complicated subject as the PAC1 receptor has been reported as both pro-nociceptive and anti-nociceptive (58). PAC1 receptor activation has recently been shown to enhance sympathetic nerve activity as a response to hypoxia (59), which suggests that PACAP could be a cytoprotective peptide and not primarily nociceptive. Indeed, several studies in stroke research have shown that PACAP inhibits reactive oxygen species-induced cell death (11,60) and decreases neuroinflammatory responses (61,62). Despite the failure of the anti-PAC1 receptor antibody, there might be unknown targets for PACAP. Alder (acquired by Lundbeck) has an anti-PACAP antibody (ALD1910) under development (63). This approach does not require a known receptor, and an anti-migraine effect could be mediated by other receptors, such as MrgX2, which is the human equivalent of the MrgB3 receptor (55). The results from the clinical trial will provide the final conclusion of the involvement of PACAP in migraine pathophysiology.
Conclusion
In conclusion, we show that PACAP is released from the trigeminovascular system in rats. In contrast to CGRP, PACAP is only released from the TG, and not from sensory fibres in the dura mater. Although PACAP is released by similar stimuli to CGRP in the TG, the release is much less consistent and at a low level, suggesting it is not released in the same manner as CGRP. The PAC1 receptor is mainly found in the SGCs and in some neuronal processes. In addition, PAC1 receptor expression is observed in structures spanning along the sensory Aδ-fibres and on the surface of the myelinated fibres, possibly on Schwann cells in the TG. Thus, the PAC1 receptor does not co-localize with the CGRP receptor. Considering that the PAC1 receptor antibody was unsuccessful in a phase 2 clinical trial, we do not believe that the PAC1 receptor is involved in the direct sensation of pain in migraine pathophysiology but might have a more modulatory role both in the TG and possibly also in the CNS. Further, chronic blocking general PACAP signalling could involve neuroprotective, anti-inflammatory and cytoprotective effects.
Key findings
Unlike CGRP, PACAP is not released from C-fibres in the dura mater. Both PACAP and CGRP are released from the TG. When capsaicin is used as the release stimulus, we observe a correlation in the TG. The PAC1 receptor does not co-localize with the CGRP receptor.
Supplemental Material
sj-pdf-1-cep-10.1177_0333102420929026 - Supplemental material for Differences in pituitary adenylate cyclase-activating peptide and calcitonin gene-related peptide release in the trigeminovascular system
Supplemental material, sj-pdf-1-cep-10.1177_0333102420929026 for Differences in pituitary adenylate cyclase-activating peptide and calcitonin gene-related peptide release in the trigeminovascular system by Jacob Carl Alexander Edvinsson, Anne-Sofie Grell, Karin Warfvinge, Majid Sheykhzade, Lars Edvinsson and Kristian Agmund Haanes in Cephalalgia
Footnotes
Declaration of conflicting interests
The authors declared no potential conflicts of interest with respect to the research, authorship, and/or publication of this article.
Funding
The authors disclosed receipt of the following financial support for the research, authorship, and/or publication of this article: This work was supported by the Lundbeck foundation, Lundbeck Grant of excellence [no. R59-A5404], the Swedish Heart Lung Foundation [no. 20130271]. The funders had no role in study design, data collection and analysis, decision to publish, or preparation of the manuscript.
References
Supplementary Material
Please find the following supplemental material available below.
For Open Access articles published under a Creative Commons License, all supplemental material carries the same license as the article it is associated with.
For non-Open Access articles published, all supplemental material carries a non-exclusive license, and permission requests for re-use of supplemental material or any part of supplemental material shall be sent directly to the copyright owner as specified in the copyright notice associated with the article.