
Abstract
Objectives
Although iron accumulation in pain-processing brain regions has been associated with repeated migraine attacks, brain structural changes associated with post-traumatic headache have yet to be elucidated. To determine whether iron accumulation is associated with acute post-traumatic headache, magnetic resonance transverse relaxation rates (T2*) associated with iron accumulation were investigated between individuals with acute post-traumatic headache attributed to mild traumatic brain injury and healthy controls.
Methods
Twenty individuals with acute post-traumatic headache and 20 age-matched healthy controls underwent 3T brain magnetic resonance imaging including quantitative T2* maps. T2* differences between individuals with post-traumatic headache versus healthy controls were compared using age-matched paired t-tests. Associations of T2* values with headache frequency and number of mild traumatic brain injuries were investigated using multiple linear regression in individuals with post-traumatic headache. Significance was determined using uncorrected p-value and cluster size threshold.
Results
Individuals with post-traumatic headache had lower T2* values compared to healthy controls in cortical (bilateral frontal, bilateral anterior and posterior cingulate, right postcentral, bilateral temporal, right supramarginal, right rolandic, left insula, left occipital, right parahippocampal), subcortical (left putamen, bilateral hippocampal) and brainstem regions (pons). Within post-traumatic headache subjects, multiple linear regression showed a negative association between T2* in the right inferior parietal/supramarginal regions and number of mild traumatic brain injuries and a negative association between T2* in bilateral cingulate, bilateral precuneus, bilateral supplementary motor areas, bilateral insula, right middle temporal and right lingual areas and headache frequency.
Conclusions
Acute post-traumatic headache is associated with iron accumulation in multiple brain regions. Correlations with headache frequency and number of lifetime mild traumatic brain injuries suggest that iron accumulation is part of the pathophysiology or a marker of mild traumatic brain injury and post-traumatic headache.
Keywords
Introduction
Post-traumatic headache (PTH) attributed to mild traumatic brain injury (mTBI) is defined as a headache that develops within 7 days after the injury, regaining consciousness, or discontinuing medications that impaired the ability to sense or report headache (1). PTH is a common symptom following mTBI (2), often becoming persistent and associated with other post mTBI sequelae such as cognitive dysfunction, fatigue, dizziness, vestibulo-ocular dysfunction, insomnia and psychological symptoms (3). When patients with PTH are seen in clinic, their headaches most often have a “migraine-like” phenotype, meaning that their symptoms are very similar to those of migraine (4,5).
In migraine, imaging studies report iron accumulation in deep brain structures (6–9) and associations between increased iron accumulation in multiple deep brain nuclei involved in pain processing (7,8) and frequency of migraine attacks. Specifically, increased iron in periaqueductal gray and red nucleus, identified via magnetic resonance imaging (MRI), correlates with disease duration and frequency of attacks (6–8). Despite similarities between migraine and PTH symptoms, there is a lack of investigations into iron accumulation in patients with PTH.
We postulated that increased iron accumulation would be found in brain regions that process pain, and that iron accumulation would associate with measures of PTH burden and number of mTBIs.
MR sequences frequently used for detection of iron are T2 (10,11) and T2*- weighted. T2* decreases in the presence of paramagnetic or diamagnetic contrast agents in the tissue or due to susceptibility artifacts arising from local air/tissue boundaries. T2* reduction correlates with iron accumulation (12) and has been attributed to progression of several neurological disorders (13–15).
This exploratory study aimed to indirectly assess iron deposition using quantitative T2* maps in PTH subjects and healthy controls (HCs); to assess differences in iron deposition between subjects with PTH and age-matched HCs; and to determine associations between iron deposition with headache frequency and number of lifetime mTBIs to gain insight into brain regions involved in PTH and mTBI. The goal of this study was to interrogate PTH pathophysiology and to identify a potential brain biomarker for PTH.
Methods
Subject enrolment and characteristics
This study was approved by the Mayo Clinic and Phoenix VA Institutional Review Boards and all subjects were enrolled from the Mayo Clinic in Arizona and the Phoenix VA Health Care System. All research subjects provided written informed consent prior to participation. Data were collected over a 12-month period between 2020 and 2021. Subjects were between the ages of 18 and 65 years. Individuals with PTH were eligible for enrolment starting on the day of their mTBI until 59 days post mTBI.
All subjects met criteria for acute PTH attributable to mTBI in accordance with the ICHD-3 criteria (1). Prior to imaging, all subjects completed the following: A headache history, and the Ohio State University TBI identification questionnaire for determining history of TBI (16).
Healthy controls were recruited from the local community using advertisements and word of mouth. Exclusion criteria for control subjects included history of migraine or TBI. Individuals with tension-type headaches on three or fewer days per month were not excluded.
Imaging acquisition
All study participants underwent neuroimaging at Mayo Clinic Arizona on a 3 Tesla Siemens scanner (Siemens Magnetom Skyra, Erlangen, Germany) using a 20-channel head and neck coil. Anatomical T1 weighted images were acquired using a magnetization-prepared rapid image acquisition gradient-echo (MPRAGE) sequence with 1 mm isotropic resolution with repetition time (TR) = 2400 ms; echo time (TE) = 3.03 ms; flip angle (FA) = 8 degrees covering X = 160 mm, Y = 256 mm, Z = 256 mm. T2 images: TR = 6800 ms, TE = 84 ms, flip angle = 150 degrees. Voxel sizes = 1 × 1 × 4 mm. T2* maps were generated using 12 T2-weighted gradient echo (GRE) magnitude images with varying TE = 2.81, 5.71, 8.06, 10.46, 12.93, 15.4, 17.86, 29.78, 42.34, 54.9, 67.46 and 80 ms. Each GRE was a stacked 2D axial image, TR = 3200 ms, FA = 60 degrees with in-plane resolution of 0.94 × 0.94 mm and slice thickness of 4 mm providing a FOV of 240 × 240 × 132 mm.
T1 and T2 imaging were reviewed by a neuroradiologist. Subjects with abnormal imaging findings on T1 and T2 were excluded from the final analysis.
Image postprocessing
T2* maps were smoothed with an 8 mm kernel before they were normalized to Montreal Neurological Institute (MNI) space using an affine talaraich transformation in FREESURFER V7.1 (https://surfer.nmr.mgh.harvard.edu/). The high resolution T1-weighted images were used to generate the affine transformations to MNI space, and were then applied to the resampled and co-registered T2* maps, resulting in the T2* maps in MNI space being 1 mm isotropic. Full brain imaging analysis in MNI space used an inclusive mask extending at least 4 mm away from cerebrospinal fluid (CSF) to avoid contamination due to T2* bright spots in cerebrospinal fluid. Framewise displacement (FD) of bulk motion between echoes was calculated using SPM12 (https://www.fil.ion.ucl.ac.uk/spm/software/spm12/). The HC and PTH group averages of maximum and mean FD from each subject was reported and compared between groups using a two-tailed t-test.
Statistical analysis
Full brain T2* differences between PTH and HC were evaluated in MNI space by using age- matched paired t-test within SPM12. Cluster analysis was performed in SPM12 using uncorrected p < 0.01 and volume threshold >25 mm3 (25 voxels) examining T2* decreases in PTH compared to HC.
Multiple linear regression was conducted on the PTH subjects using the number of mTBIs and headache frequency as covariates. Since PTH had been present for varying durations at the time of enrolment, including individuals who had PTH for relatively short durations, headache frequency was reported as the percentage of days with headache since the mTBI. Cluster analysis was performed in SPM12 using a more conservative approach than the paired t-test using uncorrected p < 0.001 and volume threshold >100 mm3 (100 voxels). Cluster labelling was assisted with automated anatomical atlas ROI_MNI_V7 (10.1016/j.neuroimage.2019.116189). Both positive and negative correlations of T2* were investigated.
Results
This study included a total of 40 subjects whose demographics are outlined in Table 1. The PTH group attributed to mTBI consisted of 20 subjects (seven male, 13 female) with average age of 41.3 years (SD = 11.9, ranging from 25.5 to 62.8). The HC group consisted of 20 age-matched controls (eight male, 12 female) with an average age of 40.5 (SD = 12.4, range from 25.7 to 60.8). Age matching (PTH-HC) had an average difference of 0.8 years (SD = 2.5, range −4.8 to 6.5). The group average of maximum FD was 0.66 mm (SD = 0.24 mm, range 0.39 mm to 1.3 mm) for PTH and 0.57 mm (SD = 0.13 mm, range 0.36 mm to 0.90 mm) for HC (p = 0.14). The group average of mean FD was 0.33 mm (SD = 0.09 mm, range 0.21 mm to 0.59 mm) for PTH and 0.32 mm (SD = 0.09 mm, range 0.20 mm to 0.51 mm) for HC (p = 0.55). Table 1 summarizes headache and TBI characteristics. For individuals with PTH, 40% suffered an mTBI due to a motor vehicle accident, 40% due to a fall, 5% due to a fight, and 5% due to a direct impact to the head against an object. The remaining 10% had injuries that were categorized as “other”. The number of days between mTBI and imaging ranged from 4 to 58 days with an average of 20 days (SD = 14 days). Twelve subjects with PTH had one lifetime mTBI, three subjects had two lifetime mTBIs, and five subjects had three lifetime mTBIs.
Subject demographics and post-traumatic headache clinical variables and phenotypes. Time since mTBI is the number of days between the date of mild traumatic brain injury and the baseline visit.

PTH: post traumatic headache; HC: healthy controls, mTBI: mild traumatic brain injury.
Note: Headache frequency is reported as the percent number of days since mTBI with headache. Values reported as mean ± standard deviation.
Headache characteristics
Eight subjects reported that their headaches began immediately following injury, nine subjects reported headache starting within 1 day of the mTBI and three subjects reported that their headaches began >1 day post mTBI. Those with PTH had headaches on an average of 79% of the days since their TBI (SD = 26% with a range from 15% to 100%). Sixty-five percent of individuals with PTH had continuous headaches. According to the ICHD-3 diagnostic criteria for primary headaches, 10 had migraine-like headache phenotypes, six had tension-type headache phenotypes, three had probable migraine-like phenotypes, and one subject’s phenotype was not classifiable.
T2* Comparisons PTH vs. HC
The regions that demonstrated decreased T2* in PTH compared to HC (p < 0.01, >25 mm3) are shown in Table 2. The pons, right parahippocampal, right supramarginal, right postcentral, right rolandic, left putamen, left insula, left occipital, bilateral posterior and anterior cingulate, bilateral frontal and bilateral temporal, as well as bilateral hippocampal regions all show decreased T2* in PTH. Figure 1 depicts the spatial extent of the T2*changes.
Full 3D brain analysis of cluster results of T2* decreases in post-traumatic headache compared to age-matched healthy controls. The coordinates (x,y,z) in MNI space of the cluster centers, cluster volume, and the corresponding anatomical regions are listed. The T2* values, T-statistic, uncorrected p-value at the cluster center are provided. Only clusters surviving uncorrected p < 0.01 with cluster threshold of 25 mm3 (25 voxels) are shown.

HC: healthy controls; Mid: middle; Oper: operculum; PTH: post-traumatic headache; Post: posterior; Supp: supplementary; Sup: superior.

3D T-statistic differences of T2* are shown in standardized MNI space between individuals with post-traumatic headache and age-matched healthy controls. Only regions surviving cluster analysis (uncorrected p < 0.01 and greater than 25 mm3) are shown as follows: (a) cingulate bilateral, (b) hippocampus right, (c) rolandic right, (d) temporal pole left, (e) parahippocampal right, (f) pons, (g) supramarginal right, (h) temporal mid right, (i) temporal and insula left, (j) hippocampus left, (k) occipital supp left, (l) insula left, (m) post central right, (n) putamen left, (o) frontal medial bilateral, (p) anterior cingulate bilateral.
Correlations between T2* with headache frequency and number of mTBIs
The brain regions that were associated with number of mTBIs and headache frequency are shown in Table 3. Although both positive and negative relationships were investigated, only negative correlations were found to exist between T2* and either of the covariates surviving p < 0.001 and cluster threshold of 100 mm3.
Full 3D brain analysis cluster results of T2* negative correlates with headache frequency and number of mild traumatic brain injuries (uncorrected p < 0.001 with cluster threshold of 100 mm3 (100 voxels). Listed are the coordinates (x,y,z) in MNI space of the cluster centers, the volume of the cluster, the corresponding anatomical regions, and the T-statistic and uncorrected p-value at the cluster centers. No positive correlations of T2* with either headache frequency or number of mild traumatic brain injury were found.
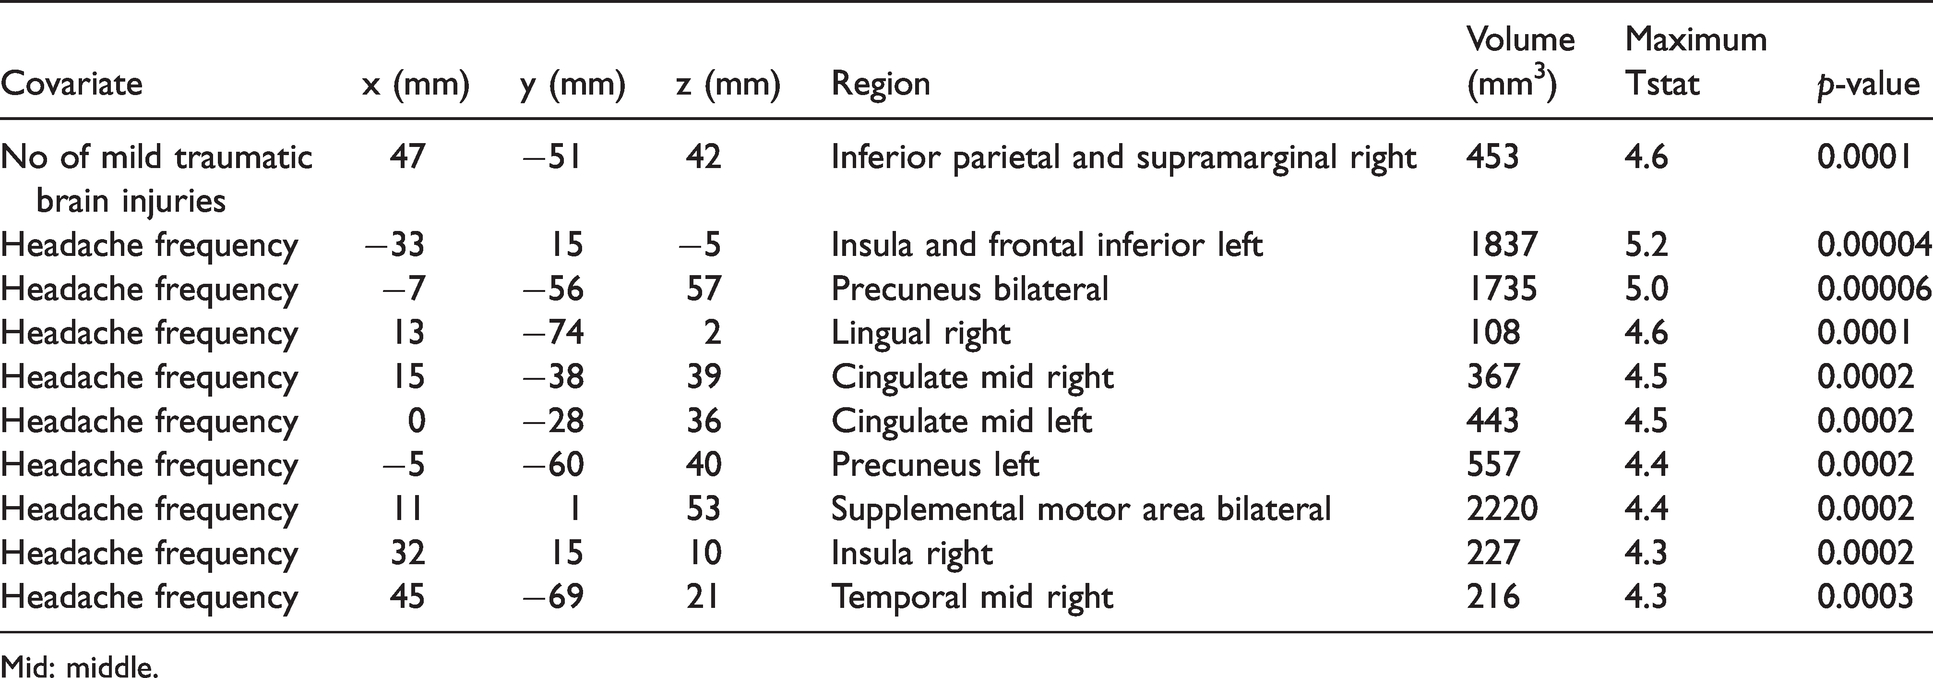
Mid: middle.
Only one cluster was found that showed negative association between T2* and lifetime number of mTBIs. This cluster overlapped the right inferior parietal, angular and supramarginal regions (Figure 2(a)). Headache frequency had a negative relationship to T2* in the following regions: Bilateral insula, bilateral middle cingulate, bilateral precuneus, bilateral supplementary motor areas, right lingual and right middle temporal (Figure 2(b) and (c)).

Multiple linear regression T-statistic results showing negative associations of T2* with clinical variables are shown. Only negative associations were found to survive cluster analysis (uncorrected p < 0.001 and greater than 100 mm3). (a) T2* correlation with the lifetime number of mild traumatic brain injury (mTBI) yielded one cluster with overlap between the right supramarginal and right parietal area. (b) T2* association with headache frequency in the bilateral cingulate, precuneus, and (c) in the left insula and frontal inferior.
Discussion
The main finding of this study is that PTH was associated with lower T2* values in multiple brain regions, suggesting higher iron accumulation. Furthermore, individuals with a higher headache frequency since their TBI and a higher number of lifetime mTBIs had even greater iron deposition. These preliminary findings suggest that PTH attributed to mTBI is associated with iron deposition in brain regions that participate in pain processing and perhaps in other aspects of mTBI and its sequelae.
For subjects with PTH, there were negative associations between T2* and both headache frequency (% days with headache since TBI) and lifetime number of mTBIs suggesting that increased headache burden and number of mTBIs associate with accumulative iron load. The right supramarginal area was one of the main regions to show a reduction in T2* with increase in lifetime number of mTBIs in PTH subjects and was also found to show decreased T2* in these subjects compared to HC. Although the supramarginal area has been shown to have atypical function and structure in migraine (17–19), a prior study showed that the supramarginal area was one of a few regions identified to be structurally different in persistent PTH compared to migraine (18). Further supporting its potential involvement in PTH, structural differences in a large anterior-parietal region that included the supramarginal gyrus were identified when comparing individuals who had mTBI with PTH vs. mTBI without PTH (20). Temporal changes in T2* (on the order of seconds) have been shown in the right supramarginal and right parahippocampal areas for mTBI (21), which are also found in the current study. The proposed hypothesis of these differences were of metabolic or vascular origin (21). Although Mayer et al. (21) did not specifically assess PTH, due to the large percentage of mTBI with PTH on average, the decreases in T2* may influence percent signal changes measured and provide additional information into explaining these temporal differences.
Negative associations between T2* with headache frequency were identified in numerous regions, including the precuneus and supramarginal areas, findings that are consistent with our previous PTH findings (4), as well as the insula, which has been reported to be involved with pain severity in PTH (22).
The region of decreased T2* in the brainstem in PTH compared to HC looks similar to the region in which structural changes have been previously found in migraine (23) and PTH (24). Activation of the brainstem has been reported during migraine attacks and might participate in migraine attack generation and symptoms (25–29). In our study, the largest spatially distinct measured decrease of T2* was identified in the dorsal pons in individuals with PTH. A multitude of studies have implicated the dorsal pons as participating in migraine pathophysiology (30–32). Our study suggests that a similar region of the brainstem might be involved in PTH. There are several nuclei in the brainstem that could be implicated in PTH and associated post-mTBI symptoms. However, in the current study the spatial resolution of MRI is not high enough to determine which brainstem nuclei are contained within the dorsal pontine region identified as having less T2*. As is nicely discussed in a review by Borsook and Burstein, this dorsal pontine region could contain nuclei important for headache and pain modulation including the mesencephalic and principal sensory trigeminal nuclei, parabrachial nucleus, and nucleus cuneiformis, as well as the locus coeruleus, which might participate in regulation and responses to stress and emotion; the vestibular nucleus, which could participate in nausea and dizziness; and the inferior colliculus, which could participate in auditory processing and hyperacusis that often accompanies PTH (30). Longitudinal studies that investigate dorsal pontine activation and functional connectivity are needed to investigate if this brainstem region is involved the generation of individual headaches associated with PTH. The reduced dorsal pons T2* observed in this study, indicative of increased iron accumulation and structural changes, is in agreement with literature findings of brainstem involvement in migraine and PTH. Abnormal metabolism has been observed in the pons in episodic migraine, suggestive of neuronal hypertrophy (33). Altered perfusion and glutamate levels have also been reported in the pons during migraine attacks, suggestive of glutamate mediated excitation (32). The pons has been associated with the premonitory phase in migraine patients using H215O-PET to measure regional cerebral blood flow (34).
Kruitt et al. reported a positive association between repeated migraine attacks and increase in iron concentration in deep brain nuclei involved in pain processing in individuals with migraine (7). Another study at lower field strengths (8), which was complicated by proposed age-related effects, found no significant differences in migraine T2*. The complication by age-related effects stated by the authors (8) is the rationale for introducing age matching in the current study. Another possible explanation is that susceptibility-related field distortions are magnetic field dependent and hence more sensitive (at higher field strengths) to the detection of iron accumulation. Furthermore, MRI findings of iron accumulation in the pain regulatory nuclei (red nucleus and the periaqueductal gray matter) were correlated with illness and attack frequency (6). Further evidence from the same study showed that duration of migraine was associated with decreased T2 values.
Structural brain differences have been shown in right hippocampus in TBI in conjunction with headache (35). Until now, T2* values have not been shown to correlate to mild TBI and PTH when compared to HC. Further investigation is required to elucidate the mechanisms of the contrast reported and to differentiate changes that are unique to headache.
Limitations
Although a full brain analysis is a powerful tool to detect small spatially localized changes, structural brain changes due to TBI can affect the normalization into MNI space. The risk is that due to structural abnormalities, different brain regions may be compared in the normalized group analysis. In this study, smoothing the data was performed as a way to mitigate this error.
Although decreased T2* is known to relate to iron accumulation there is a possibility that the decrease may be paramagnetic (due to hemorrhage, iron content, or venous blood), diamagnetic (due to calcification), or have contamination, which all may contribute differently in different regions. Higher spatial resolution acquisitions with phase information will be used in future studies to generate quantitative susceptibility maps in order to discriminate these possible sources of contrast.
Our post-hoc study findings identify a relationship between headache frequency and T2* values suggesting that headache burden associates with higher brain iron accumulation. However, these results will need to be validated in future studies that compare matched cohorts of subjects with post-traumatic headache due to mild TBI to subjects with mild TBI who do not have post-traumatic headache. Another limitation in the current study is the small sample size of 20 patients and 20 controls, which limits the power of the statistical tests. This study is an exploratory investigation of the entire brain (excluding the cerebellum) and no attempt was made to correct for multiple comparisons, which is consistent with exploratory whole brain investigations (36).
Conclusions
Relative to HC, individuals with PTH had lower T2* tissue values indicating higher iron accumulation in cortical, subcortical, and brainstem areas. For individuals with PTH, headache frequency and number of mTBIs positively correlated with higher regional iron accumulation suggesting that increased headache burden and number of mTBIs are both associated with accumulative iron load.
Key findings
T2* values decrease in post-traumatic headache in cortical, subcortical and midbrain regions. T2* values in several brain regions correlate negatively with headache frequency. T2* values in the right supramarginal gyrus correlate negatively with the number of mTBIs.
Footnotes
Acknowledgements
The authors would like to thank all participants and imaging coordinators for their time and dedication to this project.
Declaration of conflicting interests
The authors declared no potential conflicts of interest with respect to the research, authorship, and/or publication of this article.
Funding
The authors disclosed receipt of the following financial support for the research, authorship, and/or publication of this article: This study was funded by the National Institutes of Health, National Institute of Neurological Disorders and Stroke, Award Number 1R61NS113315-01.