
Abstract
Aim
To use an animal model of migraine to test whether migraine headache might arise from a brainstem-trigeminal nucleus pathway.
Methods
We measured evoked and spontaneous activity of second-order trigeminovascular neurons in rats to test whether the activity of these neurons increased following the induction of cortical spreading depression or the imposition of light flash – two potential migraine triggers, or headache provokers. We then tested whether drugs that could activate, or inactivate, neurons of the nucleus raphe magnus or the periaqueductal gray matter, would affect any such increases selectively for the dura mater.
Results
Injection of sodium glutamate (a neuronal excitant) into these two nuclei selectively inhibited the responses of trigeminovascular second-order neurons to dura mater, but not to facial skin, stimulation. Injection of lignocaine (a local anaesthetic) into these nuclei selectively potentiated the responses of these neurons to dura, but not to facial skin, stimulation. Furthermore, injections into either nucleus of glutamate inhibited the increase in the ongoing discharge rate of these neurons produced by cortical spreading depression and light flash.
Conclusions
These results provide indirect evidence that trigeminovascular nociception may be tightly controlled by these two nuclei, whereas cutaneous trigeminal sensation may be less so. These nuclei may be relays of one possible brainstem-trigeminal pathway that could mediate migraine headache. Modification of neuronal activity in these two nuclei produced by migraine (headache) triggers may lie behind the pain of a migraine attack, at least in some cases.
Keywords
Introduction
Migraine can be “spontaneous”, be foreshadowed by prodromes, be driven by biological rhythms, or can be “triggered”, or “provoked”, by events in the external milieu, such as light flicker (LF). The complex interrelationships between prodromes, triggers and headache provokers are the subject of recent reviews and a meta-analysis (1–3).
We have proposed (4) that, in the early stages of a migraine attack, there is cortical neuronal excitation somewhere that produces both the neurological symptoms and the pain of a migraine headache. We summarised there (4) the many associations between cortical activation and headache. In some cases, this activation is sufficiently intense to produce a “spill-over” effect in an adjacent cortex, such that the excitation spreads as cortical spreading depression (CSD).
We have shown (5) that CSD can increase spontaneous neuronal activity in second order trigeminovascular neurons, even when transmission through the trigeminal ganglion has been blocked. We therefore hypothesised the possibility of a (cortico)–brainstem–trigeminal nucleus pathway that could account for these findings. If headache provokers, or triggers, cause changes in cortical excitability, which then produce changes in brainstem control of trigeminovascular sensation by opening the “pain gate”, this could transform often subliminal perceptions caused by innocuous trigeminovascular sensory traffic into the perception of headache. There are several brainstem nuclei that could be involved in such a process (6–11). Based on research by others (listed in our previous review (4)), we suggested that two likely structures that could transform cortical excitability changes into trigeminovascular perception changes are the nucleus raphe magnus (NRM) and the periaqueductal grey matter (PAG) (12).
Our aims in this series of experiment were two-fold:
To test whether interventions in the NRM and PAG could alter the responses of trigeminovascular second-order neurons to: (a) Peripheral noxious dura, or skin, stimulation; and (b) potential migraine triggers, and supposed headache provokers, CSD or LF To determine whether any alterations by these interventions were selective for one, or other, of dura and skin nociception
Methods
Surgery
We have described the methods used in these experiments previously (12,13), and here in the Supplemental Material. Briefly, experiments were performed on 60 Sprague Dawley rats 250–350 g (35 males, 24 females, one not recorded). Full results were obtained from 52. Rats were anaesthetized with intraperitoneal injections of urethane 1.5 g kg−1. Blood pressure (BP) was monitored, and drugs were injected via catheters in the femoral artery and vein, respectively. Core body temperature was maintained at 37°C to 38°C.
The trigeminal nucleus caudalis (TNC) was exposed at the obex (5). Three holes were drilled in the skull: i) above either the PAG or the NRM; ii) nearby to allow measurement of cortical blood flow (CBF) by laser Doppler methods or to allow initiation of CSD and iii) to allow placement of a stimulating electrode on the dura.
In early experiments, a stainless steel 0.1 mm (30 G) needle attached to a 10 µl syringe with polyethylene tubing was lowered into the PAG or NRM at coordinates given in the Paxinos & Watson stereotaxic rat atlas (14). In later experiments, a glass micropipette connected to a Picospritzer© (Parker-Hannifin Corp., Hollis, New Hampshire) was used instead.
We used single-barrelled glass-coated tungsten electrodes to record TNC neuronal discharges and used a piezoelectric or hydraulic microdrive to advance the electrode into areas of interest.
We classified cutaneous receptive fields (RFs) using criteria defined by Hu et al. (15) as: Nociceptive specific (NS); wide dynamic range (WDR); or low threshold mechanoreceptors (LTM). The centre of each cutaneous RF was stimulated electrically with bipolar platinum needle electrodes, and the dura with chlorided bipolar silver ball electrodes, with parameters, as used by us and others and which can activate nociceptive fibres (13,16).
We induced CSD by a cortical pinprick injection of 1µl of KCl via a 27 G needle. Bright LF was generated with a stroboscopic light source driven by the trigger output of a Grass S88 stimulator.
We detected the occurrence of CSD by measuring changes in CBF (a measure of underlying cortical neuronal activity (17)) with laser-Doppler techniques, to avoid possible electrical interference arising from the nearby stimulating electrode. With this technique, there is a time lag before the flow probe detects that a wave of CSD generated elsewhere has reached the probe.
Drugs
The drugs used were urethane: (Ethyl carbamate, PC SID 24900632, Sigma-Aldrich), 500 mg/kg of a 1500 mg/kg solution in 0.9% saline; lignocaine: 2% lignocaine hydrochloride in water (Pfizer, ED93); “Glutamate”: 0.5M monosodium L-glutamate (CAS-147-42, Sigma-Aldrich, North Ryde, NSW) in distilled water.
Controls
To minimise any potential mechanical disruption, ionic changes, or other physicochemical effects at the brainstem injection sites that might compromise/confound our findings, no animal was tested with both glutamate and lignocaine. For the same reasons, we did not do both a “saline control” and a “drug test” in the one animal. Saline controls were therefore conducted in a separate population of animals.
Data acquisition and processing
We amplified signals from the microelectrode and converted them to “events” using either a hardware window discriminator (WD, 41 rats), or via a Cambridge Electronic Designs 1401 interface driven by Spike 7© software (18) (11 rats). In the latter case, Spike software was set to sort all action potentials (APs) according to their shape, so that the properties of each AP could be assessed. The software also counted WD output. Signals (analogue, WD and triggers) were processed on-line to produce post-stimulus response histograms (PSTHs) or peri-event rate time histograms (PETHs).
Statistical methods
In protocol 1, we measured response parameters of a single neuron to two different stimuli for up to 3.5 h, including a 30-min pre-injection control period and a longer post-injection period. We needed to test within, and between, rats in a way that accounted for any natural variation of responses over time (“drift”) and also to test whether there was loss of sphericity during the entire period. We also needed to test whether a change occurred after drug injection and to test for differences between the two stimulus types for each rat. To test for non-linearity over the time-courses of PSTH measurements, we used a repeated-measures ANOVA, with the Greenhouse-Geisser correction for sphericity, as follows:
An ANOVA across the time points during the 0–30 min control stimulation period – this tested for temporal “drift” in control responses An ANOVA across the entire data acquisition period until the cessation of stimulation at 120 min – this tested for a drug response different from the control period
We applied a post-injection comparative analysis on the dura versus facial skin post-stimulus time-response curves with a Student’s t-test over multiple successive responses in the t = 30 to t = 70 min range and applied a Bonferroni correction to the probability. This method avoids assumptions about the shape of the time-response curves. We also calculated a t-statistic for each post-injection point-pair and, where the resultant p-value was ≤ 0.05, placed asterisks above the SE bars of Figure 3.
In Protocol 2, we measured the means and calculated the standard errors (SEs) of: i) the basal rate of discharge before any intervention; ii) the “peak” or “steady” rate of discharge following intervention with CSD or LF and iii) the final steady rate of discharge after glutamate injection into the PAG or NRM. We used a Student’s t-test to make the following comparisons: (i) versus (ii); (ii) versus (iii) and (iii) versus (i). The p level for significance testing these comparisons was p ≤ 0.05.
With the number of animals in each phase of these two protocols, the tests had a statistical power of 0.8. Our statistical methods were reviewed, and approved of, by the UNSW Statistical Consulting Unit.
Histology
We marked each recording site with an electrolytic DC lesion (5), and each brainstem injection site with bromophenol blue. We euthanized rats with Lethabarb© and removed the brain and upper spinal cord. We fixed this tissue in 10% phosphate buffered formalin, paraffin mounted it, cut it into 20 µ-thick sections and stained them with cresyl violet. Sections were scanned with an Aperio Scanscope and examined with Aperio software. Recording sites were plotted onto drawings from Paxinos and Watson (14).
Protocols
Two series of experiments were performed:
To measure responses of trigeminovascular second-order sensory neurons to stimulation of the dura or skin before and after drug injections into the PAG or NRM (PSTHs: 33 rats, 54 neurons) To measure changes in the discharge rate of the neurons before and after the induction of CSD, or the application of LF (PETHs: 27 rats, 48 neurons)
In Protocol 1, injections of glutamate or lignocaine were made into the NRM or PAG. In Protocol 2, to avert possible confounding effects it may have on both fibres of passage and perikarya, lignocaine was not injected.
Protocol 1. Effect of saline, lignocaine or glutamate injection into the NRM or PAG on responses evoked in second-order trigeminovascular neurons by stimulation of the dura or facial skin.
The craniofacial skin and dura stimuli were applied alternately, with 50 stimuli in all for each “run”, which thus produced two 25-response PSTHs. For both the custom and Spike methods we counted APs or WD output between 5 msec and 50 msec post-stimulus times, or longer if there were C-fibre events. Means and standard deviations (SDs) for these counts were calculated over the 25-stimulus cycle. For each procedure, at least six control runs, spaced at 5-min intervals (i.e. from −30 min to 0 min) were acquired. At time zero, we slowly injected 20 nL of saline, lignocaine or glutamate into the nucleus. Further runs were acquired subsequently at 5, 10, 15, 20, 25, 30, 45, 60, 75, 90, and up to 120 min, or until response rates had settled. Responses were expressed as a percentage of the mean of the six pre-injection control responses and plotted against time over the entire course of each injection run, a technique that we have described in a previous paper (5), and which enables us to plot the responses of each rat to a common starting point on the Y-axis, thus facilitating visual interpretation of the results.
Protocol 2. Effect of glutamate injection into the NRM or PAG on changes of neuronal discharge rate evoked by LF or CSD.
This protocol had three phases:
We recorded the discharge rate of second-order trigeminovascular neurons in the form of 4-sec counts of WD output or Wavemark® counts of responsive neurons for 600 sec to produce a baseline PETH Then, we initiated LF or injected cortical KCl to induce CSD. Recording continued until the discharge rate appeared to settle at a new (higher) and stable level At this time-point, we injected glutamate into the nucleus and continued to record discharge rate (and continued to impose LF in the case of that sub-protocol) until the discharge rate of the neuron had stabilised
Results
Neuronal properties
A total of 103 neurons responding to both dura and skin stimulation were studied; adequate results were obtained from 102. Figure 1 shows 13 representative sections from Paxinos and Watson (14), with marks showing the locations of all neurons recorded from.
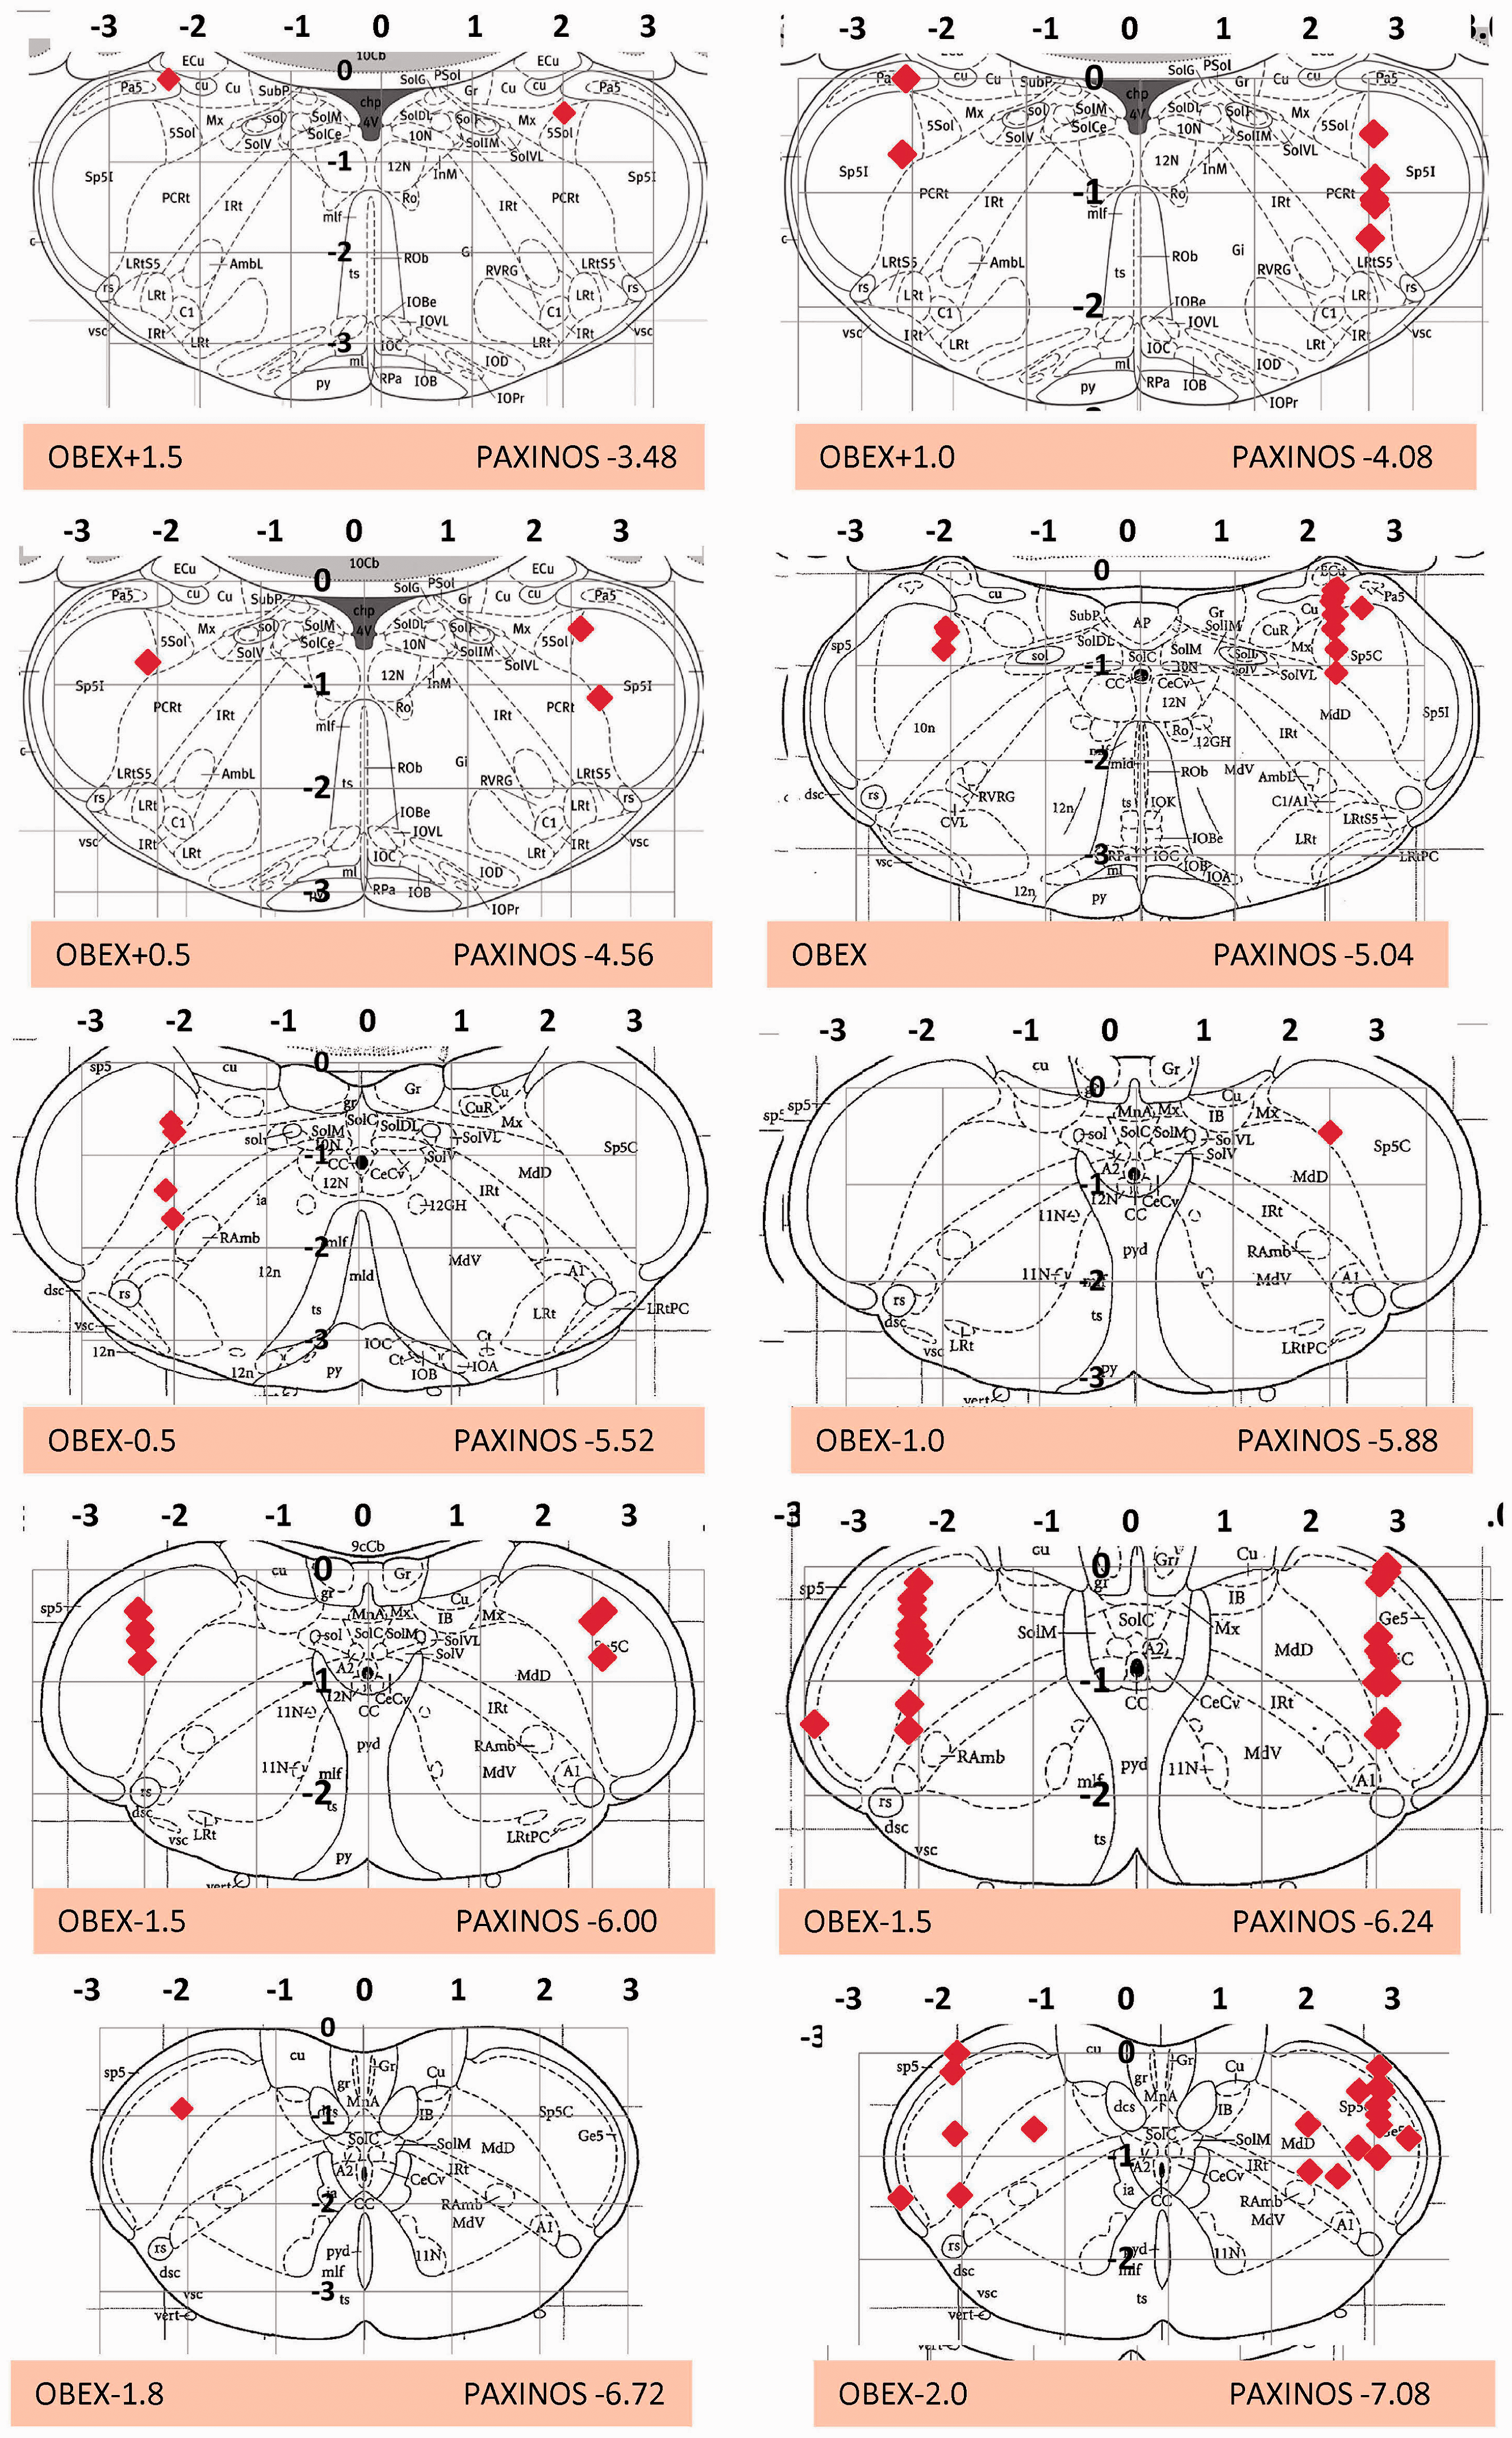
Summary drawing of neuronal locations in the TNC from which PSTHs and PETHs were acquired. Each panel represents the locations of neurons from electrode “plunges” at A/P planes from 1.5 mm rostral to 2.5 mm caudal to the obex. Plots are shown against the nearest coronal plane of the Paxinos rat atlas and are at 23 degrees to the coronal planes of the atlas. Locations have been randomly assigned to left or right for clarity, but most plunges were on the right side.
Neurons responded to peripheral stimulation with initial and peak latencies of 9.0 ± 4.3 and 17.7 ± 8.7 (dura) and 9.0 ± 4.1 and 18.7 ± 7.3 (skin) (times and SDs in ms). According to the criteria of < 1.5 m s−1 for C-fibres used by Melo-Carrillo et al. (19), 19 of the 99 neurons (19%), which appear in Table 1, had C-fibre afferent inputs, the remainder had A-δ latencies. Intra-rat variability of response rate was low and constant, with a coefficient of variation (CoV) about 11%, but the inter-rat CoV of response rate was high (65% for dura, 107% for skin, see Table 1). The low intra-rat variability enabled us to elicit a maximum number of responses to dural and skin stimuli (150 per rat per stimulus site) for Protocol 1 and to plot the raw data as percentages, as described in Methods. In Figure 3, the 100% control line is shown by the dotted red line.
Locations, basal and response properties of all neurons (n = 103) in the study. Response properties assessed from window discriminator (WD) data only.

A/P: anterior/posterior = distance from obex; SD: standard deviation of the data; CoV: coefficient of variation; SE: standard error of the mean.
Note: Not every neuron was examined for every phase of the study; in particular, the basal discharge rate was not measured for most neurons analysed under Protocol 1.
All neurons were classified as WDR, except one which was NS. RFs were located in trigeminal divisions V1 and V2. Neurons entering Protocol 2 were spontaneously active with a rate of 8.2 ± 2.0 discharges per second (mean ± SD). The basal discharge rate of neurons entering Protocol 1 was not measured for logistical considerations, inasmuch as it was impossible to record PSTHs and PETHs simultaneously. Neuronal properties are detailed in Table 1. A typical response (neurogram) and the associated PSTHs derived from it are shown in Figure 2.

Top panels (a),(b): Typical neurograms of a trigeminal nucleus neuron obtained in response to dural (a) and skin (b) stimulation. Middle panel (c): Full neurogram of a control data acquisition over 5 min, from which the top panels were extracted. This panel shows single neuron signal (green, upper tracing), RF trigger signal, dura (“SSS”) trigger signal, and window discriminator (WD) output. Bottom panels (d),(e): PSTHs resulting from dural stimulation (d, red) and RF stimulation (e, blue).
There were no differences between the neuronal properties (latencies or response rate to sensory stimulation) of neurons from male or female rats (Dura: Female 17.3 ± 1.5, male 19.1 ± 1.2; N 37, 52; NS. Skin: Female 18.4 ± 1.2, male 18.4 ± 1.1; N 37,51; NS) or the neuronal response rates (Dura: Female 8.7 ± 0.8, male 6.8 ± 0.7; N 40,51; NS. Skin: Female 15.0 ± 2.0, male 12.1 ± 1.9; N 40, 51; NS). Therefore, the results were aggregated.
Protocol 1: Effect on evoked responses of saline, lignocaine or glutamate injection into the NRM or PAG.
Pre-injection controls: The statistics for the pre-injection control periods (i.e. prior to injection of saline, lignocaine or glutamate) showed that all control responses remained constant or, at most, had an insignificant “drift” over a 30-min interval (six sets of 25 stimuli pairs). These results are illustrated in the segments of the charts to the left of the injection arrows in Figure 3 and the data reported in the “Control” lines of Table 2.

Pre- and post-injection responses to noxious-level electrical stimulation of skin or dura before and after saline, lignocaine or glutamate injection (red arrows) into PAG or NRM. Responses are expressed as the percentage of mean responses during the 30-min control period. The 100% “control” line is shown as red dashes. Asterisks indicate significant differences between skin and dura responses, according to Student’s t-test for each point pair.
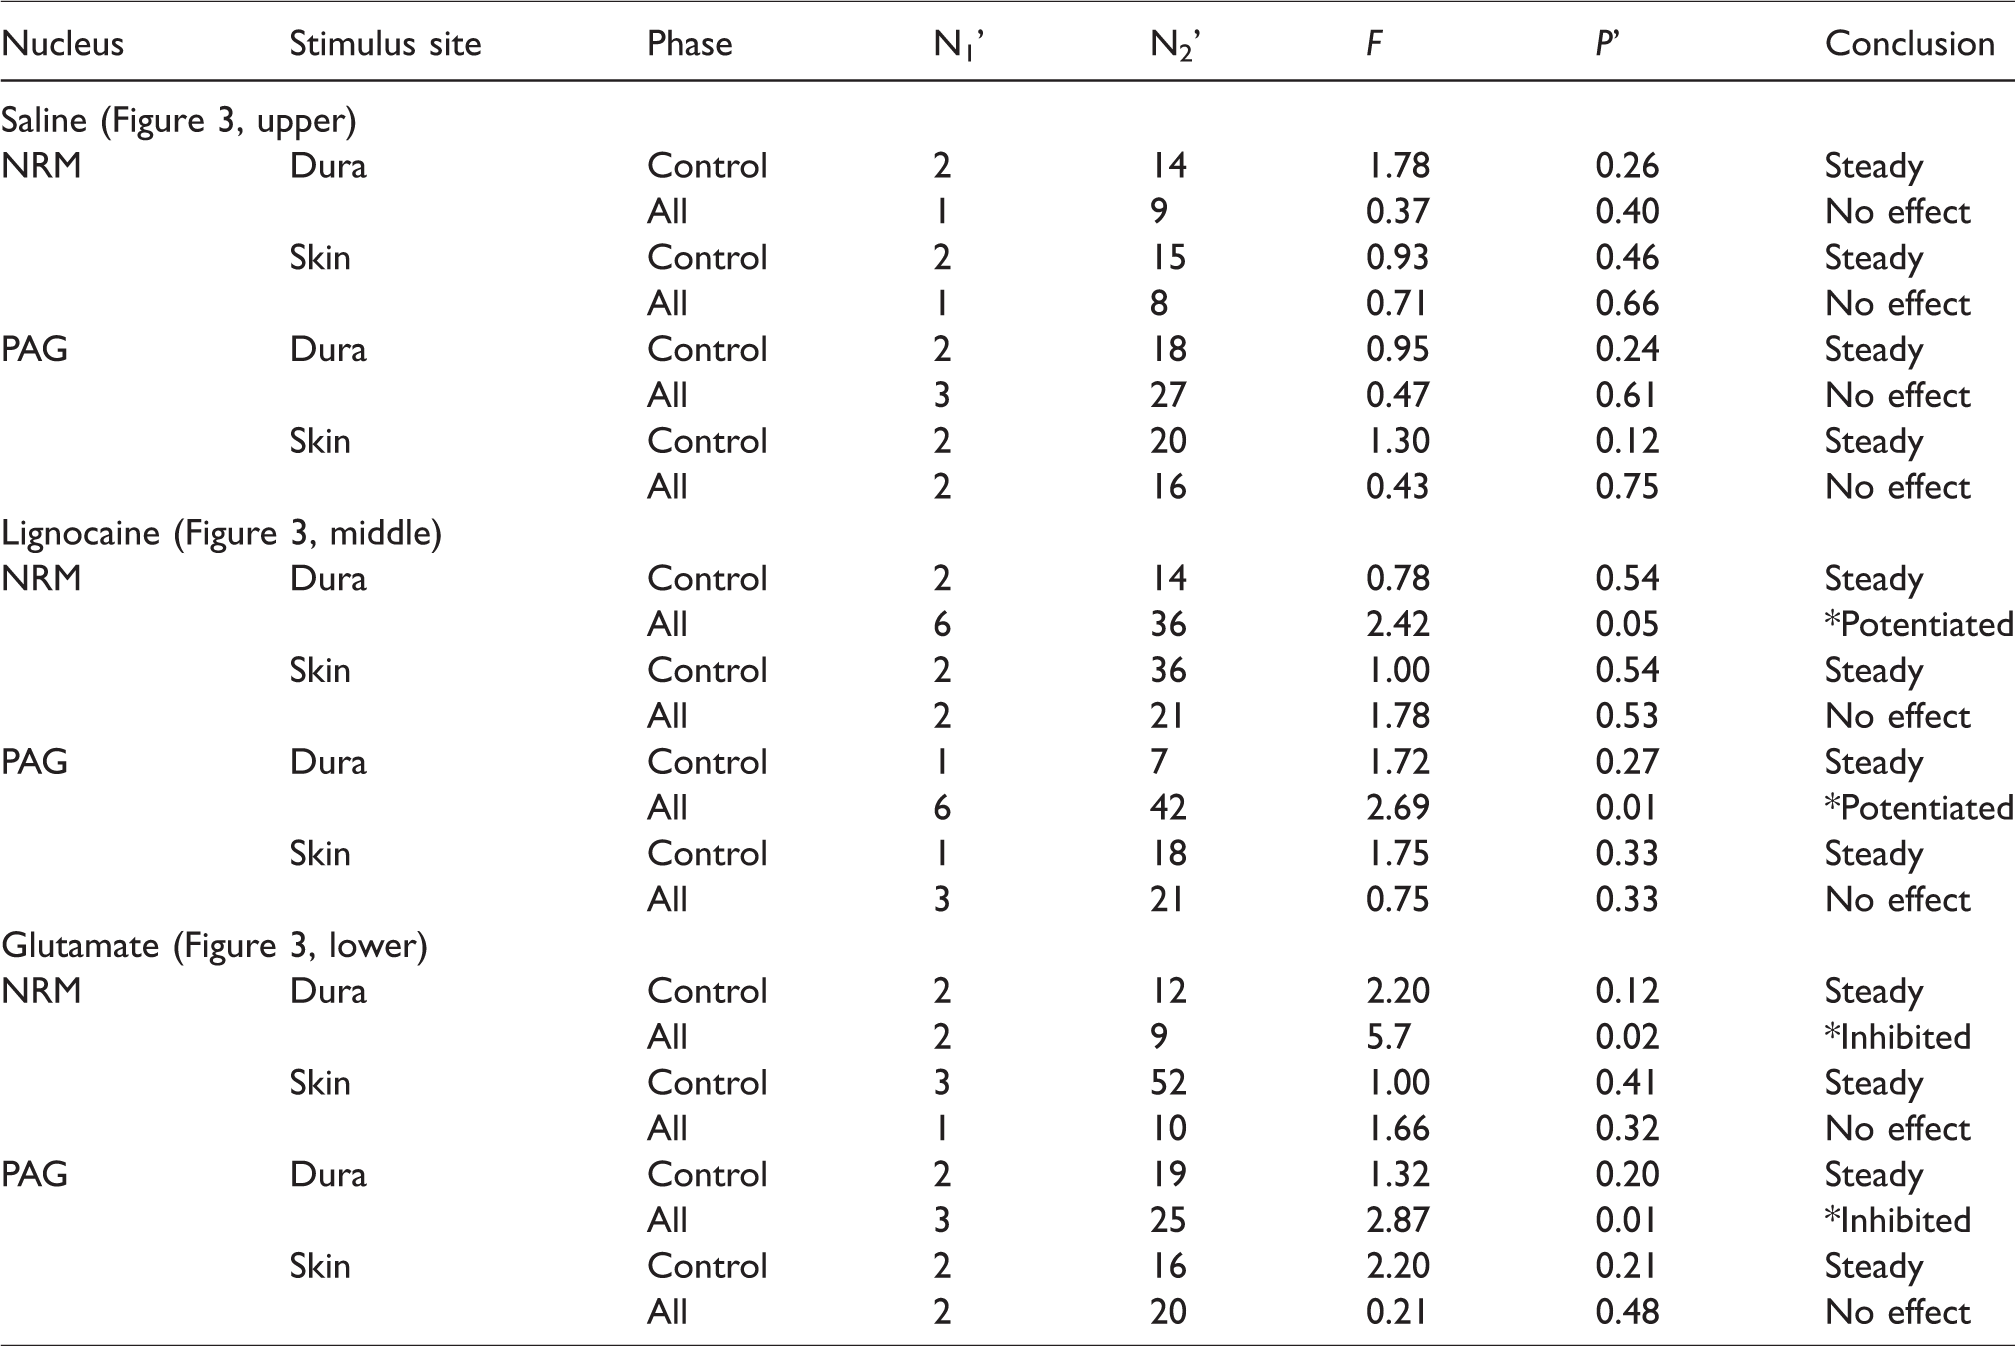
Repeated measures ANOVA (with Greenhouse-Geisser corrections for sphericity loss) for the control phases and the full (“All”) time course of the results of Protocols 1a to 1f. The degrees of freedom shown under N1’ and N2’ are the reduced values that result from multiplying the actual degrees of freedom (N1 and N2) by the Greenhouse-Geisser coefficient (ε). The asterisks in the conclusion column represent significant results (p ≤ 0.05). The conclusions we reached are shown in the rightmost column. The control phases for all treatments showed no drift of responses over time (“steady”). When the entire time courses were analysed (control and post treatment phases together = “All”), saline injections had no effect on either skin or dural responses; lignocaine injections potentiated dural responses selectively, and glutamate injections inhibited dural responses selectively. The charts associated with this table appear in the three rows of images in Figure 3. The above statistics, plus the Bonferroni-corrected p values for Student’s t-test for the dural vs. skin post-injection comparisons, are also given within the body text and the captions to Figure 3.
Saline
(1a) PAG: Saline injection in the PAG did not alter neuronal responses to dura or skin stimulation. Mean time-response curves for both modes of stimulus are shown in Figure 3 (left upper).
(1b) NRM: Saline injection in the NRM did not alter neuronal responses to dura or skin stimulation. Mean time-response curves for both modes of stimulus are shown in Figure 3 (right upper).
Lignocaine
(1c) PAG: Lignocaine injection in the PAG produced a small, but statistically-significant, increase in responses to dural stimulation (F6,42 = 2.69, p = 0.01), with no significant effect on responses to skin stimulation. The increase was maximal at 5 min post-injection, then fell, but there appeared to be a further increase in the 20–40 min range. Mean time-response curves for both modes of stimulus are shown in Figure 3 (left, middle).
(1d) NRM: Lignocaine injection in the NRM resulted in a significant increase in responses to dural stimulation (F6,36 = 2.42, p = 0.05) and a smaller non-significant increase in responses to skin stimulation. The increase reached a maximum 5 min after injection and returned to control levels within 45 min. Mean time-response curves for both modes of stimulus are shown in Figure 3 (right, middle).
Glutamate
(1e) PAG: Glutamate injection in the PAG resulted in a significant, but delayed, decrease in responses to dural stimulation (F3,25 = 2.87, p = 0.01), without producing any significant change of responses to skin stimulation. The change in responses began at about 15 min, reached a maximum at about 45 min post-injection and was still present at 60 min. Mean time-response curves for both modes of stimulus are shown in Figure 3 (left, lower).
(1f) NRM: Glutamate injection in the NRM produced a transient (2–10 sec) rise of a few mm in BP, and a significant decrease in responses to dural stimulation (F2,9 = 5.7, p = 0.02) and a small (but not statistically significant) increase in responses to skin stimulation. The change reached a maximum 15 min post-injection and usually returned to control levels by 45 min. Mean time-response curves for both modes of stimulus are shown in Figure 3 (right, lower).
The full set of statistical data for Protocol 1 is shown in Table 2.
Protocol 2: Effect of glutamate injection into the NRM or PAG on changes in discharge rate of responsive neurons produced by CSD or LF.
The induction of CSD, or the imposition of LF, increased the discharge rate of trigeminovascular second-order neurons, as previously described by us (12). There was no significant difference between the effects of CSD and LF on the increase in discharge rate (236% ± 27%, 289% ± 92%, unpaired t = 0.26, p = 0.59, N = 13, 14).
Figure 4 shows neurograms and resultant PETHs from (a) an experiment where CSD was induced, and (b) an experiment in which LF was shone into the eyes.

Peri-event histograms (PETHs). Effects of CSD (upper (a)) and LF (lower (b)) on the discharge rates of trigeminovascular second-order sensory neurons. Upper (a): Multiple waves of CSD produced by a single cortical pinprick with a needle loaded with KCl at bin 50 (red arrow). With each wave of CSD there was an increase in the discharge rate of the trigeminal second-order sensory neuron. Lower (b): Effect of two periods of LF (horizontal arrows) on the discharge rate of a trigeminovascular second-order sensory neuron.
(2a) PAG: LF increased the discharge rate of trigeminovascular second-order neurons (p < 0.05). This was partly reversed by glutamate injection into the PAG. The final “stable” rate after glutamate injection was not significantly different from the control rate, indicating a full return to baseline, but was also not significantly different from the peak rate. CSD increased the discharge rate of trigeminovascular second-order neurons (p < 0.001). This was fully reversed by glutamate injection into the PAG. The final “stable” discharge rate after glutamate was significantly different from the control rate, indicating only a partial return to baseline, but was significantly lower than the peak rate (p < 0.002). These results are shown in the upper panels of Figure 5 (left, LF – six neurons from four rats; right, CSD – 16 neurons from eight rats).

Effect of glutamate injections into the PAG or NRM on light flash (LF) and CSD-induced changes. PAG: Upper left (a): LF increased the discharge rate of six neurons from nine rats (p < 0.05). This was partly reversed by glutamate injection into the PAG. The final “stable” rate after glutamate was not significantly different from the control rate. Upper right (b): CSD increased the discharge rate of 15 neurons from nine rats (p < 0.001). This was fully reversed by glutamate injection into the PAG. The final “stable” discharge after glutamate was significantly different from the control rate, indicating only a partial return to baseline.
(2b) NRM: LF increased the discharge rate of trigeminovascular second-order neurons (p < 0.001). This was fully reversed by glutamate injection into the NRM. The final “stable” discharge rate after glutamate was not significantly different from control, indicating a full return to baseline and was significantly different from the peak rate (p < 0.005). CSD increased the discharge rate of neurons (p < 0.05). This was fully reversed by glutamate injection into the NRM. The final “stable” discharge rate after glutamate was not significantly different from control, indicating full return to baseline, but was significantly different from the peak rate (p < 0.05). These results are shown in the lower panels of Figure 5 (left, LF – 13 neurons from six rats; right, CSD – 14 neurons from eight rats).
The above results can be summarised as follows: a) The induction of CSD, or the imposition of LF, each produced a significant increase in the basal discharge rates of trigeminovascular second-order neurons; and b) the injection of glutamate into the PAG or NRM reversed these increases, partly, or fully, toward baseline rates.
Discussion
In this study, we have confirmed previous findings by others (20) and ourselves (12) by showing that CSD accelerates the discharge rates of trigeminovascular second-order sensory neurons and potentiates their responses to noxious-level dural stimulation. Furthermore, we have extended those findings by showing, first, that LF (a possible migraine trigger and headache provoker) produces similar effects to CSD and, second, that intervention in the brainstem with a neural excitant, or a conduction blocker, can modulate both ongoing and evoked neuronal activity in a manner consistent with the hypothesis of a possible (cortico)–brainstem–trigeminal modulatory pathway.
These experiments showed that the activation of trigeminovascular second-order neurons by noxious stimulation of the dura, or by two possible migraine triggers/headache provokers, could be potentiated by injecting lignocaine into the NRM or PAG, and could be inhibited by the injection of glutamate into these two nuclei. The effects of these drugs on neuronal responses were selective for noxious dural stimulation and did not occur with noxious skin stimulation. Therefore, these nuclei may have a role to play in any potentiation of the responses of trigeminovascular second-order neurons caused by the cortical changes that result from migraine triggers. Such a mechanism is consistent with an increasing number of reports that provide significant evidence throwing doubt on notions that the production of migraine pain is purely due to peripheral dural trigeminovascular mechanisms (8,21–24).
In these experiments, we also set out to test whether trigeminovascular sensory input was treated differently to input arriving via other trigeminal fibres. Any such differences would lie at the heart of any debate as to whether trigeminovascular sensation is distinct from other trigeminal sensation and hence also at the heart of the argument about why migraine pain differs from other trigeminal pain (25). In our experience, and that of others, there is often a difference in the manner in which many manipulations (drug injections, for instance) affect responses elicited in trigeminovascular neurons by dural versus cutaneous stimuli (5,25,26). In the current experiments we have also seen such differences, as we discuss below.
In Protocol 1 (illustrated in Figure 3), which examined responses evoked by dural and skin stimulation, we found that glutamate injections into either the PAG or NRM significantly ablated responses of second-order neurons evoked by noxious-level dural stimulation, but not responses evoked by noxious-level facial skin stimulation. In a complementary finding, lignocaine was able to potentiate responses of second-order neurons evoked by noxious-level dural stimulation, but not responses evoked by noxious-level facial skin stimulation. It is highly unlikely that this suite of responses was either a Type I error for dura input and/or a Type II error for skin input, given that the power of the tests was 0.8. We feel that the differences must therefore arise from differences in the manner in which cutaneous and dural nociceptive sensation are processed.
In Protocol 2 (illustrated in Figure 5), we demonstrated that both CSD and LF increased the discharge rate of trigeminovascular second-order neurons. This is not a new finding, but what is novel is that glutamate injection into the PAG or NRM fully, or partly, returned the increased discharge rate to baseline levels.
The present results also extend those previously reported by us on the effects of isolated electrical stimulation of the NRM on sensorily-evoked trigeminal responses (12), to include (a) chemical stimulation and (b) chemical neurotransmission block in both the NRM and PAG. Our results with a local anaesthetic and a neuronal excitant in the NRM appear to confirm similar preliminary results reported by Supronsinchai et al. (27,28).
In the experiments with glutamate injection in the PAG, the effect of glutamate was sometimes delayed by 10–15 min. The most parsimonious explanation for this is that the injected glutamate diffused to a more rostral, or caudal, portion of the PAG, or (less likely) to another nearby nucleus thought to be involved in pain control. This nucleus could perhaps be the NRM, in which glutamate-evoked responses occur without a delay.
A significant limitation of our study is that we almost exclusively recorded from WDR neurons in deeper laminae of the TNC and therefore cannot be certain that similar findings would necessarily be seen in NS trigeminovascular second-order neurons in the superficial laminae. It would obviously be of interest to replicate the present findings in that population.
The responses of trigeminovascular second-order sensory neurons to noxious peripheral stimulation were maintained over time in these experiments, as the ANOVA analysis for the control period demonstrates. Thus, where responses to dural stimulation were altered (and reversibly altered) by injection of lignocaine or glutamate, these alterations cannot be the result of the mere passage of time; that is, they are not simply due to “drift”. Furthermore, such alterations were confined to the responses evoked by noxious dural stimulation only, they did not occur with noxious skin stimulation. Neither did they occur after the injection of saline, thus eliminating the possibility that they were the consequence of physicochemical, rather than pharmacological, effects.
We did not measure the discharge rates of neurons in the NRM and PAG in Protocol 1 for logistical reasons and therefore cannot be certain that they were always affected by either the triggers or the drugs injected into them. However, as explained in the Methods and from our own experience, we are confident that potential triggers do affect the rates of discharge of brainstem neurons, including in the NRM (12) and the PAG (29), and that the drugs injected in these experiments would have similarly affected these neurons. Because of our routine use of glutamate to distinguish axonal versus neuronal body activation, we also know that NRM neurons are activated by glutamate (29). However, we have no experiments of our own to confirm that lignocaine blocks neuronal activity in, or transmission through, these nuclei, but this has been amply demonstrated by others (30).
Although in these experiments we did not specifically investigate any possible (cortico)–brainstem–trigeminal pathway, our findings provide some indirect evidence that such a pathway may exist. However, to confirm this would require further experimentation.
Implications of the findings
Recent reviews and research reports have highlighted the important role played by various brainstem structures, including the locus coeruleus (8,10,21,24,31) and diencephalic or subcortical structures such as the hypothalamus (21) in migraine, in general, and in migraine headache in particular. Of the nuclei mentioned in our own investigations and reviews (12,32), we chose to investigate the NRM and PAG. Reports by others (8,31) have also suggested that these two nuclei are likely candidate nuclei for a modulatory role in trigeminovascular nociception.
In these experiments, we chose as our triggers, or headache provokers, CSD and LF. CSD as a global one, and LF as a focal (visual) one. Both of these potential triggers were followed by increases in the spontaneous and driven discharge rates of trigeminovascular second-order neurons and it seems safe to assume that this was a causal relationship. We know from previous reports that neuronal discharges, whether measured directly (12,33), or indirectly via the c-fos technique (34), are increased by CSD. There is some doubt, however, about whether CSD-induced increases in the discharge rates in rats (33) can be extrapolated to humans. The trigeminovascular neurons which we and others have studied nearly always have convergent inputs from a range of intracranial or extracranial structures (16,25). These neurons are not normally “silent”, despite the apparent absence of imposed input from the periphery, and discharge continuously but with rates of only a few discharges per second (16). Whether this “spontaneous” activity is random or is driven from elsewhere is hard to decide. We can say, however, that lignocaine injection into the trigeminal ganglion can reduce this activity, supporting the notion of continuous traffic arising peripherally (5).
In conclusion, in these experiments, we have investigated, and found further support for the idea that migraine headache could arise from the modulation of a brainstem-trigeminal pathway. In the brainstem, two critical nuclei, amongst several others, seem to be the NRM and PAG. Such a brainstem-trigeminal pathway could be an alternative to the longstanding, well described, peripheral pathway for the production of the headache of migraine. There appears to be an increasing number of researchers investigating similar “brainstem-related” alternatives (6–11,21–24,35). Our results further strengthen the argument for continuing to target central sites for both preventative and acute treatment of migraine headache.
Key findings
We found that the injection of drugs that could potentially block, or activate, neuronal activity in either the PAG, or the NRM, respectively enhanced, or blunted, the effect of cortical neuronal activity on modulation of neurotransmission through the TNC. These effects were selective for noxious sensory input from the dura compared with noxious sensory input from the facial skin. This study, and those of others, support the concept that migraine headache can be generated centrally, rather than solely by increased peripheral trigeminal nociceptive input, and may help explain its unique nature.
Supplemental Material
sj-pdf-1-cep-10.1177_0333102420960039 - Supplemental material for A potential role for two brainstem nuclei in craniovascular nociception and the triggering of migraine headache
Supplemental material, sj-pdf-1-cep-10.1177_0333102420960039 for A potential role for two brainstem nuclei in craniovascular nociception and the triggering of migraine headache by Alessandro S Zagami, Sumaiya Shaikh, David Mahns and Geoffrey A Lambert in Cephalalgia
Footnotes
Animal ethics
These experiments were approved by the UNSW Australia Animal Care and Ethics Committee and the Western Sydney University (WSU) Ethics Committee and conformed to their guidelines. The following specific approvals were given: UNSW: 06/02B; 07_66A; 10/79A; 4254831/4 and WSU: A8900; A10622.
Acknowledgments
We thank Linda Truong for histological work, Hayley Franklin and Susan Wan of the UNSW HMU for histological work and scanning of histological sections, and Dr Peter Geelan-Small of UNSW ‘Unistats’ for guidance on statistical matters.
Author note
A full description of the methods used in this article is available in the supplemental material. Further supporting materials such as software, data records, data logs, lab workbook facsimiles, animal monitoring records, etc are available from the corresponding author (
Declaration of conflicting interests
The authors declared no potential conflicts of interest with respect to the research, authorship, and/or publication of this article.
Funding
The authors disclosed receipt of the following financial support for the research, authorship, and/or publication of this article: This research was funded by: NHMRC Project Grant 568713 “Headache prophylaxis by cortico-brainstem mechanisms”; and Australian Brain Foundation (un-numbered) “Investigating the causes of migraine pain”.
References
Supplementary Material
Please find the following supplemental material available below.
For Open Access articles published under a Creative Commons License, all supplemental material carries the same license as the article it is associated with.
For non-Open Access articles published, all supplemental material carries a non-exclusive license, and permission requests for re-use of supplemental material or any part of supplemental material shall be sent directly to the copyright owner as specified in the copyright notice associated with the article.