
Abstract
Background
Migraine mechanisms are
*These authors contributed equally to this work.
Methods
We extensively phenotyped 17 migraine without aura and nine migraine with aura female patients, and 20 age-matched female controls. Cubital venous blood was RNA sequenced. Genes differentially expressed between migraineurs (migraine without aura and migraine with aura) and controls, and between migraine without aura and migraine with aura were identified using a case-control design. A co-expression network was constructed to investigate the difference between migraineurs and healthy controls at the network level.
Results
We found two differentially expressed genes: NMNAT2 and RETN. Both were differentially expressed between migraine with aura and controls, but they could not be replicated in an independent cohort. Co-expression network analysis resulted in one cluster of highly interconnected genes that was nominally significantly associated with migraine; however, no pathways or gene ontology terms were detected.
Conclusions
We showed no clear distinct difference in gene expression profiles of peripheral blood of migraineurs and controls and were not able to replicate findings from previous studies. A larger sample size may be needed to detect minor differences.
Introduction
Migraine is a common multifactorial disorder, but the involved mechanisms are only partly known (1). Migraine has an estimated heritability of 40–70% (2,3) and the most recent genome-wide association study (GWAS) identified 38 loci associated with migraine (4). These genetic variants explain only a small part of the genetic variation of migraine. Further, no biomarkers are currently accepted for migraine (5). Besides the aura, several biological differences between migraine without aura (MO) and migraine with aura (MA) are present, such as different response rates to migraine treatment (6), cerebral blood flow changes (7) and the ability to provoke MO attacks but not MA attacks in experimental models (8–10). However, those differences are all at the level of migraine attacks, not outside of migraine attack. Furthermore, both MO and MA are classified as subtypes of migraine, but it remains unclear to what degree the genetic architecture differs between MO and MA.
Genetic variants are relatively fixed through life, but gene expression is tissue-dependent and influenced by genetic and environmental factors. Gene expression gives not only the opportunity to reveal differences between, for example, cases and controls, but also to gain knowledge about the interaction between genes to discover disease mechanisms and the potential to detect causal variants by integration of genomics and transcriptomics. In neurological disorders, including migraine, the most relevant tissue is not easily assessed. Peripheral blood is easily collected and the gene expression in peripheral blood correlates well with several nervous system tissues (11,12). A few transcriptomic studies have been performed in blood from migraine patients, comparing expression profiles of migraineurs outside of attack with healthy controls (13–15). These studies have not given a uniform result and thus evidence for definite transcriptomic differences between migraine patients and healthy individuals is lacking. In other diseases, the identification of transcriptomic changes has in recent years made a significant advance with the use of RNA sequencing (RNA-Seq) for whole transcriptome analysis (16). In the current study we use RNA-Seq to test whether gene expression differs between migraineurs and healthy control subjects and between MO and MA. We aim to identify relevant biomarkers and increase our knowledge on disease mechanisms of migraine.
Methods
Subjects
The study sample consisted of 26 migraine patients (17 MO and nine MA) and 20 healthy control subjects. Patients who experienced both types of attacks (with and without aura) were considered as MA patients. Migraineurs were recruited at the Danish Headache Centre (DHC), via the website “forsøgsperon.dk” and by advertising at hospitals. The participants were interviewed using a semi-structured, validated questionnaire and diagnosed according to the International Classification of Headache Disorders 3rd edition, beta version (ICHD-3 beta) (1). In addition to correct diagnosis, the interview provided information about symptomatology, attack frequency, medications, treatment effects, and comorbidities. Moreover, we collected a full medical history, performed a physical and neurological examination, measured electrocardiography and vital signs. Migraineurs were only included when they were between 18 and 70 years old and weighed between 45 and 95 kg. Exclusion criteria were pregnancy, breastfeeding, and any recent change in daily medication. All migraineurs were females and of Danish ethnicity. We enrolled 20 healthy female volunteers, who were age-matched to the migraineurs. The study was approved by the local ethical committee (H-15006298), the Danish Data Protection Agency (I-suite 03786); all participants received oral and written information, and all provided written informed consent.
Blood sampling
Venous blood samples were taken from the migraineurs when they were migraine free for at least five days and did not have any other type of headache for 24 hours prior to blood sampling. One week after the blood sampling, all migraineurs were contacted to confirm that they had not experienced an attack within 36 hours after blood sampling. We also registered any headache (both tension-type headache and migraine) during the week after the sampling. Likewise, blood samples from healthy volunteers were taken when they did not have any type of headache for 24 hours prior to blood sampling. A blood sample for RNA-Seq was taken from the cubital vein of the arm.
RNA sequencing
The blood samples were stored in PAXgene Blood RNA tubes. RNA was extracted using the PAXgene Blood RNA kit (Qiagen, Venlo, The Netherlands) by deCODE Genetics (Reykjavik, Iceland) who also did the RNA-Seq. RNA quality was checked using the Agilent 2100 Bioanalyzer and LabChip. Sequencing was performed on the Illumina Novaseq, resulting in paired-end reads 125 basepairs long. Quality control of the raw fastq files was performed using Next generation sequencing (NGS) quality control (QC) Toolkit (17); all samples had between 96.71 and 98.44 percent of high-quality reads. Low quality reads were filtered with NGS QC Toolkit using default settings. Filtered fastq files were processed and quantified using the pseudo-aligner kallisto v0.42.5 (18), using the human reference transcriptome (Release 28) based on the GRCh38.p12. In total, 69.16 percent (SD = 0.04) of the high-quality reads mapped to the transcriptome.
Data processing
Count data were imported into R and transcript abundances were collapsed into gene estimates using the R package tximport (19). Within the R package DESeq2, the read matrix normalized for library size and gene-length bias using the average gene length-matrix resulting from kallisto, which corrects for differences in gene length across samples; for example, due to differential isoform usage. All protein-coding genes (n = 20,174) were retained for analysis. Genes that were not expressed in at least 90% of the samples were removed. In total, 15,938 genes remained for analysis. Outliers were detected using principal component analysis (PCA), resulting in the removal of one control sample.
Deconvolution
To ensure that the sequenced samples were consisting of similar cell type proportions, we deconvoluted the samples using the R package CellMix. This uses single-cell expression data to estimate the cell type proportions of whole blood samples. Gene symbols were linked to Affymetrix probe names and investigated using the basis signature matrix of whole blood for performing gene expression deconvolution, as in Abbas et al. (20).
Differential expression analysis
Differentially expressed (DE) genes were detected using the R package DESeq2 (21). We compared migraine patients to healthy controls, MO versus healthy controls, MA versus healthy controls, and MO versus MA and corrected in each analysis for age. Resulting p-values were adjusted for multiple testing using the Benjamini & Hochberg method, and genes were called to be DE when the adjusted p-value (False Discovery Rate [FDR]) was below 0.05. The log2 fold change (log2FC) presents the proportional difference in expression between the groups, where a log2FC of 1 represents a doubling of expression and a log2FC of −1 represents a reduction of 50% in expression. Expression levels are presented as length-scaled transcripts per million (TPM).
Circadian rhythm
As circadian rhythm is known to affect gene expression (22) and the occurrence of migraine attacks (23), we investigated in a secondary analysis whether the time of the day that the blood sample was taken affected the results. The time of sampling was divided into three levels: Morning (06.00–12.00), afternoon (12.00–18.00) and evening/night (18.00–06.00). Sixteen samples were taken during the morning (six MO, five MA, and five controls), 26 during the afternoon (eight MO, four MA, 14 control) and three during the evening/night (all MO).
Co-expression network
The 5000 most varying genes were selected for weighted gene co-expression network analysis (WGCNA), since non-varying genes usually represent noise (24). The network was constructed following the default pipeline of WGCNA (25). In short, an adjacency matrix was calculated whereby a soft threshold of 3 was used, resulting in a scale-free topology measure of 0.9 (recommended to be > 0.8). The adjacency matrix was used to calculate the topological overlap measure (TOM), a measure of interconnectedness between genes. A gene dendrogram was created using the dissimilarity TOM, and the dynamic tree cutting algorithm was used to define modules (clusters of highly interconnected genes). A minimum module size of 30 was used. Modules were assigned a color and the association of modules with migraine was calculated by Spearman correlation. Modules significantly correlated with migraine were followed up by pathway analysis.
Pathway analysis
Identified gene lists were followed up by pathway and gene ontology overrepresentation analysis using Panther (26). Gene lists were tested against the PANTHER database, including PANTHER pathways, PANTHER GO-slim Molecular Function, PANTHER GO-slim Biological Process, and PANTHER GO-slim Cellular Complex. A Fisher's exact test was performed, and p-values were corrected for multiple testing using Bonferroni correction. In the case of analyzing lists of DE genes, we used all tested genes as reference list. In the case of analyzing modules detected by co-expression network analysis, we used the 5000 most varying genes as reference list.
Replication cohort
Significant DE genes were tested in an independent population, consisting of 2407 Icelandic females born between 1970 and 1989, of which 21 were diagnosed with MA. RNA extraction from whole blood and sequencing was performed as described above. Gene expression was computed based on transcript abundances (18). Log transformed gene expression estimates were adjusted for measurements of sequencing artefacts, demography variables, blood composition and hidden covariates (27). Difference between MA and controls was tested using generalized logistic regression against normal quantile transformed adjusted gene expression estimates.
Results
Descriptive statistics of individuals with migraine without aura (MO) and with aura (MA).
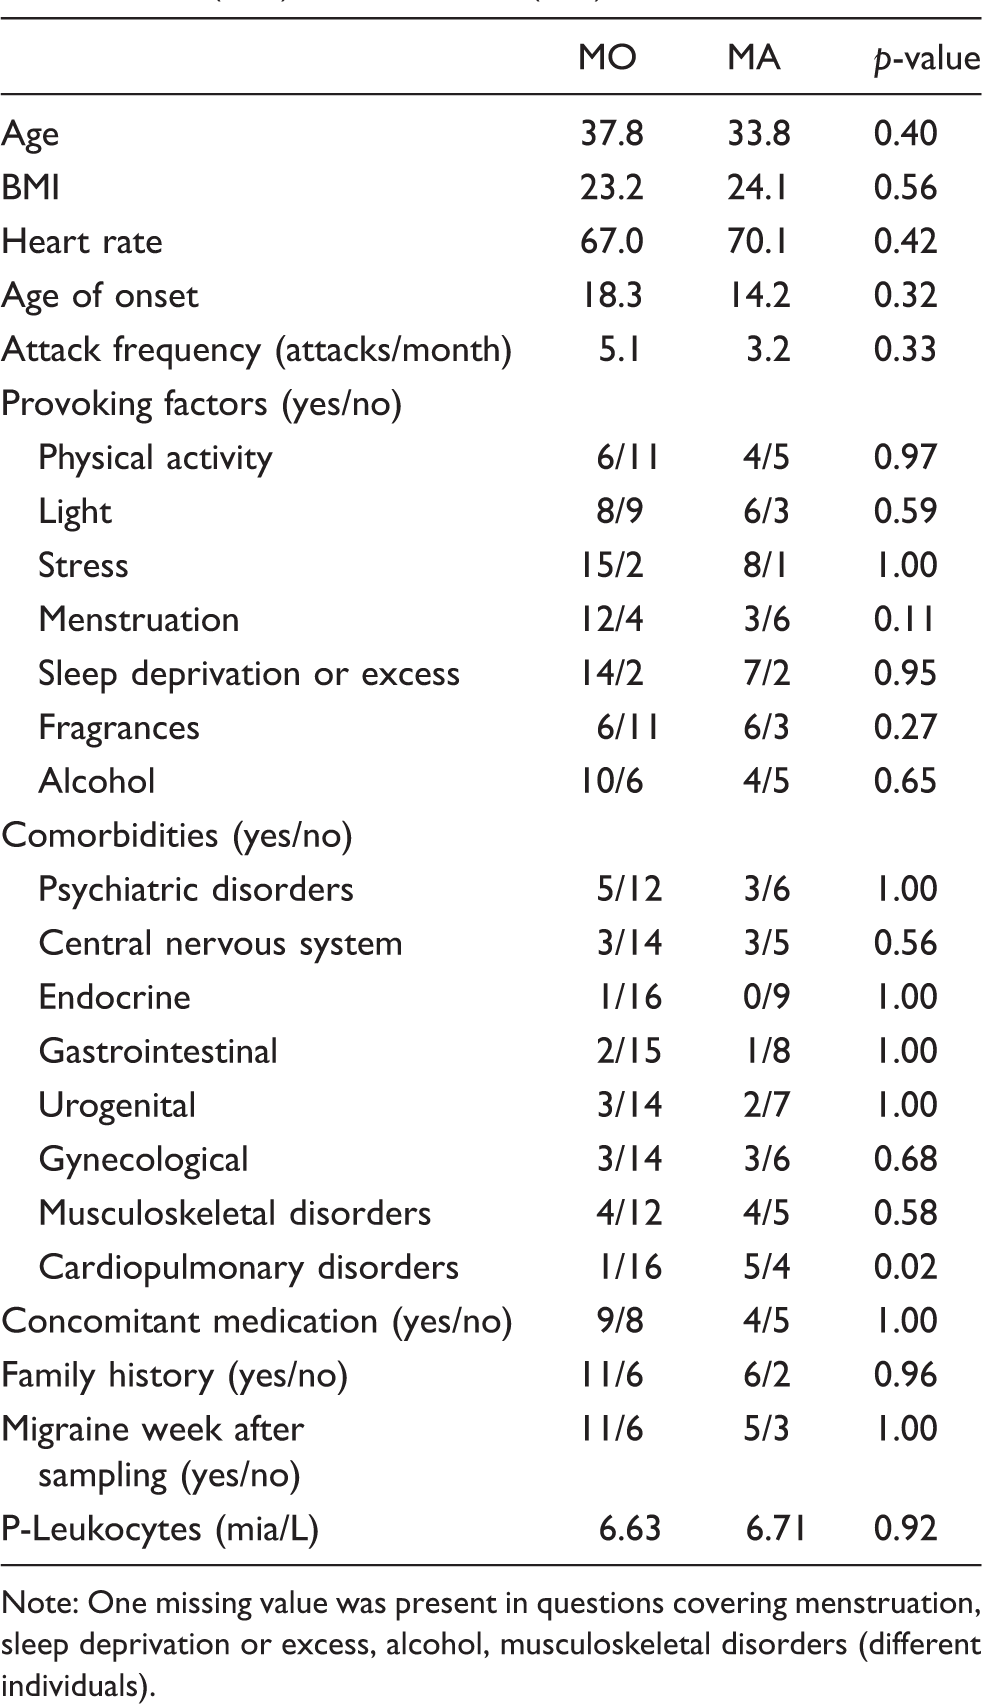
Note: One missing value was present in questions covering menstruation, sleep deprivation or excess, alcohol, musculoskeletal disorders (different individuals).
Investigating the cell-type ratios in the subgroups, resulted in an estimation of 44%, 45%, and 42% of lymphocytes, and 56%, 55%, and 58% of neutrophils in controls, MO and MAs, respectively. There was no significant difference in cell-type proportions estimates between the different subgroups.
A plot of the first principal components of the gene expression matrix did not show the groups of migraine patients or control subjects (Figure 1).
The first principal components (PCs) of the gene expression matrix do not highlight any difference between subject groups. MA: migraine with aura; MO: migraine without aura.
Differential expression
Nominal difference in expression was observed in 796 genes between migraineurs and controls (p < 0.05 before adjusting for multiple testing), of which 12 had a |log2FC| above 1. Dividing the migraineurs into MO and MA, we found 778 genes nominally expressed differently between MO and control, of which 21 had a |log2FC| above 1, and 855 genes nominally expressed differently between MA and control, of which 42 had a |log2FC| above 1. Comparing MO with MA identified 889 nominally differentially expressed genes, of which 59 had a |log2FC| above 1. Nominally DE genes and the overlap between comparison pairs is presented in Figure 2, showing that one gene was nominally DE in all comparisons: CD163 (Figure 3(a)).
The Venn Diagram showing the number of DE genes (p < 0.05 before adjusting for multiple testing) between the different (sub)groups. Between brackets, the number of DE genes with a |log2FC| > 1 are presented. Expression of (a) CD163, and (b) NMNAT2 and RETN. CD163 was DE between all comparisons (p < 0.05). NMNAT2 and RETN were DE between migraine with aura (MA) and controls after multiple testing correction (FDR < 0.05). MO: migraine without aura.

As we performed approximately 16,000 tests per comparison, we needed to correct for multiple testing. After correction, we found two genes to be significantly DE (NMNAT2 and RETN), which were both DE between MA and controls (Figure 3(b)). NMNAT2 had a log2FC of 1.02 (FDR = 0.03) and RETN a log2FC of 1.80 (FDR = 0.03). It should be noted that the expression of NMNAT2 shows a large variation among the MA patients, and RETN has one outlying measurement (among the MA patients), that drives a large part of the DE signal. NMNAT2 and RETN could not be replicated in the deCODE cohort (Supplementary Figure 1).
In a secondary analysis, we included time of sampling as a covariate to correct for the potential effect of the circadian rhythm. We found a reduction in the number of nominally significant DE genes (p < 0.05): 633 genes were nominally DE between migraineurs and controls, 533 between MO and control, 748 between MA and control and 671 between MO and MA. None of the nominally DE genes survived multiple testing correction.
Gene expression and differentially expression results (migraine vs. controls) for the migraine-associated genes based on the most recent GWAS.
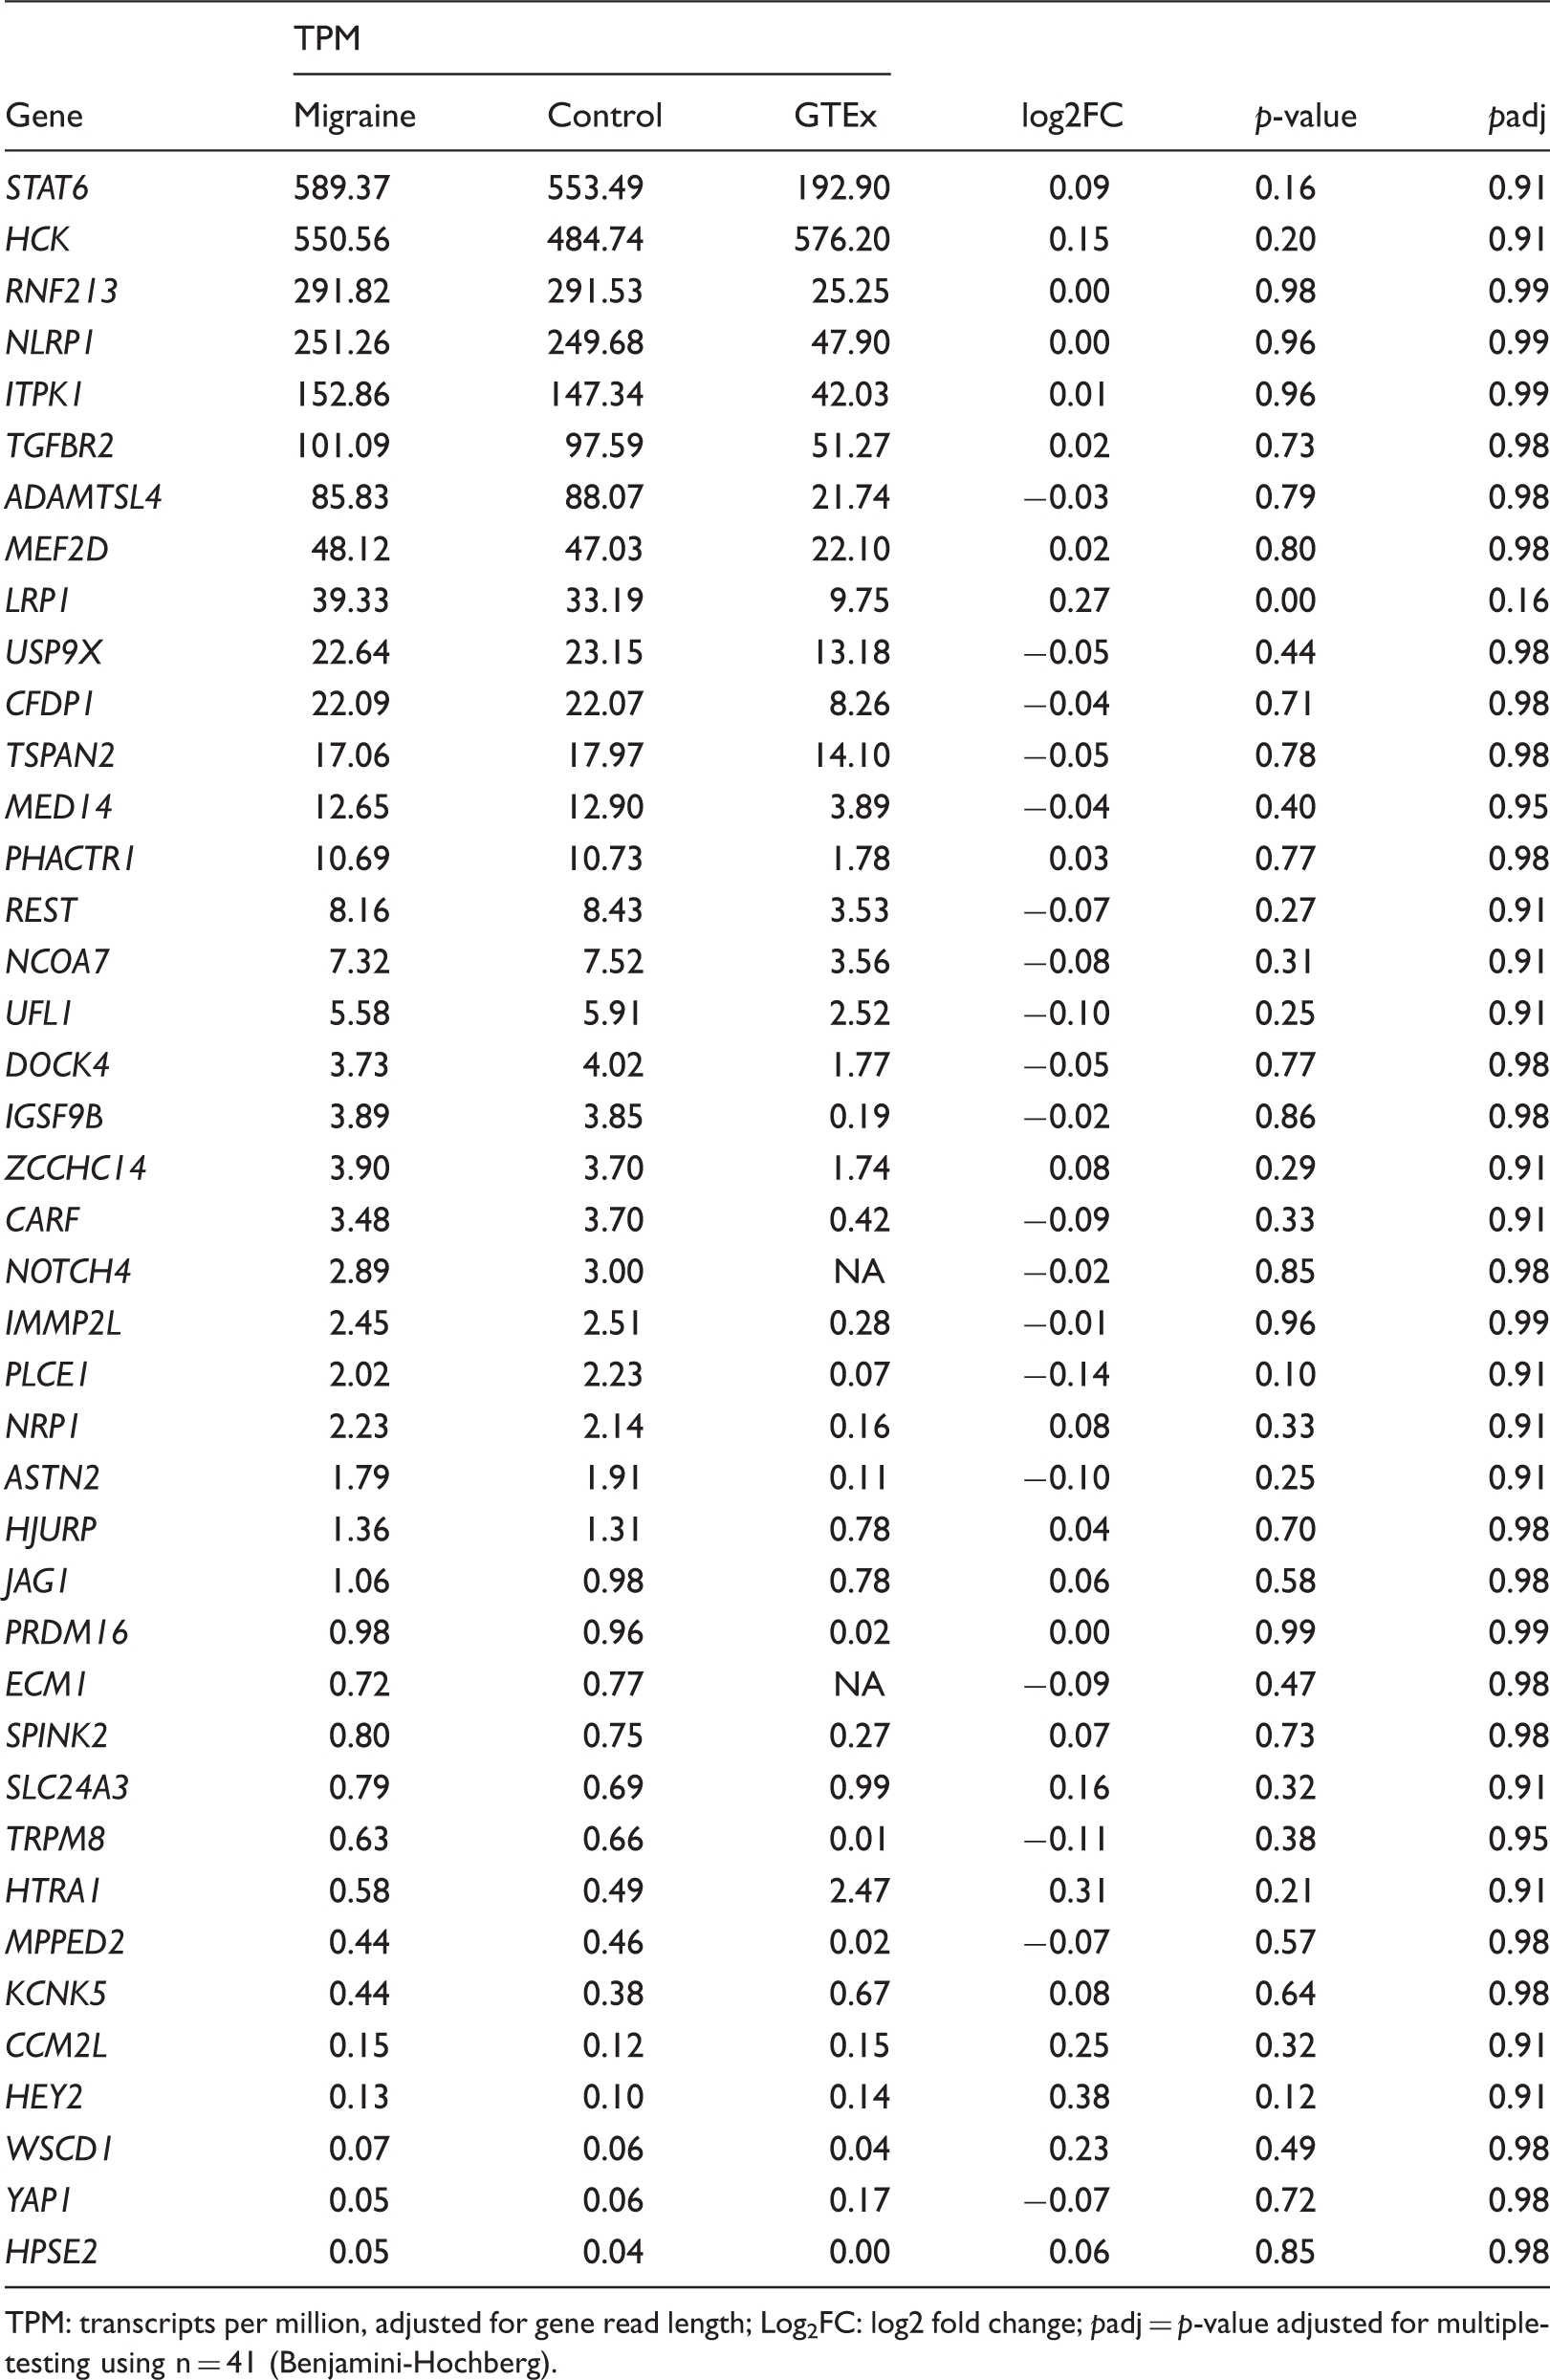
TPM: transcripts per million, adjusted for gene read length; Log2FC: log2 fold change; padj = p-value adjusted for multiple-testing using n = 41 (Benjamini-Hochberg).
Enrichment analysis
Enrichment analysis of DE genes (p < 0.05) between migraine patients and controls showed three gene ontology terms, all within GO-slim Cellular Complex: Macromolecular complex (padj = 4.5−3), nucleus (padj = 0.03), and protein complex (padj = 0.03). Between MO and controls, we found two gene ontology terms within GO-slim Cellular Complex: Macromolecular complex (padj = 0.02) and ribonucleoprotein complex (padj = 0.03). There was no significant enrichment of DE genes for those found between MA versus controls, and MO versus MA. Enrichment analysis on genes that were DE with a |logFC| > 1 did not reveal any pathways.
Gene co-expression network
Gene co-expression network construction led to the detection of 14 modules (Figure 4(a)), containing between 46 (Salmon module) and 2655 genes (Turquoise module). After multiple testing correction, none of the modules were significant. One of the modules was nominally significant (Magenta, consisting of 78 genes), though pathway and gene ontology analysis did not result in any significant ontologies or pathways. Genes in the modules are presented in Supplementary Table 1.
Weighted gene co-expression network analysis. (a) Gene dendrogram of the constructed gene co-expression network. The dendrogram depicts the hierarchical clustering based on the topological overlap between genes. Below the dendrogram are the derived clusters of genes (modules) with assigned colors derived from the dynamic tree cutting algorithm. (b) Correlations between the module eigengenes and migraine diagnosis (case-control), with the unadjusted p-values between brackets.
Discussion
We investigated the gene expression profiles of whole blood of 26 female migraineurs outside of attack (nine with and 17 without aura) and 19 healthy controls using RNA-Seq. Furthermore, as the first, we compared gene expression profiles of MO with MA. Based on hierarchical clustering, differential expression analysis, and co-expression network analysis, we conclude that there is no general difference in gene expression profile between female migraine patients and healthy controls. However, several other studies have shown altered gene expression levels in migraineurs compared to migraine-free controls (12–15). Nagata et al. (2009) proposed alpha-fodrin as a potential biomarker for MA by investigating lymphoblast cell lines; we do find a high expression of SPTAN1 (encoding alpha-fodrin), but no difference in expression between MA, MO and/or controls (13). Gerring et al. (2016) compared migraineurs with controls and found 53 genes to be differentially expressed at liberal significance threshold (12). Of the 54, we found one gene to be nominally DE between MO and control without correction for multiple testing: IL1RL1 (p = 0.02). IL1RL1 is higher expressed in the MO cases, which is consistent with the higher expression in migraineurs from Gerring et al. (2016) (12). Gerring et al. (2017) compared migraineurs with controls and showed altered immune pathways, such as altered interferon and cytokine signaling (14). As no specific genes are mentioned, we are not able to compare directly with their findings. However, we do not have any indication of altered immune pathways in our data.
Those studies have, like ours, been performed on peripheral blood. This may limit findings, as migraine is mostly considered to be a brain disorder and the involvement of the vascular system is likely on blood-vessel (i.e. vasodilation) level. However, the blood transcriptome is to some degree correlated with brain tissues and, when interpreted cautiously, may provide useful insights into complex brain functions (11). The potential of discovering disease mechanisms and biomarkers of migraine using peripheral blood has been proposed by a review of Gerring et al. (2016) (12). To date, only one other study investigated gene expression profiles of migraineurs in a different tissue: The periosteum. Perry et al. (2016) focused on the expression of immune genes in the periosteum and found 37 immune genes to be differentially expressed, but none were significant after correction for multiple testing (15). We found a nominally significant difference in expression for LAIR1 and NFKBIA between MO and controls, FCGR2B and SOCS3 between MA and controls, and FCGR2B was also differentially expressed between MO and MA (p < 0.05). LAIR, FCGR2B, and SOCS3 were lower expressed in migraineurs than controls in the study of Perry et al. (2016), which is opposite to our findings (15). NFKBIA was, as in our findings, higher expressed in migraineurs than in controls. However, these results did not survive correction for multiple testing. Further, as they did not divide the migraine into migraine with or without aura, we cannot compare our findings in detail with Perry et al. (15).
Previous studies have mostly used microarray technology to investigate gene expression in migraineurs. We used RNA-Seq and investigated the whole known transcriptome. RNA-Seq has better power to find differences in gene expression compared to microarray technology, as it is detecting low abundance transcripts and has a broader dynamic range (28). However, the identification of changes in gene expression is highly dependent on sample size. The variation of a gene's expression profile is highly variable among genes. Using the RNASeqPower calculator (29) we estimated a power of 89% to detect DE genes with a fold change of 1.25 for genes with an average coefficient of variation in our study of 0.3. However, for the same fold change, the power reduces to 53% for genes with a coefficient of variation of 0.5. We therefore conclude that our study had enough power to detect changes in the genes that had a low to moderate variation across our samples. We did not have enough power, however, to detect changes in high varying genes. Perry et al. (2016) focused on the gene expression related to specific compounds, a so-called hypothesis-driven study (15). We did not replicate these findings, which may be a consequence of the so-called streetlight effect (30) or winner's curse (31). We must point out that the previous studies did not correct for multiple testing, which may result in the detection of false positives. When testing thousands of genes simultaneously for differential expression, the chance of detecting false positives is increased. That means, in case of a p-value threshold of 0.05, we expect 5% of the tested genes to be DE; that is, in our case, almost 800 genes will be detected to be DE. To avoid the detection of false positives, correction for multiple testing is imperative (32). So even though other studies report differences between migraine patients and healthy controls, we doubt the results as we were not able to replicate their findings.
Clinical implications
No clear distinction in gene expression profile was found between migraine patients outside migraine attack and healthy controls. There is a low chance of finding circulating genetic biomarkers in peripheral blood outside of migraine attack. Interpretation of results from gene expression studies that are not corrected for multiple testing or replicated in a separate cohort should be considered as hypothesis-generating studies and generalization should be done with great care. Increase of statistical power in future (trial-based) studies by, for example, increased sample size and inclusion of relevant covariates, may lead to revision of our findings.
Supplemental Material
Supplemental Material1 - Supplemental material for Comparing migraine with and without aura to healthy controls using RNA sequencing
Supplemental material, Supplemental Material1 for Comparing migraine with and without aura to healthy controls using RNA sequencing by Lisette JA Kogelman, Katrine Falkenberg, Gisli H Halldorsson, Lau U Poulsen, Jacob Worm, Andres Ingason, Hreinn Stefansson, Kari Stefansson, Thomas F Hansen and Jes Olesen in Cephalalgia
Supplemental Material
Supplemental Material2 - Supplemental material for Comparing migraine with and without aura to healthy controls using RNA sequencing
Supplemental material, Supplemental Material2 for Comparing migraine with and without aura to healthy controls using RNA sequencing by Lisette JA Kogelman, Katrine Falkenberg, Gisli H Halldorsson, Lau U Poulsen, Jacob Worm, Andres Ingason, Hreinn Stefansson, Kari Stefansson, Thomas F Hansen and Jes Olesen in Cephalalgia
Footnotes
Acknowledgements
We thank Isabel Engel for her assistance in collection of samples from the migraineurs and controls. The work was funded by a grant from the Candys foundation ‘CEHEAD’ (JO) and EU-funded FP7 “EUROHEADPAIN” grant (no. 602633 to JO).
Authors’ contributions
KF and JO conceived and designed the experiments. KF, JW, LU collected the data. AI, GHH, HS, and KS RNA sequenced all samples. LJAK analysed the data with the guidance of GHH and TFH. LJAK and KF wrote the first draft of the manuscript. All authors read and approved the final manuscript.
Declaration of conflicting interests
The authors disclosed receipt of the following financial support for the research, authorship, and/or publication of this article: deCODE Genetics is an Amgen Subsidiary. Amgen had no influence on study design, analyses, interpretation or publication of results.
Ethics approval
The study was approved by the Danish Ethical Standards Committee (H-15006298) and the Danish Data Protection Agency (I-suite 03786). All participants received oral and written information, and all provided written informed consent before inclusion in the study.
Funding
The authors received no financial support for the research, authorship, and/or publication of this article.
References
Supplementary Material
Please find the following supplemental material available below.
For Open Access articles published under a Creative Commons License, all supplemental material carries the same license as the article it is associated with.
For non-Open Access articles published, all supplemental material carries a non-exclusive license, and permission requests for re-use of supplemental material or any part of supplemental material shall be sent directly to the copyright owner as specified in the copyright notice associated with the article.