
Abstract
Background
Typical migraine is a frequent, debilitating and painful headache disorder with an estimated heritability of about 50%. Although genome-wide association (GWA) studies have identified over 40 single nucleotide polymorphisms associated with migraine, further research is required to determine their biological role in migraine susceptibility. Therefore, we performed a study of genome-wide gene expression in a large sample of 83 migraine cases and 83 non-migraine controls to determine whether altered expression levels of genes and pathways could provide insights into the biological mechanisms underlying migraine.
Methods
We assessed whole blood gene expression data for 17994 expression probes measured using IlluminaHT-12 v4.0 BeadChips. Differential expression was assessed using multivariable logistic regression. Gene expression probes with a nominal p value < 0.05 were classified as differentially expressed. We identified modules of co-regulated genes and tested them for enrichment of differentially expressed genes and functional pathways using a false discovery rate <0.05.
Results
Association analyses between migraine and probe expression levels, adjusted for age and gender, revealed an excess of small p values, but there was no significant single-probe association after correction for multiple testing. Network analysis of pooled expression data identified 10 modules of co-expressed genes. One module harboured a significant number of differentially expressed genes and was strongly enriched with immune-inflammatory pathways, including multiple pathways expressed in microglial cells.
Conclusions
These data suggest immune-inflammatory pathways play an important role in the pathogenesis, manifestation, and/or progression of migraine in some patients. Furthermore, gene-expression associations are measurable in whole blood, suggesting the analysis of blood gene expression can inform our understanding of the biological mechanisms underlying migraine, identify biomarkers, and facilitate the discovery of novel pathways and thus determine new targets for drug therapy.
Introduction
Migraine is a complex genetic disorder marked by episodic attacks of moderate to severe headache lasting between 4 and 72 hours, often unilateral and pulsating, and associated with nausea, photophobia, and phonophobia. A large minority of attacks are also inaugurated by visual, auditory, or other sensory hallucinations, and in some instances neurological deficits that affect speech and ideation (1). Migraine has a lifetime prevalence of 15–20% and most commonly affects people aged from 25 to 50, during their most productive years of life (2,3). As such, migraine not only has a significant impact on the quality of life of individual sufferers, but also represents a major economic and societal burden.
There is a diversity of evidence on the aetiology and pathophysiology of migraine. While some investigators have proposed migraine is initiated and sustained in the central nervous system, most consider the disorder to be neurovascular – a term that couples metabolic changes in the brain with dysfunctional intracranial and extracranial blood vessels. Heritable genetic factors explain 40–60% of the individual differences in developing migraine (4–7). Large genome-wide association (GWA) studies have identified over 40 common single nucleotide polymorphism (SNP) loci associated with the disorder, several of which have previous associations with vascular disease, and implicated regions show enrichment for genes expressed in vascular and smooth muscle tissues (8). Although these results provide important genomic support for vascular dysfunction being a primary mechanism underlying migraine, their biological role in migraine susceptibility is largely unknown. Analysis of other molecular data such as gene expression may provide insights into the biological mechanisms underlying migraine.
Gene expression is modified by genomic and environmental factors and has facilitated the discovery of molecular pathways for common neurological disorders (9,10). A recent gene expression study in the periosteum of 18 chronic migraine cases and seven non-migraine controls found differential expression of genes involved in the inflammatory response (11). These data provide some of the first evidence for an extracranial vascular mechanism in migraine and reveal a potential pathway for the development of targeted therapies and diagnostic biomarkers. However, the study only assessed inflammatory genes and included a small sample of highly selected clinic-based subjects, so neither the genome-wide significance nor the generalisability of their findings to the general population can be established.
These limitations may be overcome with the analysis of genome-wide gene expression in the whole blood of migraine subjects (12). Blood expresses many of the genes involved in the pathophysiology of complex neurological traits, and can be collected from a large number of individuals in a population-based setting. Although caveats exist (13), several small blood gene expression studies have shown clear separation of expression profiles based on migraine status (14), migraine subtype (15), and treatment response (16), suggesting blood gene expression signatures may provide valuable information in the assessment of migraine activity and risk. We therefore examined gene expression measured on 17994 probes from the whole blood of 166 unrelated individuals. Both the number of subjects studied and expression probes measured represent a large improvement on the existing literature, and provides increased power to identify expression patterns underlying migraine.
Methods
Brisbane Systems Genetics Study
Participants were recruited from the Brisbane Systems Genetics Study (BSGS), a genetic study of 962 individuals from 314 families of Northern European decent (17). Families consisted of adolescent monozygotic and dizygotic twin pairs, their non-twin siblings, and their parents. Informed written consent was obtained from each participant, and the study was approved by the Human Research Ethics Committee (HREC) of the QIMR Berghofer (QIMRB) Medical Research Institute.
RNA preparation
Whole blood samples were collected from participants and processed within 24 hours of collection. Whole blood was collected directly into PAXgene™ Blood RNA Tubes (QIAGEN, Valencia, CA). Total RNA was extracted from PAXgene™ tubes using the PAXgene™ Blood RNA Kit (QIAGEN, Valencia, CA). RNA from all samples was run on an Agilent Bioanalyzer to assess quality and to estimate RNA concentrations. RNA was converted to cDNA, and amplified and purified using the Ambion Illumina TotalPrep RNA Amplification Kit (Ambion).
Gene expression quantification
Expression profiles were generated by hybridising 750 ng of fragmented biotinylated cRNA (generated from 500 ng of total RNA) to Illumina HumanHT-12 v4.0 Beadchips for 18 h at 58°C, according to the Illumina whole-genome gene expression direct hybridisation assay guide (Illumina Inc, San Diego, USA). Beadchips were then washed, stained and subsequently scanned using an Illumina Bead Array Reader to obtain fluorescence intensities. A Latin square design was used to randomise the samples on the chips and chip positions.
Data processing and normalisation
Preprocessing and normalisation was previously described by Powell et al. (18). Pre-processing of data generated by the Illumina Bead Array Reader was done using Illumina software, Genome Studio (Illumina Inc., San Diego). Background noise detected from negative control beads was subtracted from raw expression values for each transcript. Data were then filtered for gene transcripts that were present in at least 50% of samples at p < 0.05 according to the global-error threshold calculated by Genome Studio’s cross-gene error model. Filtering based on this criterion removes genes that are either not expressed or only expressed in a low number of samples. After removing 6322 putative and/or poorly characterised genes, 17994 well-characterised detected probes remained for analysis, which corresponds to 13355 RefSeq genes. Probe signal intensities were stabilised using a quantile transformation procedure (19) and normalised with a linear mixed model to allow comparisons across chips and genes (20). The dataset is available at the Gene Expression Omnibus under the accession code GSE53195.
Migraine phenotype
The ID Migraine™ (21) screening questionnaire was used to identify migraine cases. The questionnaire contains three items related to the presence of photophobia, nausea, and health-related disability. A respondent scores positive to migraine if they endorse two out of the three items. The diagnostic performance of the questionnaire has been validated in a clinical setting (21), and has an estimated sensitivity of 0.84 (95% confidence interval (CI): 0.75–0.90) and specificity of 0.76 (95% CI: 0.69–0.83). The accuracy of ID migraine™ is similar across sex, age, presence of other co-morbid headaches, or existing diagnostic status (22).
Migraine groups
Demographic information for patients with gene expression data.

Association of gene expression levels with migraine
Genome-wide differential gene expression between migraine and control groups was performed using generalised linear models for each of the 17994 gene expression probes, adjusted for age and gender. An ANOVA function was used to test the change in model deviance obtained by adding gene expression as a covariate. To capture a reasonable number of genes for downstream analyses, a nominal significance threshold p < 0.05 was used. Ranked lists of differentially expressed genes were compared across independent cohorts using a one-sided binomial test. The global distribution of differential gene expression was examined by generating Q-Q plots of p values. Q-Q plots were constructed by ranking the p values from smallest to largest (the ‘order statistics’), and plotting them against their expected values under the null hypothesis of no association (sampled from the known chi-squared distribution). Deviations above the line of equality (drawn in white) indicate an excess of smaller p values. To aid interpretation, we have also calculated 95% confidence envelopes (shaded grey), formed by calculating, for each order statistic, the 2.5th and 97.5th centiles of the distribution of the order statistic under random sampling and the null hypothesis. The inflation factor (λ), defined as the ratio of the median observed chi-squared statistic divided by the test statistic of the expected median (0.4549), was also calculated to quantify the excess of smaller p values; where the expected λ value is 1 under the null hypothesis of no differential expression. To assess the potential impact of correlated gene expression on the migraine association test statistics distribution, principal component analysis followed by varimax rotation of the probe-expression correlation matrix was used to extract the 3316 least correlated (‘independent’) probes that captured the majority of the variation in gene expression (i.e., loaded highest onto the largest 3316 principal components). The number of ‘independent’ probes (3316) to select was determined using the approach of Li and Ji (25).
Analysis of migraine-related genes in biological processes
We first collated up-to-date pathways and gene sets from Reactome (date accessed: 04/04/2016; number of pathways = 674) (26), the Kyoto Encyclopaedia of Genes and Genomes (KEGG) (04/04/2016; n = 291) (27), Biocarta (07/04/2016; n = 217) (28), and the Protein Interaction Database (PID) (07/04/2016; n = 196) (29), as well as sets of genes expressed predominately in glial (03/20/2016; n = 71) (30) and neuronal cells (03/20/2016; n = 18) (31,32). The highly expressed, cell specific (HECS) gene expression database was used to assess enrichment of cell types (03/20/2016; n = 84) (33). We compared the distribution of p values from the differential expression analyses within each pathway against the p values for all other expressed genes using the Wilcoxon rank sum test. A false discovery rate (FDR < 0.05) was used to adjust for multiple testing (34), accounting for the number of assessed pathways.
Identification of gene expression networks (modules)
Gene co-expression modules were constructed using the weighted gene co-expression network analysis (WGCNA) package in R (35). Missing data were removed and a single probe with the highest mean expression per gene was selected to be included in the analysis using the collapseRows function in WGCNA, resulting in 5472 unique RefSeq genes. An unsigned pairwise correlation matrix – using Pearson’s product moment correlation coefficient – was generated for all genes and transformed into an adjacency matrix, where nodes correspond to genes and edges to the connection strength between genes. Each adjacency was raised to a power of 5 to place greater weight on large nodal relationships, and was normalised using a topological overlap function. Hierarchical clustering was done using average linkage, with one minus the topological overlap matrix as the distance measure. The hierarchical cluster tree was cut into modules using the dynamic tree cut algorithm (36), with a minimum module size of 60 genes. We amalgamated modules if the correlation between their eigengenes – defined as the first principal component of their expression values – was greater or equal to 0.8. Functional annotation of each gene module was performed by comparing the enrichment of Reactome pathways within a module compared to all other genes using Fisher’s exact test.
Gene expression networks associated with differentially expressed genes
Enrichment of differentially expressed genes within a module was determined using a one-sided binomial test that calculated whether the proportion of differentially expressed genes in a given module is higher than expected based on the total proportion of differentially expressed genes. Differentially expressed genes may have similar expression patterns due to their co-expression, rather than a true biological effect. Therefore, we performed a second co-expression adjusted binomial test in which we included only the number of effectively independent genes in the calculation using principal component analysis. That is, the number of effectively independent genes was estimated utilizing the matSpD program (http://neurogenetics.qimrberghofer.edu.au/matSpD/) based on the method of Li and Ji (25). In this way, we were able to control the Type I error rate in the presence of correlated expression values. All statistical analyses were performed using the computing environment R (37).
Results
Construction of independent migraine cohorts
We identified four independent cohorts of migraine case and control subjects from the Brisbane Systems Genetics Study (BSGS). A total of 38 unrelated adults (aged 37–74 years) and 45 unrelated adolescents (aged 10–20 years) screened positive for migraine using the clinically validated ID migraine™ screening tool (21). We stratified migraine cases by age – that is, whether an individual was recruited into the BSGS as an adolescent twin (or non-twin sibling) or as a parent of a twin – and gender. Each case was then age and gender matched with an unrelated individual from the BSGS study who screened negative for migraine. This resulted in four independent, non-overlapping, datasets: male adults (n = 30), female adults (n = 46), male adolescents (n = 34), and female adolescents (n = 56) (Table 1). This analytical approach enabled the assessment of gene expression underlying migraine within multiple independent datasets.
Association between migraine status and gene expression
To assess differential expression between the migraine case and non-migraine control groups, we fitted generalised linear models for each of the 17994 probes within each dataset, thereby generating four independent lists of migraine association p values. No single probe achieved genome-wide significance (p < 2.8 × 10⁻⁶, Bonferroni correction for testing 17994 independent probes [i.e., p < 0.05/17994]). To examine the comparability of each dataset, we intersected top-ranked probes and observed a clear trend in overlap of differential expression (Figure 1). For example, of the 866 differentially expressed probes in adult females, 81 probes (9%) were also differentially expressed in adult males – significantly more than expected by chance (binomial test, p = 0.0234).
(a) Venn diagram of differentially expressed probes (p < 0.05) across four independent migraine groups. (b) Proportion of probe overlap for all pairwise comparisons.
We therefore combined all datasets (n = 166 individuals, comprising 83 migraine cases and 83 non-migraine controls) and tested for an association between migraine status and gene expression using the same regression model used for the individual datasets, but with the addition of three dummy variables included as covariates to designate samples belonging to one of the four independent datasets (male adults, female adults, male adolescents, female adolescents). A total of 12 probes were differentially expressed at the recommended false discovery rate (FDR) threshold <0.1 (10), and a Q-Q plot showed an excess of migraine differential expression test with small p values (i.e., pDE < 0.05 [log10(PDE) > 1.3]) above the 95% confidence interval (shaded area) of the identity line (Figure 2), suggesting many of the differentially expressed genes represent true association signals of small effect. To assess whether correlated probe expression induced the observed excess of small p values, we performed principal component analysis to extract independent probes that capture the majority (75%) of variation. The resulting Q-Q plot and λ of 1.102 still indicated an excess of small p values, suggesting real biological effects underlie the observed associations (online Supplementary Material, Figure S1).
Q-Q plot of –log10 p values for differential expression between migraine cases and non-migraine controls (n = 166).
Involvement of differentially expressed genes in biological pathways
Involvement of differentially expressed genes in biological pathways.
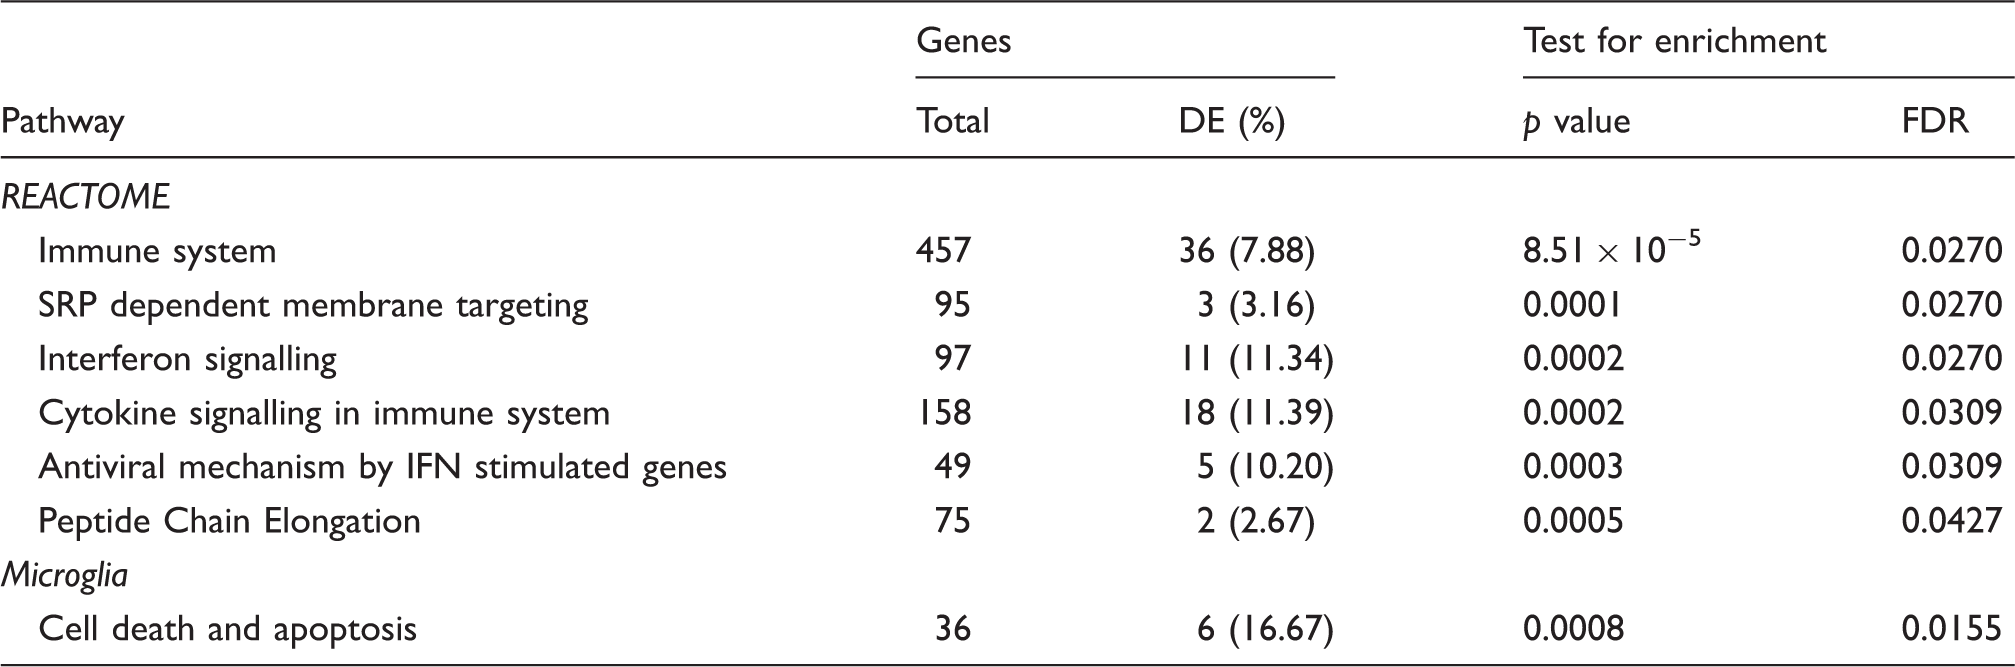
Notes: DE, differentially expressed; FDR, false-discovery rate; IFN, interferon, SRP, signal recognition particle. The test for pathway enrichment utilised the Wilcoxon rank sum test to measure the association between pathway membership and differential gene expression.
Gene expression networks (modules) associated with differentially expressed genes
Gene expression networks associated with differentially expressed genes.

Notes: DE, differentially expressed. pbinomial is the p value for the binomial test comparing the observed proportion of DE genes to that expected by chance.
Most highly-enriched pathways and gene sets in the migraine associated immune system module (M1).

Notes: ‘Total genes’ refers to the total number of genes assigned to the pathway; ‘tested genes’ refers to the number of total genes assigned to the pathway that were tested for differential expression; Genes DE, the number (and %) of genes differentially expressed; FDR, the significance of differential expression measured by the false discovery rate; HECS, highly expressed, cell specific; NK, natural killer. See Supplementary Table 1 for a full list of highly differentially expressed pathways and gene sets in the immune system module.
Discussion
We analysed migraine genome-wide gene expression data with the aim of identifying gene networks and pathways involved in migraine pathophysiology. Gene expression data measured in whole blood samples collected from 166 individuals from four independent cohorts showed global evidence for genes differentially expressed between migraine cases and non-migraine controls. A weighted gene co-expression network analysis (WGCNA) identified 10 gene co-expression modules. One module harboured a significant number of differentially expressed genes and was strongly enriched with immune and inflammatory pathways, including multiple pathways expressed in microglial cells.
The pathophysiology of migraine is restricted to a limited number of organ systems or tissues. Therefore, the choice of tissue for gene expression studies is an important consideration, particularly for neurological traits given the inaccessibility of nervous tissue from living individuals. Several recent studies of neurological disorders have used whole blood or its cellular constituents to measure changes in gene expression (10,38), citing biological and technical advantages offered by the tissue. From a biological perspective, blood is ubiquitous and transcriptionally active, and contains a diverse array of leukocytes that possess the receptors and pathways required to maintain homeostasis and mount a coordinated immune response to foreign substances and tissue damage. Technical advantages include the ability to collect blood samples from large population-based cohorts, rapidly preserve RNA upon extraction, and easily quantify cellular heterogeneity (12). Matched comparisons of human blood and brain tissues suggest the vast majority of genes expressed in the brain are also expressed in blood (39), and it has been shown that genes with similar detection levels between the tissues have highly correlated expression levels (40). Thus, whole blood is likely to provide biologically meaningful information for neurological traits such as migraine.
Despite these advantages, several important caveats of blood genomic profiling in complex neurological traits should be noted. First, blood gene expression is confounded by multiple biological and technical factors that represent a substantial proportion of expression variation and may lead to spurious associations (41). These sources of variation can be minimised with appropriate normalisation strategies to correct for inconsistencies between arrays, as well as the strict control of sample collection and laboratory conditions (42). Second, many genes are differentially expressed between tissues (39), so the transcriptional profile of whole blood may not capture pathogenic changes in another tissue. Third, although pilot data from the Genotype Tissue Expression (GTEx) study indicates more than half of the genetic control of gene expression is common across different tissues and shows largely consistent effect directions (43), there are instances where genetic effects differ across tissues (44). This highlights the importance of a multi-tissue approach and the use of genomic compendia such as GTEx to help characterise expression variation observed in blood.
A modular-based approach based on gene co-expression patterns was used to identify groups of functionally related genes associated with migraine. This approach enabled us to reduce the dimensionality of genome-wide gene expression data without the loss of important biological information, and thereby alleviate the multiple testing burden associated with traditional gene-based methods. Similar methods have been successful for other neurological disorders, including post-traumatic stress syndrome (45), major depressive disorder (10), and psychosis (46). However, these studies ignored important methodological issues in the modular analysis of transcriptional data. Notably, the use of traditional 2 × 2 table methods such as the chi-squared test to test for over-representation of biologically relevant genes (for example, differentially expressed genes or previously implicated candidate genes) is not statistically appropriate in a modular paradigm. That is, the underlying assumption of these tests – that the gene expression estimates are independent – is not met, due to the high correlation among genes within a module (compared to all remaining genes), and thus may result in biased test statistics with an inflated Type I error. Therefore, methods that include only the number of independent genes in a dataset, or adjust for correlated expression using, for example, permutation (47) or bootstrap resampling (48), should be applied in modular analysis to maintain control of the Type I error rate. In this study, we estimated the effective number of independent genes within each module using principal component analysis to provide unbiased estimates of association in these highly correlated data.
One module (module M1) was down-regulated in migraine cases and significantly enriched with differentially expressed genes involved in immune-inflammatory pathways. Particularly strong enrichments were observed in immune pathways of microglial cells, the blood-derived immune cells of the central nervous system. Inflammatory pathways play an important role in migraine pathophysiology, evidenced by the continued use of anti-inflammatory drugs for acute migraine relief (49). The precise role of inflammation in migraine is unclear, however a putative mechanism begins with the release of cellular stressors from the brain parenchyma, blood vessel walls, or both, which triggers the release of vasoactive neuropeptides near sensory fibres that innervate the meninges. These neuropeptides may subsequently bind and activate peripheral nociceptors at the level of the trigeminovascular system, leading to vasodilation, localised inflammation, and prolonged head pain (50). This mechanism is supported by the recent successful clinical trial of prophylactic treatment designed to block the release of a potent vasoactive peptide from the trigeminal nerve afferents in the early stages of an attack, thereby potentially increasing the activation threshold of the trigeminovascular system and its brain stem connections (51). These lines of evidence suggest experimental approaches that focus on immune-inflammatory genes, particularly those highly expressed in microglial cells, may identify more effective treatments for migraine and inform the development of biomarkers to monitor disease activity and progression.
Our results largely corroborate the conclusions of Perry et al. (11), who performed a targeted gene expression study of 540 inflammatory genes in the periosteum of 18 patients with chronic migraine and self-reported cranial muscle tenderness and seven controls. Of the 540 genes investigated, 36 were differentially expressed between migraine cases and controls and formed a gene network associated with activation of immune and inflammatory processes. We find nominal evidence of association for six out of 36 genes (NFKBIZ, TNFSF10, TNFAIP3, CXCR4, ABCB1, and NFIL3) reported as differentially expressed, and our gene network is similarly enriched with immune system pathways. Our study expands upon the targeted analysis of inflammatory genes in a small group of highly selected patients performed by Perry et al., by assessing genome-wide gene expression in the whole blood of 166 subjects. It has also been shown that blood gene expression profiles can differentiate chronic migraine and acute migraine from healthy controls (14), chronic migraine without medication overuse from patients with medication overuse (16), and menstrual-related migraine from non-menstrual-related migraine (15). These studies used small patient samples and older microarray technologies, limiting direct comparisons with our study. Nonetheless, taken together with our results and those of Perry et al., these data provide further support for blood genomic studies of migraine.
In summary, we performed the largest known gene expression study of migraine and found multiple immune-inflammatory pathways underlying the disorder. Our results complement a recent expression study of migraine, and suggest immune processes play an important role in migraine pathophysiology. However, this study should be interpreted in the context of several potential limitations.
First, we relied on the ID migraine™ tool to identify migraine cases and non-migraine controls, with no relation between last migraine attack and time of blood sampling. The ID migraine™ tool is a clinically validated screening instrument with an estimated sensitivity of 81% and specificity of 75%, and has been shown to positively identify 93–98% of people who were subsequently diagnosed with migraine by headache experts using International Headache Society (IHS) criteria (22). Although the developers of the ID migraine™ screening tool validated its utility in men and women aged 18 to 55 years old, subsequent studies have demonstrated its utility in adolescents (52,53). However, the age of onset for migraine with aura peaks between the ages of 12 and 13 in females, and on or before ages 4–5 in males, while the age of onset for migraine without aura peaks between the ages of 14 and 15 in females, and between ages 10 and 11 in males (54). Given the mean age of the male and female adolescent samples in our study is over 14 (Table 1), we expect that the majority of adolescents at risk of migraine would have experienced a migraine episode. In addition, the controls were selected as not having a family history of migraine. Nonetheless, the possibility remains for some controls being later diagnosed with migraine. Regardless, the consequence of controls being undiagnosed migraineurs would be to simply reduce our power to identify gene expression differences between migraine cases and controls (i.e., as it would make gene expression in controls more similar to cases). Ideally, future expression studies should confirm diagnoses using a semi-structured interview and IHS diagnostic criteria, and attempt to match sample collection with respect to the last migraine attack.
Second, the observed deviation of probe level test statistics from the null distribution may be due to correlation between probe expression values. However, the Q-Q plot of p values from the subset of 3316 independent probes identified via principal component analysis also indicated an excess of small p values (online Supplementary Material, Figure S1).
Third, despite the relatively large sample size compared to previous gene expression studies of migraine, our study did not identify individual genes reaching study-wide significance. This indicates that, while our study size is able to demonstrate global differential expression and implicate pathways, it lacked power to implicate individual genes associated with migraine. Indeed, assuming a standard deviation of 0.7 for the gene intensity measures on a log2 scale, using a two-sided test based on the conservative Bonferroni-adjusted p value threshold p < 2.8 × 10⁻⁶, we would require 438 migraine cases and 438 non-migraine controls to have 80% power to detect a 1.2-fold difference in gene expression levels.
Finally, we could not evaluate the impact of potential (unobserved) confounding effects on gene expression, such as medication use and cell type proportions. Studies of large, well phenotyped samples aimed at identifying genes differentially expressed between migraine cases and non-migraine controls will overcome such limitations. We also advocate an approach where gene expression data is integrated with other –omic data such as SNP genotype, DNA methylation, and metabolomic data measured in whole blood; this can then be compared with results from other tissues, such as the recent gene expression study in periosteum tissue published in the Annals of Neurology (11). The use of such diverse molecular data will improve our ability to dissect novel pathogenic pathways underlying migraine and ultimately help target new preventive therapies.
Footnotes
Article highlights
Whole blood is an accessible and reliable biological substrate for genomic studies of brain-related disorders and may therefore be used to interrogate biological pathways underlying migraine.
We assessed 17994 gene expression probes measured from the whole blood of 83 migraine cases and 83 age and gender-matched non-migraine controls with European ancestry.
Association analyses between migraine and probe expression levels, adjusted for age and gender, revealed an excess of small p values.
Network-based analyses identified 10 gene co-expression modules, one of which contained a higher than expected number of genes differentially expressed between migraine cases and controls after correction for correlated gene expression, and was significantly enriched with immune function and inflammatory signalling pathways.
Blood gene expression studies of migraine can improve our understanding of biological mechanisms underlying migraine and may thereby inform the development of diagnostic biomarkers and new targets for drug therapy.
Acknowledgements
We acknowledge the participation of the individuals sampled in the Brisbane Systems Genetics Study. Dale R Nyholt (613674) and Grant W Montgomery (619667, 1078399) were supported by an Australian National Health and Medical Research Council (NHMRC) Research Fellowship. Joseph E Powell is supported by an NHMRC Career Development Fellowship (APP1107599). Research reported in this publication was supported by NHMRC project grants (APP1046880, APP1075175, APP1083405) and by the European Union’s Seventh Framework programme (2007–2013) under grant agreement no. 602633 (EUROHEADPAIN).
Ethics approval
Individuals present in this study were recruited as part of the Brisbane Systems Genetics Study (BSGS). This study was approved by the QIMR Berghofer Medical Research Institute Human Research Ethics Committee (HREC) Approval number: P589 and the QUT HREC (Administrative Review approval number 1500000115 (as per QIMR Berghofer Medical Research Institute, Approval number: P589). All participants gave informed written consent.
Declaration of conflicting interests
The authors declared no potential conflicts of interest with respect to the research, authorship, and/or publication of this article.
Funding
The authors received no financial support for the research, authorship, and/or publication of this article.
References
Supplementary Material
Please find the following supplemental material available below.
For Open Access articles published under a Creative Commons License, all supplemental material carries the same license as the article it is associated with.
For non-Open Access articles published, all supplemental material carries a non-exclusive license, and permission requests for re-use of supplemental material or any part of supplemental material shall be sent directly to the copyright owner as specified in the copyright notice associated with the article.