
Abstract
Background
A common characteristic of migraine-inducing substances is that they cause headache and no pain in other areas of the body. Few studies have compared pain mechanisms in the trigeminal and spinal systems and, so far, no major differences have been noted. We compared signalling molecules in the trigeminal and spinothalamic system after infusion of the migraine-provoking substance glyceryltrinitrate.
Method
A catheter was placed in the femoral vein of rats and one week later glyceryltrinitrate 4 µg/kg/min was infused for 20 min. Protein expression in the dura mater, trigeminal ganglion, nucleus caudalis, dorsal root ganglion and the dorsal horn of the thoracic spinal cord was analysed at different time points using western blotting and immunohistochemistry.
Results
Glyceryltrinitrate caused a threefold increase in expression of phosphorylated extracellular signal-regulated kinases at 30 min in the dura mater and nucleus caudalis (P < 0.05) and at 2 h in the trigeminal ganglion with very few expressions in the dorsal root ganglion. In the nucleus caudalis, expression of phosphorylated extracellular signal-regulated kinases and Cam KII increased 2.6-fold and 3.2-fold, respectively, at 2 h after glycerytrinitrate infusion (P < 0.01). p-CREB/ATF-1 upregulation was observed only at 30 min (P < 0.05) in the nucleus caudalis. None of these markers showed increased expression in the regions of thoracic spinal cord dorsal horn.
Conclusion
The dura, trigeminal ganglion and nucleus caudalis are activated shortly after glycerytrinitrate infusion with long-lasting expression of phosphorylated extracellular signal-regulated kinases observed in the nucleus caudalis. These activations were not observed at the spinal level.
Abbreviations
glyceryl trinitrate nitric oxide soluble guanylyl cyclase cyclic guanosine mono-phosphate phosphorylated extracellular signal-regulated kinases trigeminal nucleus caudalis mitogen-activated protein kinase cyclic adenosine mono-phosphate phosphorylated cAMP response element binding protein trigeminal ganglion spinal cord dorsal root ganglion middle meningeal artery
Introduction
The nitric oxide (NO) donor, glyceryl trinitrate (GTN), induces immediate headache, but no pain in other areas of the body, when infused in normal controls and migraine patients. In migraineurs, the immediate headache is followed by a migraine-like headache 5–6 h after the infusion (1,2). This is so far the most reliable and accepted model of migraine. It is unclear how NO causes delayed headache. Simulation of a human GTN model in unanaesthetised rat showed an increase in c-fos expression in the trigeminal nucleus caudalis (TNC). This effect persisted up to 4 h and was alleviated by pre-treatment with sumatriptan and calcitonin gene-related peptide (CGRP) antagonist BIBN4096 (3,4). In the initial phase of migraine, activation of peripheral nociceptors innervating the meninges might be a crucial step followed by activation of second order neurons within the TNC. It could also be part of a self-perpetuating system, as infusion of GTN increases protein levels of neuronal nitric oxide synthase (nNOS) in the dura mater (4).
NO influences gene expression and protein synthesis (5). It activates soluble guanylyl cyclase (sGC) to synthesise cyclic guanosine mono-phosphate (cGMP) (6,7). Clinical studies have identified the involvement of this pathway in migraine pathophysiology since the phosphodiesterase inhibitor, sildenafil, induces headache in healthy controls and migraine-like headache in migraineurs (8,9). Mitogen-activated protein kinases (MAPKs), including extracellular regulated kinases (ERKs), have been suggested to play a major role in inducing and maintaining peripheral and central sensitisation. In smooth muscle cells, MAPKs are activated by NO/cGMP/protein kinase G (PKG) (10). During noxious stimulation or inflammation, phosphorylated ERK (p-ERK) enters the nucleus and phosphorylates the cAMP-response element binding protein (CREB) (11). Phosphorylated cAMP response element binding protein (p-CREB) and activating transcription factor-1 (ATF-1), in a combined fashion, activate the expression of the early transcription gene, c-fos (12–14). Inhibition of ERK phosphorylation can reverse the transcriptional changes leading to late onset sensitisation (15). Ca2+/calmodulin-dependent protein kinase II (CamKII) is another one such kinase that regulates the calcium signalling and the activities of many ion channels and receptors (16). Thus, it plays a key role in nociceptive processing and central sensitisation (17,18). Studies have reported the role of endogenous NO in activating ERK and CamKII during synaptic plasticity in hippocampus (19). This cascade of events has so far received limited attention in the trigeminal vascular system (TVS). The present study therefore investigates the signalling pathways downstream to NO and upstream to c-fos in the trigeminal system using our naturalistic GTN model in awake, freely moving rats. We compare these findings with the thoracic spinal ganglia and dorsal horn of the thoracic spinal cord.
Methods
Animals
Forty-two male Sprague-Dawley rats weighing 250–300 g (Taconic M&B, Denmark) were used for the study. The rats were maintained in cages with a 12-h light/dark cycle and free access to food and water. All the experimental protocols were approved by the Danish Animal Experiments Inspectorate (2009/561-1664).
Surgical procedures
Surgery was performed according to the procedures reported in our recent studies (17). In short, rats were anaesthetised by injecting ketamine (100 mg/kg) and xylazine (7.5 mg/kg) intraperitonially and treated with Baytril (antimicrobial, enrofloxacin; 10 mg/kg s.c) and Rimadyl (NSAID; 5 mg/kg s.c). The femoral vein was isolated and cannulated using polythene tubing, (0.40 mm, ID, 0.80 mm OD, Portex®, Smiths medical ASD, USA). The cannula was then sealed using a blocking solution (Haemaccel- Heparin, 2:1) and placed subcutaneously using a guided trocar and pulling it out at the neck nape. The animal was monitored until fully recovered from anaesthesia as indicated by the ability to ambulate and core body temperature was maintained using an automatic regulated heating plate (Letica HB101, Panlab, Barcelona, Spain). Baytril and Rimadyl treatment was repeated for 72 h post surgery, while temgesic (analgesic, Buprenorphin, Schering Plough Europe, Belgium) treatment was repeated 48 h (two days) post surgery with an interval of 24 h. After a recovery period of seven days, the rats were moved to accusampler cages (Dilab, Lund AB, Sweden) and were acclimatised for two days. The cannula was connected through a tether at the nape of the neck and the rats were allowed to move freely in the cage. On the third day, GTN (4 µg/kg/min for 20 min) or vehicle (0.18% ethanol for 20 min) was administered intravenously (i.v.) and at required time points the rats were euthanised with pentobarbital (65 mg/kg) and transcardially perfused with ice cold 0.1 M phosphate buffered saline (PBS) or 4% paraformaldehyde (PFA).
Drugs
GTN stock solution (5 mg/mL in 95% ethanol) was obtained from Nycomed (Roskilde, Denmark). Baytril stock solution (50 mg/mL) and xylazine (20 mg/mL) were purchased from Rompun® (Bayer Inc., Germany), Rimadyl stock solution (50 mg/mL) was obtained from Pfizer Inc (NY, USA), Temgesic stock solution (0.3 mg/mL), analgesic, was purchased from Schering Plough (Europe, Belgium), Ketamine (100 mg/mL) was obtained from Intervet (Skovlunde, Denmark).
For in vivo use, all stock solutions were diluted in saline if required and were stored at 4℃.
Protein expression studies
Antibody characterisation
The list of primary and secondary antibodies and concentrations used for western blot (WB), immunohistochemistry using DAB (IHC) and immunofluorescence (IF). Ms = Mouse, Rb = Rabbit.

Ms: mouse; Rb: rabbit.
Western blotting
The dura mater, TG, TNC (running caudally from approximately 1 mm to 5 mm from obex) and thoracic spinal cord (SC) were sampled 30 min, 1 h, 2 h or 4 h after GTN infusion and immediately frozen on dry ice with a number of four rats in each group. The isolated tissues were processed as described previously (20). Briefly, the tissues were crushed using a mortar and pestle and transferred to 100–300 µL of ice-cold lysis buffer (10 mM Tris [pH = 7.4], 0.5% Triton X-100, phosphatase and proteinase inhibitor tablets [Roche]). The samples were further homogenised and centrifuged and the supernatants were collected for determination of protein contents using a Bio-Rad DC protein assay (BIO-RAD, CA, USA). A total of 15 µg of protein was loaded and separated using sodium dodecyl sulphate polyacrylamide gel electrophoresis (SDS-PAGE). The separated proteins were then transferred to a polyvinylidene difluoride (PVDF) membrane (BIO-RAD) and blocked in 5% non-fat dry milk in tris-buffered saline (TBS) with 1% Tween-20 (TBS-T) for 1 h at room temperature. Blots were then incubated with the primary antibodies of interest and secondary antibodies, all conjugated to horseradish peroxidase (HRP). The PVDF blots were then processed for analysis using an enhanced ChemiLuminiscence (ECL) detection kit (Pierce) and Electronically Cooled CCD Camera System (Fujifilm LAS-1000) was used to scan the blots and the chemifluorescent images were captured and stored digitally. To compare the expression profile between the tissues, the densitometry of each antibody signal was measured in ImageGauge 4.0 and related to the densitometry counts from the GAPDH signals (loading controls). Densitometry data were graphically visualised. For the expression of different protein in the same blots, the blots were stripped using stripping buffer followed by several washes and treated as mentioned above.
Immunohistochemistry
The rats were sampled at different time points (to confirm changes observed via western blotting; 30 min and 2 h) (n = 3 in each group) and transcardially perfused with isotonic saline for 2 min, followed by 4% PFA at room temperature for 8 min. The dura mater, TG, TNC, thoracic dorsal root ganglion (DRG) and spinal cord dorsal horn (SC) were isolated and post-fixed overnight in 4% PFA and dehydrated in sucrose (30%) four days prior to cryosectioning. Cross-sections of TNC and SC were cut in 40-µm sections. TG and DRG sections were cut longitudinally with a thickness of 12 µm. The whole intact dura mater was stained in a free-floating manner. For double immunolabelling of p-ERK and Neu N/OX-42/GFAP, staining sections were incubated overnight with a combination of rabbit antibody p-ERK/mouse antibodies for Neu N/OX-42/GFAP. The sections were then incubated with a combination of Alexa Fluor® 594 donkey anti-rabbit IgG and Alexa Fluor® 488 donkey anti-mouse IgG (Invitrogen, OR, USA) prior to mounting. The same procedure was repeated for all different combinations of antibodies. Neu N was used as a marker for neuronal cells, OX-42 for microglia and GFAP for astroglia. Similar protocols were followed for the double immune labelling for other markers. Representative images of the treated and control sections were captured using the Nikon digital camera attached to the fluorescence microscope (Nikon Ni-U, DFA A/S, Denmark). Immunostaining of c-fos in TNC and spinal cord were performed using the DAB protocol as described previously (3,4).
Quantification of calcitonin gene-related peptide (CGRP) and p-ERK co-localisation in the dura was analysed from three rats in each group. Two pictures from each rat were captured under 400X magnification in the regions around the middle meningeal artery (MMA). The percentage of p-ERK-positive fibres that co-localised with CGRP was determined by calculation of the total number of CGRP + p-ERK positive fibres per total number of CGRP-positive fibres in the area around the MMA. In TG, the branching of the trigeminal nerve was used as a landmark to differentiate V1 (ophthalmic)/V2 (maxillary) from V3 (mandibular) neurons. The percentage of total p-ERK positive neurons was determined by counting total number of p-ERK stained neurons per total number of neurons in the V1/V2 region.
Data analysis
All values are presented as mean ± SEM. Experiments were compared using ANOVA (Kruskal–Wallis test), which was followed by Dunn’s post-hoc test to determine the significant difference from the saline treated group. Mann–Whitney U-test was used for analysis of non-paired data in immunohistochemistry analysis. Differences were considered significant at P < 0.05. GraphPad Prism (GraphPad Prism software Inc., San Diego, CA, USA) was used for statistical analysis.
Results
GTN infusion increases expression of p-ERK in dura mater at 30 min
Western blotting
A characteristic band of the p-ERK 1/2 protein was identified at 44 and 42 KDa. The densitometry data of p-ERK 1 and 2 were pulled together. We observed a threefold increase in p-ERK levels in the dura mater 30 min after GTN infusion as compared to the vehicle control (P = 0.038) (Figure 1a). There were no significant changes in p-ERK expression at 1 h, 2 h and 4 h. The expression of non-phosphorylated ERK did not change after GTN infusion. Cam KII showed no significant changes in dura mater at 30 min, 1 h, 2 h or 4 h after GTN infusion and was identified at 50 KDa (Figure 1b).
Western blot analysis of p-ERK and CamKII in the dura mater at different time points after GTN or vehicle infusion. (a) p-ERK is increased in dura mater 30 min after GTN infusion (4 µg/kg/min for 20 min). Statistical analysis by Mann–Whitney U test; *P < 0.05 compared with vehicle (n = 6). (b) p-ERK and CamKII were not upregulated at 1 h, 2 h and 4 h after GTN infusion. Statistical analysis by Kruskal–Wallis test, no significance was found when vehicle was compared to GTN treatment (n = 4). GAPDH was used as an internal loading control.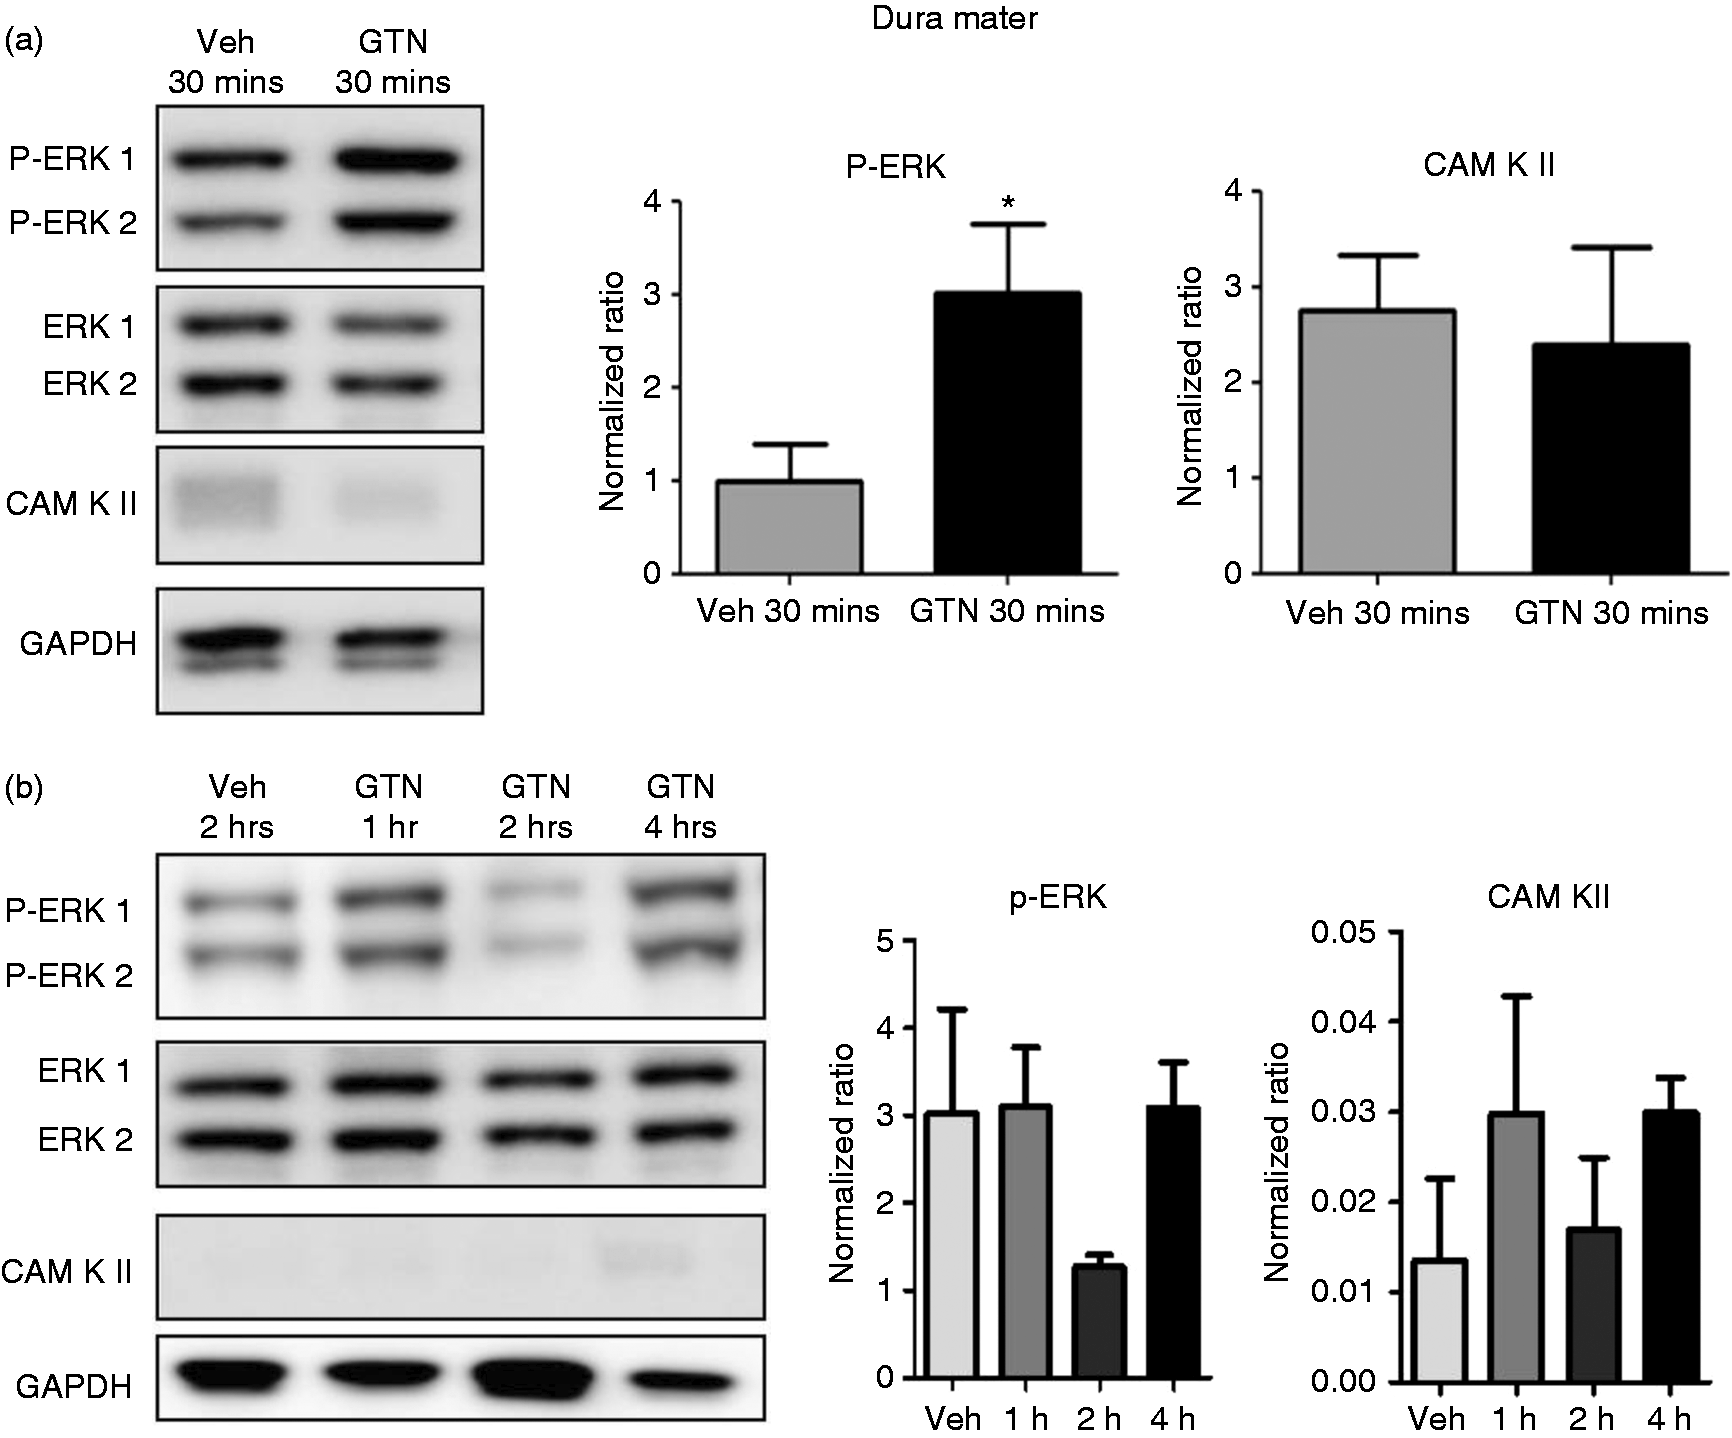
Immunohistochemistry
Since western blot showed an increase in p-ERK expression at 30 min, we investigated the localisation of p-ERK in the dura mater following GTN infusion. Thirty minutes following GTN administration, we analysed the area around the MMA and observed sparsely populated p-ERK positive fibres. Fewer p-ERK positive fibres were observed in the vehicle treated dura as compared to the GTN treated group (Figure 2). To determine if the observed p-ERK immunoreactivity were in sensory nerve fibres, we co-labelled the dura mater for CGRP. Quantification of double immuno-labelling further revealed that 58.9 ± 2.9% (n = 3) of CGRP-positive nerve fibres co-localised with p-ERK in the GTN treated group, whereas only 11.6 ± 3.1% (n = 3) co-localisation was observed in the vehicle treated group (Figure 2b).
Representative images of immunohistochemical localisation of p-ERK in the dura mater. (a) Double immunolabelling revealed that the increased p-ERK expression in the dura mater 30 min after GTN infusion (4 µg/kg/min for 20 min) were co-localised with CGRP-positive nerve fibres (arrows). Vehicle treatment showed very weak expression of p-ERK in the dura mater. Scale bar = 50 µm (n = 3). (b) Bar graph represents the percentage of p-ERK positive fibres co-localised with CGRP. Statistical analysis by Mann–Whitney U test; ***P < 0.001 compared with vehicle.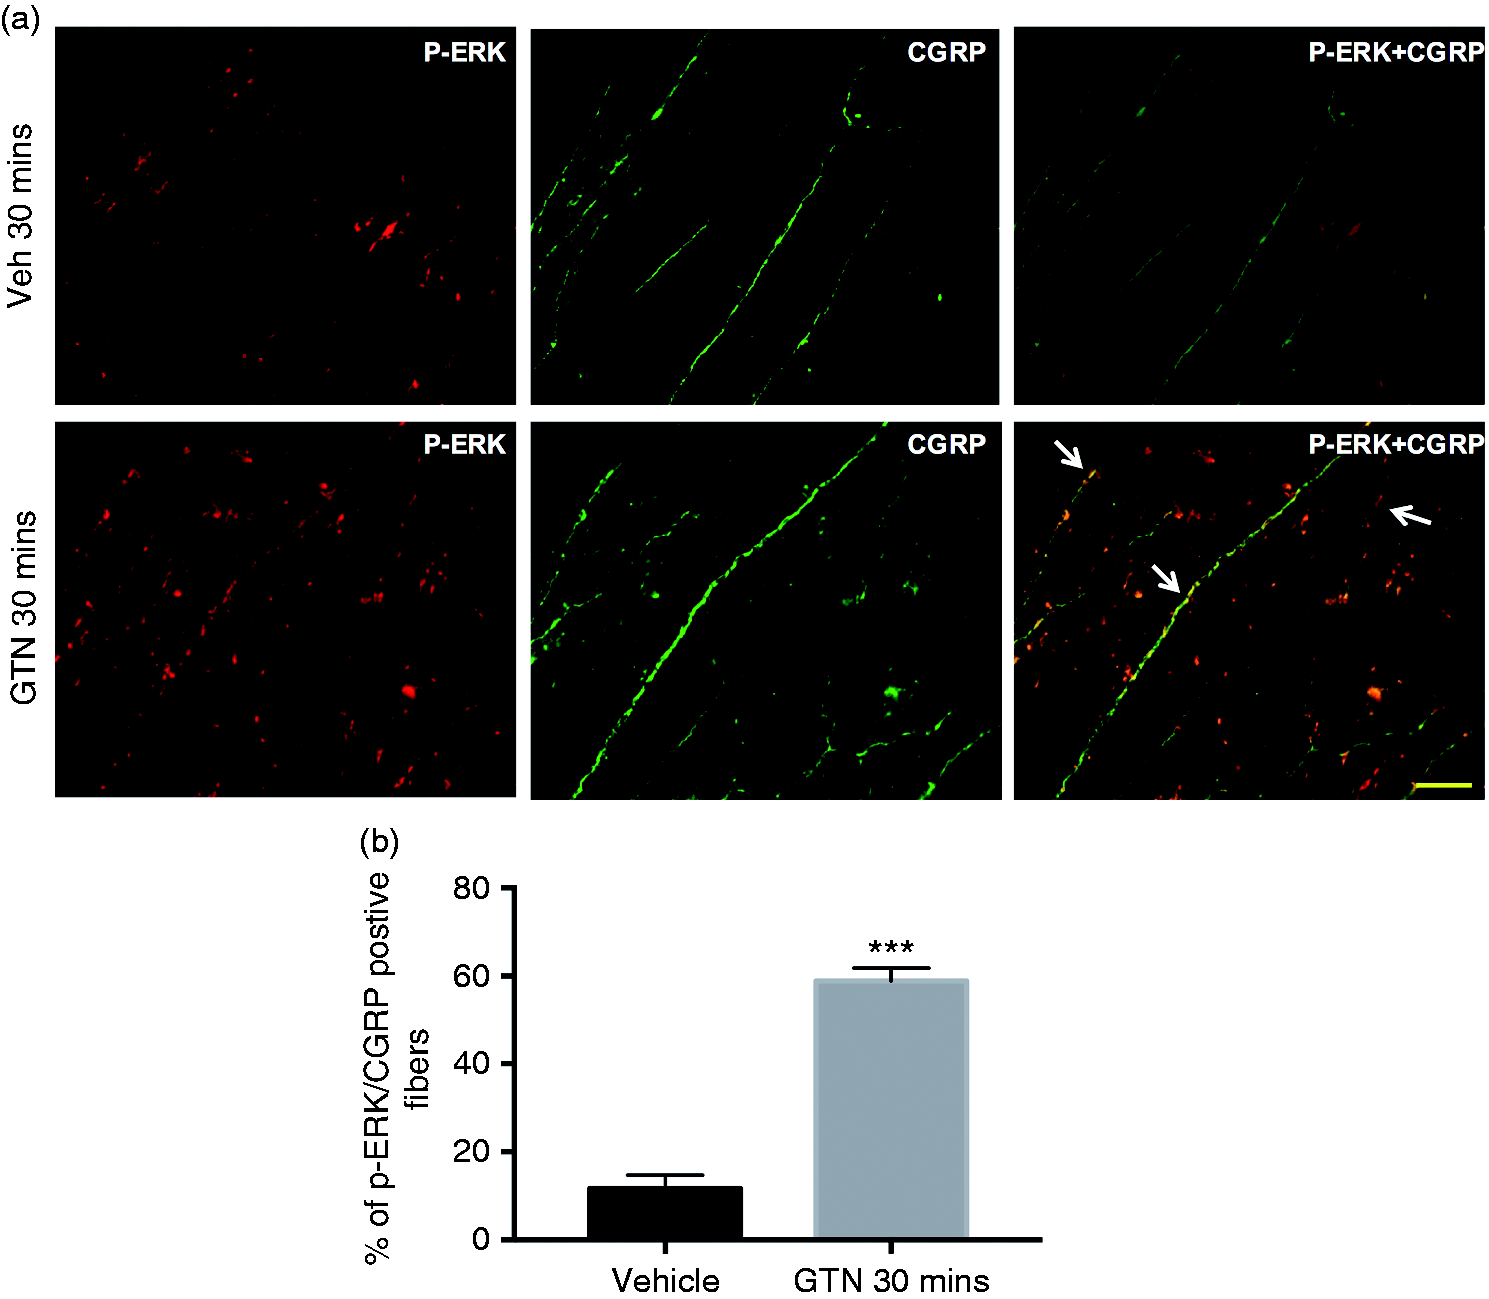
GTN infusion increases the expression of p-ERK in TG but not in DRG at 2 hrs
Western blotting
In TG, neither p-ERK nor CamKII were upregulated at 30 min after GTN treatment compared with vehicle controls (Figure 3a). At 2 h after infusion, p-ERK was significantly upregulated with a 1.7-fold increase compared with vehicle treatment (P = 0.028, n = 4) (Figure 3b). This may be a result of delayed activation of TG neurons following GTN infusion.
Western blot analysis of p-ERK and CamKII in the trigeminal ganglion at different time points after GTN or vehicle infusion. (a) p-ERK and CaM KII were not upregulated in TG 30 min after GTN infusion (4 µg/kg/min for 20 mins). Statistical analysis by Mann–Whitney U test; P > 0.05 (n = 6). (b) At the later time points, p-ERK was upregulated at 2 h after GTN infusion. A trend in increase of Cam KII was observed at 1 h after GTN infusion; however, it was not statistically significant. Kruskal–Wallis test followed by Dunn’s post hoc test; *P < 0.05 (n = 4). GAPDH was used as an internal loading control.
Immunohistochemistry
Using double immunolabelling, we analysed the localisation of p-ERK in TG where both cytoplasmic and nuclear localisation of p-ERK was observed in neurons mainly in the V1/V2 region at 2 h. Co-labelling with Neu N showed that 32.3 ± 3.2% of total neurons expressed p-ERK immunoreactivity at 2 h after GTN treatment compared with 7.8 ± 2.8% in vehicle controls (Figure 4a and 4c). p-ERK did not co-localise with GFAP, a marker for astroglial cells (data not shown). p-ERK expression was also analysed in the thoracic DRG at 2 h. 6.0 ± 1.9% of total neurons expressed p-ERK at 2 h in the GTN-treated group (Figure 4b) was not significant compared with the vehicle-treated group which was 5.7 ± 2.6% (Figure 4c).
Representative images of immunohistochemical localisation of p-ERK in TG and thoracic DRG. (a) Double immunoflourescence showed that p-ERK (green) was expressed in the neurons (Neu N) (red) of the trigeminal ganglion at 2 h after GTN (4 µg/kg/min for 20 min) infusion (arrows). Vehicle treatment showed very weak expression of p-ERK in the trigeminal ganglion compared with the GTN treatment. (b) Weak expression of p-ERK (red) was observed in thoracic DRG at 2 h after GTN infusion. Scale bar = 100 µm (n = 3). (c) Bar graph represents the percentage of p-ERK positive neurons co-labelled with Neu N. Statistical analysis by Mann–Whitney U test; ***P < 0.001 compared with vehicle.
The expression of p-ERK, p-CREB/ATF-1, Cam KII and c-fos is increased in trigeminal nucleus caudalis and not in thoracic spinal cord after GTN infusion
Western blotting
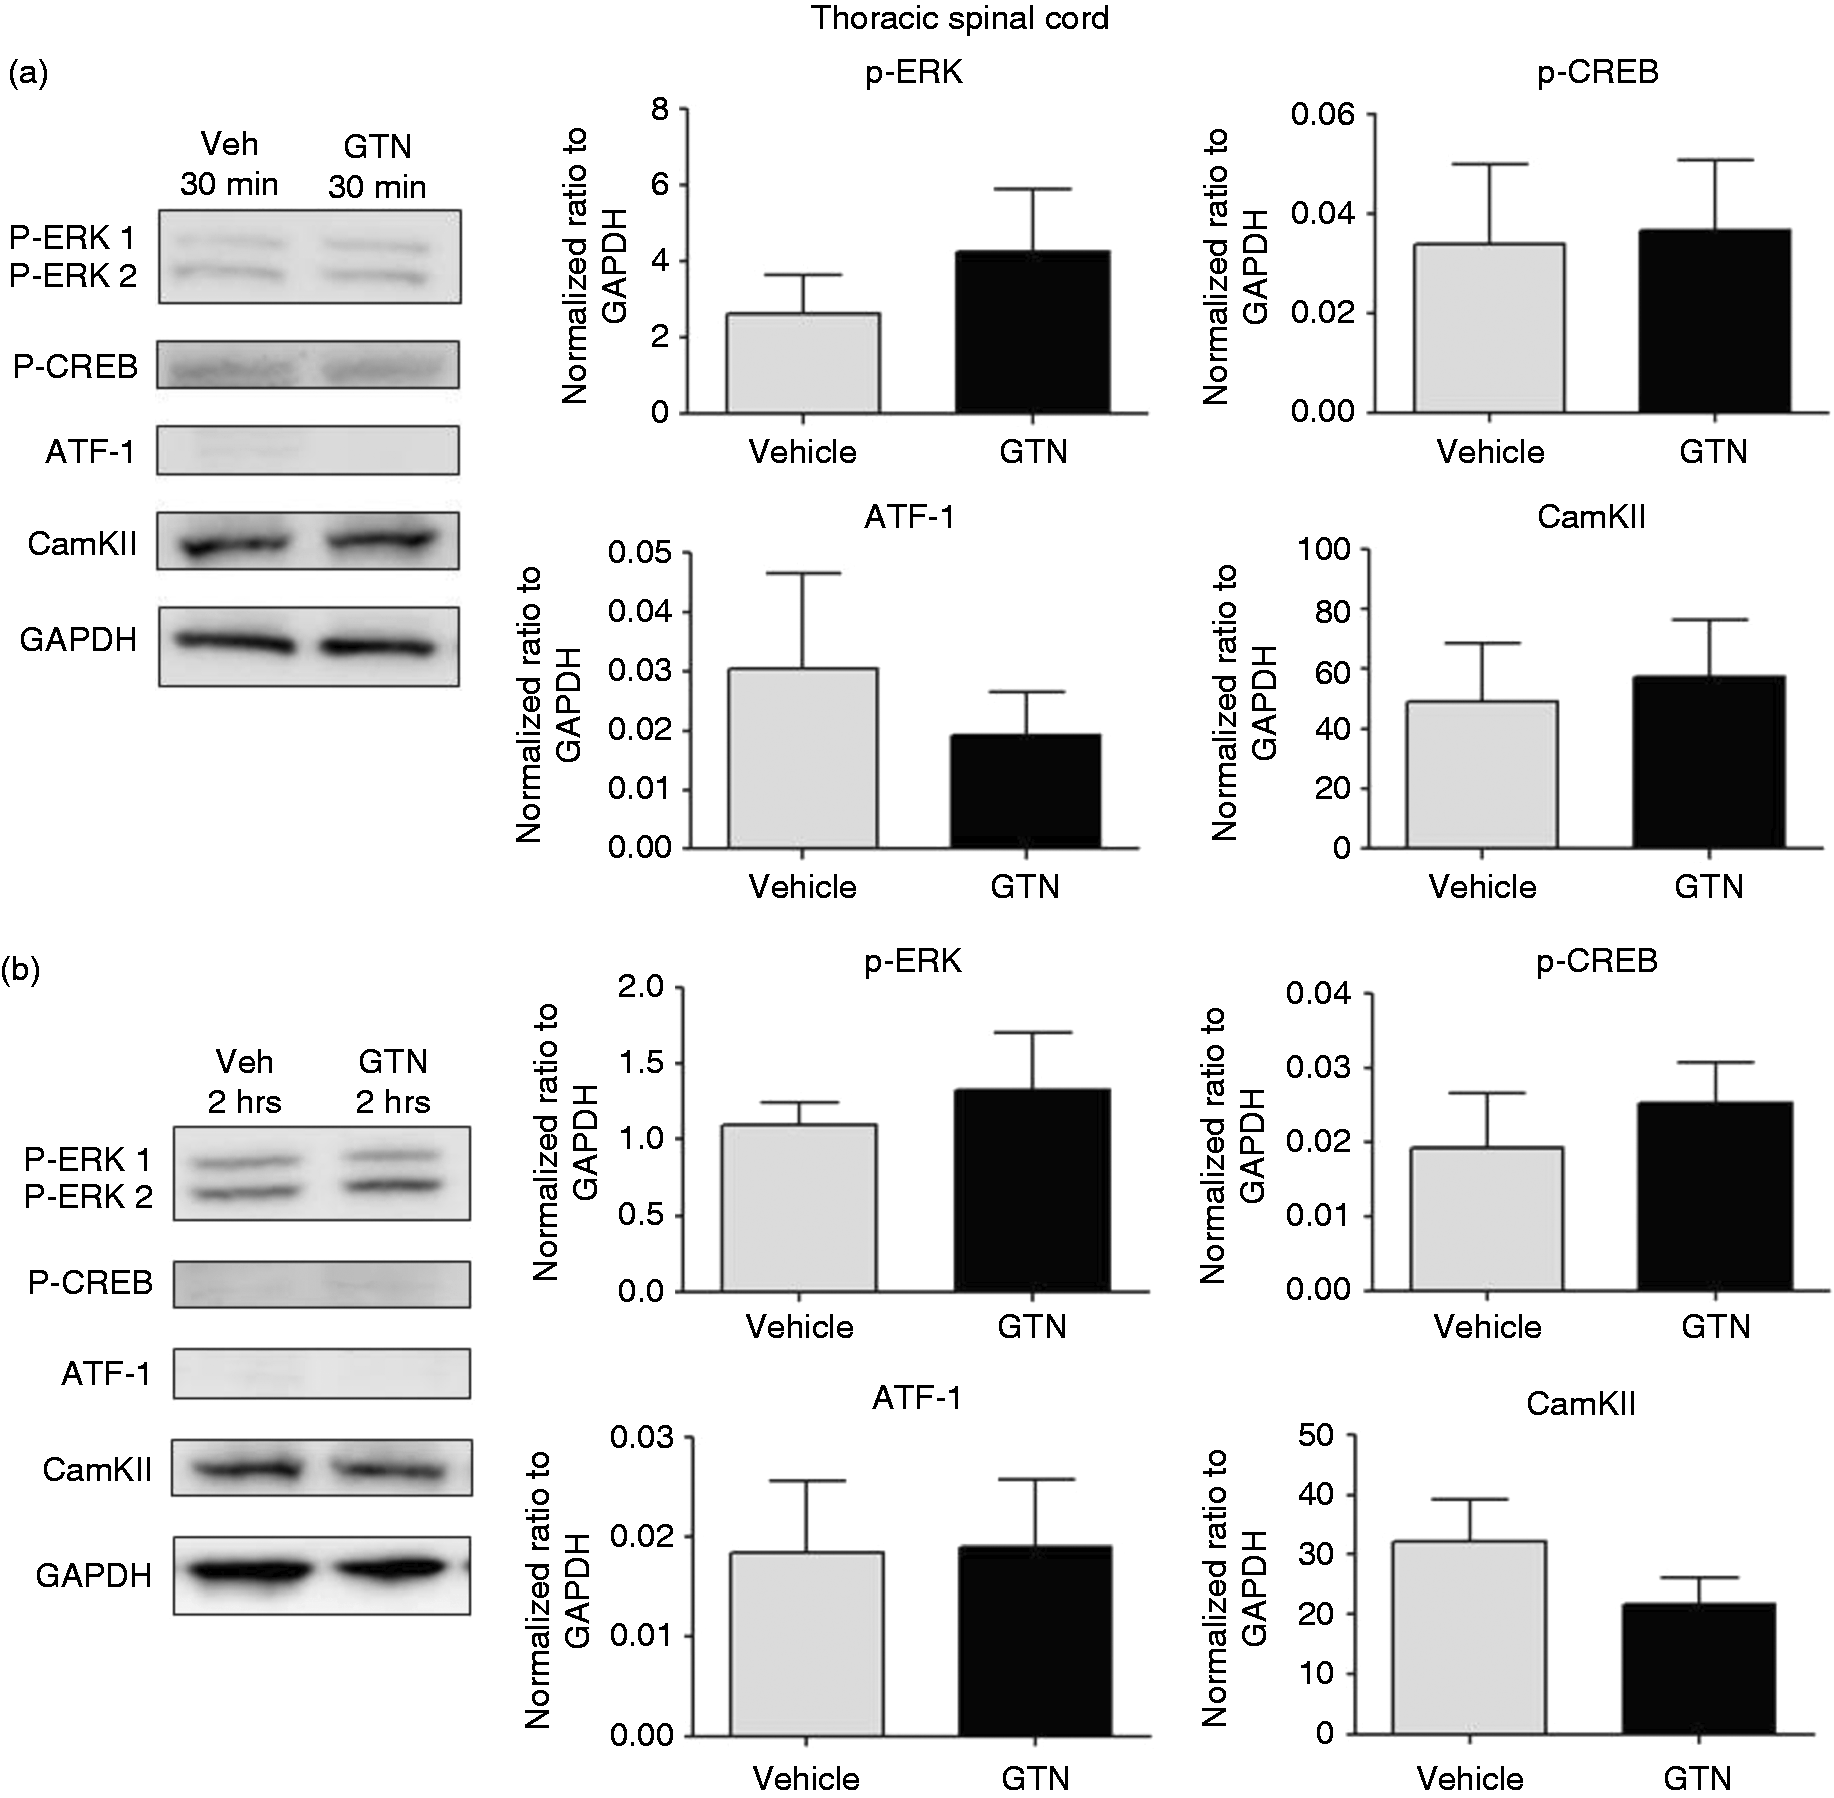
We observed a 2.6-fold increase in p-ERK expression and 1.9-fold increase in p-CREB/ATF-1 protein expression levels at 30 min after GTN compared with vehicle controls (P = 0.009 and P = 0.038, respectively; n = 6). Expression of Cam KII was not affected at 30 min after GTN infusion (Figure 5a). The activation of p-ERK in TNC was long-lasting as a significant 2.5-fold upregulation was observed at 2 h after GTN infusion compared with vehicle controls (P = 0.009). Cam KII was also upregulated by 3.2-fold in TNC at 2 h (P = 0.028) (Figure 5b). Interestingly, p-CREB/ATF-1 was not upregulated at 1 h, 2 h or 4 h after GTN infusion (data not shown). In the spinal cord, no significant increase in p-ERK, p-CREB/ATF-1 and Cam KII was observed at 30 min and 2 h after the GTN infusion (Figure 6).
Western blot analysis of p-ERK, p-CREB, ATF-1 and CamKII in trigeminal nucleus caudalis at different time points after GTN or vehicle infusion. (a) p-ERK and p-CREB/ATF-1 increased in TNC at 30 min after GTN (4 µg/kg/min for 20 min) infusion. Mann–Whitney U test; *P < 0.05, **P < 0.001 compared with vehicle (n = 6). (b) At the later time points, only p-ERK and CAM KII were significantly upregulated at 2 h after GTN infusion. No expression of p-CREB/ATF-3 was observed at 2 h. Kruskal–Wallis test followed by Dunn’s post hoc test; *P < 0.05, **P < 0.001 compared with vehicle (n = 4). GAPDH was used as the internal loading control. Western blot analysis of markers in thoracic spinal cord at different time points after GTN or vehicle infusion. There were no significant changes in p-ERK, p-CREB, ATF-1 and CamKII expression in thoracic spinal cord at (a) 30 min and (b) 2 h after GTN (4 µg/kg/min for 20 min) infusion. Mann–Whitney U test; P > 0.05 compared with vehicle (n = 4). GAPDH was used as internal loading control.
Immunohistochemistry
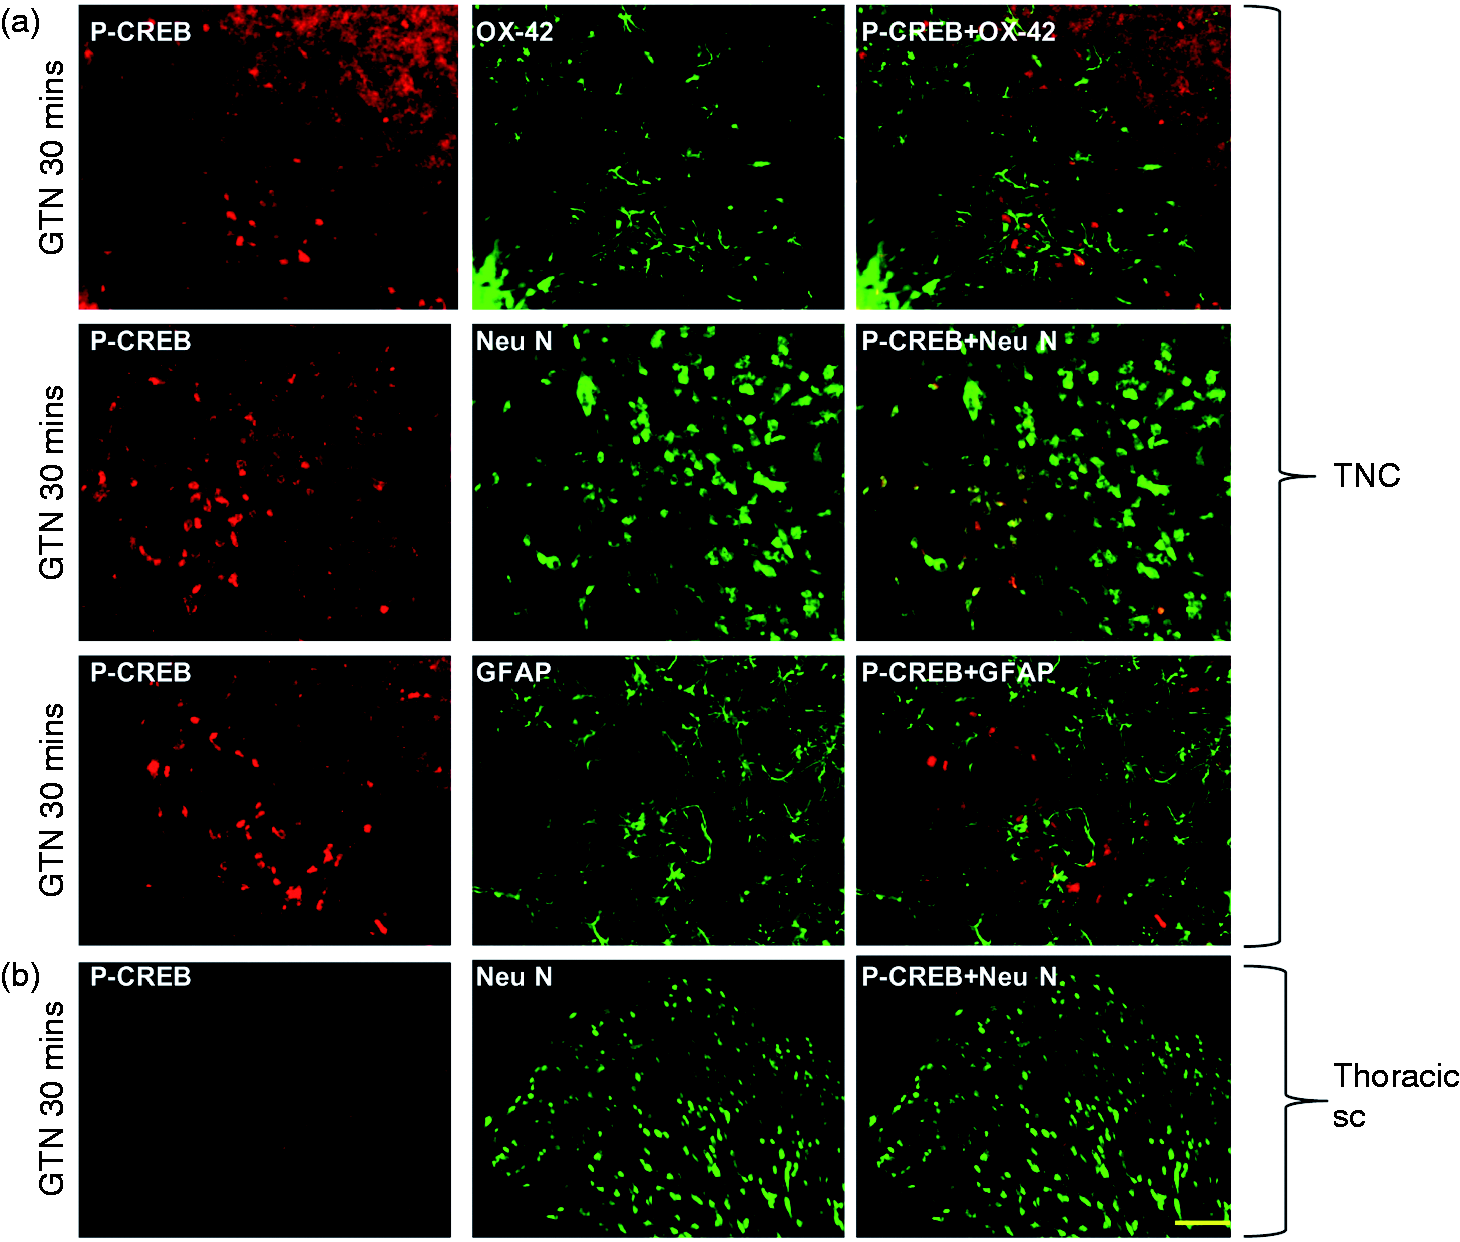
To identify the localisation of the upregulated proteins detected by western blotting, double immunolabelling was performed in TNC. Neu N was used as a marker for neurons, OX-42 for microglial cells and GFAP for astrocytes. Thirty minutes (Figure 7a) after GTN infusion p-ERK was mostly found in lamina I and II in TNC where it co-localised with Neu N and not with OX-42. GFAP did not co-localise with p-ERK, although it was closely positioned to p-ERK positive neurons (Figure 7a). The same pattern was observed for p-ERK expression at 2 h after GTN infusion (data not shown). Similarly, the localisation of p-CREB in TNC was evaluated by co-labelling with NeuN, OX-42 and GFAP. p-CREB was localised only in the neurons in TNC and not in astrocytes or microglial cells (Figure 8a). We also examined the expression of these markers in SC of the GTN treated group. Interestingly, we did not observe expression of any of the above markers in the thoracic segments (Figures 7b and 8b).
Representative images of immunohistochemical localisation of p-ERK in TNC and SC. (a) p-ERK expression was observed mainly in the ventrolateral segment of lamina I and II of the trigeminal nucleus caudalis 30 min after GTN infusion (4 µg/kg/min for 20 min). p-ERK was found to be co-localised only in neurons (Neu N) (big arrows). Co-localisation was not found with microglial (OX-42) or astroglial cells (GFAP). However, some of the p-ERK positive cells were in close association with the astroglial cells (small arrows). (b) No expression of p-ERK was observed in thoracic spinal cord (SC) segment at 30 min after GTN infusion. Scale bar = 50 µm (n = 3). Immunohistochemical localisation of p-CREB in TNC and SC. (a) Expression of p-CREB was observed in lamina I and II of the trigeminal nucleus caudalis at 30 min after GTN (4 µg/kg/min for 20 min) infusion. p-CREB was activated only in neurons (Neu N) and not in microglial (OX-42) or astroglial cells (GFAP). However, some of the p-CREB positive cells were in close association with the astroglial cells. (b) No p-CREB activation was seen in thoracic spinal cord (SC) at 30 min following GTN infusion. Scale bar = 50 µm (n = 3).
It should be noted that in accord with our previous findings (4) an increase in c-fos positive neurons were observed in the TNC at 2 h. However, no c-fos positive neurons were observed in the SC of the same group pf rats at 2 h following GTN infusion (Figure 9).
Representative images of c-Fos expression in TNC and thoracic spinal cord. (a) c-Fos expression was observed in lamina I and II in TNC at 4 h after GTN infusion. (b) Thoracic spinal cord from the same group of rat did not show any c-Fos expression after GTN infusion at the same time point (n = 6).
Discussion
We have previously reported that glyceryl trinitrate (GTN) infusion induces c-fos expression in the TNC using a validated animal model of migraine (3,4). In the present study, we elucidate the possible intracellular signalling pathways activated upstream to c-fos in the TVS. These results demonstrate that 20 min of intravenous infusion of a low GTN dose in awake rats induces immediate as well as long-lasting changes in signalling molecules that can lead to c-fos expression and hence neuronal activation.
Moreover, regardless of the similarity in pain physiology between both the systems, in our model GTN infusion activated the downstream signalling mechanisms were activated in the TVS and not in the spinal system (SS). This finding in accord with human studies suggests that GTN infusion may induce only headache and not any other kind of pain.
Activation of peripheral afferents in the dura mater
Noxious stimulation induces several biochemical changes in sensory nociceptive nerve fibres and p-ERK has been used as a marker for activated nociceptive afferents (21,22). Its involvement in peripheral sensitisation has also been suggested (23). NO is a retrograde signalling molecule and has, in the present study, been shown to increase p-ERK expression in dural nerve fibres at 30 min after GTN infusion. Given the co-localisation of p-ERK with CGRP, we suggest that a clinically relevant dose of GTN administered to awake rats induces activation of sensory nerve fibres in the dura mater. The early activation of p-ERK observed in the present study is probably due to a direct action of NO which may contribute to peripheral sensitisation. However, it could also be mediated via GTN-induced dural mast cell degranulation (24). This is supported by the rapid increase in expression of p-ERK in dural CGRP-positive fibres after compound 48/80 provoked mast cell degranulation. Involvement of arterial ERK activation after GTN infusion was induced in parallel to meningeal nociceptor sensitisation (25). However, in our study, the peripheral activation did not last long. Thus, it may play a role in the initiation of central activation.
Activation of sensory ganglia and second order neurons of the trigeminal system
Trigeminal ganglion
p-ERK serves as a marker of activation of primary sensory neurons in cell bodies and axons (22) and is activated within 10–15 min following noxious stimulation (26). We observed upregulation of p-ERK in the trigeminal ganglion only at 2 h. Since p-ERK activation was not seen at 30 min following 20 min of GTN infusion, we suggest that the upregulation of p-ERK observed at 2 h is a secondary phenomenon. Upregulated p-ERK was localised in the cytoplasm and nuclei of some neurons in the V1/V2 division of the TG that receives input from the ophthalmic (V1) and maxillary (V2) regions. This suggests that the upregulation of p-ERK at 30 min in dural sensory afferents might affect the sensitivity of the primary afferent nociceptors resulting in peripheral activation and consequently activation of the trigeminal sensory neurons.
Trigeminal nucleus caudalis
Previous studies have revealed that c-fos is transcriptionally regulated by the ERK-CREB/ATF-1 signalling pathway (27). The same markers were activated after GTN infusion in the present study (Figure 10). Expression of p-ERK as well as p-CREB and ATF-1 were all increased in TNC neurons 30 min after GTN-infusion. Given an expected time lag for protein translation, this finding connects well with our previous study where c-fos protein was upregulated at 2 h after GTN infusion (3). The immediate activation of signalling pathways in our study correlates well with the immediate headache observed in migraineurs after GTN infusion.
Possible downstream mechanisms of GTN-induced neuronal activation in the trigeminal vascular system: NO released from GTN may directly act on peripheral afferents resulting in the early phase activation of p-ERK. NO freely diffuses through the blood–brain barrier and hence can also have a direct effect in TNC causing activation of Fos protein via the p-ERK/p-CREB/ATF-1 pathway. Activation of TG at 2 h clearly shows a secondary effect of NO probably as a result of peripheral nociceptor activation. Both peripheral and central activation may result in long-lasting changes in the central nervous system, subsequently causing c-Fos activation at a later time point, possibly via the p-ERK/Elk-1 pathway.
According to our previous findings, c-fos expression was also increased in TNC 4 h after GTN infusion. Interestingly, we observed that p-ERK and Cam KII were activated at 2 h, though we did not find p-CREB activation at later time points, which is required for c-Fos activation observed at 4 h. However, a recent finding has revealed that endogenous NO and ERK are involved in the phosphorylation of Elk-1 which mediates transcription of SRE containing genes like c-fos (28–30). The early ERK/Fos activation may thus be via CREB phosphorylation whereas the late ERK/Cam KII- Fos activation may be a result of Elk-1 phosphorylation (Figure 10). This raises the interesting possibility that direct and secondary effects of NO via p-ERK may activate two different signalling mechanisms both leading to the expression of c-fos.
The trigeminal system versus the spinal system
Sensory neurons of the TG and DRG convey somatosensory information to the brainstem and spinal cord, respectively. TG represents a cranial analogue of the DRG and while TG sensory afferents demonstrate a similar membrane electrical signature as that of DRG (31), the sensory neurons of the two systems constitute a heterogeneous population in terms of transduction properties. GTN infusion in our model activated only the neurons in TG as indicated by p-ERK expression while no activation was observed in thoracic DRG neurons in the same group of animals at similar time points. One possible explanation could be the dissimilar sensitivity of the structures innervated by the TG and DRG. Unlike DRG, TG innervates a set of highly sensitive tissues in the orofacial regions (32), including the innervation of the intra cranial structures (33,34). Primary afferents in the dura mater may be more sensitive to NO or GTN than primary afferents in, for example, skin. Painful stimulation to the skin was required for phosphorylation of somatic ERK in DRG sensory neurons (23).
GTN infusion in our model increased the expression of p-ERK, p-CREB and c-fos in the neurons of TNC. Despite the diffusible nature of GTN, the neurons in the spinal cord dorsal horn of thoracic segments did not show any increase in the abovementioned pain markers. Our study is supported by the findings of Pardutz et al., where GTN-induced nNOS upregulation only in TNC and not in the dorsal horn of thoracic segments (35). The regional distribution of NO-targets is similar throughout the spinal cord segments and is activated in response to formalin injection (36,37) ruling out the possibility of non-functional NO receptors for initiating the signalling mechanisms in lower regions of the spinal cord. These findings suggest that a direct action of NO in second order neurons is unlikely. It also raises an interesting possibility that NO-induced activation of the TVS originates at the peripheral site because if NO acted centrally then molecular changes similar to TNC must be seen in thoracic spinal segments.
Key findings
Our data suggest that direct effects of NO may activate the p-ERK/p-CREB pathway with long lasting effects in the TNC. These activations were selective to the trigemino vascular system as compared to the spinal level. We conclude that difference in pain signalling mechanisms may exist between the trigeminal and spinal systems.
Footnotes
Declaration of conflicting interests
The authors declared no potential conflicts of interest with respect to the research, authorship, and/or publication of this article.
Funding
The authors disclosed receipt of the following financial support for the research, authorship, and/or publication of this article: This work was supported by Lundbeck foundation, Candys foundation and the European Union’s Seventh Framework programme (EUROHEADPAIN) under grant agreement no. 602633.