
Abstract
Background
Cortical spreading depression (CSD) related diseases such as migraine, cerebrovascular diseases, and epilepsy have been associated with reactive astrocytosis, yet the mechanisms of these tissue changes remain unclear. CSD-induced inflammatory response has been proposed to play a role in some neurological disorders and thus may also contribute to reactive astrocytosis.
Methods
Using ex vivo brain slices and in vitro astrocytic cultures, we aimed to characterize CSD related changes in astrocytes and markers of inflammation by immunocyto- and immunohistochemistry. CSD was induced by application of KCl (3 mol/l) on neocortical tissues. The application of KCl was repeated weekly over the course of four weeks.
Results
CSD induced an increase in the mean number and volume of astrocytes in rat brain tissue when compared to controls, whereas no changes in neuronal numbers and volumes were seen. These cell-type specific changes, suggestive of reactive astrocytosis, were paralleled by an increased expression of protein markers indicative of astrocytes and neuroinflammation in ex vivo brain slices of animals undergoing CSD when compared to sham-treated controls. Cultured astrocytes showed an increased expression of the immune modulatory enzyme indoleamine 2,3-dioxygenase and an elevated expression of the pro-inflammatory markers, IL-6, IL-1β, and TNFα in addition to increased levels of toll like receptors (TLR3 and TLR4) and astrocytic markers after induction of CSD.
Conclusion
These findings indicate that CSD related reactive astrocytosis is linked to an upregulation of inflammatory markers. Targeting inflammation with already approved and available immunomodulatory treatments may thus represent a strategy to combat or ameliorate CSD-related disease.
Introduction
Cortical spreading depression (CSD), a ubiquitous neurophysiological and neuropathological phenomenon, is a propagating wave of profound depolarization in cerebral gray matter (1). This depolarization affects both neurons and glia and has been implicated in many diseases, such as subarachnoid hemorrhage, stroke, and intracranial hemorrhage (2–4). In addition, CSD data from animal models and functional neuroimaging in humans support the notion that CSD is the pathophysiological basis for the migraine aura (5–7). CSD has also been found to contribute to epilepsy and epileptogenesis (3,8). The high amplitude negative DC shift accompanying CSD leads to a reduction of bioelectrical activity and transient failure of ion homeostasis and subsequent demand to restore this, resulting in increased energy metabolism and changes in cerebral blood flow (9).
One common feature of diseases associated with CSD is the presence of inflammation, and indeed inflammatory changes are observed both in pathologies associated with tissue damage, such as stroke (10), but also in paroxysmal disorders of the brain, i.e. epilepsy and migraine (11). Interestingly, CSD caused parenchymal inflammatory response via neuronal Pannexin1 megachannel opening as well as caspase-1 activation followed by high-mobility group box 1 release from neurons and nuclear factor κB activation in astrocytes (12). Furthermore, it has been shown that CSD induction may lead to subsequent meningeal inflammation, which is associated with activation of macrophages and mast cells and a rise in cytokine levels (13,14).
We have previously shown that CSD modulates the adaptive immunity response and have identified TLR3 as critical in this pathway, which can be targeted to protect neuronal injury from CSD (15). TLR3 expression can be found in the brain where astrocytes primarily express TLR2 and TLR3 (16). Interestingly, astrocytic TLR3 has been implicated in protective mechanisms against brain ischemia (17), highlighting the importance of astrocytes in brain inflammatory responses. It has been suggested that astrocyte dysfunction modulates the threshold for CSD initiation (18). CSD induces reactive astrocytosis (19,20), which may promote inflammation in the brain via production of inflammatory mediators such as cytokines, chemokines, and reactive oxygen intermediates (21). Despite this, very little is known about the inflammatory phenotype of astrocytic changes following CSD. We thus aimed to characterize CSD-induced inflammatory changes in astrocytes in ex vivo brain slices and in cultured astrocyte.
Materials and methods
Animals
Thirty-eight male Wistar rats (25–35 days old; 60–90 g) were maintained under controlled conditions (12:12 h light–dark cycle; 20–22℃, access to food and water ad libitum). The animal experiments were conducted in accordance with the Guide for the Care and Use of Laboratory Animals and approved by the Ethics Committee of Shefa Neuroscience Research Center, Tehran, Iran.
Surgical procedure
Animals were anesthetized by intraperitoneal (i.p.) injection of 3.5 % chloral hydrate. The head of the animal was placed in a stereotaxic frame. In addition, 0.5% lidocaine was locally applied on soft tissues of the skull at the incision site as well as at contact points. Additional supplemental doses of lidocaine and chloral hydrate were administered when necessary. Subsequently, the scalp was incised and burr holes were created by drill at different distances from the bregma. Animals were implanted with a guide cannula that was placed in the skull at the following coordinates: Anterior–posterior, +1.8 mm anterior to the bregma: Medial–lateral, −3.1 mm lateral to sagittal suture; and dorsal–ventral, 0.7 mm down from the skull surface. The dura was carefully removed and two silver electrodes were implanted over the somatosensory cortex and a reference electrode was placed on the nasal bulb and fixed with dental cement. Animals were returned to their cages and kept for one week in ventilated boxes in an air-conditioned room to recover from surgery.
CSD induction and electrocorticographic (ECoG) recordings
After recovery, animals were anesthetized via i.p. injection of chloral hydrate and local application of lidocaine, the stylet was withdrawn from the guide cannula and a microneedle was inserted into the cannula. Using a 10 μl Hamilton syringe connected to the injection microneedle by a polyethylene tube (Harvard Apparatus, USA), KCl solution (3 mol/l) was injected in a total volume of 10 µl within 1 min (CSD group; N = 16). The injection needle was retained in the guide cannula for an additional 1 min after injection to facilitate diffusion of the injected volume. In the sham treatment group, animals received saline (10 µl) following the same injection procedure (sham group; N = 16). Four KCl or saline-injections were carried out (with an interval of 1 week). ECoG was recorded in anesthetized rat for 60 min after each injection.
To evaluate the effect of inhibition of CSD-induced inflammation on astrocytes (15), Poly I:C (0.3 mg/kg per i.p. injection, N = 6; InvivoGen, USA) was administered 6 h after the third and fourth KCl injections. Histological studies were carried out on the brain of rats treated with poly I:C.
Histological studies
After induction of the fourth CSD, rats were perfused transcardially with 200 ml of saline followed by 600 ml of a solution containing 4% paraformaldehyde (PFA). After perfusion, all rats were decapitated and the brains were removed. The whole brains were kept in 4% PFA for at least 1 week and were then processed for histological studies. Both the hemisphere that was injected with KCl and the contralateral hemisphere were cut into coronal uniform random sections (4 μm thick). Ten consecutive brain slices were selected by causal systemic sampling from each animal and stained with toluidine blue. Stained brain sections were imaged with a light microscope (BX51, Olympus, Japan) linked to a digital camera. The first section of each pair was designated as the reference, and the second one was used for comparison. On each pair of sections, at least ten microscopic fields were selected for quantitative analyses by uniform systematic random sampling in the entorhinal cortex (EC), the somatosensory cortex, and the amygdala (22).
Cell volume
Average volume of all neurons and astrocytes was calculated by the point sampled intercept method on 10 uniform systematically and randomly sampled microscopic fields of the EC. A lattice of test points on lines was superimposed randomly onto each slide and then the volume of the neurons and astrocytes were measured based on isotropic lines from causally selected directions centered on this neuron and astrocyte. The mean was multiplied by π/3, and all intercepts were averaged to give an estimate of the volume-weighted mean volume of the neurons or astrocytes (23).
Immunohistochemistry of brain slices
After deparaffinization and hydration, the sections were boiled in 10 mmol/l sodium citrate buffer (pH = 6.0) for 10 min at 95℃ for antigen retrieval, and cooled. Then, the sections were incubated with bovine serum albumin in PBS (pH = 7.4) for 1h at room temperature. The sections were incubated overnight at 4℃ in the presence of rabbit monoclonal antibody directed against GFAP (Abcam, Cambridge, UK; 1:350), mouse monoclonal antibody against N-myc downregulated gene 2 (NDRG2, Abcam; 1:50), mouse monoclonal antibody against vimentin (Abcam; 1:400), mouse monoclonal antibody against S100B (Abcam; 1:400), rabbit polyclonal antibody against indoleamine 2,3-dioxygenase (IDO; Santa Cruz, Germany; 1:400), rabbit polyclonal anti-rat TLR4 primary antibody (Santa Cruz; 1:200), mouse polyclonal anti-rat TLR3 primary antibody (Santa Cruz; 1:50), rabbit monoclonal antibody against Tumor necrosis factor-alpha (TNF-α; Abcam; 1:400), rabbit polyclonal antibody against IL-6 (Santa Cruz; 1:350), and rabbit polyclonal antibody against IL-1β (Abcam, UK; 1:400). After three 5-min washings, the sections were incubated with the secondary goat anti-rabbit IgG-FITC and goat anti–mouse IgG H&L (FITC) conjugated antibodies (RNASEN; Abcam; 1:700) for 1 h at room temperature. The fluorescent sections were visualized and photographed with an inverted microscope (BX71, Olympus) equipped with FITC-fluorescence filters. In negative control experiments, which included omission of the primary antibody, no immunofluorescent cells were observed. The mean percentage of fluorescently labeled cells of the total cells was measured by Image J software. Furthermore, un-biased frame and physical dissector counting rules were applied for evaluating the number of positive cells calculated as percentages for each field of a given section. Images were taken using a 40× objective lens (Olympus, Japan). Consequently, digital photographs were acquired by 40× lens, and sections were assessed. For analyzing the intensity of immunoreactivity, measurements were made by obtaining relative optical density. Three sections of each animal were randomly taken for immunohistochemical evaluations (24).
Primary astrocyte culture
Primary astrocyte cultures from the brains of sham and CSD-treated rats were prepared as described by Souza et al. (25). Briefly, the brain was removed under deep anesthesia and the EC both ipsilateral and contralateral to the site of KCl application was dissected. Dissected tissue was kept in Hank's balanced salt solution (HBSS) containing 1% of penicillin/streptomycin and then incubated with Trypsin for 15 min at 37℃. After incubation, tissue was mechanically dissociated for 15 min using a Pasteur pipette and centrifuged at 400 g for 5 min. The supernatant was removed and the pellet was resuspended in HBSS solution comprising 40 U papain/ml, 0.02% cysteine, and 0.003% DNAse. The tissue was mechanically dissociated again with a Pasteur pipette and was centrifuged in 400 g for 5 min. Then, the pellet was again suspended in HBSS solution containing only DNAse (0.003%), shaken for 20 min and then centrifuged at 400 g for 7 min. The cells were again suspended in DMEM/F12 (Gibco, Germany) medium with L-glutamine, supplemented with 15% fetal bovine serum (Gibco, Germany), and 1% antibiotic mixture comprising penicillin-streptomycin. The cells were seeded in 6-plates pre-coated with poly-L-lysine. The cells were then incubated at 37℃ in a 5% CO2 air-humidified incubator. Twenty–four hours after plating the cells in culture dishes, the medium was changed. Subsequently, the medium was changed three times a week. In addition, L-leucine-methyl-ester-hydrochloride (LME, Sigma, Germany; 0.1 mmol/l) was added in the culture medium, and cultures were shaken by hand twice weekly to remove microglia. LME, a lysosomotrophic agent, was used to selectively destroy mononuclear cells including microglia, to prepare highly purified cultures of astrocytes with minimal contamination (26). Positive cells were counted with image J software.
Immunocytochemistry of cell cultures
Immunocytochemistry assays of cell culture were done according to standard protocols (27). In brief, purified cultures of astrocytes were trypsinized and plated on glass coverslips in 24-well plates. The cells were fixed with 4% paraformaldehyde in PBS for 20 minutes at room temperature, and then incubated for 5 min in permeabilizing solution (PBS containing 0.3% Triton X100). Afterwards, cells were washed with PBS, incubated for 5 min and blocked for 30 minutes with PBS (1:10). Cells were then incubated overnight at 4℃ with several primary antibodies. In addition to antibodies used in immunohistochemical studies of brain slices, cells were incubated with rabbit polyclonal antibody directed against microtubule-associated protein (MAP2, Abcam; 1:1000) and CD11b (Santa Cruz, Germany) for evaluation of the presences of neurons and microglia cells in the cell culture. After washing with PBS, slides were exposed to goat anti-rabbit IgG FITC conjugated and goat anti–mouse IgG H&L FITC conjugated antibodies (1:1000) for 1 h at room temperature. Nuclei were counterstained with propidium-iodide. The samples were visualized using a fluorescence microscope. For analyzing the intensity of immunoreactivity, measurements were made by obtaining relative optical densities. Background values were evaluated in unlabeled areas.
Western blotting
The cortical tissue and cultured astrocytes were lysed using ProteoJET™ mammalian cell lysis reagent (Fermentas, Burlington, Canada) comprising a complete protease inhibitor cocktail. Total protein extract was collected according to the manufacturer's instructions. The samples were stored at −80℃ until used for western blot analysis. The protein content of sample lysate was measured using Bradford's method. Lysates equivalent to 30 µg of protein were resolved on SDS-polyacrylamide gel electrophoresis and transferred to polyvinylidene fluoride (Chemicon millipore, Temecula, USA) membranes and probed with specific primary and secondary antibodies. For normalization, membranes were probed with beta actin antibody (Cell Signaling Technology, USA). Thereafter, blots were incubated with 2% Electro Chemi Luminescence (Amersham Bioscience, USA) advanced kit blocking reagent (Amersham Biosciences) for detecting immunoreactive polypeptides. Protein bands were visualized on radiograph film and were measured by Image.J software. Quantification of data was performed by densitometry, and the results analyzed as total integrated densitometric values (28).
Statistical analysis
Data are expressed as means ± SEM. Comparisons between multiple groups were performed using One-way analysis of variance (ANOVA) followed by Dunn's test, and the means of two independent samples were compared using a t-test. Significance was established when the p-value was less than 0.05.
Results
Induction of CSD
Application of KCl into the brain of rats caused negative DC fluctuations, which were followed by positive waves. The mean amplitude and duration of the first CSD-like wave was 9.8 ± 1.1 mV and 120 ± 16 s. The propagation velocity of CSD was 3.3 ± 0.1 mm/min (N = 16). The amplitude and duration as well as the speed of propagation of CSD events that were repeatedly induced in the following three weeks of experiments were not significantly different from the characteristic features of the first CSD waves.
The effect of CSD on cell volume
Alterations of the neuronal network in EC after CSD have been suggested to play a role in the neurological deficits seen in CSD-related disorders (29). The mean volume of neurons and astrocytes in the EC were calculated in toluidine blue stained slices of sham and CSD-treated groups. There were no significant differences in the mean volume or number of neurons between both groups (p > 0.05), whereas induction of CSD significantly increased the volume of astrocytes compared to the sham-treated group in EC ipsilateral to the hemisphere in which CSD was evoked (p < 0.001; Figure 1 (a), (b)). Moreover, the CSD group showed a significant increase in the number of astrocytes in EC compared to the sham group (p < 0.001; Figure 1 (a), (b)). These changes were widespread, and observed over the entire EC. There was no concentric or focal pattern of astrocyte change at the KCl injection site. The mean percentage and the volume of astrocytes after CSD were significantly higher in EC ipsilateral to the KCl injection site compared to contralateral EC (p < 0.001). Administration of poly I:C after the induction of CSD significantly reduced the mean volume of astrocytes compared to CSD group (Figure 1 (c) and (d); p ≤ 0.01). However, application of poly I:C did not reverse the increase of the mean number of astrocytes after CSD (Figure 1 (c), (d)).
The effect of cortical spreading depression (CSD) on neuronal and astrocytic volumes and astrocyte counts in ex vivo brain slices as well as the effect of poly I:C on CSD-induced astrocytosis in the entorhinal cortex (EC). (a) Toluidine blue stained coronal rodent brain sections (40× magnification) of animals subjected to CSD (right image) and control animals (left image). Arrows point to neurons, whereas arrowheads point to astrocytes. Note that the volume of astrocytes is larger in the CSD treated group, whereas neuronal volumes are similar in both groups. (b) Bar charts summarizing the mean volume weighted mean volume of neurons and astrocytes in the entorhinal cortex of sham and CSD treated rats (left) and bar charts showing the mean percentages of astrocytes in EC of sham and CSD treated rats. (c) Toluidine blue stained coronal rat brain sections (100× magnification) of control animals (left image), rats subjected to CSD (middle image), and animals that received poly I:C (right image) 6 h after the third and fourth KCl injections. (d) Bar charts summarizing the mean volume weighted mean volume of astrocytes as well as the mean percentages of astrocytes in EC of sham, CSD treated, and poly I:C treated rats. Bars and whiskers in B and C indicate mean ± SEM.
Furthermore, the effect of CSD on astrocytes in the somatosensory cortex and the amygdala was evaluated. The mean volume and the percentage of astrocytes were significantly higher in the somatosensory cortex of CSD-treated rats compared to the control group (p < 0.001 and p < 0.01, respectively; Figure 2 (a), (b)). The mean volume as well as the mean number of astrocytes did not differ between the CSD and control groups in the amygdala (Figure 2 (c), (d)).
The effect of cortical spreading depression (CSD) on astrocytic volumes and astrocyte counts in the somatosensory cortex and the amygdala ex vivo brain slices. (a) and (c) Toluidine blue stained coronal rodent brain sections (40× magnification) of animals subjected to CSD (right image) and control animals (left image) in the somatosensory cortex and the amygdala. Arrowheads point to astrocytes. (b) and (d) Bar charts summarizing the mean volume weighted mean volume of astrocytes as well as the mean percentages of astrocytes in the somatosensory cortex and the amygdala of sham and CSD treated rats. Bars and whiskers in (b) and (c) indicate mean ± SEM.
CSD increased expression of astrocytic and pro-inflammatory protein markers in brain slices
Immunohistochemical methods have been used to determine the distribution of astrocytes using different specific cellular markers. Induction of CSD significantly increased the expression of GFAP (p < 0.01), NDRG2 (p < 0.05; a protein located in the cytosol of astrocytes (30)), vimentin (p < 0.001; an intermediate filament of the cytoskeleton expressed in astrocytes (31)), and S100B (p < 0.001; a calcium-binding protein expressed primarily by astrocytes (32)) in the EC compared to the sham-treated group (Figure 3 (a), (b)). Furthermore, there was a significant increase in the immunoreactivity of IDO, TNF-α, IL-6, and IL-1β after repetitive CSD compared to the sham-treated animals (p < 0.001), indicating a significant elevation of inflammatory responses in the EC. We also found higher TLR3 (p < 0.01) as well as TLR4 (p < 0.001) expression in CSD-treated animals compared to controls (Figure 3 (a), (b)).
CSD increases the expression of astrocytic and inflammatory markers in ex-vivo brain slices. (a) Immunohistochemistry staining of entorhinal cortex slices of sham and CSD-treated rats, demonstrating lower expression of astrocytic markers (GFAP, NDRG2, vimentin, S100B, IDO) in sham treated animals compared to animals subjected to CSD. Nuclei are stained with propidium iodide (red), whereas astrocytic proteins are stained in green (upper figure panel). Immunohistochemistry staining of the entorhinal cortex slices of sham and CSD-treated rats demonstrating lower expression of inflammation markers (TLR4, TLR3, TNF-α, IL-6 and IL-1β) in sham-treated animals compared to animals subjected to CSD. Nuclei are stained with propidium iodide (red), whereas inflammatory markers are stained in green (lower figure panel). (b) Bar charts summarizing (mean ± SEM) numbers of cells that express the respective protein (GFAP, NDRG2, vimentin, S100, IDO, TLR4, TLR3, TNF-α, IL-6 and IL-1β). Note that both astrocytic protein markers and inflammatory markers are increased in slices obtained from rats that were subjected to CSD compared to controls.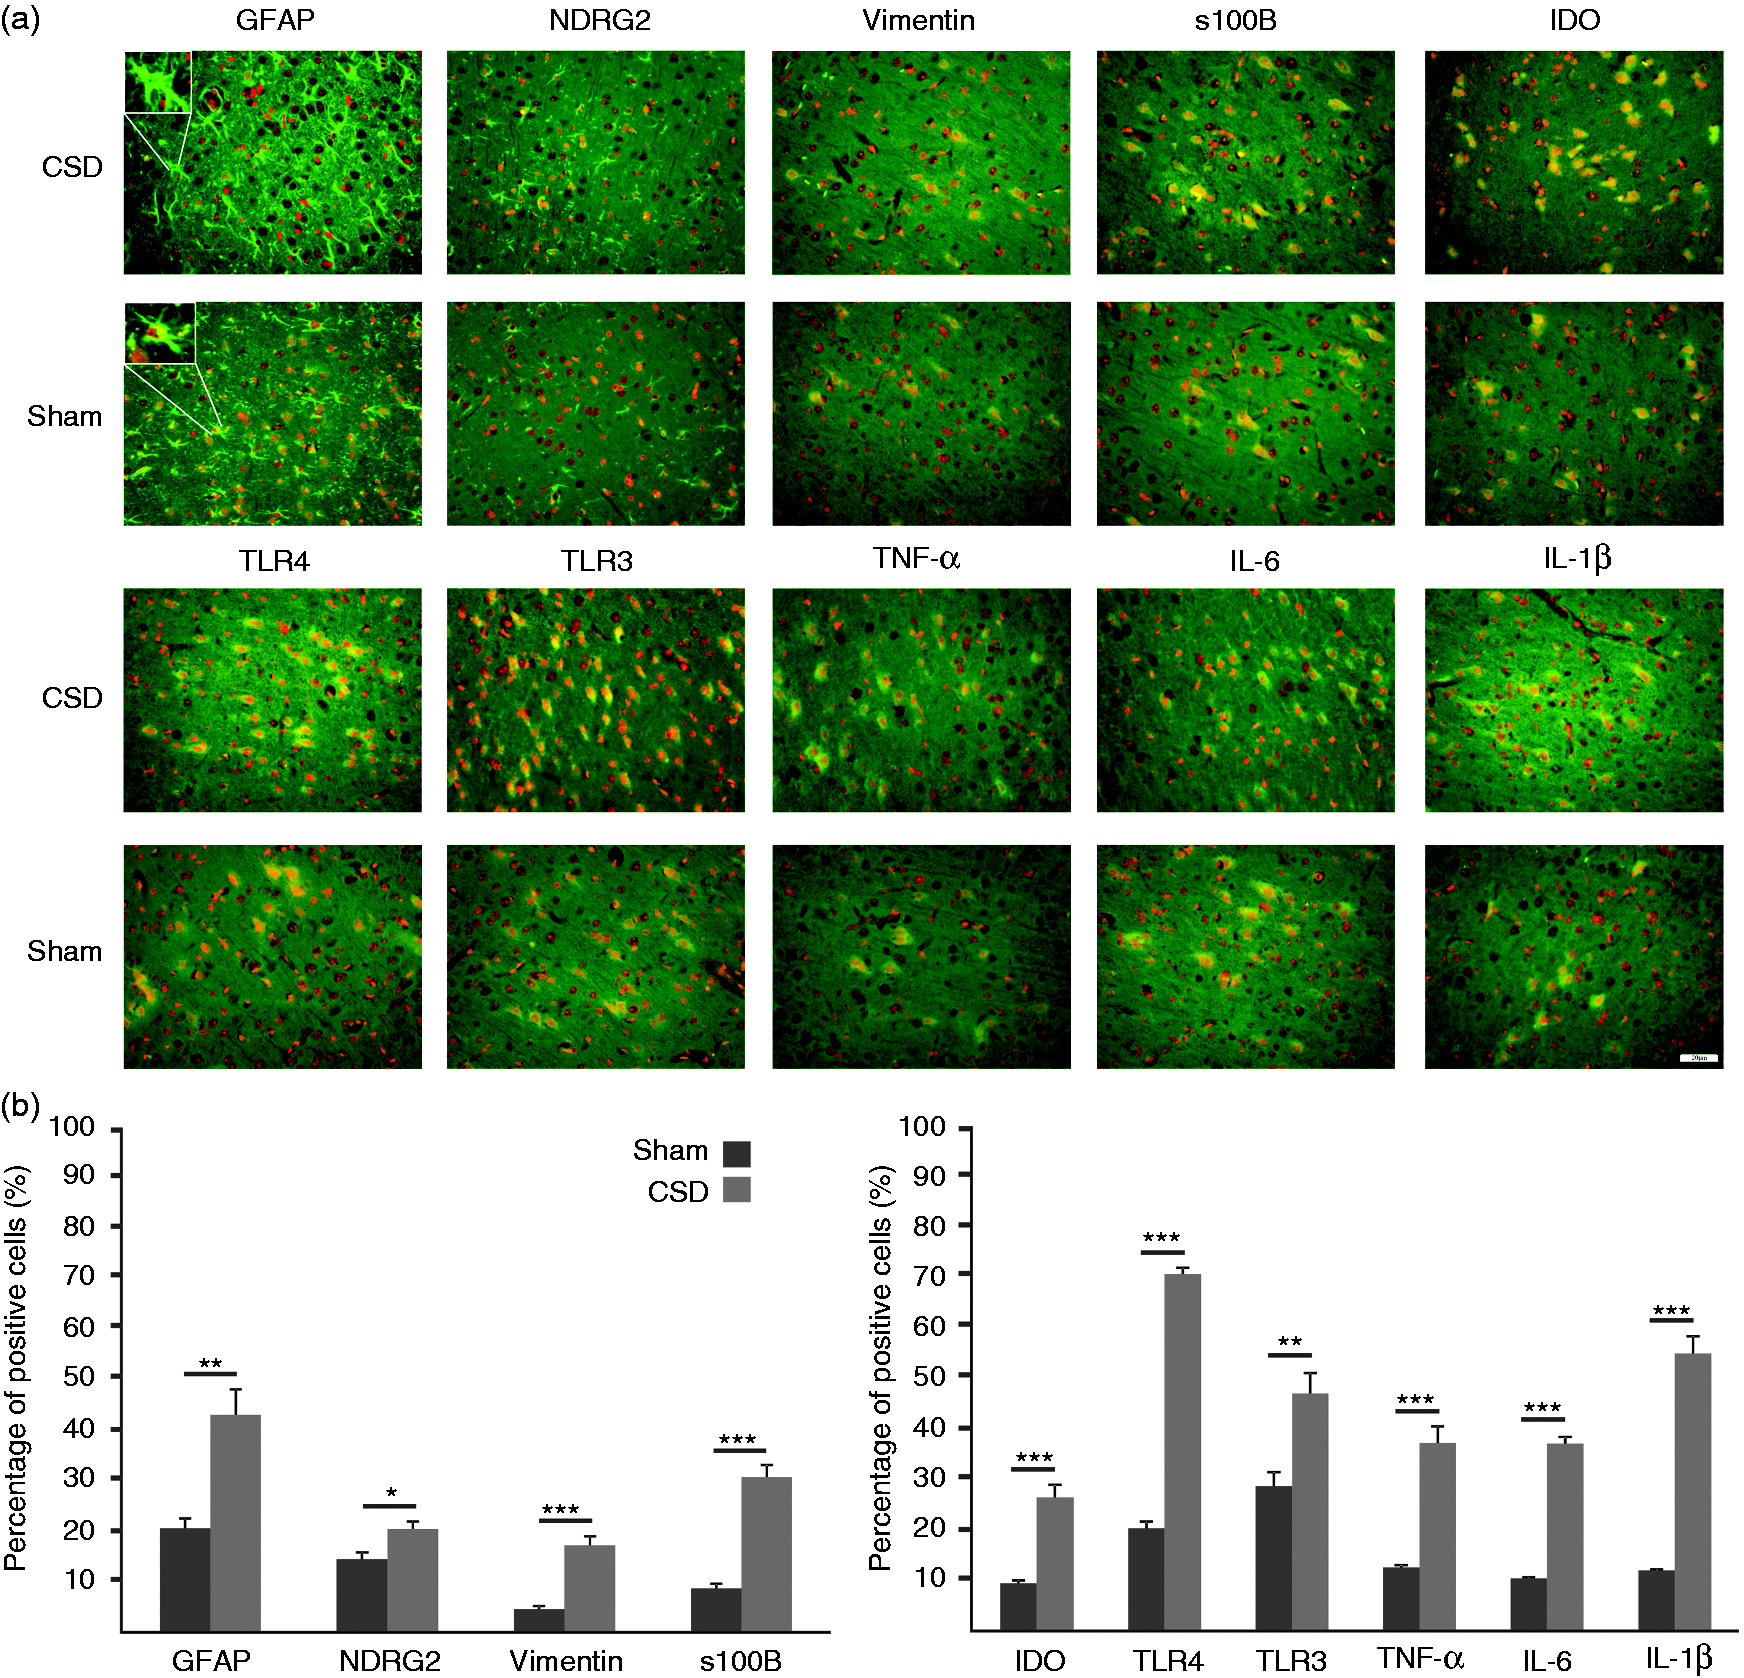
Immunoblotting demonstrated strong GFAP expression in the neocortex of CSD rats. The amount of GFAP protein was 1.41-fold higher in the CSD group compared to the control group. NDRG2 (1.13-fold; p < 0.05), vimentin (1.12-fold; p < 0.01), and S100B (1.45-fold; p < 0.001) levels were also significantly higher in the CSD group compared to sham-treated rats (Figure 4 (a)). We next examined the expression of pro-inflammatory proteins after induction of CSD. Our findings revealed that the level of IL-6 and IL-1β increased by 1.93 and 1.49 fold, respectively (CSD vs. sham). In addition IDO (2.65-fold), TLR4 (1.52-fold), and TLR3 (3.1-fold) expression was significantly higher in CSD-treated rats compared to the sham group (all p < 0.001; Figure 4 (b)).
CSD increases protein markers the indicative of astrocytes and inflammatory levels responses in ex-vivo brain slices. (a) Examples of western blot analysis (upper panel) and bar charts (mean ± SEM) quantifying the Western blot signal as protein/beta actin ratio (lower panel) of GFAP, NDRG2, vimentin, and S100B. (b) Protein expression of IDO, TLR4, TLR3, TNF-α, IL-6, and IL-1β in the rat cortex tissues in animals subjected to CSD and controls.
Characterization of primary cultured astrocytes
To characterize astrocytes in culture, immunocytochemical assays and immunoblotting were used to evaluate the expression of glia cell markers in cultures of adult astrocytes. Astrocytes showed an intense cytoplasmic immunolabeling of the cytoskeletal protein GFAP (∼95%), confirming the astrocytic phenotype and the purity of the cultured cells (Figure 5 (a), (b)). In addition, vimentin, S100B, and NDRG2 were also highly expressed in these cells (Figure 5 (a), (b)). MAP2, a neuron marker, was expressed in less than 5% of the cells, again indicating a high purity of astrocytes in these cultures (Figure 5 (c)). CD11b, the β-integrin marker of microglia cells, was not expressed in the cell cultures at detectable levels (Figure 5 (c)).
CSD increases the expression of astrocytic markers in cultured astrocytes. (a) Expression of GFAP, NDRG2, vimentin and S100B, as determined with immunocytochemistry. Green indicates the respective protein staining, whereas red indicates propidium iodide staining. Scale bars: 50 μm. (b) Bar charts summarizing (mean ± SEM) fluorescence intensity. (c) Cultured astrocytes show a high grade of purity and little contamination by neurons or microglia. Immunostaining of astrocyte cultures for the neuronal marker MAP2 and the microglial marker CD11b. Nuclei were counterstained with propidium iodide (red). Note that only a few green cells (neurons) are visible, and that there are no microglial cells detectable. Scale bar: 20 μm.
Using immunocytochemical assays, our data demonstrated that the mean fluorescent intensity of GFAP, vimentin, and S100B expression in astrocytes isolated from CSD-treated rats was significantly stronger than those in astrocytes obtained from the sham-treated rats (p < 0.001). The mean fluorescent intensity of NDRG2 did not show any significant differences between groups (Figure 5 (b)).
Ten days after culture, the cells were lysed and the total protein extract was subjected to western blot analysis. Immunoblotting demonstrated strong GFAP expression in astrocyte cultures (p < 0.001). GFAP protein level was 1.3-fold higher in the CSD group compared to controls. The NDRG2 level in the CSD group was 1.1-fold higher than in the sham-treated group (p < 0.05). The analysis showed that the expression of vimentin and S100B were also elevated by 1.9 and 1.5 fold in astrocytes isolated from CSD-treated animals, respectively, compared to controls (p < 0. 001, Figure 6 (a)).
CSD increases the level of protein markers indicative of astrocytes and inflammatory markers in cultured astrocytes. (a) Representative Western blots showing GFAP, NDRG2, vimentin, and S100B levels. (b) Representative Western blots showing IDO, TLR4, TLR3, TNF-α, IL-6 and IL-1β levels. Quantification of protein levels measured by Western blot as protein/actin ratio (lower panel). Bars indicate the mean ± SEM.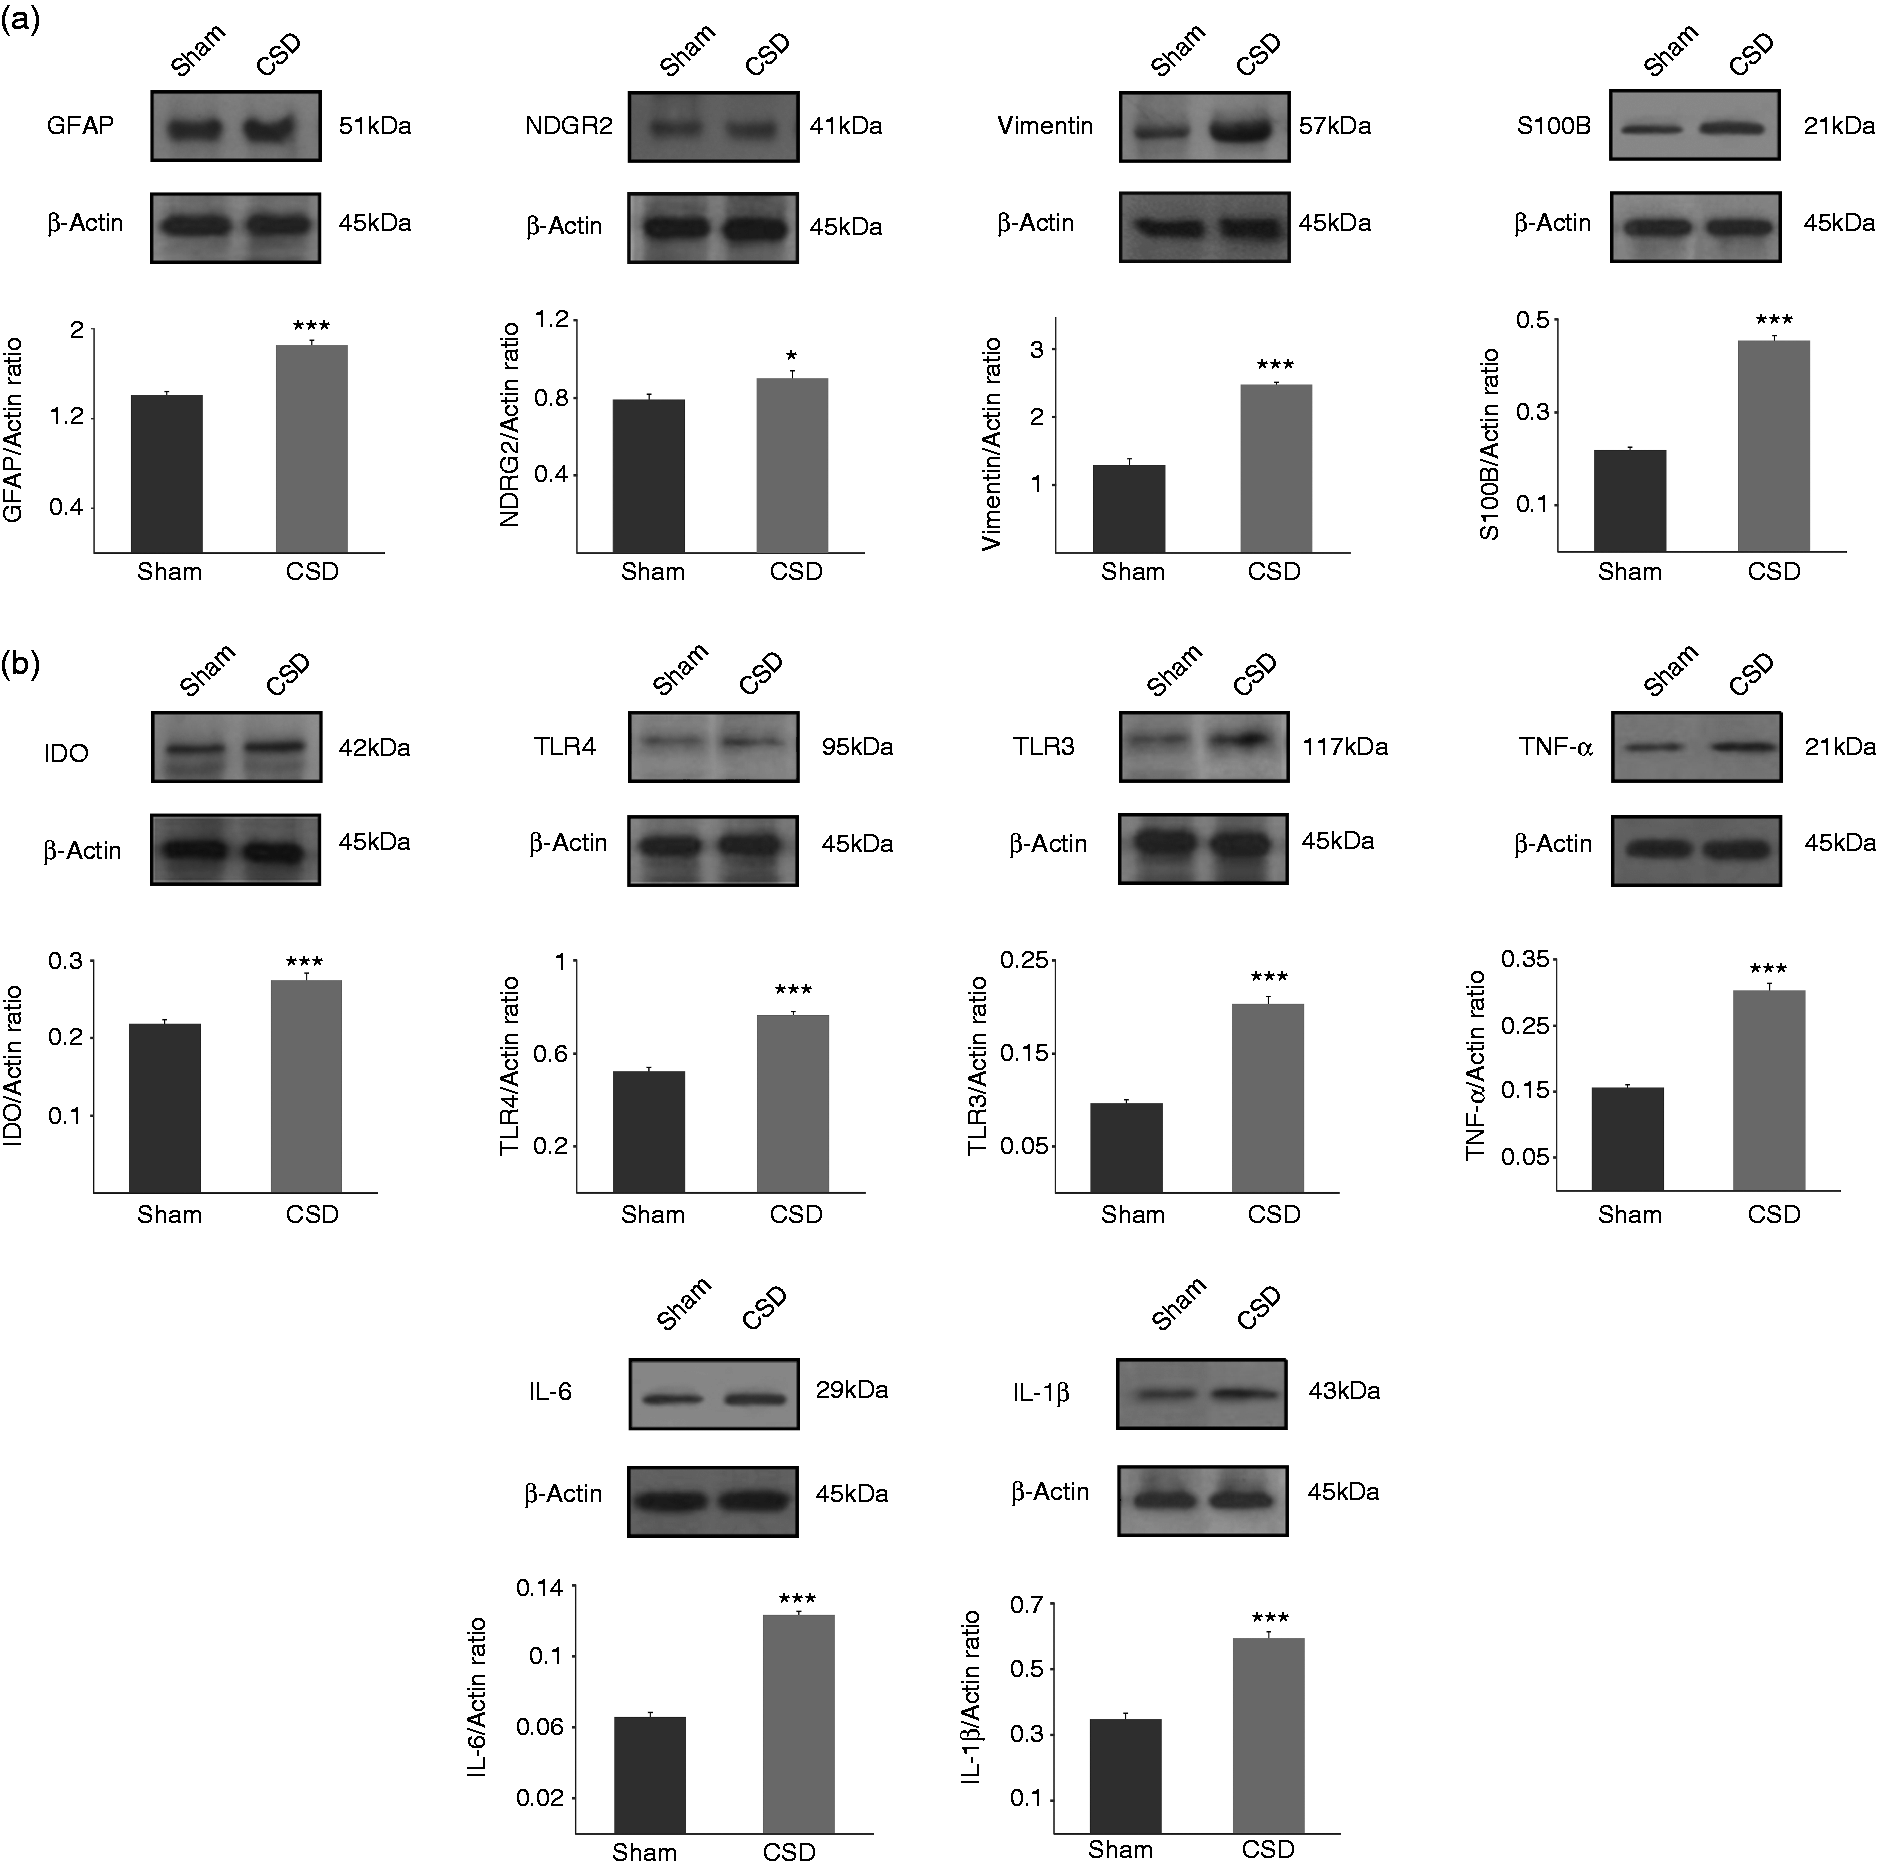
CSD increased inflammatory factors in cultured astrocytes
To examine whether CSD would affect expression of pro-inflammatory proteins in astrocytes, we measured IDO, TLR4, TLR3, TNF-α, IL-6, and IL-1β levels by immunocytochemistry in cultured astrocytes. A significantly higher expression of IDO, TLR4, TLR3, TNF-α, IL-6, and IL-1β was detected in astrocytes isolated from CSD-treated animals compared to astrocytes obtained from control rats (all p < 0.001 except for TNF-α, p < 0.01; Figure 7 (a), (b)).
CSD increases the expression of inflammatory markers in cultured astrocytes. (a) Representative images of IDO, TLR4, TLR3, TNF-α, IL-6, and IL-1β immunocytochemistry (green fluorescence) in astrocytic cultures after induction of CSD (upper row) and in control cultures (lower row). Nuclei are stained with propidium iodide. (b) Bar charts summarizing the mean fluorescence intensity of inflammatory markers in astrocytic cultures of CSD and in control groups. Each value indicates the mean ± SEM.
Furthermore, total protein was extracted from the astrocyte cultures and analyzed by Western blot analysis. The mean total amounts of all the above-mentioned pro-inflammatory cytokines in cultured astrocytes were significantly higher in cells obtained from the CSD group compared to astrocytes isolated from the control group. The analysis showed that the levels of IL-6 (1.87-fold), and IL-1β (1.7-fold) were significantly higher in CSD derived astrocytes compared to astrocytes from control animals (p < 0.001). Moreover, the levels of IDO (1.25-fold), TLR4 (1.46-fold), and TLR3 (2.11-fold) in CSD-isolated astrocytes were significantly higher compared to astrocytes from sham-treated rats (p < 0.001, Figure 6 (b)).
Discussion
We show here that CSD increases the number and volume of astrocytes as well as the expression of marker proteins of astrocytes and inflammation in brain slices ex vivo. CSD enhanced the expression of GFAP, vimentin, S100B, and NDRG2 in both ex vivo brain slices and astrocyte cultures. In addition, CSD increased the expression of the immune modulatory enzyme IDO and pro-inflammatory cytokines, such as IL-6, IL-1β, and TNFα, in addition to toll like receptors (TLR3 and TLR4) in cultured astrocytes. Using enzyme-linked immunosorbent assay-based techniques, our previous study also revealed that induction of CSD significantly increased the production of IFN-γ, TNF-α, TGF-β1, and GM-CSF in the brain and IFN-γ, TNF-α, IL-4, and TGF-β1 in the spleen of rats (15).
In agreement with our results, previous studies have found an increase in GFAP staining after CSD in vivo, indicating reactive astrocytosis (19,20). Reactive astrocytosis is characterized by hypertrophy of astrocyte processes and overexpression of intermediate filaments such as GFAP and vimentin (32). The increase in astrocytic volume in our study supports the notion that CSD induces reactive astrocytosis. We hypothesized that these morphological and quantitative changes in astrocytes are accompanied by the upregulation of inflammatory markers, since reactive astrocytosis may be triggered by inflammatory changes, as has been shown before (33). We found an increase in pro-inflammatory protein markers in astrocytes in in vivo brain slices and in in vitro astrocyte cultures. An increase of the proinflammatory cytokines TNF-α and IL-1β as measured by mRNA levels was observed in the rodent cortex after CSD induction by application of swabs soaked with KCl (3 mol/l) on the cortical surface (35). This study, however, did not investigate cell type specific cytokine expression except for the expression of IL-1β, which was localized on ramified microglia in cortical layers I-III. Using microsphere-based flow cytometric immunoassays in hippocampal organotypic cultures subjected to spreading depression, an upregulation of IL-1α,-1β,-2,-4,-6, and-10 as well as IFN-γ and TNF-α was reported (36). Immunostaining revealed that IL-1α, IL-1β, and IFN-γ upregulation was attributable to microglia, although the authors did not study other cell types specifically. Using immunohistochemistry and immunocytochemistry, we show here for the first time that CSD induces expression of pro-inflammatory proteins in astrocytes.
Our results indicate enhancement of TLR3 and TLR4 expression in astrocyte by CSD. It has been suggested that TLR3 and TLR4, expressed in murine cultured astrocytes, might play a crucial role in astrocyte reaction following neuroinflammatory processes in the brain (37). Upon activation by specific ligands, TLR4 signaling is initiated by myeloid differentiation factor 88 (MyD88), which activates transcription factors NF-κB and AP-1 and leads to the generation of pro-inflammatory cytokines, such as IL-6 and TNF-α. Both TLR3 and TLR4 signals through the TIR-domain-containing adapter-inducing interferon-β (TRIF) activate transcription factors IRF3 and IRF7 and generate anti-inflammatory molecules such as IFN-β and IL-10 (38). Neuroinflammatory processes result in enlargement of astrocyte cell bodies as well as enhancement of the expression levels of MyD88, TRIF, and TLR4 in cultured astrocytes, and inhibition of TLR4 and its downstream signaling pathway leads to reduction of inflammation (39). Therefore, it seems that astrocytic TLR receptors might be involved in mechanisms of neuroinflammation following CSD-related disorders, and modulation of astrocyte-associated inflammation may offer a potential approach for treatment of these diseases. Indeed, it has been shown that TLR3 modulation inhibited CSD-induced neuroinflammation in the brain and spleen of rats (15).
Astrocytes play essential roles in the maintenance of ion and neurotransmitter homeostasis (40). Reactive astrocytes undergo extensive functional alterations that change ion and neurotransmitter homeostasis, including impairment of glutamate and potassium clearance. Dysregulation of the astroglial glutamate transporters GLT-1 has been implicated in several neurological disorders (41). Neuroinflammation reduced the glutamate uptake activity via GLT-1 dysfunction in cultured astrocytes (42) and resulted in disturbed astrocyte potassium clearance (43). Both glutamate and potassium play crucial roles in CSD initiation and propagation (2). Reduced density of GLT-1a glutamate transporters in cortical perisynaptic astrocytic processes accompanied by impaired glutamate and potassium clearance has been suggested as an underlying mechanism for increased susceptibility to CSD in familial hemiplegic migraine type 2 knock-in mice (44).
Astrocyte reactivity is a hallmark of many neurological diseases (45–48). Our findings suggest that besides CSD itself, glial inflammation could be targeted to treat SD-related disorders. This finding is important, since effective anti-inflammatory treatment strategies are available in other neurological disorders, such as multiple sclerosis, which are already approved for clinical practice and thus might be used to treat CSD-related disease.
Article highlights
CSD-induced reactive astrocytosis was associated with an enhanced expression of protein markers indicative of astrocytes and neuroinflammation in ex vivo rat brain slices. Cultured astrocytes showed an increased expression of the immune modulatory enzyme IDO and an elevated expression of the pro-inflammatory markers, IL-6, IL-1β, and TNFα in addition to increased levels of toll like receptors and astrocytic markers after induction of CSD. CSD related reactive astrocytosis is connected to an upregulation of inflammatory mediators. Targeting inflammation with immunomodulatory treatments may thus represent a strategy to combat or ameliorate CSD-related disorders.
Footnotes
Declaration of conflicting interests
The authors declared no potential conflicts of interest with respect to the research, authorship, and/or publication of this article.
Funding
The authors disclosed receipt of the following financial support for the research, authorship, and/or publication of this article: The present study was supported by Iran National Science Foundation (INSF) to AG.