
Abstract
Aim
We present an electronic tool for collecting data on the patterns of migraine headache onset and progression.
Methods
A digitized map consisting of 44 color-coded segments was defined based on previous reports of migraine pain and the distribution of nerves in the face, head and neck. The map was overlaid on a schematic map of the face, head and neck nerves. Thirty-six patients (N = 36, 28 female/eight male), who met ICDH-II criteria for episodic migraine and had headaches for at least three years, identified all regions where pain typically started and how pain spread and subsequently progressed.
Results
Consistent with previous findings, throbbing was the most prevalent quality of migraine pain, always present in 70% of patients surveyed. For the 70% of the patients with throbbing pain, the temple was the onset site of throbbing pain, with no significant difference in the laterality of onset site (58.3% on the right vs. 55.6% on the left hemisphere). The tool was able to capture patterns of pain distribution for throbbing and pressure headache pain and also may be used to assess the change in the pattern of the pain distribution as the disease progresses.
Discussion
The pain map survey may be a useful tool for recording and tracking the temporal pattern of migraine onset both for clinical and research purposes. The tool could be used to create maps of pain locations on a large population scale and thus will be a very useful tool in correlating the temporal nature of headache symptoms with potential mechanisms of disease evolution.
Introduction
Migraine is a common neurological disorder, affecting 11.7% of the United States population (1,2). Migraine is defined by the International Headache Society (IHS) as a recurrent headache disorder with attacks lasting four to 72 hours with characteristics such as unilateral location, pulsating quality, moderate to severe intensity and aggravation by routine physical activity and association with nausea and/or photophobia and phonophobia (3).
Currently, the dominant hypothesis on migraine is that it is caused by the activation and sensitization of trigeminal nociceptors (4). As a result of trigeminovascular activation, headache pain manifests in different ways in patients in terms of pain location (i.e. where the pain is in the head and neck), its quality (e.g. throbbing) and its temporal variation. Qualitative characteristics of the headache pain that patients usually use to describe their headache pain include throbbing, constant pressure, dull, pulsating, pressing, pounding, constricting, squeezing, stabbing, vice-like, tightening and other types of pain. In a study of 1283 migraine patients, the prevalence of moderate to severe headache pain characteristic has been found to be 73.5% throbbing, 73.8% aching, 75.4% pressure, and 42.6% stabbing with significantly more throbbing in migraine (73.5%) than in probable migraine (63.2%) (5). Aching is less frequent in moderate to severe episodic migraine attacks (5).
Recent studies have indicated that sensory symptoms may relate to the calvarial bones (6) and that sensory fibers may innervate these bones. Pain fibers pass through the skull sutures (7). The observed innervation provides a basis for referred or sensed pain in the pain location in the head. The alternative is that pain sensation is a central phenomenon (e.g. thalamic) that is sensed in these areas. Localized allodynia (i.e. affecting the face and head) is an example of such a centralized process (8). In either case, the underlying processes may be more complex since many patients have pain that may differ in location and side of the head.
While the trigeminal system is well described in migraine pathophysiology, innervation of the dura from the upper cervical regions is also involved (9,10). Because of the nature of dural innervation and also the interaction of afferent inputs into the central nervous system, specificity of dural afferent inputs is probably not discriminative and we are unaware of any reports on the issue of dural “somatotopy” aside from differences in trigeminal and upper cervical afferents. These differences would confer differences in the distribution of pain sensation at a gross level (i.e. neck and posterior head vs. other regions of the head).
At an individual patient level, we are unaware of a systematic method to measure the location and pain characteristic present during a migraine episode. Recording and tracking such information could benefit pain management decisions and could especially be useful in tracking disease progression or evolution, such as modeling change over time (6). Here, we present an electronic tool to quantitatively capture the pattern of migraine pain onset and distribution as the headache progresses in localized areas of the head and neck: a tool for understanding migraine pain distribution and locating migraine pain and one that may detect future alterations in the pattern of migraine head pain symptoms.
Methods
Subjects
The McLean Hospital institutional review board (IRB) approved this study. Participation in the study was completely voluntarily. Individuals were informed about the study through ads that were placed in some headache clinics in the metropolitan Boston area or through a letter that was sent to those patients who had participated in previous research studies. We sent out letters to these patients informing them of the new study that we were conducting and provided them with our contact information in order for them to contact us if they were interested in participating.
All participants gave written informed consent prior to using this tool. A total of 36 episodic migraine patients participated in the study. Patients were selected according to the International Classification for Headache Disorders, second edition (ICHD-II) (11) definition for episodic migraine. Following an extensive screening process, an experienced neurologist (David Borsook) confirmed episodic migraine diagnosis in participants according to the ICHD-II (11) during a research physician consultation.
Inclusion/exclusion criteria
Inclusion: Male or female (except for pregnant or nursing), age 18–50, history of episodic migraine for at least three years, migraine frequency fewer than 14 attacks per month, no other significant medical history.
Exclusion: Any significant medical history (seizure disorder, diabetes, alcoholism, cardiac disease including coronary artery disease, psychiatric problems, drug addiction, significant alcohol history, respiratory problems, liver disease, etc.). History of dermatological hypersensitivity in the facial area, Beck Depression Inventory II (BDI-II) score >25 (moderate to severe depression).
Electronic data capture tool
Study data were collected and managed using Research Electronic Data Capture (REDCap) electronic data capture tools hosted at Harvard Medical School. REDCap is a secure, web-based application designed to enter and support data capture for research studies, providing: a) an intuitive interface for validated data, b) audit trails for tracking data manipulation and export procedures, c) automated export procedures for seamless data downloads to common statistical packages, and d) procedures for importing data from external sources (12). This tool can be used on a desktop computer or on a tablet, laptop or even a smartphone. As long as there is a web browser (Safari, Internet Explorer, Chrome, etc.) available, the tool could be used on any device without needing to install any software.
Headache map
A total of 44 segments were defined on a schematic map of the face, head and neck (Figure 1). A version of the schematic map was formerly presented by DaSilva and colleagues in 2002 (13) for use in mapping the trigeminal pathway, and subsequently by Becerra (2006) (14) and Scrivani (2010) (15) for trigeminal neuropathic pain. The current version of the map was created according to the distribution of the extra-cranial and facial nerves in accordance with the Gray’s anatomy of the human body atlas (Figure 784 in Gray (16)) and by incorporating segmentation maps from previous reports of migraine (13) and trigeminal (15) pain. The segments were all color coded, which was also accompanied by a legend that describes what each color and each segment represents. At the beginning of the session a researcher introduced the map, the color-code keys, and each of the brain regions that the segments represented to the patient. For instance, there were different segments defined for regions around the eye, and patients were instructed that the color yellow represents the area behind the eyes. Subsequently, patients were asked to identify all regions in which they typically experienced pain.
Color-coded map of 44 head, neck and face regions based on patient reports of migraine pain as well as the distribution of nerves in these areas.
Procedure
After signing the research consent form, the patient filled out the pain map survey on a desktop computer or an iPad in a separate room. The data were simultaneously saved to an online database. There was a researcher present in the room the entire time that each patient was completing the pain map survey in order to instruct the patients on how to use the tool, to monitor the data entry and to answer any questions. Patients completed the survey in the interictal period, based on recall of their most recent migraine onset and progression of pain. The whole session was about 20 minutes long.
Since throbbing pain and pressure pain are the most prevalent pain characteristics in migraineurs (5), in this study we focused on these two headache types although the tool can be customized to add modules for evaluating other pain characteristics as well. Participants were advised to identify the origin of pain at the headache onset as well as regions when the headache was full blown to capture the spreading of pain over the course of a migraine headache (Figure 2).
Spreading of pain over the course of a patient’s migraine headache. Spreading occurred over the course of two hours, starting at pain level 4/10 (light blue), remaining and spreading to 7/10 pain (yellow), and continuing to spread and increase in pain at 9/10 (red). After spreading for two hours, pain remained in the red regions for the remainder of the migraine headache, approximately three to five days.
Statistical methods
Data from the 36 migraineurs were de-identified and pooled. Percentages of migraineurs responding “yes” to questions on the survey were calculated. Data were examined graphically to determine that the data were not skewed and thereby mean was determined to be the appropriate summary statistical marker. Standard deviations were calculated for each mean.
Results
Demographic data of the study patients.
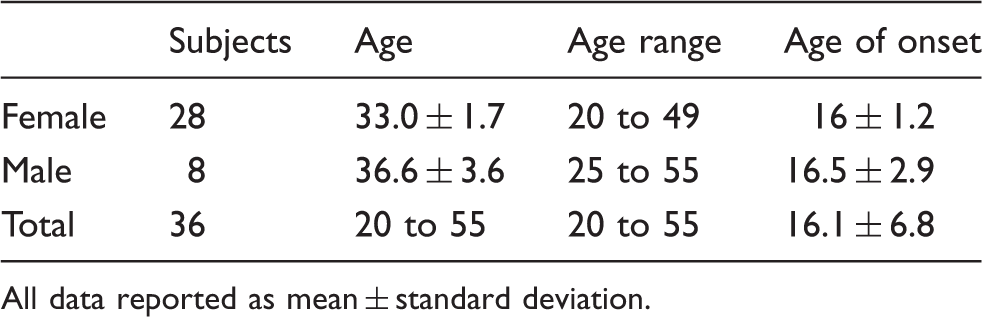
All data reported as mean ± standard deviation.
Headache characteristics.

All data reported as mean ± standard deviation.
Qualitative pain
Seventy percent of patients always experience throbbing pain during migraine headaches, Figure 3. While throbbing pain was the prominent qualitative pain feature for 70% of the surveyed migraine patients, many other types of pain were always experienced during migraine headaches, including pounding (59%), pressing (56%), pulsating (46%), stabbing (37%) and constricting (29%).
Distribution of qualitative types of pain. Throbbing pain was the most prevalent type of pain at 70%. Other types of pain: pounding (59%), pressing (56%), pulsating (46%), stabbing (37%) and constricting (29%) pain were always present during migraine headaches.
Example of the course of a migraine attack
An example of using this tool in capturing the spreading of pain over the course of a migraine headache is shown in one migraine patient in Figure 2. The tool is able to capture the temporal and spatial spreading of pain throughout the course of a migraine headache. This patient first experienced localized pain in the left temple that later spread laterally to behind the eye, as well as toward the back of the head, and then finally encompassed the majority of the left hemisphere including the neck.
Distribution of migraine pain
A total of 58.3% of migraineurs indicated that they experience throbbing pain in the right temple region, and 55.6% indicated throbbing pain in the left temple (Figure 4(a)). In contrast, for constant pressure pain, pain was predominantly located in the left (54%) and right (51%) forehead areas, but pain was reduced in the center region of the forehead (19%) (Figure 4(b)).
Distribution of pain during migraine headache. (a) Throbbing pain (17 individuals): A total of 58.3% of migraineurs indicated that they experience throbbing pain in the right temple region, and 55.6% indicated throbbing pain in the left temple. (b) Constant pressure pain (36 individuals): Constant pressure pain was predominantly located in the left (54%) and right (51%) forehead areas, but pain was reduced in the center region of the forehead (19%). Of interest to note is that the areas with the highest percentage of throbbing (red color) match V1 distribution.
Pain spreading
Pain in the frontal forehead region increased from 25% to 42% of migraine patients as a typical migraine progressed, while pain in the area behind the eyes decreased from 39% to 28% and then to 19% as the migraine progressed.
Discussion
Painful recurring head pain is a major sensory and debilitating consequence of migraine. While the cause of migraine has not yet been defined, the involvement of sensory systems including the trigeminovascular system (that may include its peripheral and central components) has been well established (17). The origin of the pain, in distinction from the origin of the migraine precipitator, may be due to activation of peripheral nociceptors located in intracranial meninges (dura and pia) that are activated by processes such as cortical spreading depression (18,19). Following the initiation of migraine, most patients will have head pain as a consequence. The head pain in these patients has not been well documented in a longitudinal fashion. In this paper we present the use of a pain map for migraine headaches. Based on the data captured in the survey, this novel tool indicates that such maps may provide measures of pain distribution and serve as a quantitative measurement of the spreading of pain during migraine. The validity of the findings of the study was further confirmed by capturing some of the patterns that have been previously reported in the literature (20).
Using this database of compiled information, this tool could be used to streamline the process of headache characterization by uncovering migraine vs. other types of headaches. One of the main applications of this tool could be in headache classification and differential diagnosis of a headache: if the headache is primary, secondary or both. In fact, according to the new classification criteria (ICHD third edition, ICHD-III) published by the Headache Classification Committee of the IHS (3), assessing the temporal course of the headache in addition to the site of the headache is recommended. Determining the relation of the spatial distribution of the pain to the site of another disorder may provide supportive evidence for a causal role of that disorder for the headaches. For instance, there is a strong correlation between the site of arteriovenous malformation and headache pain (21,22). Moreover, temporal changes in the headache features in relation to changes of the presumably underlying causing disorder will help determine whether the headache is a secondary headache (i.e. attributed to the causative disorder).
In the future, the pain map tool could be useful for understanding complex headache cases, providing information to systematically include or exclude migraine headache based on the pain pattern presented. One such example is headache attributed to acute glaucoma (23) that could have a very similar presentation like migraine that is it could be unilateral (if glaucoma is affecting one eye only) and associated with nausea and vomiting as described again in the ICHD-III. In this case, consistent spatial localization of the pain around the eye along with changes in the severity of the headache or associated features (nausea and vomiting) with progression of glaucoma will help the differential diagnosis. Another important application of this tool would be for the diagnosis of migraine in new headache onset of the pediatric population. In children and adolescents migraine headaches are often bilateral instead of unilateral (one of the characteristic features of migraine). Children may also not be able to adequately describe other symptoms that they may be experiencing such as photophobia, phonophobia or allodynia. As such, keeping a visual record of the spatial distribution of pain during each attack may be useful in ruling out other underlying causes for headache and diagnosis of migraine.
Combining the data gathered from this electronic tool with the criteria presented by the ICHD-III for migraine diagnosis (3), this tool could be implemented in the clinic. We envisage that computerized processing can provide an evaluation of a changed pattern of patients over time that may be used as a predictive measure of drug efficacy or disease presentation. The REDcap tool will be made available on the REDcap Library of Tools (http://www.project-redcap.org/library/index.php) to further the understanding of the emergent concept of migraine pain location and qualities in understanding pathogenesis of migraine. Please contact migraine@mclean.harvard.edu to gain access to the pain map tool.
This tool provides a systematic way for keeping a log or diary of how pain starts and spreads. Keeping a diary of the timeline of onset in combination with the pattern of the pain onset and spreading may be an additional tool in the hand of clinicians in making treatment decisions for a patient. For instance, a patient with no consistent pattern of onset may not benefit from any sort of therapy.
The tool could be developed into a streamlined clinical application for personal use and documentation of each migraine headache by migraine patients. By logging each migraine headache, the tool could capture the changes in migraine headache patterns over time to gain an improved understanding of headaches’ response to treatment.
A potential shortfall to the use of this tool as a record of each migraine is that patients may find it cumbersome to log each headache in a diary form. Completing the survey takes about 20 minutes, and patients may not be willing to allot this time to completing the survey. Additionally, the wide-scale applications of the tool could be diminished if physicians are unwilling to incorporate the survey into already jam-packed appointment schedules. To incorporate the use of the tool into the busy clinical practice, it will be useful to implement this tool first in the clinical research realm, to validate and conclude its efficacy in identifying migraine pain phenotypes. Alternately, rather than log each individual headache, patients could simply use the tool monthly or bimonthly to capture the evolving patterns of migraine pain on a broader scale. Rather than a large time commitment, this periodic use could allow patients to adhere to using the migraine pain diary. The use of the tool relies on physician endorsement to patients of the potential benefits gained by using the tool. Another limitation is that the pain map segments encompass the surface of the head, neck and face and behind the eyes, so any migraine pain experienced deep within the head will not be captured using this tool.
While the progression and “chronification” of migraine have been well documented (24–26), the underlying patterns and changes in migraine responsible for the changes in frequency have yet to be elucidated. This tool can be used to capture the changing migraines pain patterns and correlated qualitative characteristics.
This tool also makes it possible to look at some of the characteristics of the disease in the context of the pattern of pain distribution. One such characteristic is allodynia. Allodynia is hypersensitivity to non-painful stimulation of the skin in the form of exhibiting pain response (27). As part of the medical history, patients were asked questions related to the experience of allodynia. Patients were asked if, during a migraine attack, they experienced any increased sensitivity when combing or pulling back hair, wearing glasses, necklaces or wrist watches, shaving their face (in the case of men) or if they wore long-sleeve clothes. We see interesting patterns in the trends in the data that of course need a larger data number for verification. For instance in patients who report allodynia (either localized or generalized), only 30% of patients report always experiencing pressing pain while in patients who report no allodynia the report of pressing pain is close to 70%. However, these are trends and need to be verified with more patients and with more specific questions on the matter.
We proposed a digital tool in this study to be used for capturing pain distribution patterns in head and neck migraine. By using a digital tool in comparison to simply using a picture of a head and asking patients to shade in where they felt the pain, there was a unique advantage of consistency in making group inferences for research or even longitudinal comparisons in a single subject. In our previous experiences using manual shading of a picture of the brain by patients, we had noticed different preferences by the patients in “marking” the pain regions. For instance, some former patients would do elaborate shading while some patients would just draw “X” marks and then connect them with lines. However, it should also be noted that the increase in consistency comes at the cost of losing fine details about pain location.
As there is significant individual variability in migraine headache, this tool can capture that information to provide a deeper understanding at the patient level. Within the group of patients who tracked the pain distribution of their migraines using this tool, there exist subsets of migraine types in which pain is located in either the temples, top of head, or in the parietal regions. On a large population scale, this tool may uncover distinct migraine pain subtypes, which could have potential use for designing treatment strategies and for disease management (28). In addition it may have applications in clinical trials of headache and migraine.
Conclusions
As the precise mechanisms of migraine remain elusive, this electronic tool could shed light on a diverse yet prevalent neurological disorder by acquiring and quantifying spatial and temporal data. This pain tool can quantitatively capture qualitative pain characteristics, which can be challenging to gather and are not yet completely understood as components of migraine pain (29). The hope is that with a tool like this we would be encouraged to incorporate the pattern of headache pain distribution in clarifying migraine endophenotypes, which may be associated with distinct genetic biomarkers and corresponding treatment responses (30,31). The more we understand about what leads to each phenotypic presentation of migraine headache, in terms of how it onsets and progresses during each attack, whether or not it is lateralized (32), how it switches sides or how it changes as the disease progresses, the more we may be guided in a more focused direction to identify genes that play a role in migraine.
Clinical implications
The pain map survey is a useful tool for recording and tracking the temporal pattern of migraine onset and pain spreading. The electronic tool can be used as a headache diary to capture each migraine headache. The pain survey can capture and quantify qualitative pain experienced during migraines. On a large patient population scale, these data could be used to create pain maps to understand the disease progression and evolution.
Footnotes
Funding
This work was supported by the National Institutes of Health (R01NS073997 to D.B.). The NIH had no role in study design, data collection and analysis, decision to publish, or preparation of the manuscript.
Conflict of interest
None declared.