
Abstract
Objective
Though migraine is thought of as a symptom complex, symptoms are typically assessed one at a time. For use in clinical research, we developed a composite measure of headache day severity by combining eight well-known symptoms captured in daily diaries.
Subjects and Methods
Data came from adults with a self-reported diagnosis of migraine (n = 4380) who provided daily diary information assessed using a novel digital platform. Nine observed features theoretically linked to headache day severity were analyzed using latent variable modeling to create a psychometrically robust headache day severity score. Logistic regression was used to assess the cross-sectional relationships of headache day severity scores against an array of clinically-relevant outcomes.
Results
Participants were largely females (90%), approaching middle age (mean age of 37.3) and living in the United States (49%) or United Kingdom (23%). Findings supported a single latent headache day severity construct based on eight observed headache features. Headache day severity scores were associated with an increased odds of physician visits (Odds ratio[95% CI]: 1.71[1.32–2.21]), emergency department visits (4.12[2.23-7.60]), missed school/work (2.90[2.56–3.29]), missed household work (3.37[3.06–3.72]), and missed other activities (3.29[2.97–3.64]) (p < .0001 for all).
Conclusions
Modern measurement techniques support a single headache day severity construct that reflects migraine is a symptom complex. The headache day severity scores were associated with external validators and initial visualizations showed how headache day severity scores can be applied broadly in clinical practice and research.
Introduction
Migraine is a neurological disease characterized by episodic attacks with multiple correlated symptoms (pain, nausea/vomiting, photophobia and phonophobia, among others) (1). However, there is a disconnect between the clinical conceptualization of migraine as a symptom complex and the typical approach to assessment in clinical trials and practice. For clinical trials of acute treatments, pain intensity is assessed in isolation and associated symptoms are evaluated independently and, for prevention treatments, monthly migraine days are assessed without measuring attack severity (2,3). Thus, outcomes and corresponding endpoints are measured by diaries and evaluated one feature at a time.
An alternative approach is combining features captured by a headache diary into a psychometrically robust summary score, the Headache Day Severity (HDS) score. This strategy improves measurement by aligning quantitative methods with the conceptual model of migraine as a symptom complex. Available evidence suggests that combining headache features or comorbidities can predict clinically important outcomes in longitudinal epidemiologic studies (e.g., transition from episodic to chronic migraine, inadequate treatment response), suggesting that a symptom composite score may be practical and useful (4–9). These approaches may also improve diagnosis and better reflect patient perspectives, key areas for both clinical practice and therapeutic development and evaluation (10–14).
In this study, we empirically tested whether headache features captured by diary can be combined into a HDS score using modern psychometric methods. Latent variable models evaluated if HDS can be well-measured as a latent trait that gives rise the observed headache features. For example, when individuals have higher levels of HDS, they are expected to endorse more headache features. We also evaluated the validity of the HDS summary score by assessing its relationship to an array of clinically important outcomes and consider applications of this approach in research and practice. Finally, we investigated the utility of the constructed scores for understanding changes over time.
Material and methods
Study design, setting, and participants
The current study used intensive longitudinal data collected in Curelator Headache® (now called N1‐Headache®), a commercial digital health platform for individuals with a history of headache. Users learned about the platform from internet resources (e.g., app store, social media, website), patient organizations, or medical providers and registered for one of three potential account types (free, premium paid account, or premium with a coupon account from a medical provider). During registration, participants gave agreement for their data use for research and publication purposes via the company’s Terms and Conditions and Privacy Policy. No individuals were paid to participate. Participants entered daily data, including headache and migraine characteristics (e.g., occurrence, pain intensity, duration, associated symptoms) among other features to help identify migraine risk factors and track medication use. For the current study, participants were adults (18+ years old at time of registration) with a self-reported physician diagnosis of migraine (“Has a doctor given you a diagnosis of migraine?” yes/no) and reported on at least one of the nine candidate HDS items for a headache day. Complete data is not a requirement of the modern psychometric methods applied here. Sensitivity analyses were conducted using complete case symptom data and resulted in substantively similar conclusions.
In the primary latent variable and validation analyses, a calibration sample consisting of one randomly selected headache day report from each patient was drawn to remove the possibility of within-person dependence of multiple observations. Once a latent variable HDS model was finalized, HDS values/scores for the full dataset (individuals could have multiple repeated headache days) were obtained using the developed model.
An independent review board (IntegReview IRB) determined this study to be exempt according to 45 CFR 46.104.
Variables collected at baseline:
Numerous person-level demographic and headache-related characteristics were collected on the individuals at baseline including age, location (country), employment status, substance use, other medical conditions, headache types and history, headache-related disability, and medication use.
Variables collected by diary:
There were nine patient-reported variables considered for the HDS scale collected using the daily diary (one response for each variable per headache day [one report per day]): 1) pain intensity (maximum level for the day on a 4 point ordinal scale), 2) headache duration (in hours) and then a series of binary variables rated as present or absent including: 3) aura, 4) pulsating/throbbing pain, 5) unilateral pain, 6) pain aggravation by activity, 7) nausea/vomiting, 8) photophobia, and 9) phonophobia. Duration was collapsed into three ordinal categories: 1) less than 4 hours, 2) 4+ hours to <12 hours, 3) 12+ hours for analyses.
Several patient-reported items were used to establish convergent validity for the newly developed HDS scores: 1) missed work/school today because of headache (yes/no), 2) missed household work today because of headache (yes/no), 3) missed family, social, or leisure activity today because of headache (yes/no), 4) visited emergency department (ED) because of headache (yes/no), and 5) visited physician because of headache (yes/no).
Statistical analyses
Unless stated otherwise, analyses were conducted in SAS 9.4. Statistical analyses were based on the calibration sample (responses related to a single, randomly selected headache day for each person) and used all available data. The statistical analyses were conducted in four steps. First, descriptive statistics (rates of endorsement) for each of the candidate HDS items were calculated. Second, a series of latent variable models were fit using the confirmatory factor analysis (CFA) framework to determine the optimal factor structure for the HDS construct. These models were fit in Mplus 8.4 using diagonally weighted least-squares estimation with mean and variance adjustments (WLSMV) (15). Model fit was evaluated using the comparative fit index (CFI), the Tucker-Lewis index (TLI), and the root mean square error of approximation (RMSEA), using customary cut-offs for adequate fit of 0.95 or greater for the CFI and TLI and less than 0.08 for the RMSEA (16,17). Third, building on the structure determined in the prior step, the preferred model was reparameterized within the item response theory (IRT) framework; maximum marginal likelihood via the Bock-Aitkin expectation-maximization algorithm as implemented in flexMIRT 3.51 was used to estimate IRT model parameters. The resulting IRT parameters were used to obtain response pattern expected a posteriori (EAP) HDS scores for each patient from each headache diary entry. The results from the IRT models also provided reliability estimates (degree of reliability of the HDS measure) across the full range of severity. The value of 0.70 was used as the minimum value to demonstrate satisfactory reliability (18). Finally, convergent validity was examined for the resulting HDS scores by examining the associations between HDS scores and the five external validators (missed work/school, missed household work, missed other activity, ED visits, and physician visits) using logistic regression. Sample sizes for the logistic regression models varied from n = 3,146 to n = 4,049 due to missing data on the external validation variables. Odds ratios were calculated to provide a measure of effect size.
Results
The analysis sample consisted of n = 4,380 patients with a mean age of 37 years (Table 1). Most patients were female (90%) and about two-thirds were from the United States or United Kingdom (49% and 23%, respectively). Patients reported a mean of 33 headaches over the past 3 months (median of 25 days). About 65% of patients reported 1 or more doctor visits and 14% reported 1 or more ED visits due to headaches in the past 3 months. Pooling over the 4380 individuals, there were a total of 108,965 eligible headache days reported (Q1: 1 day, Median: 4 days, Q3: 19 days; Mean(SD): 24.9(61.8) days per person).
Demographic characteristics of eligible participants with a self-reported medical diagnosis of migraine (n = 4380).

Note: Some demographic variables had missing data. The total available sample sizes for these cases are denoted in parentheses. ED = emergency department.
Item descriptives
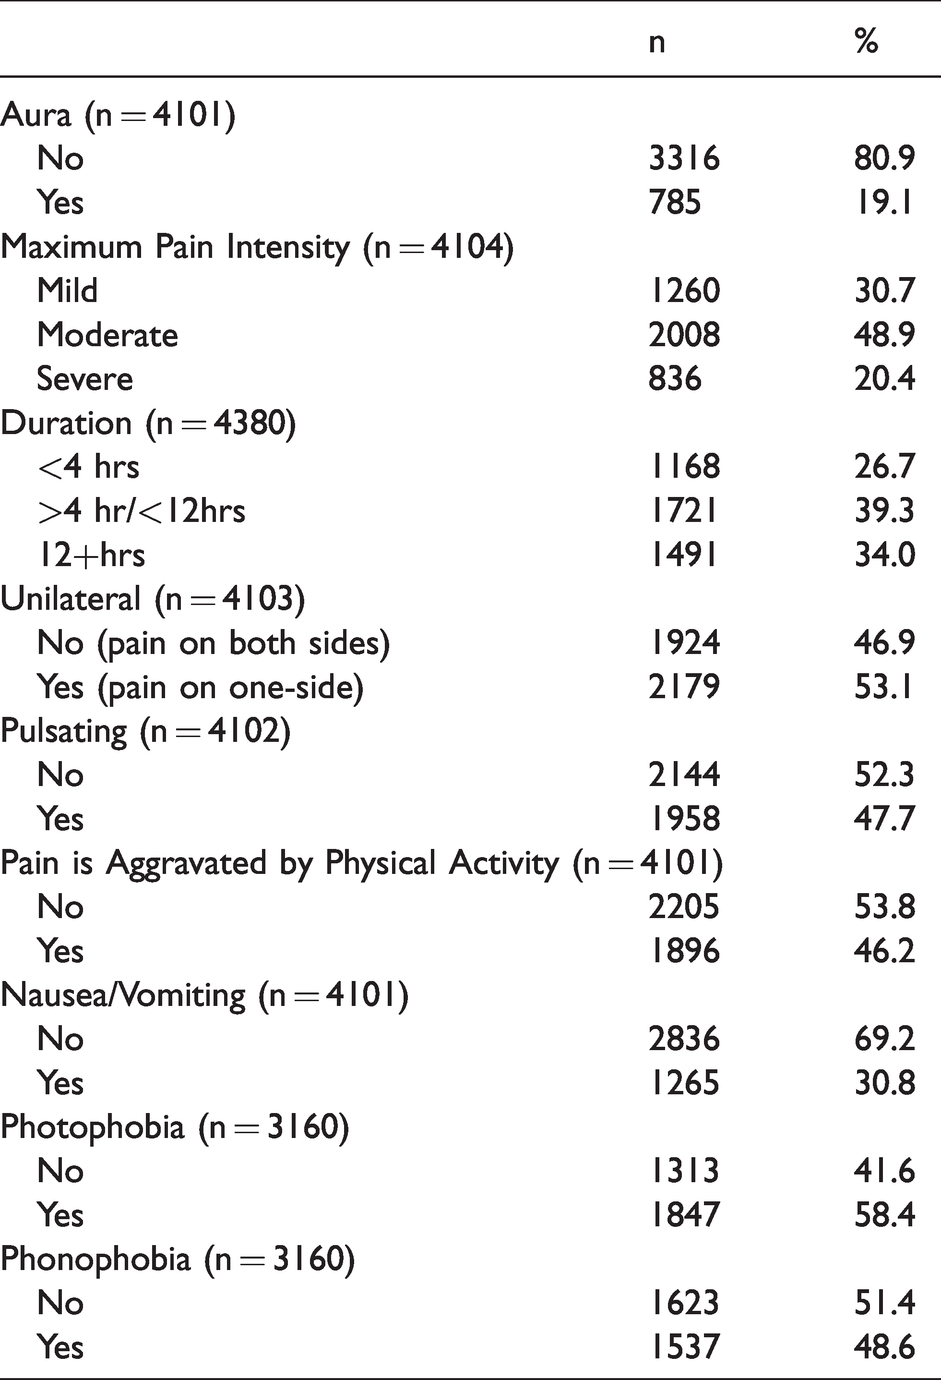
Table 2 provides item descriptive statistics for the candidate HDS items in the calibration sample. About 70% of patients reported that their headache pain intensity was moderate or severe and most of the patient-rated attacks (73%) lasted four or more hours. Around half of the patients endorsed unilateral headache, pulsating/throbbing, aggravation with activity, photophobia, and phonophobia. Aura (19%) and nausea/vomiting (31%) were reported less frequently.
Descriptive statistics for observed headache features in persons with a self-reported medical diagnosis of migraine for a single randomly selected headache (Calibration Sample).
Evaluating the dimensionality of HDS
A series of competing CFA models were fit to determine the optimal factor structure for the unobserved, latent HDS construct (Table 3). First, a unidimensional CFA model (Model 1) was fit in which a single HDS latent factor was measured by all nine observed patient-reported symptoms. This model provided adequate fit to the data; χ2(27) = 335.21, p < .0001, RMSEA = .05, CFI = .94, TLI = .92. However, based on clinical judgement and quantitative evidence, a second bifactor structure was fit to data (Model 2) in which a primary HDS latent factor (the unobserved construct of clinical interest) was measured by all nine observed symptoms and an orthogonal (uncorrelated) specific latent factor (unobserved ‘nuisance’ factor, not of direct clinical interest) was added to capture the residual relations between phonophobia and phonophobia symptoms, χ2(26) = 225.21, p < .0001, RMSEA = .04, CFI = .96, TLI = .95 (19). This model provided better fit to the data, but the results showed that one item, unilateral location, had a small standardized factor loading (.13) and did not add meaningful information (i.e., very little increase to reliability and limited clinical benefit) for measuring HDS above and beyond the other eight features. In the final CFA model (Model 3), the unilateral location item was dropped from the model, which improved the model fit; χ2(19) = 132.49, p < .0001, RMSEA = .04, CFI = .98, TLI = .97. Figure 1 provides a graphic depiction of the final HDS CFA model. Results demonstrated that each of the eight observed items were significantly related to the HDS construct of clinical interest (p < .001 for all factor loadings, which capture the strength of relation between the observed headache feature and the latent HDS construct). Specifically, pain intensity, nausea/vomiting, phonophobia, and photophobia were most strongly related to the HDS (standardized factor loadings >.60 for all) whereas duration (.28) and pulsating quality (.34) were less strongly related to the HDS construct. Findings from the calibration IRT model showed acceptable model fit (RMSEA = .03, TLI = .94) and adequate reliability across a range of HDS with approximately .7 reliability or higher from about –1 to +1.2 standard deviations around the mean (Figure 2). The marginal, overall single value, reliability estimate was .72.
Model fit statistics for confirmatory factor analysis models.

Notes: RMSEA = Root Mean Square Error of Approximation (RMSEA), CFI = Comparative fit index, TLI = Tucker Lewis Index.

Path diagram representation for the final HDS CFA (Model 3) with standardized factor loadings.

Reliability of HDS measure across a continuum of severity.
The stability of the final factor solution was empirically examined by randomly drawing a new random calibration sample. Results from this sensitivity analysis supported the factor structure used in Model 3 with excellent model fit, χ2(19) = 117.56, p < .0001, RMSEA = .03, CFI = .98, TLI = .97. Further, the parameter estimates from the second cross-validation dataset were very similar to those obtained from the original calibration dataset, suggesting that the proposed factor structure was not unduly influenced by the unique characteristics of the original calibration sample.
Establishing convergent validity for HDS scores
Next, HDS scores were computed for the calibration sample and used to predict several theoretically correlated outcomes to establish convergent validity. Results showed that HDS scores significantly predicted all validation outcomes (p < .0001; Figure 3). For every one standard deviation increase in HDS, the predicted odds of physician visit increased by 71% (OR = 1.71, 95 CI: 1.32–2.21), ED visit increased by 342% (OR = 4.42, 95% CI: 2.23–7.60), missed work/school increased by 190% (OR = 2.90, 95% CI: 2.56–3.29), missed household work increased by 237% (OR = 3.37, 95% CI: 3.06–3.72), and missed other leisure/social activity increased by 228% (OR = 3.28, 2.97–3.64).

Odds ratios and 95% confidence intervals representing the association between HDS scores and validation variables.
Illustrating between- and within-person differences in HDS
Given the broader objective of applying these methods to longitudinal, full daily diary datasets, the larger dataset (108,965 total headache days across the 4380 individuals) from which the calibration sample was drawn (i.e., most people had numerous headache days) was scored using the developed IRT model, providing a single, robust HDS score that is a composite of the eight observed symptoms for each headache per person. Figure 4 provides a plot displaying the inter- and intra-individual differences in HDS for 30 patients across repeated headache days. Notice that this approach permits a parsimonious depiction of how individuals differ in their respective HDS that moves beyond any single observed symptom (e.g., headache pain intensity). In these plots, an HDS of zero means that the HDS score corresponds to the population average score. A score of 1 indicates an HDS score that is one standard deviation above the mean in the metric of the latent variable. A score of −1.5 indicates that the HDS score is 1.5 standard deviations below the mean. For example, across their available headache days, Person 21 has a mean HDS score just above the population average (0) but they have a higher degree of within-person variability across headache days (curve is flatter and more spread out). Conversely, Person 23 has a higher average HDS score (around .5) with less within-person variability (curve is taller and less spread out) across headache days.
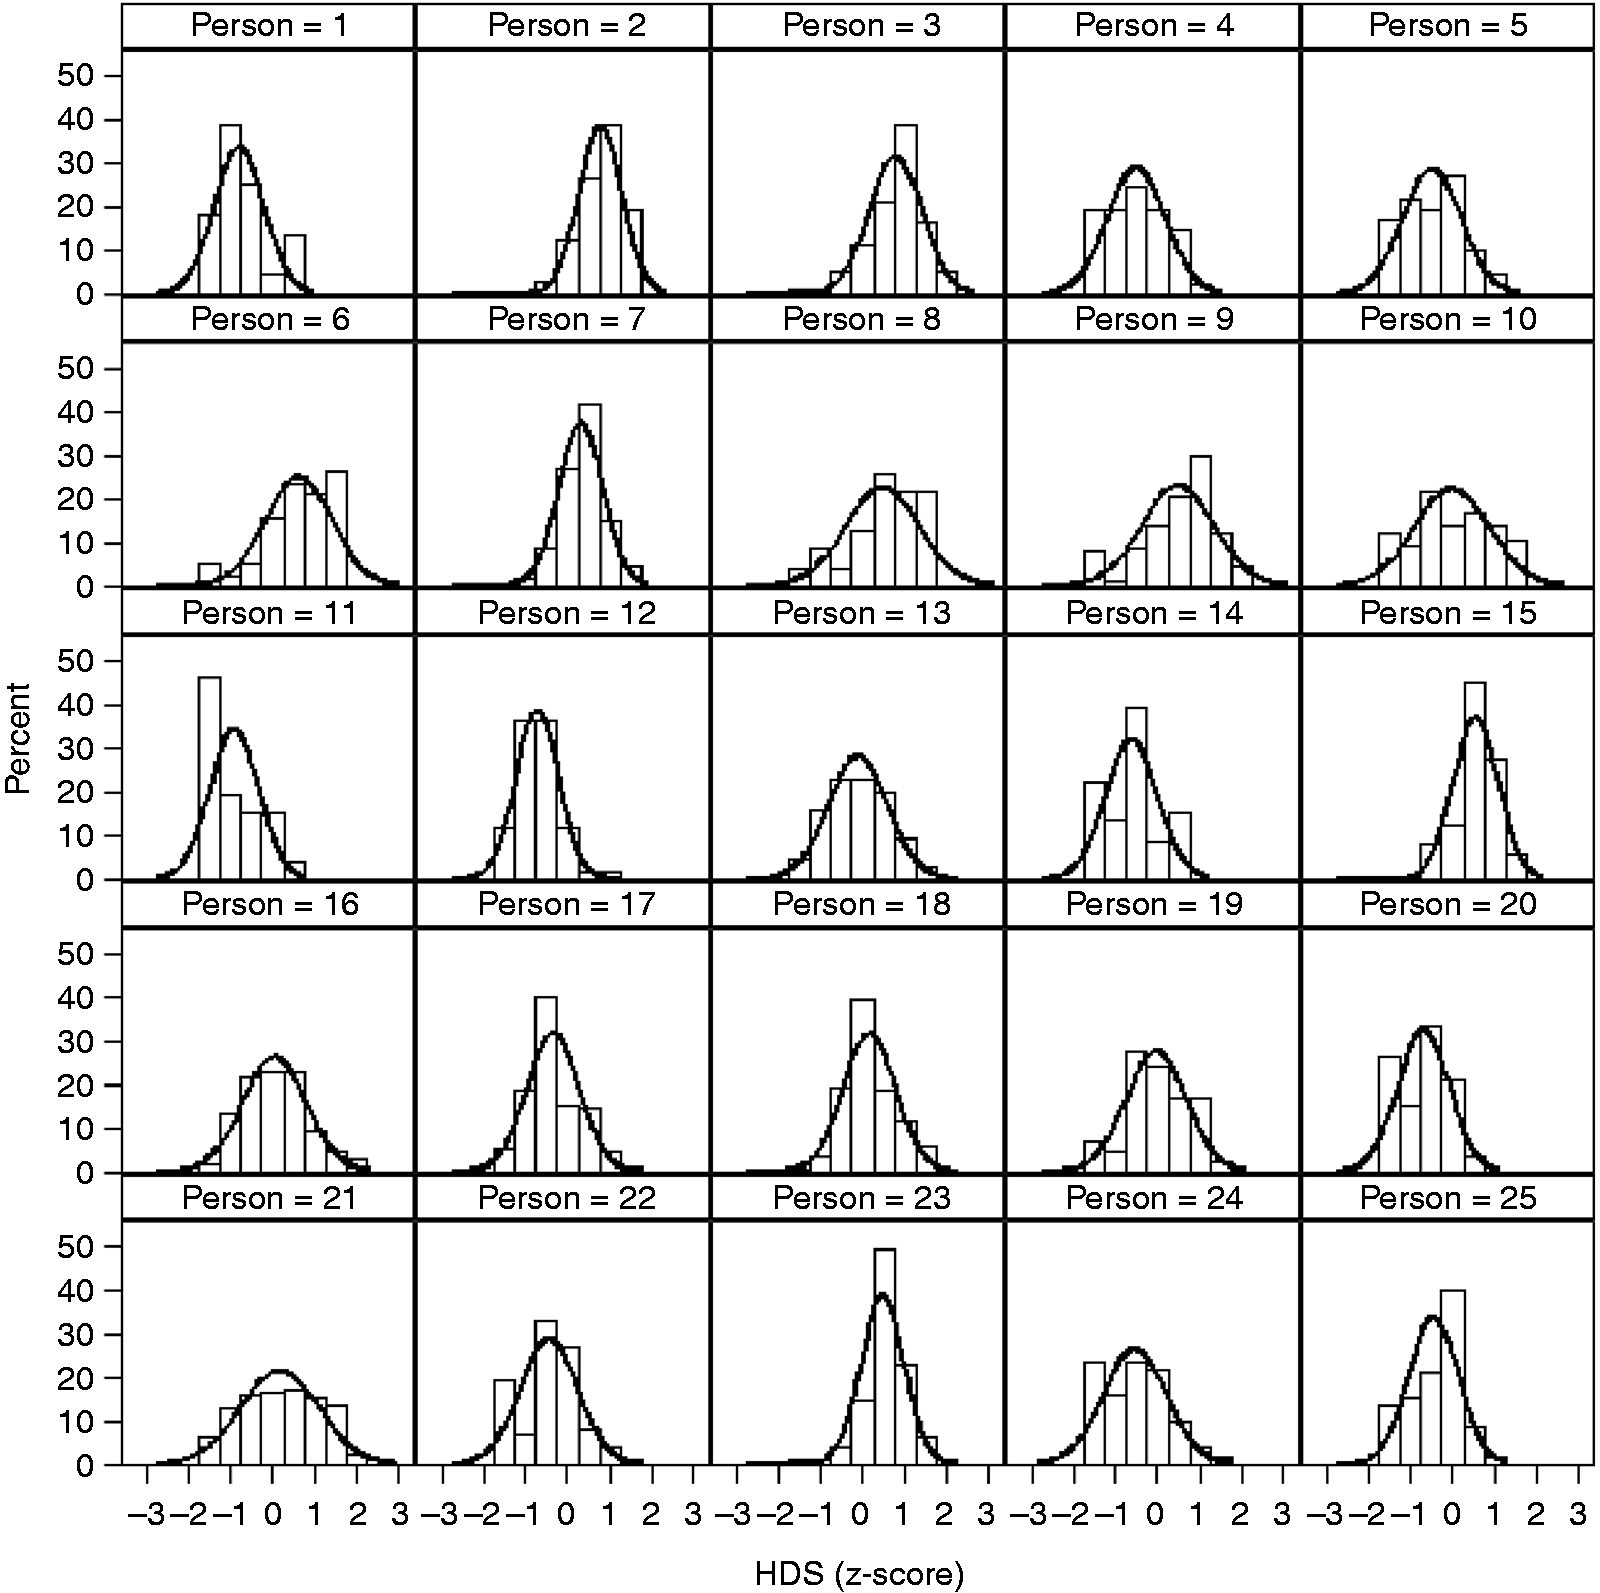
Visual depiction of individuals differences in HDS scores across multiple headache days.
Discussion
The International Classification of Headache Disorders 3rd edition (ICHD-3) defines migraine as a symptom complex based on various combinations of pain features (e.g., moderate or severe pain, unilateral pain, throbbing pain) and associated symptoms (nausea, photophobia and phonophobia) (1). However, researchers and trialists frequently study migraine by assessing individual attack features taken one at a time (pain or the most bothersome symptom) in acute treatment trials or by assessing change in monthly migraine days in prevention trials (2,3). These approaches do not treat migraine as a symptom complex and, instead, assess single features in isolation. The current study developed a measurement strategy aligned with the conceptual model of migraine as a symptom complex, incorporating information from multiple symptoms into a single score.
Our analysis results show that HDS can be measured as an unobserved latent variable defined by a series of correlated observed features. This finding is supported by both clinical theory and practice. For example, examination of the standardized factor loadings (Figure 1) shows that pain intensity, nausea/vomiting, photophobia, and phonophobia were strongly related to the HDS latent construct. These symptoms are central in defining migraine using the ICHD-3 and usually included in the definitions of co-primary endpoints for acute treatment trials (1,3). Thus, our HDS model provides empirical support for the theoretical conceptualization of headache and provides strong support for combining these headache features into a single composite score. Importantly, modeling results demonstrated that the proposed HDS construct was associated with external validators includes physician visits, ED visits, and missed activities. Further, we provide initial visual evidence to show that HDS scores can be readily applied to investigate between- and within-person differences HDS over time.
For acute treatment trials, the key features of migraine used to calculate HDS scores are routinely assessed in clinical trial diaries at multiple time points. The current FDA regulatory standard is to separately measure dichotomized pain freedom and freedom from the most bothersome symptom at 2 hours as co-primary endpoints (20). This approach discards information about pain relief (the transition from severe/moderate to mild pain is considered a failure) and associated symptoms (only the most bothersome symptom counts). Further, the co-primary endpoints for acute treatments require a strategy for addressing multiple comparisons. Additionally, because each outcome has a single indicator (e.g., pain intensity is assessed by a single pain item) measurement of the outcome is likely less reliable compared to the HDS score, which combines information from multiple indicators. HDS as an outcome uses all available information combined in a psychometrically robust manner. In an acute trial, it could be used to assess status or change two hours after taking study medication which would also facilitate the measurement of the trajectory of change in HDS over the first two hours of treatment using methods already applied to pain (21). In these models, the duration variable would be excluded from the HDS construct. In future work, a rating of functional disability could be included.
For prevention trials, HDS would allow us to determine the severity of headaches on the days they occur. The goals of preventive treatment are to reduce the frequency and severity of migraine headaches though usually only frequency is considered. We could separately measure change in monthly migraine or headache days and calculate average HDS scores on the days when migraine or headache occurred. This approach has been applied to prevention trials using pain intensity as a single indicator (22).
For clinical practice, the widespread use of commercially available daily electronic diaries has led to massive increases in the availability of data, but much of the information is difficult for clinicians and patients to use. Diaries often produce useful reports of headache days but do not provide summary information on headache severity. Incorporating the HDS scoring algorithms into electronic diaries could help doctors and patients track this important dimension.
Patient-reported outcome measures (PROMs) play an increasingly important role in the field of neurology, particularly in headache medicine (10–12,23). There are several PROMs currently seeing wide use in headache studies and clinical trials, such as the Migraine Disability Assessment Test (MIDAS), the 6-item Headache Impact Test (HIT-6), the Migraine-specific Quality of Life Questionnaire (MSQ) (24–29). These existing PROMs provide valuable insights on domains such as headache-related disability and quality of life. These existing measures were not designed for intensive longitudinal study designs (e.g., often based on 4-week or 3-month recall) and do not aim to measure HDS from a symptom complex perspective. As clinical knowledge and the field’s ability to capture large amounts of patient data increase, there is a clear need for psychometrically robust and flexible tools for measuring multifaceted constructs over time. Our approach provides a unique solution to assess headache severity that could be useful in a wide array of headache research settings ranging from clinical trials to applied research studies. We showed how IRT model-based scores can be derived and used for applied headache research. It is likely that many existing diary-based studies have already collected the headache features used for this study and could be used for valuable replication and secondary data analyses. IRT and related psychometric software makes it possible to easily compute HDS scores from observed patient data in a variety of research and clinical settings.
As with any study, there were limitations worth noting. The data come from a convenience sample, so the generalizability of the results is unknown. Persons with headache that use a headache e-diary likely have headache as a significant issue in their lives and may be representative of those who would participate in a clinical trial. Participants were included in this study based on self-reported migraine diagnosis, but it is unknown how many of these individuals were formally diagnosed by physicians trained in headache medicine and neurology. Ideally, in a PROM development project, there would be initial qualitative work to determine what matters most to patients and iterate through an item development and refinement process. This is an active area that is currently being explored and will help improve our ability to measure and understand headache, particularly from the patient’s perspective. The marginal reliability estimate for HDS (.72) was acceptable based on conventional rules of thumb and almost 75% of the possible HDS scores (-1 to 1.2 standard deviation around the mean) were measured at, or above, the .7 reliability level. However, it would be quantitatively and clinically beneficial to build on this work and increase accuracy and consistency, especially at the extreme ends of HDS (18).
From a methodological standpoint, there are modifications that future research should investigate that may improve precision and reliability. Most of the observed headache features are collected on a binary (yes/no) response scale; increasing the number of response options for each item may improve our ability to measure HDS, and other related domains. For example, instead of measuring nausea as present or absent, it could be measured on an ordinal scale, perhaps none, mild, moderate, or severe. It might be beneficial to expand the set of observed indicators of HDS to include other features such as neck pain, osmophobia, activity limitations, and cognitive difficulty. Both increasing the number or response options and adding items may help more reliably measure the full range of HDS. To leverage the construct of HDS in acute and preventive clinical trials, methodological work is needed to establish standardized endpoints and statistical modeling techniques for evaluating treatment efficacy via HDS scores. Future work should replicate and extend the work here as new information becomes available. It would also be useful to explore potential measurement differences across groups of clinical interest (e.g., male versus female, young versus old, episodic vs. chronic migraine) as well as contrast the current standard single indicator approaches (e.g., pain relief/freedom) with novel measurement approaches. Although HDS scores were shown to predict missed activities and medical visits, future work should investigate the relationship between HDS and a wide range of migraine outcomes (e.g., headache-related functional disability, impairment, impact) to provide additional validity support.
In sum, findings from the current study joined clinical theory with modern measurement theory, empirically demonstrating that headache severity can be modeled as an unobserved latent construct that gives rise to the observed symptoms. IRT was then applied to provide a valid and reliable means for scoring HDS across a variety of research settings. Our hope is that this work serves as foundational basis for better understanding the complexity of headache as symptom-based condition.
Key findings
Modern psychometric methods support the measurement of headache day severity (HDS) by combining multiple correlated features into a single, robust score. HDS scores were shown to predict several clinical outcomes including of physician and emergency department visits as well as missed school/work, household work, and other activities. IRT model-based HDS scoring can be applied to longitudinal data from headache diaries for clinical and research use.
Footnotes
Declaration of conflicting interests
The authors declared the following potential conflicts of interest with respect to the research, authorship, and/or publication of this article: JS McGinley has received funding, research support, salary, or other compensation from Vector Psychometric Group LLC (Employment), Amgen, Inc. (Research Support), Cephalalgia (Biostatistics Editor), and the National Headache Foundation (Research Support). Carrie R Houts has received salary from Vector Psychometric Group, LLC (Employment). RJ Wirth has received salary or other compensation from Vector Psychometric Group, LLC (Management Position) and Cephalalgia (Biostatistics Editor). RB Lipton holds stock options in Biohaven Holdings and CtrlM Health. He serves as consultant, advisory board member, has received honoraria from or research support from: Abbvie (Allergan), American Academy of Neurology, American Headache Society, Amgen, Biohaven, Biovision, Boston, Dr Reddy’s (Promius), Electrocore, Eli Lilly, eNeura, Equinox, GlaxoSmithKline, Grifols, Lundbeck (Alder), Merck, Pernix, Pfizer, Teva, Vector and Vedanta. He receives research support from the NIH and the FDA.
Funding
The authors disclosed receipt of the following financial support for the research, authorship, and/or publication of this article: This study was funded by Amgen, Inc. through the Competitive Grant Program in Migraine Research, which is an independently-reviewed competitive grant program supported by Amgen to fund innovative research advancing the medical knowledge of migraine. The sponsor did not interact with the authors regarding any aspect of the design, analysis, or interpretation of this study. The authors made the final decision to submit the manuscript for publication.