
Abstract
Background
Most diagnostic tools for spontaneous intracranial hypotension (SIH) are either invasive or occasionally inconsistent with the clinical condition. In this study, we examined the cerebrospinal fluid (CSF) dynamics in SIH using phase-contrast magnetic resonance (PC-MR) imaging.
Materials and method
Seventeen SIH patients and 32 healthy individuals, matched by sex and age, were recruited. Each person underwent brain and PC-MR imaging using 3-Tesla MRI. We evaluated the differences in image parameters among patients during the initial and recovery stages against the status of the control group.
Results
SIH patients had lower CSF flow-volume, flux, peak velocity, and higher systolic-to-diastolic time ratio, as well as systolic-to-diastolic volume ratio compared to the control group and the conditions when they recovered. The flow time and volume of the diastolic phase markedly increased after treatment. The discriminating power of PC-MR for SIH was good. Diffuse pachymeningeal enhancement and venous engorgement were present when their PC-MR values were lower than the cut-off values for SIH diagnosis. The headache scores correlated with the peak velocity and pituitary volume.
Conclusion
Noninvasive PC-MR could provide valid parameters for diagnosis and treatment follow-up in SIH patients. It may be more sensitive than conventional brain MRI.
Keywords
Introduction
Spontaneous intracranial hypotension (SIH) usually presents with orthostatic headache and is increasingly recognized. It is caused by cerebrospinal fluid (CSF) leakage through dural defects along the spinal nerve root sleeves, or at the meningeal diverticula (1). SIH is usually associated with nausea, vomiting, photophobia, posterior nuchal pain or stiffness, tinnitus, and visual blurring. More severe presentations like cranial nerve palsies and coma have been reported (2). The estimated annual incidence of SIH is five per 100,000 (3) with a female:male ratio ranging from 1.5:1 (2) to 3.4:1 (4).
Previously, lumbar puncture was needed to confirm low intracranial pressure. Either radionuclide cisternography or computed tomography (CT) myelography was used to demonstrate CSF leakage. However, both are invasive procedures that may aggravate symptoms. In 2008, Schievink et al. (2) proposed the new diagnostic criteria for SIH based mainly on clinical symptoms and radiological manifestations (supplementary Table 1). Usually, magnetic resonance images (MRI) are used as the diagnostic tool. Typical brain MRI presentations are diffuse pachymeningeal enhancement, bilateral subdural effusion or hematoma, iter-sagging, tonsillar herniation, pituitary hyperemia, and venous sinus engorgement (5). The spinal MRI may indicate extrathecal fluid accumulation, dural sac collapse, meningeal diverticulum, dilated epidural or intradural veins, or C1–C2 fluid accumulation (6). A recent study confirmed that heavily T2-weighted myelography was accurate in localizing CSF leaks in SIH patients (7).
However, the condition of SIH patients was evaluated qualitatively by using conventional brain MR and heavily T2-weighted myelography, rather than quantitatively (8). Some inter-rater discrepancies may also exist. Furthermore, there was usually a time lag between resolution of radiological abnormalities and clinical improvement after treatment (2,9). We also had a diagnostic dilemma for patients having orthostatic headache but normal brain MR. Therefore, we wanted to evaluate the severity of SIH more objectively and quantitatively.
Phase-contrast MR (PC-MR) is a powerful, noninvasive, quantitative tool to evaluate CSF dynamics (10), including flow direction, velocity, and volume. It has been used to diagnose some central nervous system (CNS) diseases, such as normal pressure hydrocephalus (11) and idiopathic intracranial hypertension (12). Until now, to our knowledge, only two studies have described PC-MR changes in SIH patients. The first, reported in 2004, described how CSF flow volume (FV) decreased and then restored after treatment in an SIH patient (13). The second, reported in 2012, observed decreased FV and flow velocity in SIH patients compared to a healthy control group (14). However, no data were gathered post-treatment.
In this study, we used PC-MR to evaluate SIH patients both in their initial and recovery stages, and then compared the results with a healthy control group. In addition, we evaluated the relationship among the PC-MR parameters, typical brain MR signs, and headache severity.
Materials and methods
Participants
Patients
This study was approved by the institutional review board of the Taichung Veterans General Hospital (VGHTC), Taichung, Taiwan. By reviewing the electronic charts and the MRI report system from January 2012 to July 2013, there were 17 SIH patients identified. They had characteristic orthostatic headache and fulfilled Schievink’s revised diagnostic criteria (2). Lumbar puncture was not performed because of the possibility of disease deterioration. Instead, at least one CSF leak present on heavily T2-weighted MR myelography was used as the diagnostic feature. They received conservative treatment, and most of them underwent targeted epidural blood patch (EBP) during hospitalization. They were followed up regularly at our neurological outpatient unit for at least three months. MRI of brain and spinal myelography were performed simultaneously at least at initial hospitalization and complete recovery. We defined the patients as “complete recovery” based on two criteria:
Radiologically, there was neither CFS leak on the MR myelography, nor diffuse pachymeningeal enhancement and venous engorgement on brain MRI. Clinically, there was neither headache nor other associated orthostatic symptoms.
Control group
The control group was selected from people undergoing health examinations, with comparable age and sex categories of the SIH patients. They underwent both brain and PC-MR scans. We excluded those with arrhythmia, primary headache, structural brain lesions, and those who recently had lumbar punctures.
MRI acquisition
Brain MR was performed using a 3-Tesla MR scanner (Achieva TX; Philips Healthcare, Best, the Netherlands) equipped with an eight-channel head coil. PC-MR was acquired in an oblique axial plane perpendicular to the ampulla region of the aqueduct by peripheral gating. The image parameters were: field of view (FOV) = 85 × 85 mm, matrix = 224 × 224, voxel size = 0.5 × 0.6 × 4 mm, velocity encoding gradients (Venc) = 20 cm/sec. The scan time for PC-MR was around eight minutes. The circular region-of-interest (ROI) was drawn manually by the same neuroradiologist (H-C Chen) for each axial section. It included the pixels reflecting the CSF flow signals with the maximal flow rate. The background ROI of stationary tissue was obtained around 1 cm ventro-lateral to the aqueduct. Its value was subtracted from the aqueduct ROI to correct possible systemic errors.
The caudo-cranial direction was defined as forward with positive values, and cranio-caudal direction as backward with negative values. The parameters obtained by PC-MR were defined as follows:
Brain MRI parameters were: axial spin echo (SE) T1-weighted images (T1WI) (repetition time (TR)/echo time (TE) 500/10), axial fast-spin echo T2-weighted images (T2WI) (TR/TE 3200/115), axial, coronal and sagittal gadolinium-enhanced SE T1WIs.
The signs of the brain images were evaluated as follows:
Headache severity was quantified to represent the clinical condition. It was evaluated by the SIH patients themselves using visual analog scales (VAS) before receiving MRI examinations. The results were categorized into four grades: Score 0: VAS = 0; Score 1: VAS = 1–3; Score 2: VAS = 4–7; and Score 3: VAS = 8–10.
Statistical analysis
All data were analyzed using the Statistical Package for the Social Sciences software (SPSS), version 19.
To check the inter-rater reliability of PC-MR parameters, the ROIs of aqueduct in every examination were re-circled blindly by the second experienced neuro-radiologist (C-C Chen). The signs of brain MR were also re-evaluated twice. The results of the two investigators were compared by Cronbach’s alpha and Spearman’s correlation. Cronbach’s alpha was exceeding 0.9, and rho coefficient was larger than 0.8 (supplementary Table 2). This indicated the high inter-rater reliability of our data.
We used the Kolmogorov-Smirnov test to evaluate if the PC-MR parameters fit normal distribution. Logarithms were used to convert the data into normal distribution for statistical comparison. We compared the image parameters of the brain and PC-MR images among the control group to the SIH participants in their initial (SIH-initial) and complete recovery (SIH-recovery) stages. All profiles were adjusted according to age, sex, and body mass index (BMI) using logistic regression. The parameter variance between SIH-initial and SIH-recovery stages was analyzed by the paired t test. The odds ratio was also obtained. The ROC (receiver operating characteristic) curve was applied to assess the discriminating power of image parameters for SIH diagnosis and presence of DPE or venous engorgement in SIH patients. Mann-Whitney U test was used to compare parameters among control, SIH without DPE, and SIH with DPE groups. The relationship among the headache scores, PC-MR parameters, and brain MRI were analyzed using a Spearman’s rho test. p values less than 0.05 were defined as significantly different.
Results
Demographic features of the participants.

BMI: body mass index = body weight (kilogram)/[body height (meter)]2; SIH: spontaneous intracranial hypotension; ROI: region of interest; EBP: epidural blood path; NA: not applicable.
The phase contrast MR parameters and brain MRI findings of the controls and SIH patients at initial and recovery stages.
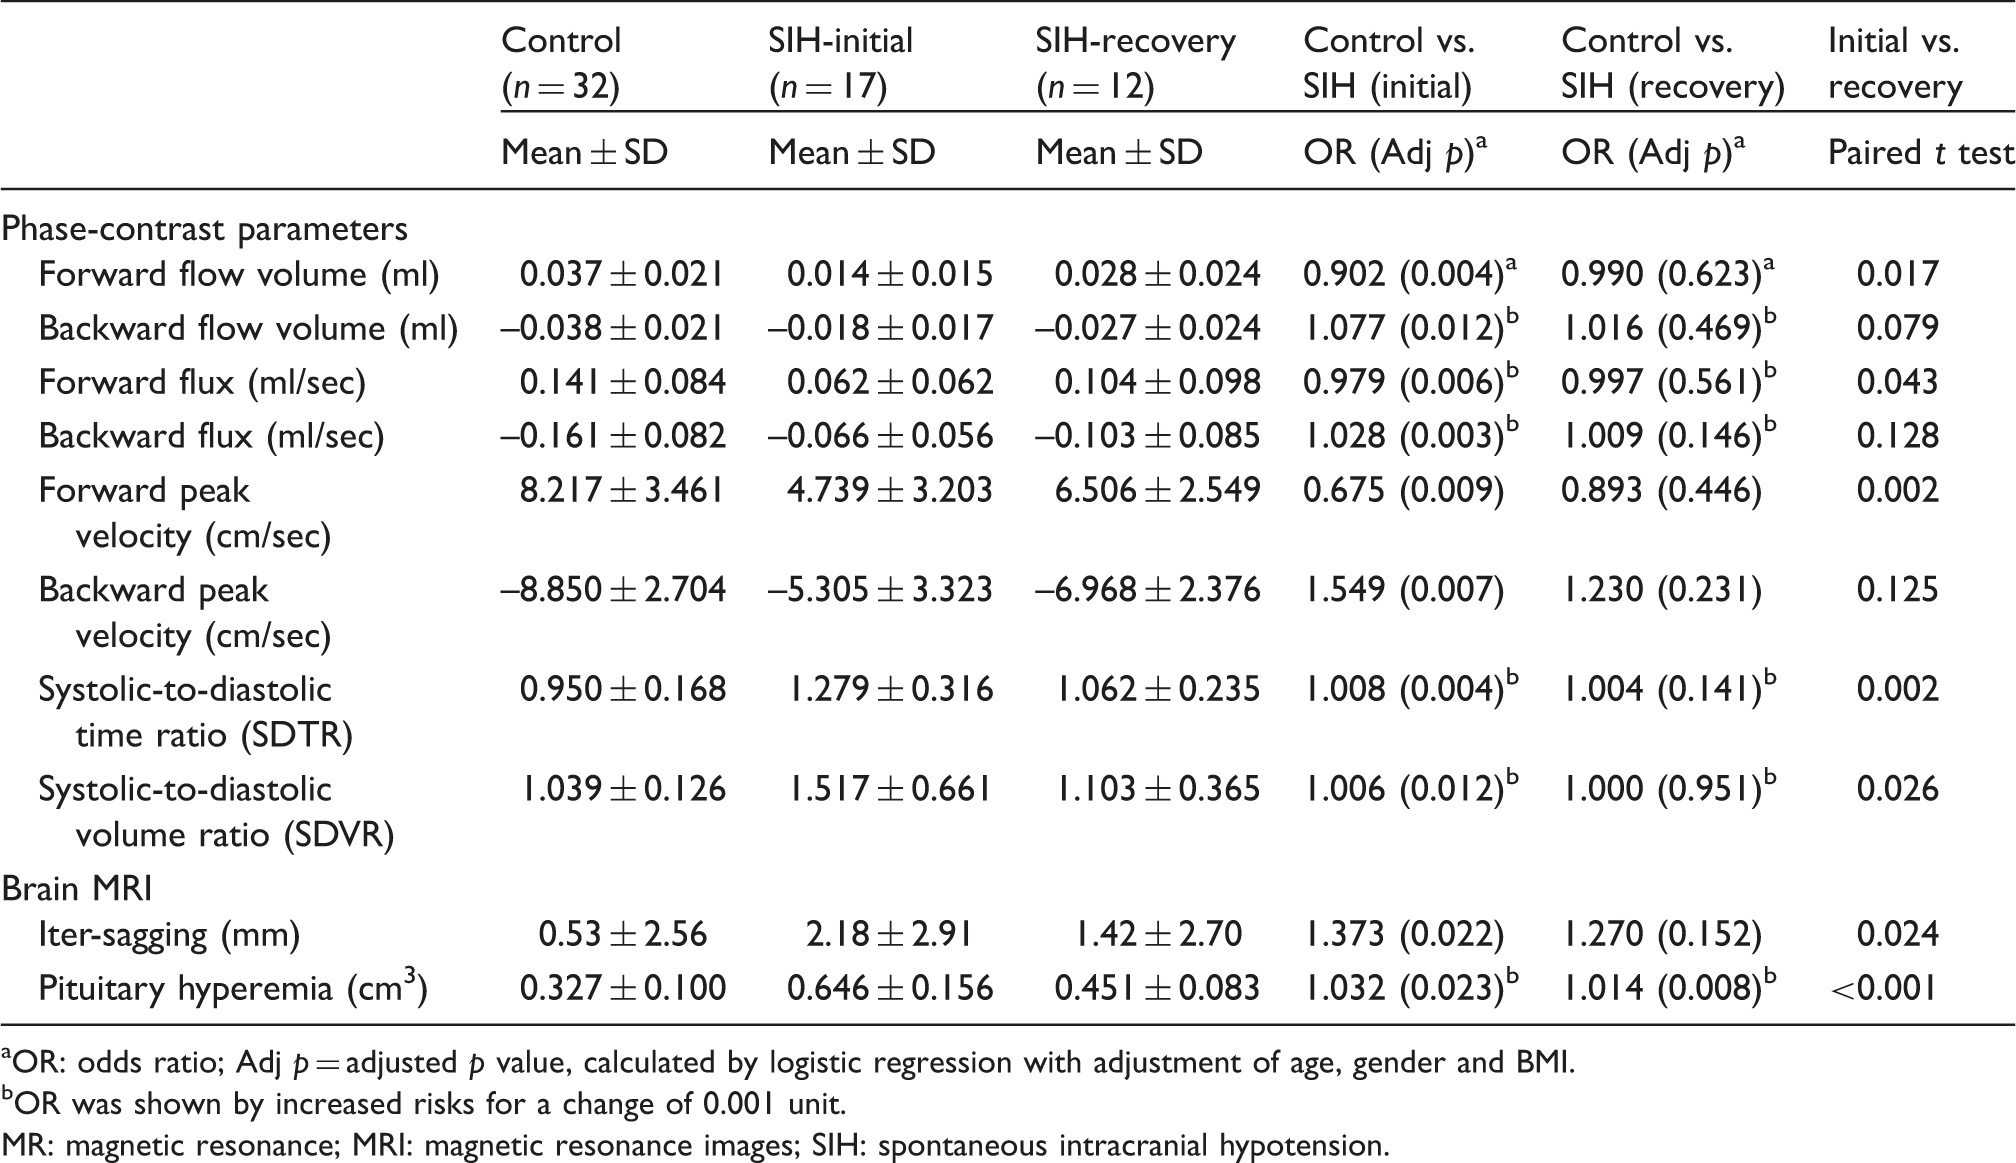
OR: odds ratio; Adj p = adjusted p value, calculated by logistic regression with adjustment of age, gender and BMI. bOR was shown by increased risks for a change of 0.001 unit. MR: magnetic resonance; MRI: magnetic resonance images; SIH: spontaneous intracranial hypotension.
FV
FV significantly decreased in forward (p = .004) and backward (p = .012) values in the SIH-initial group compared to the control group. There were no significant differences in all FV parameters between the control and the SIH-recovery groups. The values increased significantly in forward FV (p = .017) after SIH recovery, but not backward (p = .079).
Flux
Significantly lower values in forward (p = .006) and backward (p = .003) flux in the SIH-initial group compared to the control group were observed. There were no significant differences in both parameters between the control and the SIH-recovery groups. When SIH participants recovered, only forward (p = .043) flux values significantly increased, but not backward (p = .128).
PV
Significantly lower forward (p = .009) and backward (p = .007) PVs in the SIH-initial group compared to the control group were found. No significant differences in both PV parameters between the control and the SIH recovery groups were indicated. There were significant increase in forward (p = .002) PV after SIH recovery, but not for backward (p = .125).
SDTR
The SDTR was significantly higher in the SIH initial group compared to the control group (p = .004). No significant differences between the control and SIH-recovery groups were reported. This ratio significantly decreased (p = .002) in SIH patients after recovery (Figure 1(a)).
Box plot of the (a) systolic-to-diastolic time ratio (SDTR), and (b) systolic-to-diastolic volume ratio (SDVR) in the control group, initial stage of spontaneous intracranial hypotension (SIH) patients (SIH-initial), and recovery stage of SIH patients (SIH-recovery). (c) The cerebrospinal fluid (CSF) flux observed in the aqueduct during one cardiac cycle using the phase-contrast technique. This is a representative sample of one SIH patient during the initial and recovery stages. Flow volume was the area under the curve. The area filled with oblique lines represents the flow volume of the SIH-initial stage. The lengths of the two arrows are the duration of each phase.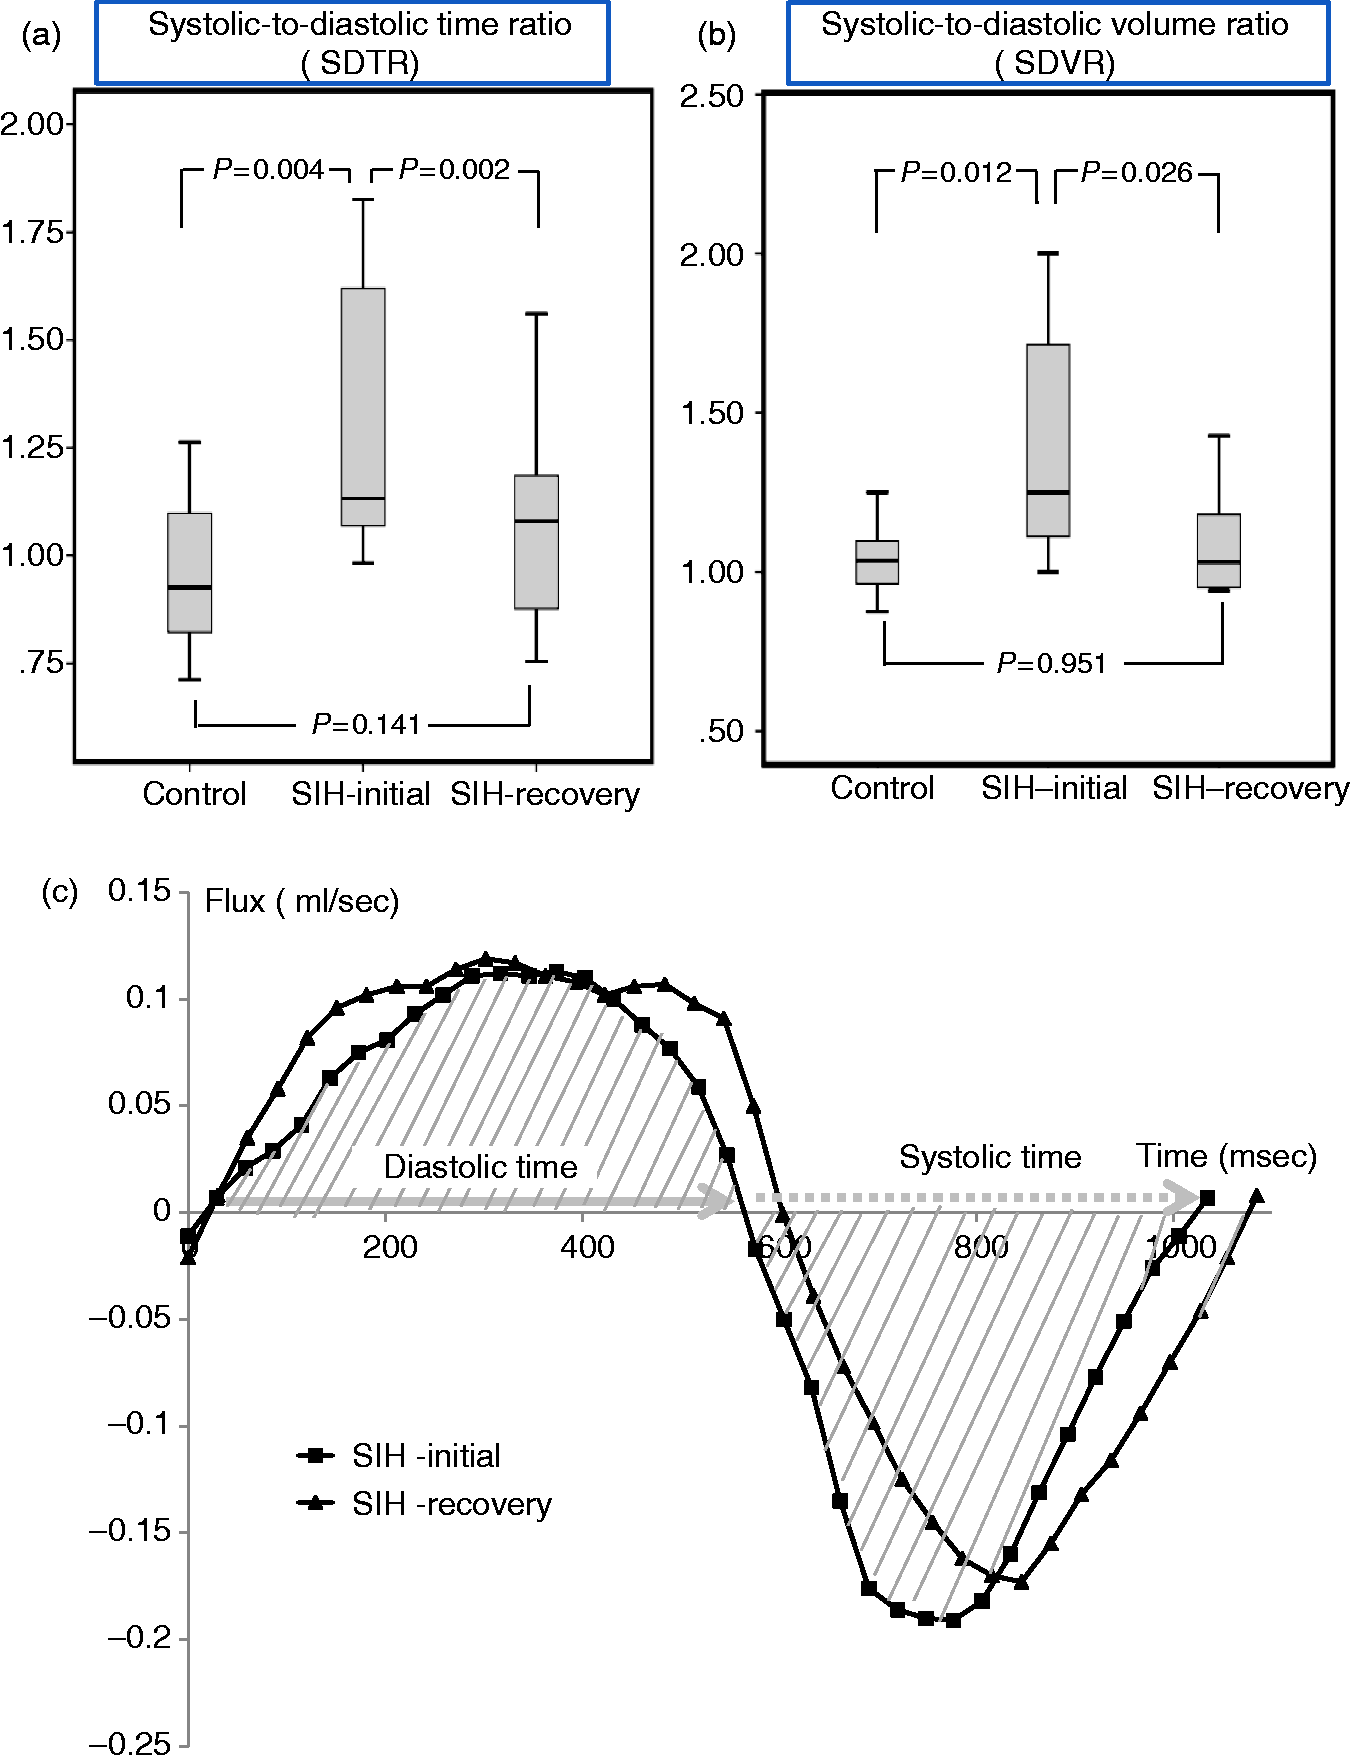
SDVR
The SDVR was significantly higher in the SIH-initial group than in the control group (p = .012). No statistical differences were observed between the control and SIH-recovery groups. The SDVR decreased significantly (p = .026) in SIH after recovery, resulting from the higher recovery rate of forward FV than backward FV (Figure 1(b)).
The CSF flux-time curve of one of our SIH patients was demonstrated in Figure 1(c), revealing significantly increased diastolic time and volume after recovery. Only slight changes occurred during the systolic phase.
Brain MRI
The iter-sagging and the pituitary volume were significantly larger in the SIH-initial group than in the control group (p = .022 and .023). Both signs significantly improved after SIH recovery. However, we noticed a still-significant difference of pituitary volume between the control and SIH-recovery groups (p = 0.008).
The predicting values of all items for SIH diagnosis, presence of DPE and venous engorgement. (This analysis was acquired from comparing the control group to the SIH-initial group.)

SIH: spontaneous intracranial hypotension; DPE: diffuse pachymeningeal enhancement; AUC: area under the curve; MRI: magnetic resonance imaging; Sen: sensitivity; Spe: specificity.
The optimal cut-off value was selected from the highest summation value of sensitivity and specificity in the receiver operating characteristic (ROC) curve. *p < 0.05; **p < 0.001.
The predictive abilities of PC-MR for occurrence of DPE and venous engorgement were also high. The PC-MR cut-off values for presence of DPE and venous engorgement were lower than the cut-off values for SIH diagnosis.
The parameters among the SIH patients with and without DPE, as well as the control group.
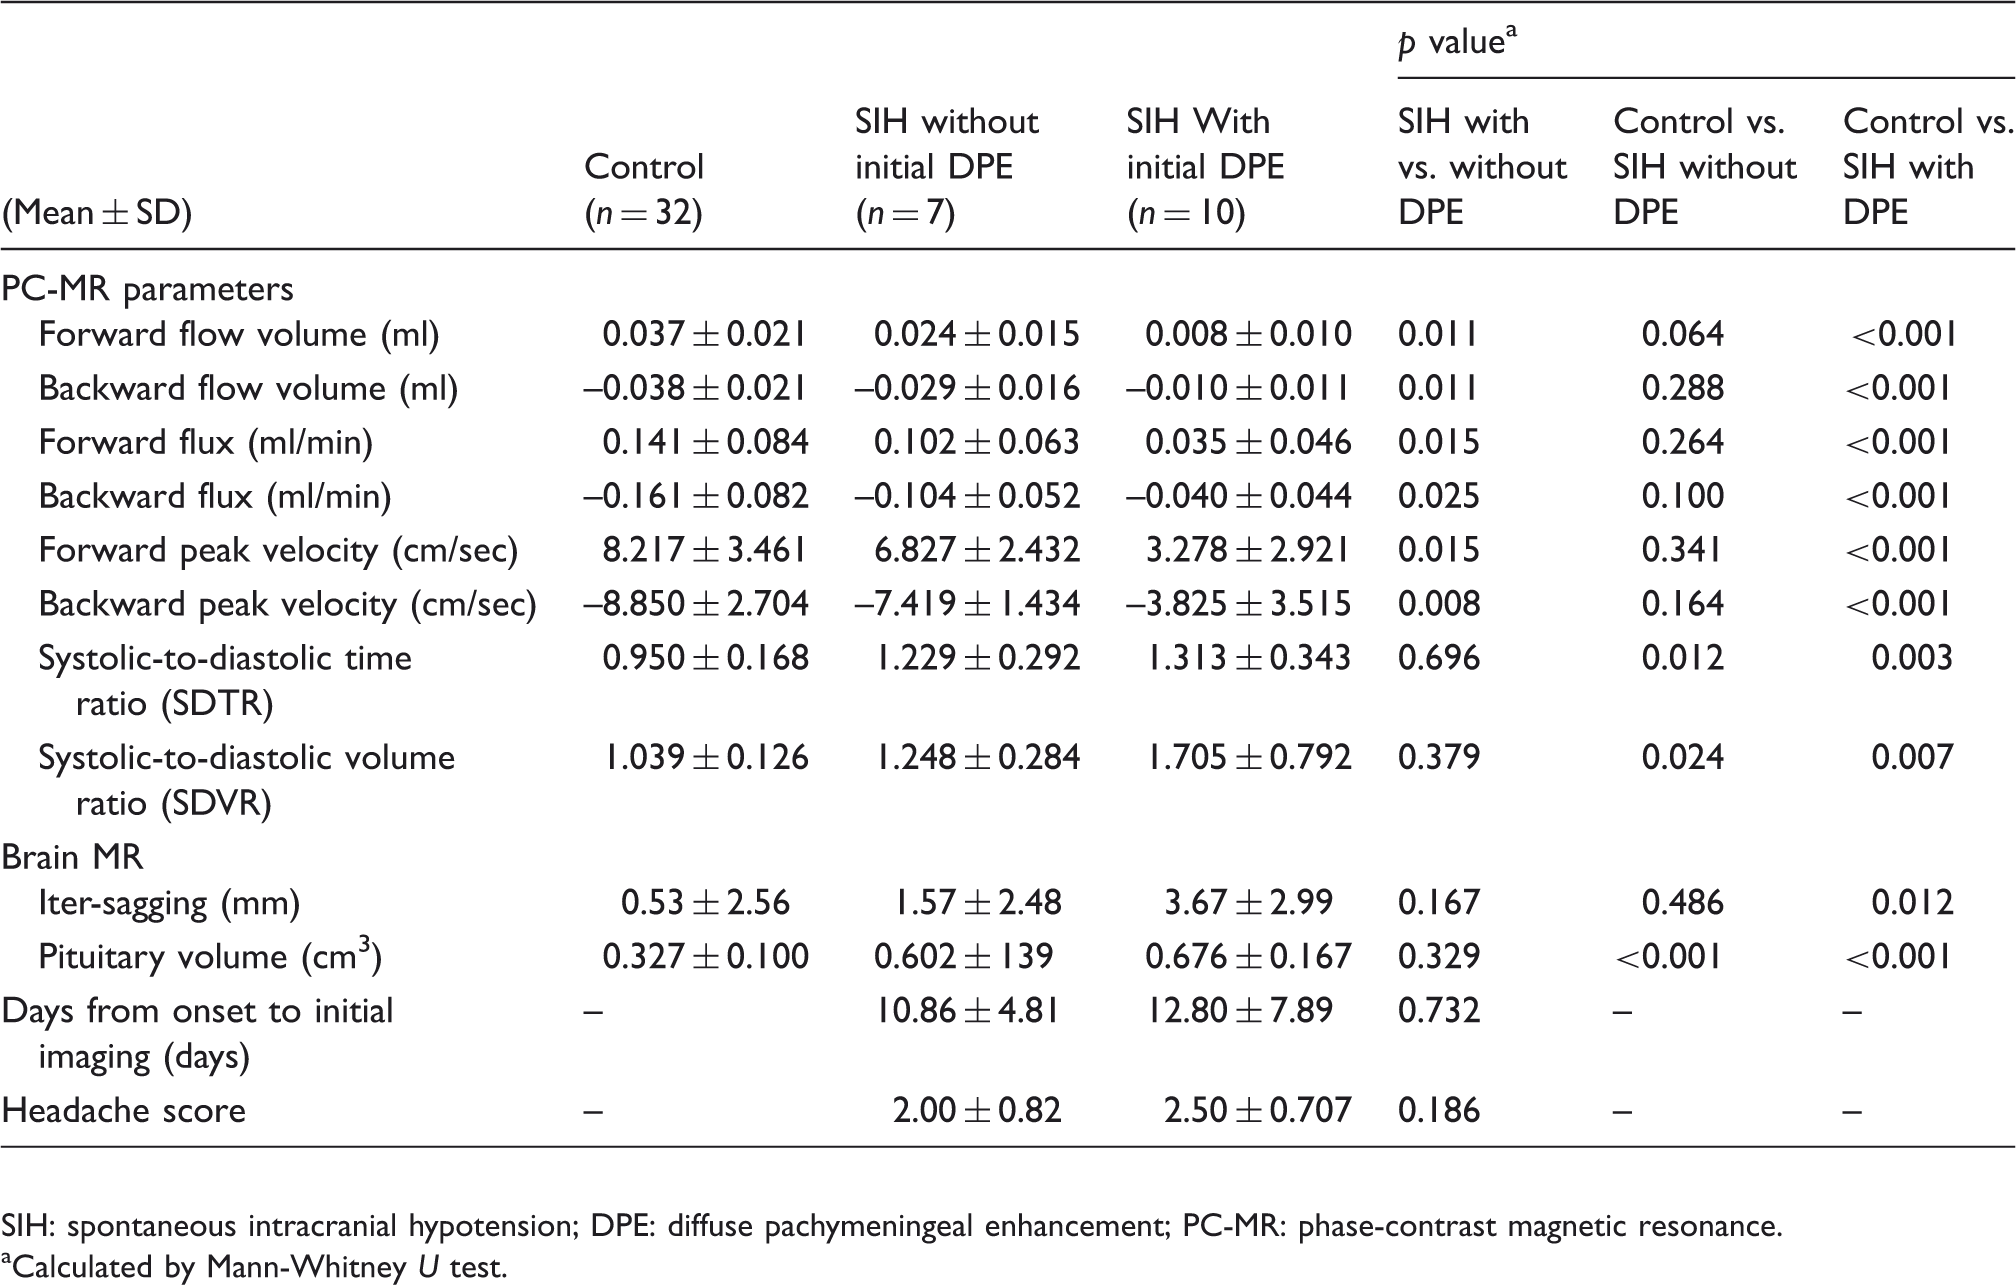
SIH: spontaneous intracranial hypotension; DPE: diffuse pachymeningeal enhancement; PC-MR: phase-contrast magnetic resonance.
Calculated by Mann-Whitney U test.
The correlations among headache score, brain MRI findings, and phase-contrast MRI (PC-MRI) parameters in SIH patients.

MRI: magnetic resonance imaging; PC-MRI: phase-contrast magnetic resonance imaging; SIH: spontaneous intracranial hypotension.
Spearman’s correlation coefficient (rho). *p < 0.05; **p < 0.001.
Discussion
CSF leakage is considered the main cause of SIH syndrome (15). Previously, typical brain images of SIH were explained by the Monro-Kellie hypothesis (16). Within an intact skull, the total volume of the brain, CSF and blood is constant. As soon as CSF volume decreases, compensatory increase of blood or brain parenchyma ensues, especially in the venous system (10). However, some SIH patients have normal CSF opening pressure despite presenting significant CSF leakage (17), and up to one-fourth have normal brain MRIs (18,19). Diagnosis of SIH in orthostatic headache patients remains complicated (20).
CSF flow dynamics are strongly related to the cardiac cycle (21). During the systolic phase, internal carotid arterial flow increases the intracranial blood volume. The elasticity of the dural sac allows CSF out-flushing in a cranio-caudal (backward) direction. During the diastolic phase, the decreased internal carotid arterial flow lowers the intracranial volume. The CSF flows back in a caudo-cranial (forward) direction. The CSF pulsation within the ventricular system presents as the sine waves on flow and velocity maps. Changes in parenchymal compliance, CSF volume, blood volume, or the cardiac cycle, even minimal, can influence the CSF flow. We thought CSF leakage would also influence its flow to some extent and could be reflected in the PC-MR parameters.
In previous studies, different PC-MR values were reported for healthy subjects. These variations might result from various magnetic fields, machines, sites of detection, age (22), sex (22,23), or BMI (22,23). PV varied significantly with age, and it was much higher in subjects younger than 14 years old (22,24). The stroke volume and flux were significantly higher in males compared to females (23). Elderly cases had less parenchyma viscoelasticity and lower CSF flow (23,25). Because age, sex, and BMI could influence the PC-MR parameters, we adjusted them in our data accordingly.
To our knowledge, this is the first serial study to investigate PC-MR parameters between SIH patients and a healthy control group with adjusted common confounding factors. It is also the first report evaluating CSF flow dynamics between the initial and the recovery states in SIH patients. Hasiloglu et al. found smaller forward and backward fluxes and PVs in SIH patients compared with healthy controls (14). In our study, we further found forward FV, flux, and PV significantly increased after treatment. We also noticed that SDTR and SDVR increased in the initial SIH condition, and decreased after recovery. Initial iter-sagging and pituitary volume of the SIH patients were significantly different from those of the control group and after their recovery. No significant differences of PC-MR parameters between controls and the SIH-recovery group existed. However, there were still larger pituitary glands in the SIH-recovery group than the control group in our study. Pituitary enlargement was described in up to two-thirds of SIH patients (26), with the reported heights between 8 to 11 mm (27). But no exact resolution time of its size had been studied. Besides, pituitary volume was influenced by several factors, like age and gender (28). This phenomenon might be due to delayed recovery or intrinsic variation of pituitary size. It might suggest that PC-MR is more accurate than brain images for SIH evaluation.
The decrease in forward FV was greater than the decrease in backward FV in SIH patients. The higher SDTR and SDVR values in SIH patients were related to relatively shorter diastolic time and lower forward FV than those reduced during the systolic phase. These results indicate that within a cardiac cycle, diastolic (forward) CSF flow may play a more important role in SIH pathogenesis.
The diastolic CSF disturbance observed in SIH patients can be explained in a number of ways. First, because the CSF leaks at the spinal level, the returning CSF flow back to the brain decreases. Second, compensatory CSF production secondary to CSF depletion may occur, as proposed by Hasiloglu et al. (14). Therefore, the backward CSF flow is maintained, but not the forward. Third, our results indicated a relatively shorter diastolic time fraction and smaller diastolic volume in SIH patients compared to the control group, without obvious heart rate differences. Normally, in the resting state, the diastolic time is longer than the systolic time (29). The reported SDTR was 0.74 ± 0.12 in healthy young adults (29). Major influencing factors on SDTR were age and heart rate (30), and this ratio increases with age. The systolic phase is less affected by the heart rate to maintain adequate systemic perfusion (29). The so-called “systolic-diastolic mismatch” indicates systolic time-prolonging or diastolic time-shortening. Such a condition usually occurs during exercise, physiological stress, and with hypertension or congestive heart failure (29,31). SIH patients also present with this phenomenon, but the underlying mechanisms are not well known. It might result from increased sympathetic tones or decreased cardiac-filling times.
According to our results, DPE and venous engorgement occurred when patients had much lower FV, flux, and PV than the expected threshed for SIH diagnosis. Both signs would appear later than headache onset, when the CSF leakage reached a certain amount. They disappeared after partial treatment before complete recovery. In our study, there were five SIH patients lacking both DPE and venous engorgement, and two of them did not have iter-sagging either. But all had at least one abnormal PC-MR parameter (supplementary Table 3). Therefore, PC-MR appears to be more sensitive for diagnosis of SIH in the early stage or after partial treatment.
The proportion of absence of DPE was higher in our study (41.2%) compared with the reported 7%–29% in other studies (32). Five among them had the follow-up images before complete recovery, and two developed DPE later. In Table 4, the FVs, fluxes and PVs appear significantly different between SIH patients with and without initial DPE, but not the duration between headache onset to MR images and headache scores. The absolute values of the PC-MR parameters decreased sequentially in controls, SIH without DPE, and SIH with DPE groups; while SDTR and SDVR achieved significant difference between the SIH without DPE and the control groups. This result might suggest that DPE depends on the severity of SIH, and that absence of DPE could not exclude the SIH diagnosis.
Orthostatic headache in SIH patients resolved once buoyant action was restored, and downward stretching of pain-sensitive structures on the meninges ceased (18). In our study, headache scores correlated only with forward and backward PVs, and pituitary volume. Furthermore, some of our SIH patients defined as achieving complete recovery still had mild, nonspecific dizziness or head fullness without an orthostatic pattern. We had performed further imaging follow-up after they were defined as total recovery. The PC-MR parameters showed similar results. There was no visible CSF leak detected on the repeated myelography. Such residual symptoms have also been reported, but without better explanations (33). Because of their relatively healthy condition and lack of primary headache before their SIH occurrence, we assumed it might be the complications of SIH. Further studies are needed to investigate the underlying pathophysiology.
Our study has some limitations. First, we did not perform lumbar punctures to assess the intracranial pressure. We were concerned that iatrogenic dural defects could aggravate SIH symptoms, even though the reported risk was only 5% (2). In addition, we refrained from interfering with CSF dynamics after dural punctures. Second, systemic errors caused by eddy currents or brain motion, as well as nonlinear gradients, partial volume effects, and errors in ROI placement are possible in PC-MR (22). Eddy currents can distort gradient profiles (34), reducing the fidelity of encoded images. Partial volume effects can lead to under-estimations of FV and flow velocity. Larger ROI could decrease the partial volume effects and eddy currents. Therefore, we chose the largest part of the aqueduct, the ampulla, to take measurements. Reliable flow quantification was reported with lumen diameters greater than 1.5 mm (35). The cut-off value was around 1.767 mm2 when converted to the area unit. The average ROI area in our participants was approximately 3 mm2, which was above the cut-off limit. In extremely severe SIH cases, the distorted brainstem could squeeze the aqueduct size, making circling ROIs more difficult, and some measuring errors might exist. Besides, according to Wentland et al. (36), if the PV is lower than 6.4 cm/sec, over-estimations are possible. In our SIH group, both systolic and diastolic PVs were below this level. Therefore, SIH patients might have even lower CSF velocity and volume under this bias. The foremost limitation of this study was the smaller sample size. In addition, we measured only the aqueduct CSF flow for dynamic evaluation. Further studies with a larger sample size and multiple CSF site measurements are needed to more broadly evaluate CSF and venous redistribution in SIH patients.
Conclusion
PC-MR is a highly sensitive and noninvasive tool to evaluate CSF dynamics. Decreased aqueduct FVs, flux, PVs, as well as increased ratios of systolic to diastolic time and volume, are good parameters for SIH diagnosis and treatment follow-up. Besides, diastolic CSF might play a role in SIH pathogenesis.
Clinical implications
Compared with brain magnetic resonance imaging (MRI), the phase-contrast (PC) technique provides sensitive spontaneous intracranial hypotension (SIH) diagnosis and follow-up, especially in mild cases or early disease state. By analyzing PC-MR parameters, the diastolic cerebrospinal fluid (CSF) dynamic may play an important role in SIH pathogenesis. Compared with heavily-T2-weighted images (T2WI) MR myelography, PC-MR is the quantitative way to evaluate intracranial pressure and volume.
Footnotes
Funding
This research received no specific grant from any funding agency in the public, commercial, or not-for-profit sectors.
Conflict of interest
None declared.
Acknowledgments
We would like to express our appreciation to the “Biostatistics Task Force of Taichung Veterans General Hospital, Taichung, Taiwan, ROC” as a consultant for statistical analysis. Furthermore, we would also like to acknowledge with much appreciation the crucial role of the staff of Department of Radiology, Taichung Veterans General hospital, Dr Jyh-Wen Chai and Dr Clayton Chi-Chang Chen, who gave permission to use all required equipment and the necessary materials to complete this study.
References
Supplementary Material
Please find the following supplemental material available below.
For Open Access articles published under a Creative Commons License, all supplemental material carries the same license as the article it is associated with.
For non-Open Access articles published, all supplemental material carries a non-exclusive license, and permission requests for re-use of supplemental material or any part of supplemental material shall be sent directly to the copyright owner as specified in the copyright notice associated with the article.