
Abstract
Objective
We aimed at validating established imaging features of idiopathic intracranial hypertension (IIH) by using state-of-the-art MR imaging together with advanced post-processing techniques and correlated imaging findings to clinical scores.
Methods
Twenty-five IIH patients as well as age-, sex- and body mass index (BMI)-matched controls underwent high-resolution T1w and T2w MR imaging in a 1.5 T scanner, followed by assessment of optic nerve sheaths, pituitary gland, ventricles and Meckel's cave. Imaging findings were correlated with cerebrospinal fluid (CSF) opening pressures and clinical symptom scores of visual disturbances (visual field defects or enlarged blind spot), headache, tinnitus (pulsatile and non-pulsatile) and vertigo. CSF as well as ventricle volumes were determined by using an automated MRI volumetry algorithm.
Results
So-called ‘empty sella’ and optic nerve sheath distension were identified as reliable imaging signs in IIH. Posterior globe flattening turned out as a highly specific but not very sensitive sign. No abnormalities of the lateral ventricles were observed. These morphometric results could be confirmed using MR volumetry (VBM). Clinical symptoms did not correlate with an increase in lumbar opening pressure.
Conclusions
Our study results indicate that lateral ventricle size is not affected in IIH. In contrast, abnormalities of the pituitary gland and optic nerve sheath were reliable diagnostic signs for IIH.
Introduction
Idiopathic intracranial hypertension (IIH) is characterized by an elevated intracranial pressure for which no causative factor can be identified. IIH frequently affects young, obese women of childbearing age. The clinical syndrome was initially established by the Dandy criteria, which underwent several modifications to reflect imaging advances by using computed tomography (CT) and magnetic resonance imaging (MRI) and is now defined in the Headache Classification of the International Headache Society (IHS) (1,2).
Diagnostic management includes neuroimaging techniques to rule out secondary causes for the elevated intracranial pressure. Several imaging findings have been reported to be associated with IIH, including an empty sella turcica, distension of the optic nerve sheath (ONS), slit-like ventricles and a flattening of the posterior aspect of the optic globe (3–8). However, these findings rely on studies that frequently suffer from methodological shortcomings such as small sample size or a retrospective study design. Furthermore, these studies frequently do not take into account body mass index (BMI) despite the importance of body weight in IIH (4,7).
Our study aimed at evaluating validity and diagnostic reliability of the described MR findings in IIH patients. In a second part the study aimed at investigating possible correlations between the extent of abnormal neuroimaging findings and the severity of clinical symptoms commonly associated with IIH.
Methods
The study was approved by the local ethics committee of the Charité – Universitätsmedizin Berlin (EA1/266/09). Written informed consent was obtained from all patients and healthy volunteers participating in the study.
Patients and controls
Characteristics of participants and results of morphometric and volumetric analysis.

Numerical data are presented as mean ± standard deviation, categorical data as numbers (n) and percentage (%).
f: female; m: male; BMI: body mass index; ICP: intracranial pressure (measured as lumbar opening pressure); CSF: cerebrospinal fluid; ON: optic nerve; ONS: optic nerve sheath.
MRI
MRI was performed using a 1.5 T scanner (Siemens Avanto Magnetom, Erlangen, Germany). A commercially available surface coil (Siemens) with a diameter of 7 cm in addition to the normal circularly polarized head coil was used. The surface coil was placed over the eye of maximum visual disturbances within the head coil and fixed with a tape. T2-weighted (T2w) high-resolution coronal images were acquired with the surface coil along the optic tract. A coronal turbo spin echo (TSE) sequence was used to evaluate the optic nerve (ON), ONS and the posterior globe flattening (repetition time (TR) 6960 msec, echo time (TE) 99 msec, field of view (FOV) 85 × 85 mm2, matrix size 256 × 256 mm2 in-plane resolution 0.33 × 0.33 mm2, slice thickness of 2 mm, acquisition time (TA) 7:20 sec). Axial and sagittal T2w TSE whole brain measurements were acquired with the head coil (TR 5170 msec, TE 99 msec, FOV 170 × 170 mm2, matrix size 256 × 320 mm2, in-plane resolution 0.66 × 0.53 mm2, TA 5:27 sec). A slice thickness of 3 mm was used to evaluate the pituitary gland, sella turcica, Meckel's cave (MC) and ventricle size. For volumetric analysis a magnetization prepared rapid gradient echo (MPRAGE) sequence with nearly isotropic voxel size was used (TR 1940 msec, TE 2.91 msec, FOV 260 × 260 mm2, matrix size 256 × 256 mm2 in-plane resolution 1.02 × 1.02 mm2, slice thickness 1 mm, TA 4:31 sec).
A two-dimensional time-of-flight (2D TOF) venography (TR 23 msec, TE 6.5 msec, FOV 250 x 250 mm2, slice thickness 2 mm, TA 7:40 sec) was obtained to evaluate sinus vein stenosis (SVS) and to exclude sinus vein thrombosis (SVT) as secondary IIH causes.
Morphometric analysis
Maximum ONS and ON diameters were measured on coronal T2w images perpendicular to the ON on the slice with the maximum diameter of the ONS (9). Maximum pituitary gland height was measured on the midsagittal T2w images. The posterior aspect of the optic globe was examined for flattening relative to the normal curvature of the globe according to Brodsky and Vaphiades (8). The maximum diameters of the ventricles were measured on axial T2w images. Cerebral SVS was assessed by 2D TOF venography. The raters for morphometric measurements were blinded in respect to the subject group (IIH patients vs. healthy volunteers). The severity of SVS was determined by a neuroradiologist and rated according to the modification of the venous conduit score of Farb et al. (10) and Bussiere et al. (11). The classification was defined by the degree of stenosis on axial images and maximum intensity projection images. A score of 0 represented the absence of any discontinuity, 1 represented a stenosis of less than 50% and 2 a stenosis larger than 50% of the lumen.
Volumetric analysis
The volumes of cerebrospinal fluid (CSF), lateral ventricles and third ventricle were determined using a fully automated and observer-independent method of atlas- and mask-based MRI volumetry that makes use of algorithms of the SPM5 software (Statistical Parametric Mapping software, Wellcome Trust Centre for Neuroimaging, London, UK) and has been described in detail elsewhere (12,13). In short, using the ‘unified segmentation' tool of SPM5 with its default settings, the individual brain in the T1-weighted MPRAGE sequence is normalized to the standard brain of the Montreal Neurological Institute (MNI) included in the SPM5 distribution and segmented into different brain compartments, i.e. gray matter, white matter and CSF. The segmentation results in ‘modulated’ and ‘unmodulated’ images for the different tissue compartments. Modulation compensates for dilation or shrinkage during spatial normalization and has the effect of preserving the total amount of signal from the respective tissue class in the normalized partitions (14). In order to determine the volume of a specific intracranial structure or compartment, a corresponding mask (either custom made or derived from a probabilistic brain atlas) is multiplied with the modulated image of the desired tissue class. The values of all voxels in the resulting image are summed up and divided by 1000 to get the volume of the investigated structure or compartment in ml units. Due to modulation of the tissue images, the effect of normalization (i.e. extension or shrinkage of the investigated structure) is compensated for so that the computed volume represents the volume of the original structure/compartment in native space. For the total intracranial CSF volume the voxel values in the modulated CSF image can be directly summed up while for the subspaces of third and lateral ventricles a multiplication with custom-made masks is required. The creation of these masks was based on the T1-weighted volume data sets of 150 controls acquired at five different MR scanners. This population is different from the healthy controls investigated in this study and has been described in detail elsewhere (12). The 150 data sets were normalized to MNI space and segmented by the ‘unified segmentation’ algorithm of SPM5, again using default settings. The resulting ‘unmodulated’ CSF images were averaged to get a mean CSF image. In this image, third and lateral ventricles were manually delineated in their outermost boundaries. The final masks were formed from all voxels of the mean CSF image falling within these boundaries and exceeding a lower threshold of 0.1, i.e. where the average CSF probability of the 150 controls was at least 10%.
Clinical assessment
During hospitalization all IIH patients underwent lumbar puncture and CSF opening pressures were obtained. Measurements of visual acuity and perimetry of the visual field were performed. Patients further had to report their headache intensity on a visual analog scale (VAS) prior to lumbar puncture.
Headache intensity was compared to neuroimaging abnormalities in regard to the width of the third and fourth ventricles, pituitary gland, ONS and surrounding liquor space as well as the measured opening pressure. Furthermore, opening pressures were compared to the dimensions of the third and fourth ventricles, the pituitary gland, and ONS of the liquor space surrounding the ON.
Statistical analysis
Statistical analysis was performed using XLSTAT Version 2011.3.01 (Addinsoft SARL, New York, NY, USA). The Student's t test and Pearson's correlation coefficients (r) and correlation matrices were used to compare the group means. Data were expressed as mean values and standard deviation (SD). Statistical significance was assumed at p < 0.05.
Receiver-operating characteristic (ROC) analysis was used to select an optimal cut-off value for prediction and to assess the predictive value in terms of sensitivity, specificity and accuracy (15). Selection of the optimal cut-point was based on the Youden index, i.e. the maximum sum of sensitivity and specificity. The 95% confidence interval for the AUC was calculated by bootstrapping.
Results
ON
Changes in ON diameters were not observed. However, the diameters of the left and right ONS were significantly increased in IIH patients. The mean ONS diameters were increased from 4.33 ± 0.69 mm to 6.09 ± 1.10 mm (left, p < 0.001) and from 4.28 ± 0.77 mm to 5.88 ± 0.86 mm (right, p < 0.001) (Figures 1(a, b) and 3(a, b); Table 1).
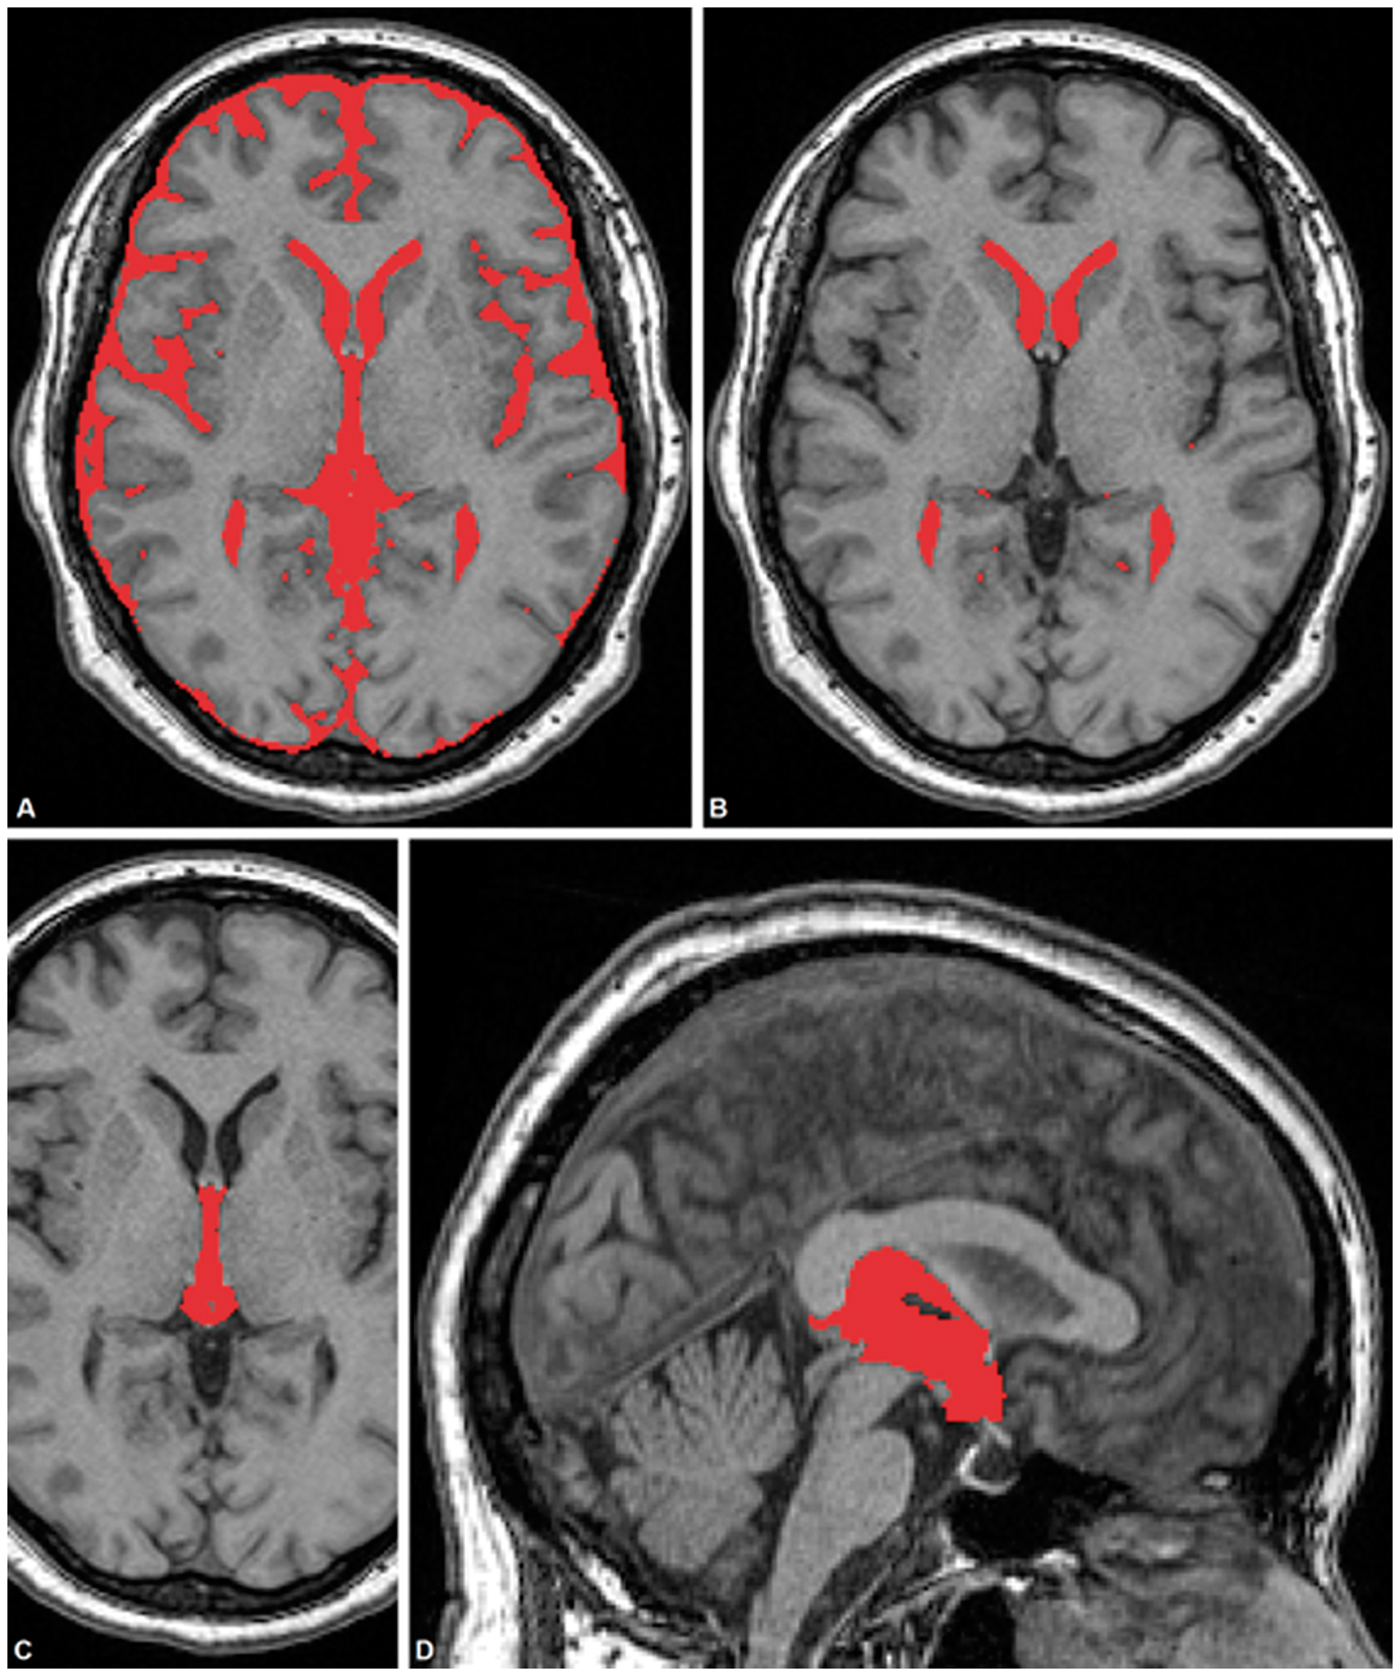
Morphometric MRI findings. Typical MR imaging findings in patients with IIH compared to age-, sex- and BMI-matched healthy volunteers. The images show the locations chosen for the measurements of the diameter of the optic nerve and the optic nerve sheath (a, b), pituitary gland (c, d), Meckel's cave (e, f) and ventricle size (g, h). The venography images demonstrate an unaffected transverse sinus (i) and a typical imaging finding of an observed stenosis (j). Volumetric MRI findings. Segmentation of total CSF volume, lateral ventricles and third ventricle resulting from automated MRI volumetry.
Patients suffering from IIH had a left ONS diameter larger than the cut-off value of 5.60 mm (sensitivity 80.0%, specificity 96.0%, accuracy 88.0%) and a right ONS diameter larger than the cut-off value of 5.50 mm (sensitivity 72.0%, specificity 96.0%, accuracy 84.0%). ROC analysis showed significant differences according to the area under the curve (AUC) of 0.926 for the left ONS diameter and 0.922 for the right ONS diameter (Figure 4 and Table 2).
Comparison of morphological parameters in patients and controls. Indicated are the diameter of the optic nerve (a) and optic nerve sheath (b), sagittal height of the pituitary gland (c), length of the Meckel's cave (d) and volumes of the third and lateral ventricles (e) in IIH patients ( Sensitivity, specificity and accuracy for ONS diameter and height of the pituitary gland. ONS: optic nerve sheath; MRI: magnetic resonance imaging; AUC: area under the curve. ) compared to healthy volunteers (
 ). Figure 3(f) reflects the number of observed stenoses in IIH patients as compared to controls.
Pituitary gland
The midsagittal height of the pituitary gland was significantly reduced to 3.23 ± 1.52 mm) in IIH patients as compared to controls (5.55 ± 1.24 mm, p < 0.001) (Figure 3(c); Table 1). In IIH patients an increased pituitary AP diameter of 10.97 ± 2.17 mm was observed as opposed to 9.2 ± 1.57 mm (controls) (p < 0.01). In contrast the transverse diameter was not affected (12.32 ± 2.16 mm in IIH vs. 12.32 ± 1.91 mm in controls) (Figure 1(c,d) and Table 1).
ROC analysis. Indicated are the results of the ROC analysis for the ONS diameter and the height of the pituitary gland.
IIH patients had a pituitary height lower than the cut-off value of 4.80 mm (sensitivity 88.0%, specificity 69.57%, accuracy 82.0%). ROC analysis revealed a significant difference in the AUC of 0.872 for the height of the pituitary gland (p < 0.0001) (Figure 4 and Table 2).
MC
Morphometric measurements revealed a bilateral increase in MC length in IIH patients (Figure 3(d); Table 1) (13.81 ± 2.22 mm left side; 13.28 ± 2.38 mm right side) as compared to controls (11.34 ± 1.97 mm, p < 0.001; 11.36 ± 1.74 mm, p < 0.01, respectively). In contrast, a significant increase in MC widths could be observed only on the left side (5.34 ± 1.23 mm in IIH vs. 4.48 ± 0.78 mm in controls, p < 0.01) (Figure 1(e, f); Table 1).
Posterior globe flattening
Posterior globe flattening could be observed in seven out of 25 patients whereas no control subject revealed such findings (specificity 100%, sensitivity 28%).
Ventricular size
Morphometric analysis of the lateral ventricles showed no significant differences in regard to either the maximum width of the anterior horns in IIH patients as compared to healthy volunteers (31.80 ± 3.14 mm vs. 32.54 ± 4.09 mm in controls, p > 0.05) (Figure 1(g, h)) nor in regard to the minimum width (13.42 ± 3.35 mm vs. 14.65 ± 3.11 mm in controls, p > 0.05). Also, the Evans Index (maximum width between the anterior horns of the lateral ventricles divided by the maximum inner skull diameter) did also not reveal any significant differences (0.25 ± 0.03 (IIH) vs. 0.25 ± 0.03 (controls), p > 0.05).
In IIH patients the maximum widths were decreased with respect to the third ventricle (3.47 ± 1.53 mm (IIH) vs. 4.48 ± 1.48 mm (controls), p < 0.05) as well as the fourth ventricle (12.24 ± 1.68 mm (IIH) vs. 11.18 ± 1.25 mm (controls) (p < 0.05) (Table 1).
Absolute volumes of total intracranial CSF amounted to 283.7 ± 70.2 cm3 in patients and 295.8 ± 78.4 cm3 in controls (p > 0.05). Mean volumes of the lateral ventricles were 16.6 ± 8.3 cm3 vs. 18.1 ± 10.3 cm3 (IIH patients vs. controls, p > 0.05). Mean volumes of the third ventricle amounted to 2.7 ± 1.2 cm3 in IIH subjects as well as in controls. The mean relative volumes of third ventricle and lateral ventricles corrected for intracranial CSF volumes (ICV) and standardized to the mean ICV of healthy controls were 2.8 ± 1.0 cm3 and 17.0 ± 7.6 cm3 for patients and 2.7 ± 1.0 cm3 and 17.9 ± 9.1 cm3 for controls. Volumetric analysis did not show significant differences in lateral or third ventricle volumes between patients and controls group (Figure 2, 3(e) and Table 1).
Cerebral sinus vein diameter
SVSs and hypoplasias were observed in IIH as well as in matched control subjects (Figure 3(f)). A total of nine SVSs were observed in IIH patients compared to one stenosis in a healthy control subject. Hypoplasias of cerebral sinus veins were detected in 13 IIH patients and nine healthy volunteers.
Clinical correlations
Headache intensity, lumbar opening pressures and BMI neither correlated significantly to the abnormalities seen in regard to ventricle sizes, pituitary gland, ONS and surrounding ON liquor spaces, nor did they correlate to each other.
Discussion
Neuroimaging in IIH patients is usually performed to exclude secondary intracranial hypertension. Following the introduction of CT and especially MRI, subtle abnormalities could be linked to IIH. However, studies providing a systematic analysis of these abnormalities remain scarce and inconclusive. Existing studies frequently included only small sample sizes, were predominantly of a retrospective nature, were conducted prior to the availability of CT and MRI or did not take into account BMI, which is especially important because of the strong association between IIH, weight gain and obesity (3,6,16–19). The association between IIH and obesity goes beyond a simple correlation since resolution of the diagnosis is associated with a weight loss and the risk of recurrence increases when weight is regained (16,17,19). Obesity-induced elevation of intraabdominal and consecutive intrathoracic pressure has been proposed as a possible underlying cause for IIH, albeit this would explain only an association to obesity but not female preponderance.
Based on the pathophysiologic theories for IIH, initial studies on IIH-associated neuroimaging signs were mainly focused on alterations in ventricular sizes, pituitary gland and ON diameters (20). The interest in ventricular size emerged from early studies using plain skull X-ray film or ventriculography as well as from early CT studies indicating a decreased size of the lateral ventricles (slit-like ventricles) in association with IIH (21–24). Recently, this finding has been questioned in a retrospective study (7). In the present study we did not observe morphometric abnormalities in the size of the lateral ventricles or the Evans Index figures, nor were there volumetric differences recorded by advanced post-processing techniques. These findings fit into the current pathophysiological concept of IIH since CSF pressure increases should enlarge rather than reduce ventricle sizes. In contrast, we did observe significant reductions in the widths of the third and fourth ventricles in IIH, albeit not accompanied by significant volumetric changes. MC morphometry showed increases in length, but not in MC width, whereas Degnan and Levy report MC narrowing (5).
The bilateral increase in the diameter of ONS and the perineural liquor space around the ON in IIH patients correlates well with the presence of bilateral papilloedema, which, after headache, is the most frequent clinical finding of IIH. Our findings support the exigency of closely monitoring visual field and acuity to prevent neuropathy of the ON and consecutive vision loss as well as to determine treatment strategies. It is assumed that increased intracranial pressure leads to increased transmission of CSF into the intraorbital ONS, which impedes axoplasmic transport of synaptic vesicles, organelles and molecules followed by ON fiber swelling and flattening of the posterior globe (25).
Pathophysiological concepts for IIH also include venous outflow obstruction, increased CSF production, reduced CSF absorption, increased interstitial fluid volume, increased blood volume or even hormonal factors like increased estrogenicity (4,18). Among these, the increased resistance in venous drainage due to SVS or hypoplasia with a resulting diversion of drainage into epidural vessels with an associated increase in intracranial pressure (10,26–31) is subject to extensive debate and research efforts because of potential therapeutic implications. In the present study we did observe SVS and hypoplasias in IIH patients as well as in healthy volunteers (Figure 3(f)), somewhat contradicting the recently reported high neurointerventional cure rates in IIH by sinus vein stenting (26,27,32). However, it has to be noted that in the present study TOF angiography was used for the assessment of sinus vein abnormalities. Therefore, compared to CT angiography (CTA) or digital subtraction angiography (DSA) and despite analysis by a highly experienced observer, results are slightly more prone to misinterpretation because of the inherent technical limitations of TOF MR angiography.
Elevated intracranial pressure is not only considered to be the direct causative mechanism of the observed neuroimaging abnormalities but also of the constant, dull headache frequently associated with IIH. However, no studies exist to confirm this assumption (1,6,20). Therefore, the second part of the study aimed at investigating a possible correlation between the described neuroimaging findings, intracranial pressure (measured as lumbar opening pressure) and the headache associated with IIH. In the present study no correlations between the extent of neuroimaging abnormalities and clinical symptom scores or CSF opening pressures could be established. These results suggest that anatomic abnormalities are rather indirect or comorbid changes than direct results of increased intracranial pressure. Also, intracranial pressure and headache intensity did not correlate. This is an important finding since the reduction of intracranial pressure through lumbar puncture is believed to alleviate headache. However, the causative relationship between increased intracranial pressure in IIH and headache has been questioned in the recent literature (33). Our finding is further in agreement with the fact that intracranial pressure reduction by lumbar puncture is short-lasting, as pressure returns to pre-puncture levels after only a few hours but headache relief persists. One study reported that following drainage of 15–25 ml of CSF, pressure returned to pre-drainage levels within 82 minutes (34). Therefore, although the temporary pressure reduction does positively affect the visual symptoms, its effect on headache intensity might rely on a placebo effect. This assumption is also endorsed by the fact that clinical trials for headache treatments suffer from significant placebo effects, which are further pronounced in more invasive treatment efforts (35).
In summary, the present study indicates that size changes of the pituitary gland, ONS and its surrounding liquor space are reliable MRI signs for the diagnosis of IIH. Posterior flattening of the orbital globe is a highly specific IIH criterion, yet of limited benefit for establishing the diagnosis because of its low sensitivity. Reduction in lateral ventricle sizes as well as MC diameters cannot be used as diagnostic criteria, based on our findings. Abnormalities observed in neuroimaging did not correlate to lumbar opening pressure or IIH-associated headache.
Clinical implications
Morphometric changes in IIH patients compared to age-, sex- and BMI-matched controls. Volumetric changes in IIH as analyzed by automated, observer-independent MR volumetry. Clinical correlations between imaging findings and clinical scores.
Footnotes
Funding
This research received no specific grant from any funding agency in the public, commercial, or not-for-profit sectors.
Conflict of interest
None declared.