
Abstract
Aim
The aim of this article is to determine if lightning is associated with the frequency of headache in migraineurs.
Methods
Participants fulfilling diagnostic criteria for International Headache Society-defined migraine were recruited from sites located in Ohio (n = 23) and Missouri (n = 67). They recorded headache activity in a daily diary for three to six months. A generalized estimating equations (GEE) logistic regression determined the odds ratio (OR) of headache on lightning days compared to non-lightning days. Other weather factors associated with thunderstorms were also added as covariates to the GEE model to see how they would attenuate the effect of lightning on headache.
Results
The mean age of the study population was 44 and 91% were female. The OR for headache was 1.31 (95% confidence limits (CL); 1.07, 1.66) during lighting days as compared to non-lightning days. The addition of thunderstorm-associated weather variables as covariates were only able to reduce the OR for headache on lightning days to 1.18 (95% CL; 1.02, 1.37). The probability of having a headache on lightning days was also further increased when the average current of lightning strikes for the day was more negative.
Conclusion
This study suggests that lightning represents a trigger for headache in migraineurs that cannot be completely explained by other meteorological factors. It is unknown if lightning directly triggers headaches through electromagnetic waves or indirectly through production of bioaerosols (e.g. ozone), induction of fungal spores or other mechanisms. These results should be interpreted cautiously until replicated in a second dataset.
Introduction
Migraine sufferers often self-report that weather factors trigger headache attacks, but past studies investigating this relationship have produced varying results (1–3). High barometric pressure has been reported to increase the frequency of headache in several past studies (4–8) while others have shown the opposite results (9) or no effect at all (10,11). Likewise, high temperature (6,9) and humidity (6,12) have been associated with a higher frequency of headache in some studies, but others (8,10,11,13) have failed to replicate these findings. Ultimately, little consensus can be reached regarding the role of weather factors in the precipitation of headache in migraineurs.
Many of the past studies investigating the effect of weather on migraine headache have focused on changes in single meteorological factors, which may confound the relationship as rarely do meteorological variables change in isolation. In fact, most weather fronts are a synoptic representation of composite weather events, which encompass a confluence of meteorological factors that occur in a specific temporal sequence. The Sharav and Chinook winds are examples of composite weather events. Sulman and colleagues reported that migraines occurred in 20–30% of the population one to two days before the arrival of Sharav winds in Israel (14). Another study found that migraine headaches were significantly more common the day before and the day of Chinook winds in Canada (odds ratios (ORs) of 1.24 and 1.19, respectively) (15). Therefore, limited data suggest that composite weather events such as the Sharav and Chinook winds may be associated with an increased frequency of migraine headache.
Thunderstorms also represent composite weather events that are often accompanied by changes in temperature, humidity, barometric pressure, and wind speed. Three past studies have failed to demonstrate any significant relationship between thunderstorms and the frequency of headache and/or migraine (10,11,13). However, these studies relied on the visualization of lightning or the sound of thunder heard by personnel at local weather stations to define a thunderstorm day. None of these studies used data obtained from ground sensors to identify electromagnetic radiation that emanated from cloud-to-ground strikes, which provides a more accurate depiction of the presence of lightning and can also estimate the location, frequency and current of lightning strikes.
The purpose of our study was to define the role of lightning in the provocation of headache in migraineurs. Lightning is viewed as a potentially influential weather event because of its potent electromagnetic properties and its association with the turbulent weather of thunderstorms. The primary objective of our study was to determine if the frequency of headaches and/or migraines is increased on lightning days as compared to non-lightning days in migraineurs. A secondary objective was to ascertain if lightning has a unique effect on headache in migraineurs after controlling for the meteorological factors associated with thunderstorms.
Methods
This was an observational cohort study that used headache data obtained from two past clinical trials that were conducted in Cincinnati, Ohio, and St. Louis, Missouri. Participants completed a daily headache diary for three to six months that included the presence or absence of headache, the peak severity of headache (rated on a 0–10 scale) and associated symptoms such as nausea, vomiting, photophonia, and phonophonia. The study was approved by the institutional review boards of the University of Cincinnati and St. Louis University.
Cincinnati dataset
This randomized, double-blind, placebo-controlled trial investigated the effects of medical oophorectomy on the frequency and severity of migraine headache in premenopausal female migraineurs. The inclusion criteria were the following: 1) women 21–45 years of age, 2) International Classification of Headache Disorders first edition (ICHD-I) diagnosis of migraine headache, 3) regular menstrual periods every 25–35 days, and 4) moderate to severe headaches on three or more days during non-perimenstrual time periods (16).
St. Louis dataset
This clinical trial compared the frequency and disability of headaches in those randomized to patient education (e.g. avoidance of trigger factors, appropriate use of abortive meds) or usual care. The inclusion criteria were the following: 1) ICHD second edition (II) diagnosis of migraine headache occurring four to 20 days per month, 2) 18–65 years of age, and 3) no change in the abortive and preventive treatments for migraine during the preceding three months (17).
Weather data
Vaisala Inc provided the location, current, and polarity of all cloud-to-ground lightning strikes around the Cincinnati and St. Louis areas during the study periods. This company’s sensors detect electromagnetic signals emanating from lightning that are combined with time-of-arrival technology to identify cloud-to-ground lightning strikes with 90% efficiency and determine the location of lightning strikes within 500 meters. Surface weather variables were recorded on an hourly basis from three ground stations in Cincinnati and five in the St. Louis area and were obtained from the archives of the National Climatic Data Center. Surface weather variables included dry bulb temperature, relative humidity, wind speed, wind direction, barometric pressure, and precipitation. Hourly measurements of insolation, a measure of solar radiation, were obtained from the National Oceanic Atmospheric Administration Geostationary Operational Environmental Satellite (GOES) system for the St. Louis area and from ground sensors for the Cincinnati area. Data on two instability factors (e.g. convection available potential energy (CAPE) and lifted index (LI)) were recorded every three hours and obtained from the archives of the National Center for Environmental Prediction. Instability indices represent atmospheric measurements used by meteorologists to predict conditions that are favorable for thunderstorms and unstable weather conditions. A CAPE index equal to 0 indicates weather stability while values 1–1000, 1000–2500, and > 2500 indicate mild, moderate, and extreme weather instability, respectively. An LI value less than 0 represents an unstable weather pattern while a value ≥ 0 represents stable weather. The instability indices and insolation data had recorded values every 19.5 miles and 8.64 miles, respectively. The daily means of the hourly weather variables, insolation data, and instability indices were used for all analyses.
The reference location for each participant was the longitude and latitude of the nearest post office in their home zip code. It was necessary to use the longitude and latitude of the postal address as opposed to that of their home address in order to avoid disclosure of protected health information. The weather data (e.g. surface weather variables, insolation, and instability indices) assigned to each patient represented the closest measurement to that postal zip code and in all cases was < 30 miles from this location. Likewise, the distance of all lightning strikes was calculated from each participant’s reference location.
Statistical analysis
The primary outcome measures for this study were the frequency of headache and migraine. A headache day was defined as the presence of any headache type during a given day while a migraine day was defined as a headache day with a peak headache severity of ≥ 4 and the presence of one of the following associated symptoms: 1) nausea or vomiting or 2) both photophonia and phonophonia. Secondary outcome measures were the frequency of new onset headache and migraine, which were defined as the presence of headache or migraine on a given day after controlling for the presence of headache or migraine on the two previous days. Controlling for the previous days of headache or migraine was accomplished by using one- and two-day lags as independent predictors in the subsequent analyses.
Generalized estimating equations (GEE) with a logit link function were used to determine the OR of headache and migraine on lightning days as compared to non-lightning days. A lightning day was defined as ≥ one lightning strike occurring within 25 miles of a patient’s postal zip code. A 25-mile radius around a patient’s postal zip code was chosen as this was an area that an individual patient would most likely reside in throughout a day. The mean current of lightning strikes per lightning day and the frequency of lightning strikes per lightning day were also used as predictors in the GEE model in separate analyses.
Additionally, a propensity model was developed to predict the probability of the presence of lightning using a logistic regression with daily surface weather factors as predictors. The propensity score ranged from 0 to 1, with 0 representing a minimal probability of lightning and 1 representing a maximal probability of lightning. The surface weather factors used in the propensity model were compound variables determined from a de novo principal components analysis of barometric pressure, humidity, temperature, insolation, wind speed, wind direction, and precipitation. Components that had Eigen values > 1.0 after varimax orthogonal rotation were used in the propensity model. Weather factor values were determined by adding together normalized weather variables that had loadings of ≥ 0.75 on a particular component. Receiver operating curves (ROCs) were later generated to determine the degree of prediction of the model. To further assess the validity of the propensity model the difference in means of weather factors on lightning vs non-lightning days was compared using a standard analysis of variance (ANOVA) before controlling for the propensity score and an of covariance (ANCOVA) after adjusting for the propensity score.
The propensity score (i.e. probability of lightning) generated by this model, atmospheric instability indices, and warm (April–November) vs cold (December–March) seasons were used as unique predictors of the frequency of headache/migraine and as covariates in the aforementioned GEE models. The propensity score was also used for a “within individual” matching procedure, which generated the ORs of headache or migraine on matched lightning vs non-lightning days using a conditional logistic regression. The criteria for matching a lightning and non-lightning day were the following: 1) the two days occurred within the same individual, 2) the propensity scores for each day were within 0.05, 3) the pattern of headache during the preceding two days was the same, and 4) the days occurred in the same warm-cold season. All statistical analyses were performed using SAS software version 9.2 (SAS Institute Inc, Cary, NC) and SPSS software version 19.0 (IBM, Armonk, NY). A p value < 0.05 was considered statistically significant.
Results
Demographics of study population.
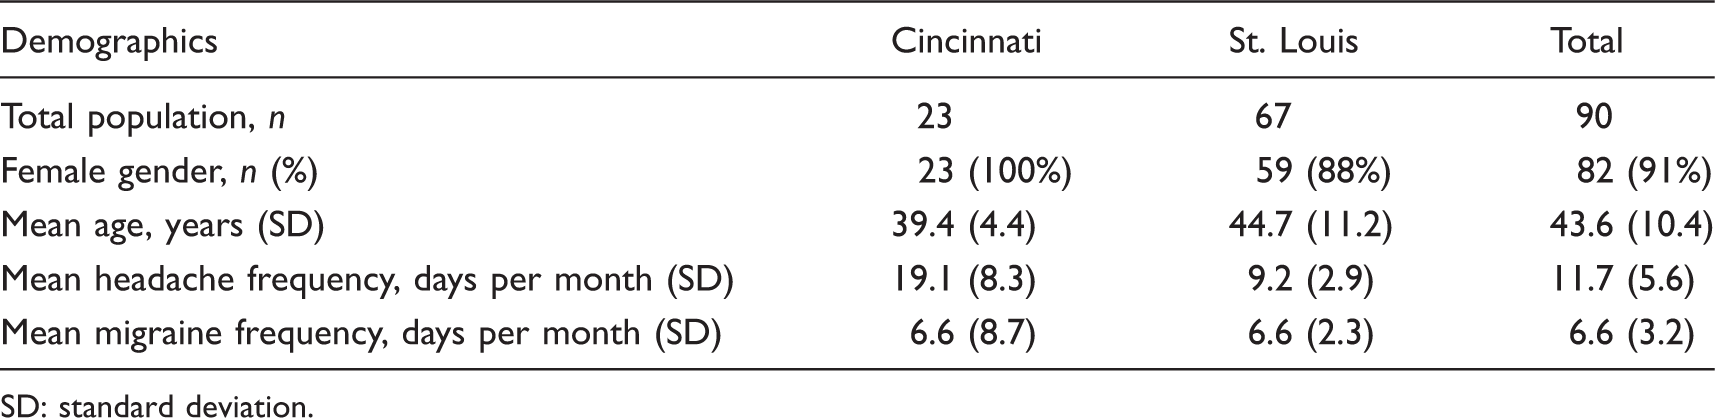
SD: standard deviation.
Weather and lightning characteristics.

SD: standard deviation; °F: degrees Fahrenheit.

Flow chart of the total number of headache diary days recorded and missing data due to missing headache diary entries and weather recordings.
Principal components analysis (PCA) and propensity model
The PCA yielded three factors with an Eigen value >1.0. The three factors were wind (e.g. wind speed and direction), moisture (e.g. precipitation and humidity), and heat (e.g. temperature and insolation). Barometric pressure was analyzed as its own weather factor as it did not significantly associate with any of the other weather variables.
Adjustment of weather factors by propensity score.

CL: confidence limits.
Lightning, propensity scores and instability indices
The unadjusted ORs for the frequency of headache and migraine on lightning days compared to non-lightning days were 1.31 (1.07, 1.66; 95% CL) and 1.28 (1.02, 1.61; 95% CL), respectively (Figure 2(a)). When controlling for the previous two days of headache or migraine activity, the ORs of new onset headache and migraine on lightning days were 1.24 (1.03, 1.47; 95% CL) and 1.23 (1.01, 1.51; 95% CL). The propensity score, the instability indices (e.g. CAPE and LI), and warm-cold season were also used as predictors for headache and migraine. The unadjusted ORs for headache and migraine when the propensity score was used as a predictor were 1.52 (1.04, 2.23; 95% CL) and 1.74 (1.12, 2.71; 95% CL), respectively (Figure 2(a)). CAPE scores > 0 had an unadjusted OR of 1.24 (1.09, 1.42; 95% CL) for headache and 1.01 (0.88, 1.16; 95% CL) for migraine, while LI values <0 had an OR of 1.95 (1.36, 2.8; 95% CL) for headache and 1.37 (0.77, 2.42; 95% CL) for migraine. Warm season had an OR of 1.48 (1.18, 1.85; 95% CL) for headache and 1.39 (1.12, 1.72; 95% CL) for migraine when compared to the cold season.
Unadjusted and adjusted predictors of headache and migraine. (a) Odds ratios for headache and migraine of lightning and weather predictors when no covariates were added to the GEE model. Depicted odds ratio for propensity is for propensity of score 1 compared to propensity score 0. Odds ratio for CAPE is for CAPE >0 compared to CAPE equal to 0. Odds ratio for lifted index is for lifted index <0 compared to ≥0. Odds ratio for season is for the warm season (April–November) compared to the cold season (December–March). Full 95% CL: *(1.04, 2.23), **(1.36, 2.79), ***(1.12, 2.71), ****(0.77, 2.42). (b) Headache and migraine odds ratios for lightning predictor after adjusting for various weather parameters in GEE model. Instability and propensity covariates were modeled as continuous variables.
As shown in Figure 2(b) adjustment with propensity score and LI attenuated the effect of lightning on headache and migraine, while addition of the CAPE index to the model did not significantly change the ORs. With adjustment for the propensity score, the OR reduced from 1.31 (1.07,1.66; 95% CL) to 1.19 (1.02, 1.40; 95% CL) for headache and from 1.28 (1.02, 1.61; 95% CL) to 1.06 (0.88, 1.28; 95% CL) for migraine. The LI reduced lightning’s OR of headache to 1.18 (1.02, 1.37; 95% CL) and of migraine to 1.20 (1.02, 1.41; 95% CL). Additionally, if warm-cold season was added to the model as a covariate, lightning’s OR was reduced to 1.23 (1.04, 1.46; 95% CL) for headache and 1.13 (0.92, 1.39; 95% CL) for migraine.
Propensity matching
Using the propensity score as the basis for a within-individual matching procedure yielded 582 matched lightning and non-lightning days, with all but one patient contributing at least one pair to the match. The median number of matches per person was seven (range 0–35). The results from the matching procedure yielded an OR on lightning days compared to non-lightning days of 1.13 (0.85, 1.49; 95% CL) for headache, and an OR of 1.10 (0.80, 1.52; 95% CL) for migraine.
Other lightning variables
Lightning’s average current was a significant predictor of headache (p < 0.05) but not migraine on lightning days. Figure 3(a) shows that for every 20 kA decrease in the average lightning current for the day there was a 6% increase in the frequency of headache, and Figure 3(b) shows that for every 20 kA decrease in the average lightning current for the day there was an 8% increase in the frequency of migraine. This indicates that those days with lightning strikes with a greater negative polarity (greater negative average current) actually had an increased frequency of headache. The frequency of lightning strikes within 25 miles of a patient’s home zip code, however, was not a significant predictor of headache or migraine.
Headache (a) and migraine (b) probability as a function of lightning current. Headache and migraine probabilities were generated from GEE models. Lightning current was defined as the average current of all lightning strikes within 25 miles of a patient’s home zip code within a single day. Error bars represent 95% CL.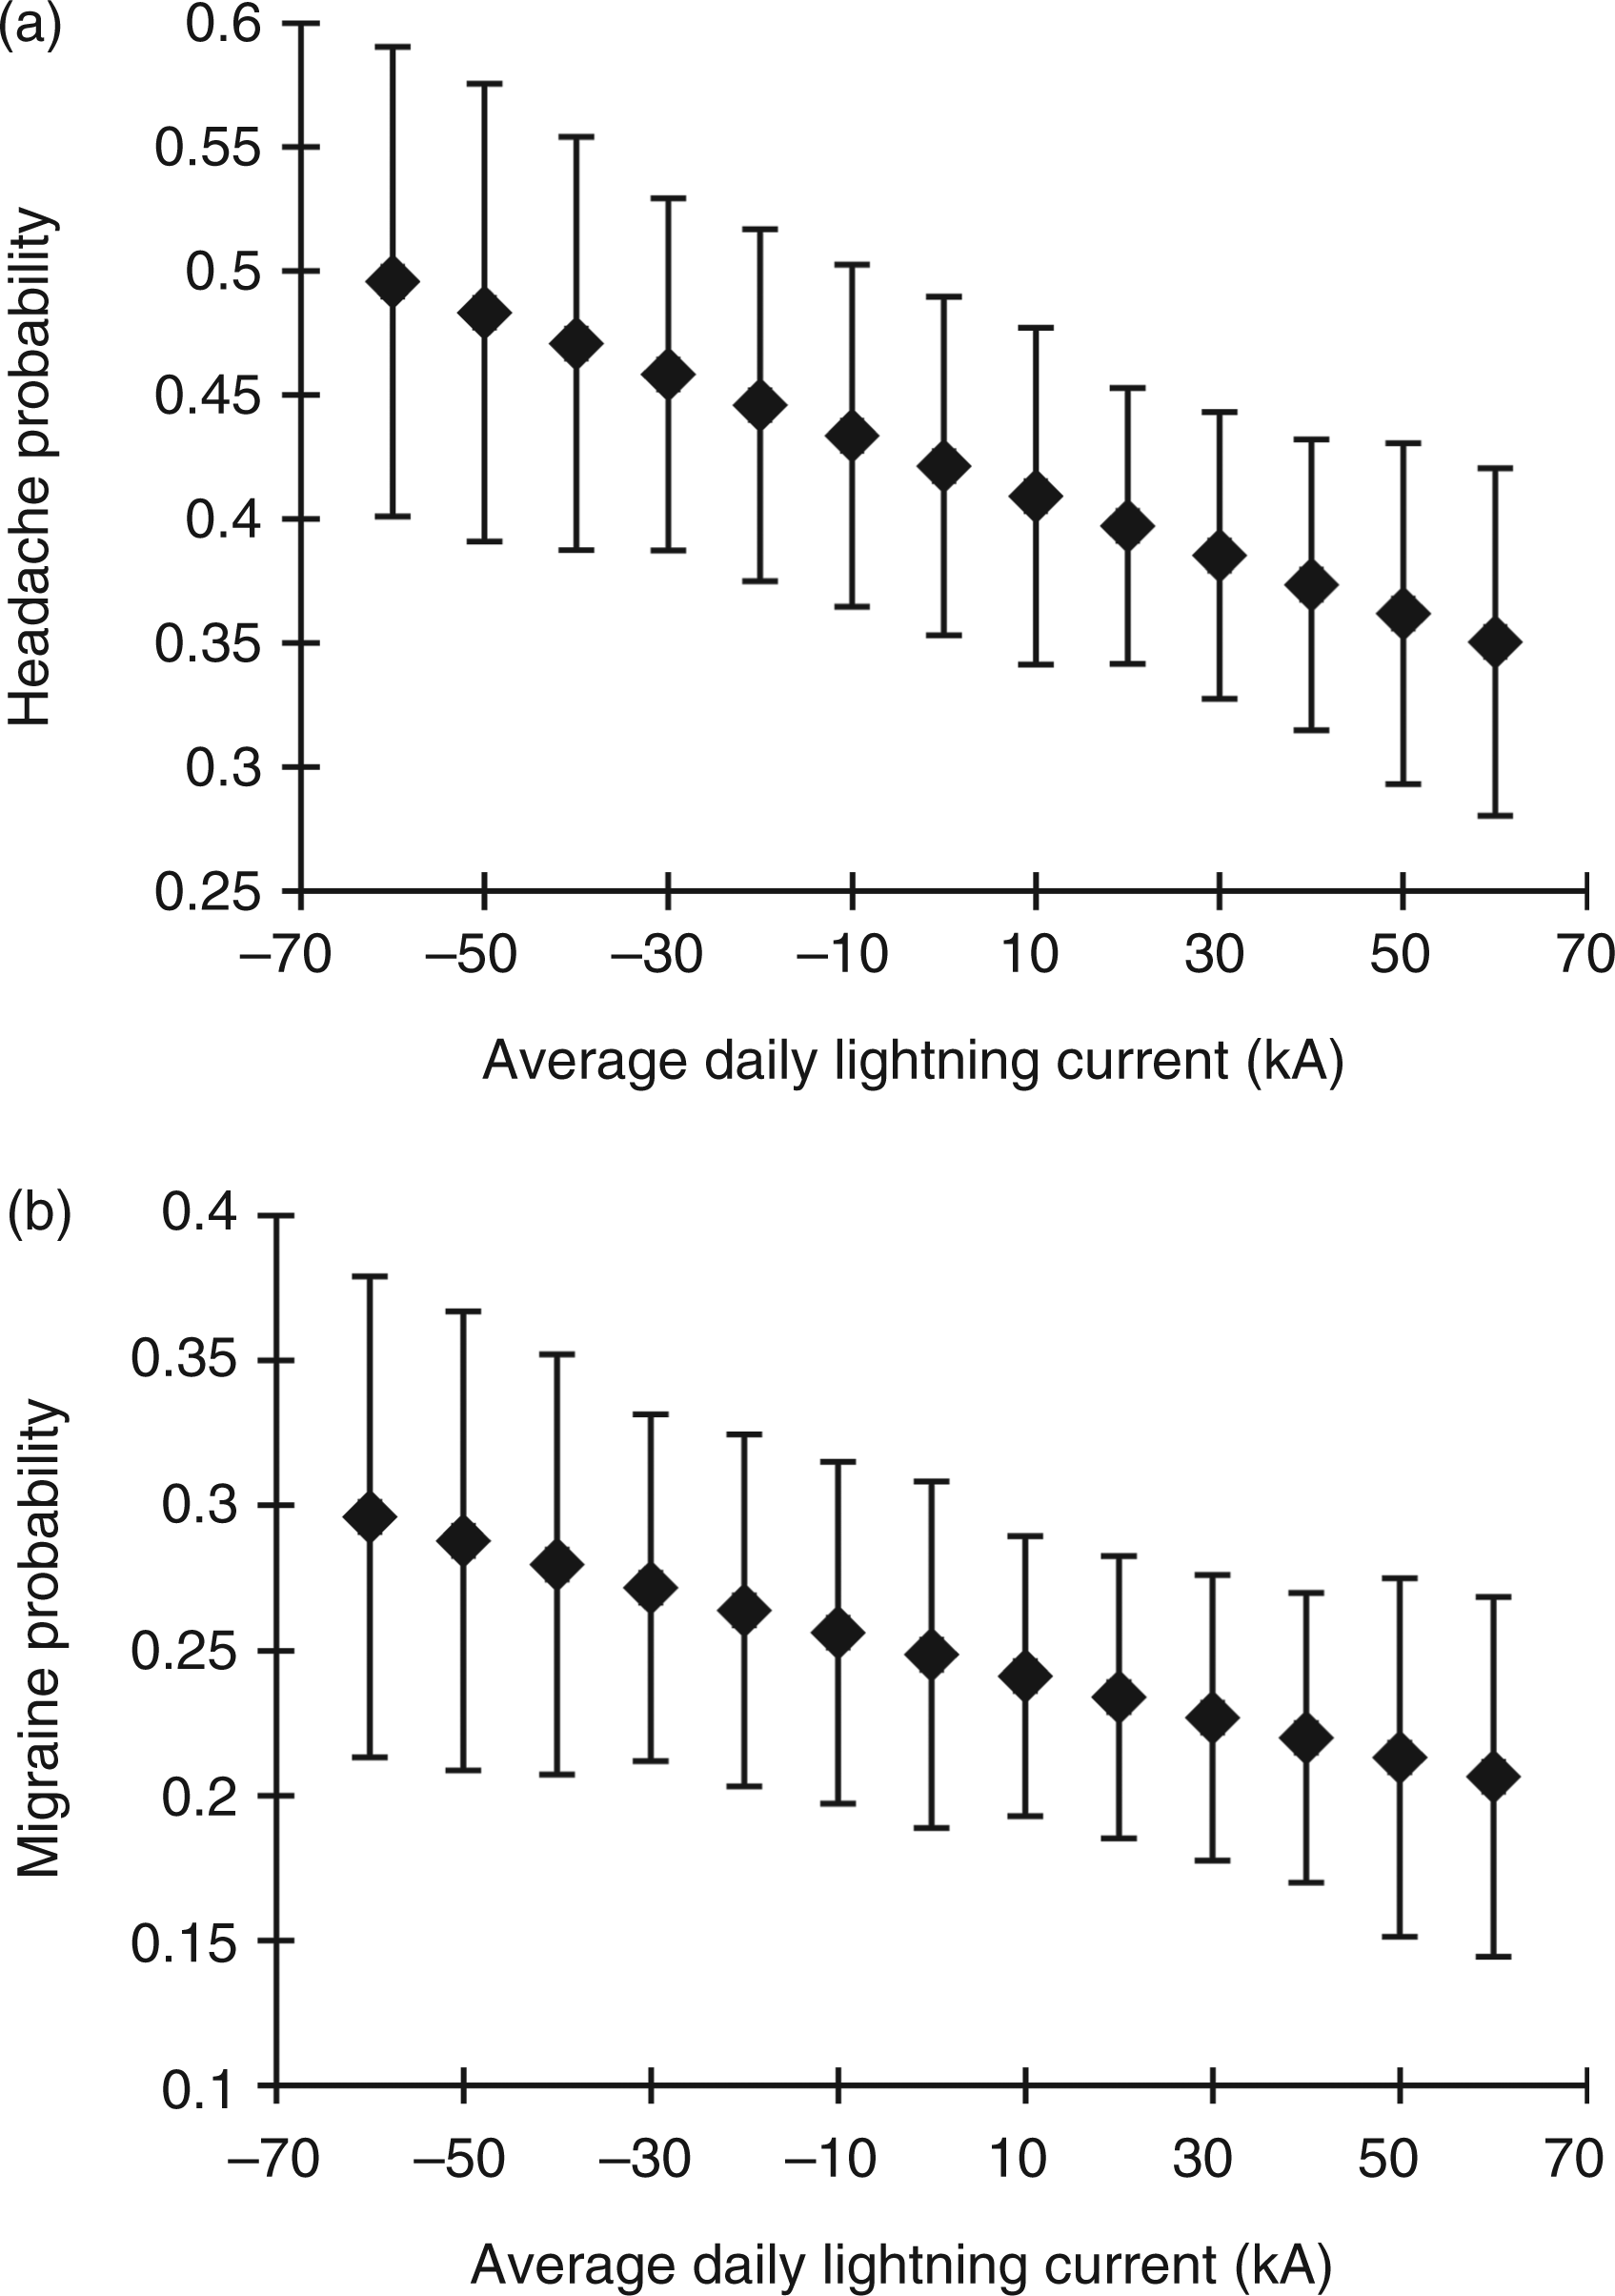
Discussion
Ours is the first study to report that lightning and its associated meteorologic changes represent a significant trigger factor for headache in migraineurs. The overall frequency of headache increased by 31% on lightning days as compared to non-lightning days while migraine days increased by 28%. Similarly, new-onset headache and migraine increased by 24% and 23%, respectively, on lightning days. Therefore, lightning appears to be associated both with the presence of headache on a given day as well as the transition from a headache-free day to a headache day.
The effect size of lightning reported in our study is in a similar range to that reported in several recent weather studies. Cooke and colleagues demonstrated that migraine onset was increased the day before and day of Chinook winds in Canada (ORs of 1.24 and 1.19, respectively) (15). Another study found that the presence of precipitation and increased humidity were associated with headache occurrence in children (ORs of 1.46 and 1.43, respectively) (12). Mukamal and colleagues reported that higher temperatures were associated with an increased number of emergency room (ER) visits for migraine (OR of 1.11 for each five-degree Celsius increase), and lower barometric pressures were associated with increased ER visits for headache (OR of 0.939 days for each 5 mm Hg increase) (9). Interestingly, the weather factors most strongly linked to headache in the above studies are those most frequently encountered with thunderstorms (e.g. wind, high temperature, high humidity, precipitation, and low barometric pressure). However, not all past studies have corroborated these findings (8,10,11).
Our primary outcome measures were the frequency of headache and migraine on lightning days as compared to non-lightning days. The “migraine” outcome measure was more stringent and required the presence of moderate to severe headaches along with migraine-associated symptoms. The “headache” outcome measure was less stringent and included all headaches regardless of their characteristics. We believe that both outcome measures likely reflected migraine headaches as all our patients were migraineurs, and even the headache days that did not fulfill migraine criteria may have simply represented a migraine attack that was early or late in its course and therefore lacked migraine characteristics. In addition, early treatment with an abortive medication may have prevented the development of migraine symptoms with some attacks.
Unique effect of lightning
Overall, our results suggest that lightning may have a unique effect on headache after accounting for other meteorologic variables, and this unique effect seems to account for 35–45% of increased headache on lightning days. This is supported by the fact that lightning remained a significant predictor of headache when adjusted for weather variables in the bivariate models, and lightning’s ORs remained relatively robust (1.14 and 1.10) in the propensity match. While the propensity match did not find statistically significant differences for headache/migraine frequency on lightning vs non-lightning days, this analysis may have been underpowered to detect differences between the groups as only 9.6% of our total days were used for this analysis.
Furthermore, the average lightning current was inversely associated with the frequency of headache on lightning days. This indicates that the frequency of headache was yet further increased on lightning days with a greater negative polarity of lightning strikes. The increase in headache activity on days with a greater negative polarity of lightning strikes could potentially be explained by the presence of positive air ions at ground level, which are encountered with negative polarity lighting strikes. Past studies have also suggested that positive air ions are associated with more frequent migraine headaches (14).
Weather instability indices
Weather instability indices such as CAPE and LI are used by meteorologists to predict unstable weather patterns such as severe thunderstorms, hail, and tornados. It is interesting to note that these indices were also associated with an increased frequency of headache and migraine. An advantage of using instability indices as predictors of headache as opposed to the presence of lightning is that these variables can be forecast days in advance. If validated in future studies these indices could be used to predict headache and/or migraine in weather-sensitive migraineurs.
Proposed pathogenesis
We propose several mechanisms through which lightning and its associated meteorological factors might trigger attacks of headache in migraineurs. First, low-frequency electromagnetic waves called sferics that emanate from electrical storms have been shown to be positively correlated with the occurrence of migraine (13), and laboratory studies have shown low-level magnetic fields are able to induce changes on electroencephalograms (EEGs) (18,19). Second, electrical storms can lead to the production of charged ions (20), and positive air ions have been associated with an increased frequency of migraine (14), increased serotonin metabolites released into the blood stream and urine (14,21,22), and EEG changes (23). Third, lightning storms produce irritable aerosols such as nitrogen oxides and ozone, which have both been associated with headache and migraine (7,9,24–26). Fourth, the negative ions associated with lightning could produce more allergenic fungal spores that could disperse with the downdraft of a thunderstorm and later induce headache in atopic migraineurs. A similar mechanism has been postulated as the cause for thunderstorm asthma (e.g. increased number of patients with asthma exacerbations during thunderstorms) (27).
Advantages and limitations
Our study offers several advantages compared to past studies that have investigated the role of weather on headache. First, our use of quantitative lightning data allowed the precise determination of the location and timing of lightning strikes. This allowed us to accurately identify which days were truly lightning days for each individual patient in the study. Second, the diary data was collected in all 12 months of the year and every patient had at least 90 days of collection. Many past weather studies have been able to analyze data only from certain seasons and therefore have been unable to generalize their results to the entire calendar year.
There are several limitations to our study. First, each patient did not record headache data for an entire 12 months. Without the same people recording in all seasons, differences in headache activity attributed to weather could be due to individual differences that happened to be recorded at certain times of the year. Second, our results may only generalize to migraineurs with frequent headaches as the mean headache frequency within our participants was 11.7 days per month. Third, the sites used in this study were from the Midwest region of the United States. The weather patterns observed in this study may not be representative of other regions throughout the country. Fourth, our study did not correct for multiple comparisons when analyzing the lightning, weather, and instability factors. This was not performed as many ofthese factors are highly intercorrelated (e.g. lightning variables and instability factors) leading to potential overcorrection of statistical significance levels. In addition, most of our analyses were designed to determine if weather or instability indices decreased the strength of the association between lightning and headaches. We believe that corrections for multiple comparisons would be unduly conservative in these exploratory analyses.
In conclusion, this study demonstrates that lightning is associated with an increased risk for headache and migraine in migraineurs. In addition, lightning appears to have a unique effect on headache that is unexplained by other meteorologic factors. The exact mechanisms through which lightning and/or its associated meteorologic factors trigger headache is unknown, but could relate to sferics, positive air ionization, or production of aerosols and allergenic fungal spores. Ultimately, the effect of weather on headache is complex and future study will be needed to define more precisely the role of lightning and thunderstorms on headache.
Clinical implications
This study suggests that lightning represents a trigger for headache in migraineurs that cannot be completely explained by other meteorological factors.
Footnotes
Acknowledgements
We would like to thank Chris Bell and Chris Runken for their contributions to this study.
Funding
This work was supported by GlaxoSmithKline (GHO-10-4161).
Conflicts of interest
G.M. and A.P. have none to declare.
T.H.: GlaxoSmithKline: Unrestricted research grant; Merck: unrestricted research grant; Allergan: consultant.
R.N.: Merck: Grant, consultant; GlaxoSmithKline: consultant; Mercy Health Research: consultant.
V.T.M.:GlaxoSmithKline: Grants; Nautilus: consultant; Zogenics: consultant, speaker; MAPP: consultant; Allergan: speaker, consultant; Nupathe: consultant.