
Abstract
Aim: Increased contrast-level dependent internal noise has been reported in migraine. This study aimed to investigate whether a general increase in internal noise impacted on other tasks thought to assess functioning in cortical area V1 and was evident in global contour coding (V4).
Methods: Eleven migraineurs (six with aura) and 12 headache-free controls completed three psychophysical tasks: (i) contrast detection, (ii) discrimination of the angle of a spiral path and (iii) detection of deformation from circularity. Internal noise estimates were obtained using an N-pass method that compared responses to repeated presentations of identical stimuli. Internal noise results in inconsistent responses across different runs.
Results: Migraineurs had significantly higher contrast thresholds when there was high external luminance noise. There were no other significant group differences in thresholds. Increased multiplicative noise associated with contrast processing was replicated and increased additive noise, which is independent of the visual input, was found for the global form task.
Conclusions: This study provides further evidence for increased multiplicative internal noise associated with contrast processing in migraineurs. However there is no generalised increase in internal noise in V1 as noise estimates for angular discrimination were normal. Increased additive internal noise was associated with the global shape task, co-occurring with increased efficiency.
Introduction
Migraine is a common neurovascular condition, estimated to affect 12% of the general population (1,2). Anatomical differences in the visual cortex of migraineurs have been demonstrated, including a thickening of the cortex in areas MT (V5) and V3a (3), areas associated with motion processing (4,5). Psychophysical research examining the impact of migraine on visual performance shows longer motion after-effects and larger tilt after-effects (6–8), higher coherence thresholds for both random dot motion (9–13) and global form stimuli (9,12), and decreased contrast sensitivity (14–16). However, the mechanism/s underlying these deficits remains unclear.
Electrophysiological studies have found evidence for hyperexcitability in the visual cortex of individuals with migraine (17–21), which could result from either increased influence of excitatory connections (22,23) or weaker inhibitory mechanisms (24,25). A recent study by Battista et al. (26) used centre-surround suppression to differentiate between decreased inhibition and increased excitation (27). The results showed that perceptual surround suppression for drifting stimuli was greater for migraineurs than controls, suggesting increased excitation associated with motion processing. Increased excitation may result in an increase in neuronal (internal) noise, defined as the proportion of the neural response that is unrelated to the presence of signal (28). Internal noise can be partitioned into additive noise, which is independent of the visual input, and multiplicative noise, which is scaled by the magnitude of the stimulus.
Wagner et al. (29) investigated whether internal noise could account for contrast processing deficits in migraineurs. Performance was characterised using the perceptual template model (PTM) of Lu and Dosher (30). This model partitions internal noise into additive and multiplicative noise and provides information about how efficiently the observer is using the available signal. A detailed description of the application of the PTM can be found in Wagner et al. (29). The participants were required to detect a luminance contrast-defined target embedded in varying amplitudes of luminance noise. The migraine group had higher contrast thresholds than controls when the luminance noise was obscuring the target. Application of the PTM showed that migraine with aura (MA) participants had increased multiplicative noise relative to controls and the migraine without aura (MO) group showed the same trend towards increased multiplicative internal noise. The MO participants also had a lower sampling efficiency compared to controls.
Further evidence for decreased efficiency in migraineurs comes from a study by Webster et al. (31) that examined motion coherence processing, sensitivity to the spiral angle of global form and the spiral angle of global motion. However, in contrast to Wagner et al. (29), the study found no evidence of increased internal noise. Webster et al. (31) used the N-pass method (32–34) to estimate internal noise. That method correlates observer responses across multiple runs or passes of an identical stimulus to assess response variability due to noise. The results showed a deficit in motion coherence processing for migraineurs, replicating previous research (9–12). However, there was no difference in internal noise estimates between groups on any of the tasks, suggesting that (i) increased internal noise is not the mechanism driving performance differences on a motion coherence task and (ii) migraineurs do not have a generalised increase in either additive or multiplicative internal noise.
There are two important points of difference between the study of Wagner at al. (29) and that of Webster et al. (31): (i) the experimental task and (ii) the type of external noise used. Wagner et al. (29) used a luminance contrast processing task with added luminance noise, whereas Webster et al. (31) examined motion and form processing using motion or static orientation noise, respectively. Adding luminance noise degrades the visibility of the stimulus whereas adding orientation noise to a global motion and global form task alters the reliability of the local orientation information, which is critical for global integration, but does not vary the visibility of the stimulus. Therefore, it may be the case that migraineurs only exhibit elevated noise on visual tasks when the stimulus visibility is degraded.
In order to determine whether this resolved the difference between the results from the Webster et al. (31) study and Wagner et al. (29), our study revisits this issue. Two tasks were used: (i) the same combination of luminance contrast detection with luminance noise used by Wagner et al. (29) and (ii) a spiral path task that required participants to discriminate the angle of a path created by modifying a stimulus previously used by Field et al. (35,36). Many neurons in V1 have both strong orientation selectivity and long-range connections between cells with similar orientation tuning requirements for contour integration, and therefore the integration of Gabor elements into a path is likely to draw on processes in V1 (35–38).
Because many V1 neurons are sensitive to both orientation and contrast, using these two tasks allowed an examination of whether previous findings of increased internal multiplicative noise apply to any stimulus dimension when vision in V1 is central to the task.
In addition, a global form task requiring participants to detect deformation from circularity was included for two reasons. Firstly, previous research has reported deficits in form coherence processing for migraineurs (9,12), which may result from increased internal noise in V4. Secondly, as cortical area V4 is thought to combine local form information such as orientation and position into global form information such as global texture and contours or shape (39–43), it is reliant on the accuracy of the local information processed in V1. Therefore, if there are differences in either efficiency or internal noise associated with orientation or position coding in V1, this may impact on performance on a global form task.
In order to determine whether differences between groups were due to changes in either additive or multiplicative noise, external noise was added to all three tasks. This allowed the noise dependence to be parsed into additive (random and independent of the stimulus noise level) and multiplicative internal noise (noise induced by the signal and external noise).
Methods
Participants
Eleven participants who experience migraine (six MA and five MO, aged 20 to 40) and 12 headache-free controls (aged 20 to 35) participated in this study. Migraine participants were asked if they had a formal diagnosis of migraine from their general practitioner or a neurologist and the International Headache Society criteria for migraine (44) was used to ensure that participants met the criteria for either MA or MO. The frequency of migraine events was between 1 and 30 per year (mean 7.66, SD ± 10.21) and the duration of migraine history was between 6 and 21 years (mean 13.17, SD ± 5.81). Migraine severity was assessed using the Migraine Disability Assessment (MIDAS) (45). Scores on the MIDAS are usually interpreted as follows: Grade 1, minimal or infrequent disability (score 0–5); Grade 2, mild disability (score 6–10); Grade 3, moderate disability (score 11–20); and Grade 4, severe disability (score 21+). The MIDAS scores in the current study ranged from 0 to 25 with a mean of 13.33 (SD ± 8.60). Participants in the migraine group were required to be at least 4 days post-migraine at the time of testing to ensure no residual effects of medication or fatigue and could not be taking any preventative medication. Participants were asked to call and report any migraines experienced in the 4 days post-testing; no participants called. Control participants were required to have experienced less than four spontaneous (not related to sickness or tension) headaches per year and never experienced a migraine or aura. The control participants were not screened for any family history of migraine. Normal findings in a comprehensive eye examination which included a slit lamp biomicroscopy, ophthalmoscopy and tonometry were a requirement for all participants. Participants were also required to have normal or best corrected to normal visual acuity of 6/7.5 or better for the experimental viewing distance, refractive errors of less than ±5.00 D sphere and ±2.00 D astigmatism and to be free of any medications or diseases known to affect visual or cortical function. Ethics approval for the study was provided by the Human Research Ethics Committee (University of Melbourne). All participants provided informed written consent prior to testing and all aspects of the research protocol were in accordance with the tenets of the Declaration of Helsinki.
Apparatus and stimuli
The stimuli were drawn using MATLAB 7 (Mathworks, Nantick, 2005) on a host Pentium computer and the images were loaded onto a ViSaGe graphics system (Cambridge Research Systems). The stimuli were displayed on a Sony Trinitron G520 monitor. The monitor had a resolution of 1024 × 768 pixels (34°8’ × 25°36’) and a frame rate of 100 Hz and was frequently gamma corrected using a CRS OptiCAL photometer (Head#265). The viewing distance was maintained at 65 cm using a chin rest and at this distance each pixel subtended 2’. All experiments were conducted in a darkened room (<1 cd/m2) to minimize reflections and interference from other light sources.
Participants completed three perceptual tasks across two testing sessions each lasting 90 minutes: a contrast detection task based on that used by Wagner et al. (29), a radial frequency (RF) shape discrimination task and a spiral path discrimination task (see below for stimulus and task details). The stimuli and the task for each experimental condition were shown to the participant before testing and a practice run was completed to ensure the participant was familiar with the requirements of the task. The order of the tasks was randomized across testing sessions for each participant to minimize the risk of order effects. All participants were carefully observed by the experimenter during the testing sessions for compliance and fatigue.
The N-pass method was used to estimate internal noise (32,33), which required the combinations of stimuli and external noise used in the first run of each experimental condition to be saved for each observer. These stimuli were then re-ordered and re-presented to the observer in each subsequent run, resulting in a total of three runs being completed for each experimental condition in both the spiral path detection task and the contrast detection task. The order of the stimuli used in the RF discrimination task was not randomized before being presented as there is evidence of a rapidly developed after-effect produced by viewing RF patterns (46), which creates its own source of noise. To minimize the impact of this noise source on internal noise estimates, the trials were presented in identical order so that the same after-effect was present on individual trials across the three runs. As the stimulus properties were identical on each run any variation in response can be attributed to internal noise (32).
Contrast detection task
The contrast detection task used in this experiment was derived from Wagner et al. (29). The stimuli consisted of two squares 4° × 4°, presented side by side on the screen with a centre-to-centre distance of 7.2°. One of the squares contained a disc 1.5° in diameter (Figure 1). The stimulus had a background luminance of 28 cd/m2, which was lower than the background for the other two tasks but was identical to the luminance level used by Wagner et al. (29). The contrast of the target disc at the individual observer’s contrast threshold was identified using a staircase procedure that converged on the 79% correct performance level (47,48). The threshold measure used was the average of the last 8 of 12 reversals in staircase direction. The task was a spatial two-alternative forced choice procedure. The stimulus was shown for 1 s, after which the observer was required to indicate, using a button box, which of the two fields contained the disc. The observers were told to fixate on each of the squares before making their decision. Auditory feedback was provided after each trial. The staircase procedure was repeated twice and the contrast threshold estimates from the two staircases were averaged. Analysis of the contrast thresholds obtained for the two groups showed no significant difference for any of the external noise conditions.
An example of the stimulus used in the contrast detection task. ‘A’ shows the stimulus with no added luminance noise with the disc appearing in the square on the left. ‘B’ shows the stimulus with ‘high’ added luminance noise. Both fields contain luminance noise drawn from a Gaussian distribution with a mean of 0 and SD 14.06 cd/m2 and the signal disc is located in the square on the right.
Luminance noise was added to both the fields in four experimental conditions (Figure 1). The luminance noise had a pixel size of 6′ × 6′and was drawn from a Gaussian distribution with a mean of 0 and SD of 0, 3.52, 7.03 and 14.06 cd/m2. The staircase procedure was repeated in each noise condition to determine the contrast threshold for detecting the disc. From here on, these four noise conditions will be referred to as ‘no’, ‘low’, ‘medium’ and ‘high’ external noise, respectively.
As in the Wagner et al. study (29), participants then completed the same contrast detection task for each condition but the contrast of the disc was controlled using a method of constant stimuli (MOCS) with two signal levels below (0.7406 and 0.8516 log units) and two above (1.189 and 1.413 log units) their individual threshold. Again, auditory feedback was provided. At each MOCS level there was a total of 40 trials per block and participants completed three runs for all four experimental conditions. In this task the dependant variable was the threshold luminance increment required to detect the disc. We report this in cd/m2 so a direct comparison can be made to the level of added noise but we also provide the more conventional Weber contrast estimates (threshold luminance increment/background luminance) in the figures.
RF detection task
This stimulus consisted of 36 Gabor patches arranged along a closed path (Figure 2) presented on a grey background (45 cd/m2) with a radius described by
‘A’ illustrates the stimulus when there is no deformation from a circle. ‘B’ illustrates the stimulus when there was deformation added to the contour. ‘C’ is an example of the deformed stimulus with external noise added to the radial position of the individual Gabor patches.

The patches were arranged at equal intervals of ‘θ’. The centre of each Gabor patch, at ‘x
mid
’ and ‘y
mid
’ was placed on the path (Figure 2). Each Gabor patch had a luminance profile described by:

External positional noise was added to the radial location of each individual Gabor patch in a second condition. The amount of added external noise was drawn from a uniform distribution with a spread of ±16’ for each element along the contour individually (Figure 2c). The orientation of each Gabor patch remained as if the patch was still lying on the contour.
The task was a temporal two-interval forced choice (2IFC) procedure where participants were required to decide in which of the two presentations the pattern looked most deformed from circularity. The test and reference stimulus (which had no deformation but added external noise), were each presented for 500 ms with an inter-stimulus interval of 500 ms. The dependent variable in this task was deformation from circularity, which is represented by ‘A’ in Equation 1. Participants indicated their choice using a button box and no feedback was provided. A MOCS, with seven levels of amplitude, was used to control stimulus presentation, with a total of 20 trials per level. Participants completed three runs with no external noise and three runs with added external noise.
Spiral path task
The stimuli used in this task consisted of 225 Gabor patches arranged within a grid (see Figure 3) with one degree of visual angle separating the centres of adjacent cells on the grid, presented on a grey background (45 cd/m2). The entire Gabor field subtended 15°. The spatial frequency of the gratings in this experiment was 3.75 cycles/degree and all of the patches were in cosine phase. The full width, half-height diameter of the Gaussian window was 18.84′ of visual angle, with a sigma of 8′.
The figure illustrates the spiral path stimuli. ‘A’ and ‘B’ show the stimulus with no added external noise. ‘B’ contains a path that forms a tighter spiral than the path in ‘A’. Images ‘C’ and ‘D’ illustrate the spiral path stimuli with orientation noise added to the Gabor patches. ‘D’ contains a path that forms a tighter spiral than the path in ‘C’.
Eight of the Gabor patches were placed and oriented along a logarithmic spiral line, while remaining within their own cell of the grid (see Figure 3). The spiral line always originated from approximately the centre of the grid but the direction of the spiral was randomized. All other patches in the field were then randomly oriented background noise. Overlap of these patches was minimized by allowing the centre of each patch to move 50% of the distance to the edge of the cell. In a separate condition external noise was added to the orientation of the eight Gabor patches used to form a path. The orientation noise was drawn from a uniform distribution with a spread of ± 32° for each element individually in the spiral path.
The format was a temporal 2IFC procedure in which participants were required to decide in which of the two presentations the path formed the tightest spiral. The reference spiral angle was always 45°. A MOCS procedure with seven levels was used to control stimulus presentation, with a total of 20 trials per MOCS level per run. For this task the dependent variable was the spiral angle measured in degrees.
The participants indicated their choice using a button box. No feedback was provided. Participants completed three runs in all conditions.
Results
A cumulative normal distribution,
The psychometric function of one control participant in the current study for the spiral path task. The observer was required to report the interval containing the tightest spiral. The data represented by the filled circles reflect the proportion of times the test was chosen as tighter and was fitted with a cumulative normal distribution. The data depicted by the open triangles represent the proportion of times the observer correctly rejected the test as having the tightest spiral in the cases where the test had a spiral angle of less than or equal to 45°. A value of +1 sigma on the cumulative normal represents the point where the test spiral is reported to be tighter 84% of the time. When estimating per cent correct, instead, the area under the curve between ±1 sigma is 68% of the total and therefore the threshold reflects a 68% correct performance level.

Prior to any group analysis, outliers identified as thresholds that were three standard deviations from the mean were excluded (49). The number of participants removed is shown in the relevant sections below. There were no participants who were outliers across all three experimental tasks. Prior to analysis the data was checked for homogeneity of variance and normality. There were no significant differences in variance for any task and the data met the assumption of normality. Thresholds were then compared across groups using repeated-measures analysis of variance (RM ANOVA) and independent samples t-tests to determine whether there were any significant performance differences between groups on any of the experimental conditions. The MA and MO groups were collapsed into a single migraine group as t-tests showed no significant threshold differences on any task, although it is acknowledged the groups are small.
Internal noise was estimated for each observer using the N-pass technique (32–34). In the N-pass method the same set of trials are run three times with all aspects of the stimuli being identical, the assumption being that any variance in responses to identical stimuli results from internal noise. The N-pass method, adopted from Levi et al. (33), correlates observer responses on each trial across three runs, pairing all runs with each other (run 1 with run 2; run 1 with run 3; and run 2 with run 3). This gave three correlation estimates that were then averaged, giving a single average estimate of the proportion of consistent to random noise. Analysis of the data showed no significant correlation (using a criterion of p < 0.05) between thresholds and internal noise estimates for either group on any experimental condition. RM ANOVA and independent samples t-tests were used to compare internal noise estimates across groups.
Contrast detection task
Prior to group analysis, two control participants were removed as they were outliers in the ‘no luminance noise’ condition, shown as open symbols on the graph ‘A’ in Figure 5. The luminance increment threshold measured in cd/m2 was used for analysis as this allows direct comparison with the level of luminance noise added to the stimulus. However, as Weber contrast (luminance increment/background luminance) is a conventional measure for a contrast detection task, Figure 5 displays both the luminance increment and the Weber contrast. A RM ANOVA (within factor: four external noise conditions; between factor: migraine or control group) showed a main effect of external noise (F(3,19) = 150.70, p < 0.01). Adding external noise to the stimulus elevated thresholds. There was no significant difference in group means (F(1,19) = 0.84, p = 0.37), but there was a significant interaction between participant group and external noise (F(1,19) = 10.17, p < 0.01). To determine which conditions showed a significant difference between groups, t-tests were conducted. There were no significant differences in performance between groups for the no noise condition (t(19) = 0.94, p = 0.36), the low noise condition (t(19) = 1.34, p = 0.20), or the medium noise condition (t(19) = 1.38, p = 0.19). However there was a significant difference between groups for the high noise condition (t(19) = 2.30, p = 0.03) where migraineurs were worse than controls at detecting the contrast disc (Figure 5E). This is consistent with previous findings by Wagner et al. (29) who found elevated thresholds for the migraine group for the two highest external noise conditions.
Thresholds (sigma) and 95% confidence intervals are presented for the control and migraine groups for all four luminance noise conditions in the contrast detection task. The standard deviation of the luminance noise in cd/m2was 0 (No), 3.52 (Low), 7.03 (Medium), 14.06 (High). MA participants are shown by triangles and MO participants are shown by crosses. The open circles represent outliers which were removed prior to analysis. Graph E shows the increase in thresholds for both groups across external noise levels. At the highest external noise level migraineurs have increased contrast thresholds.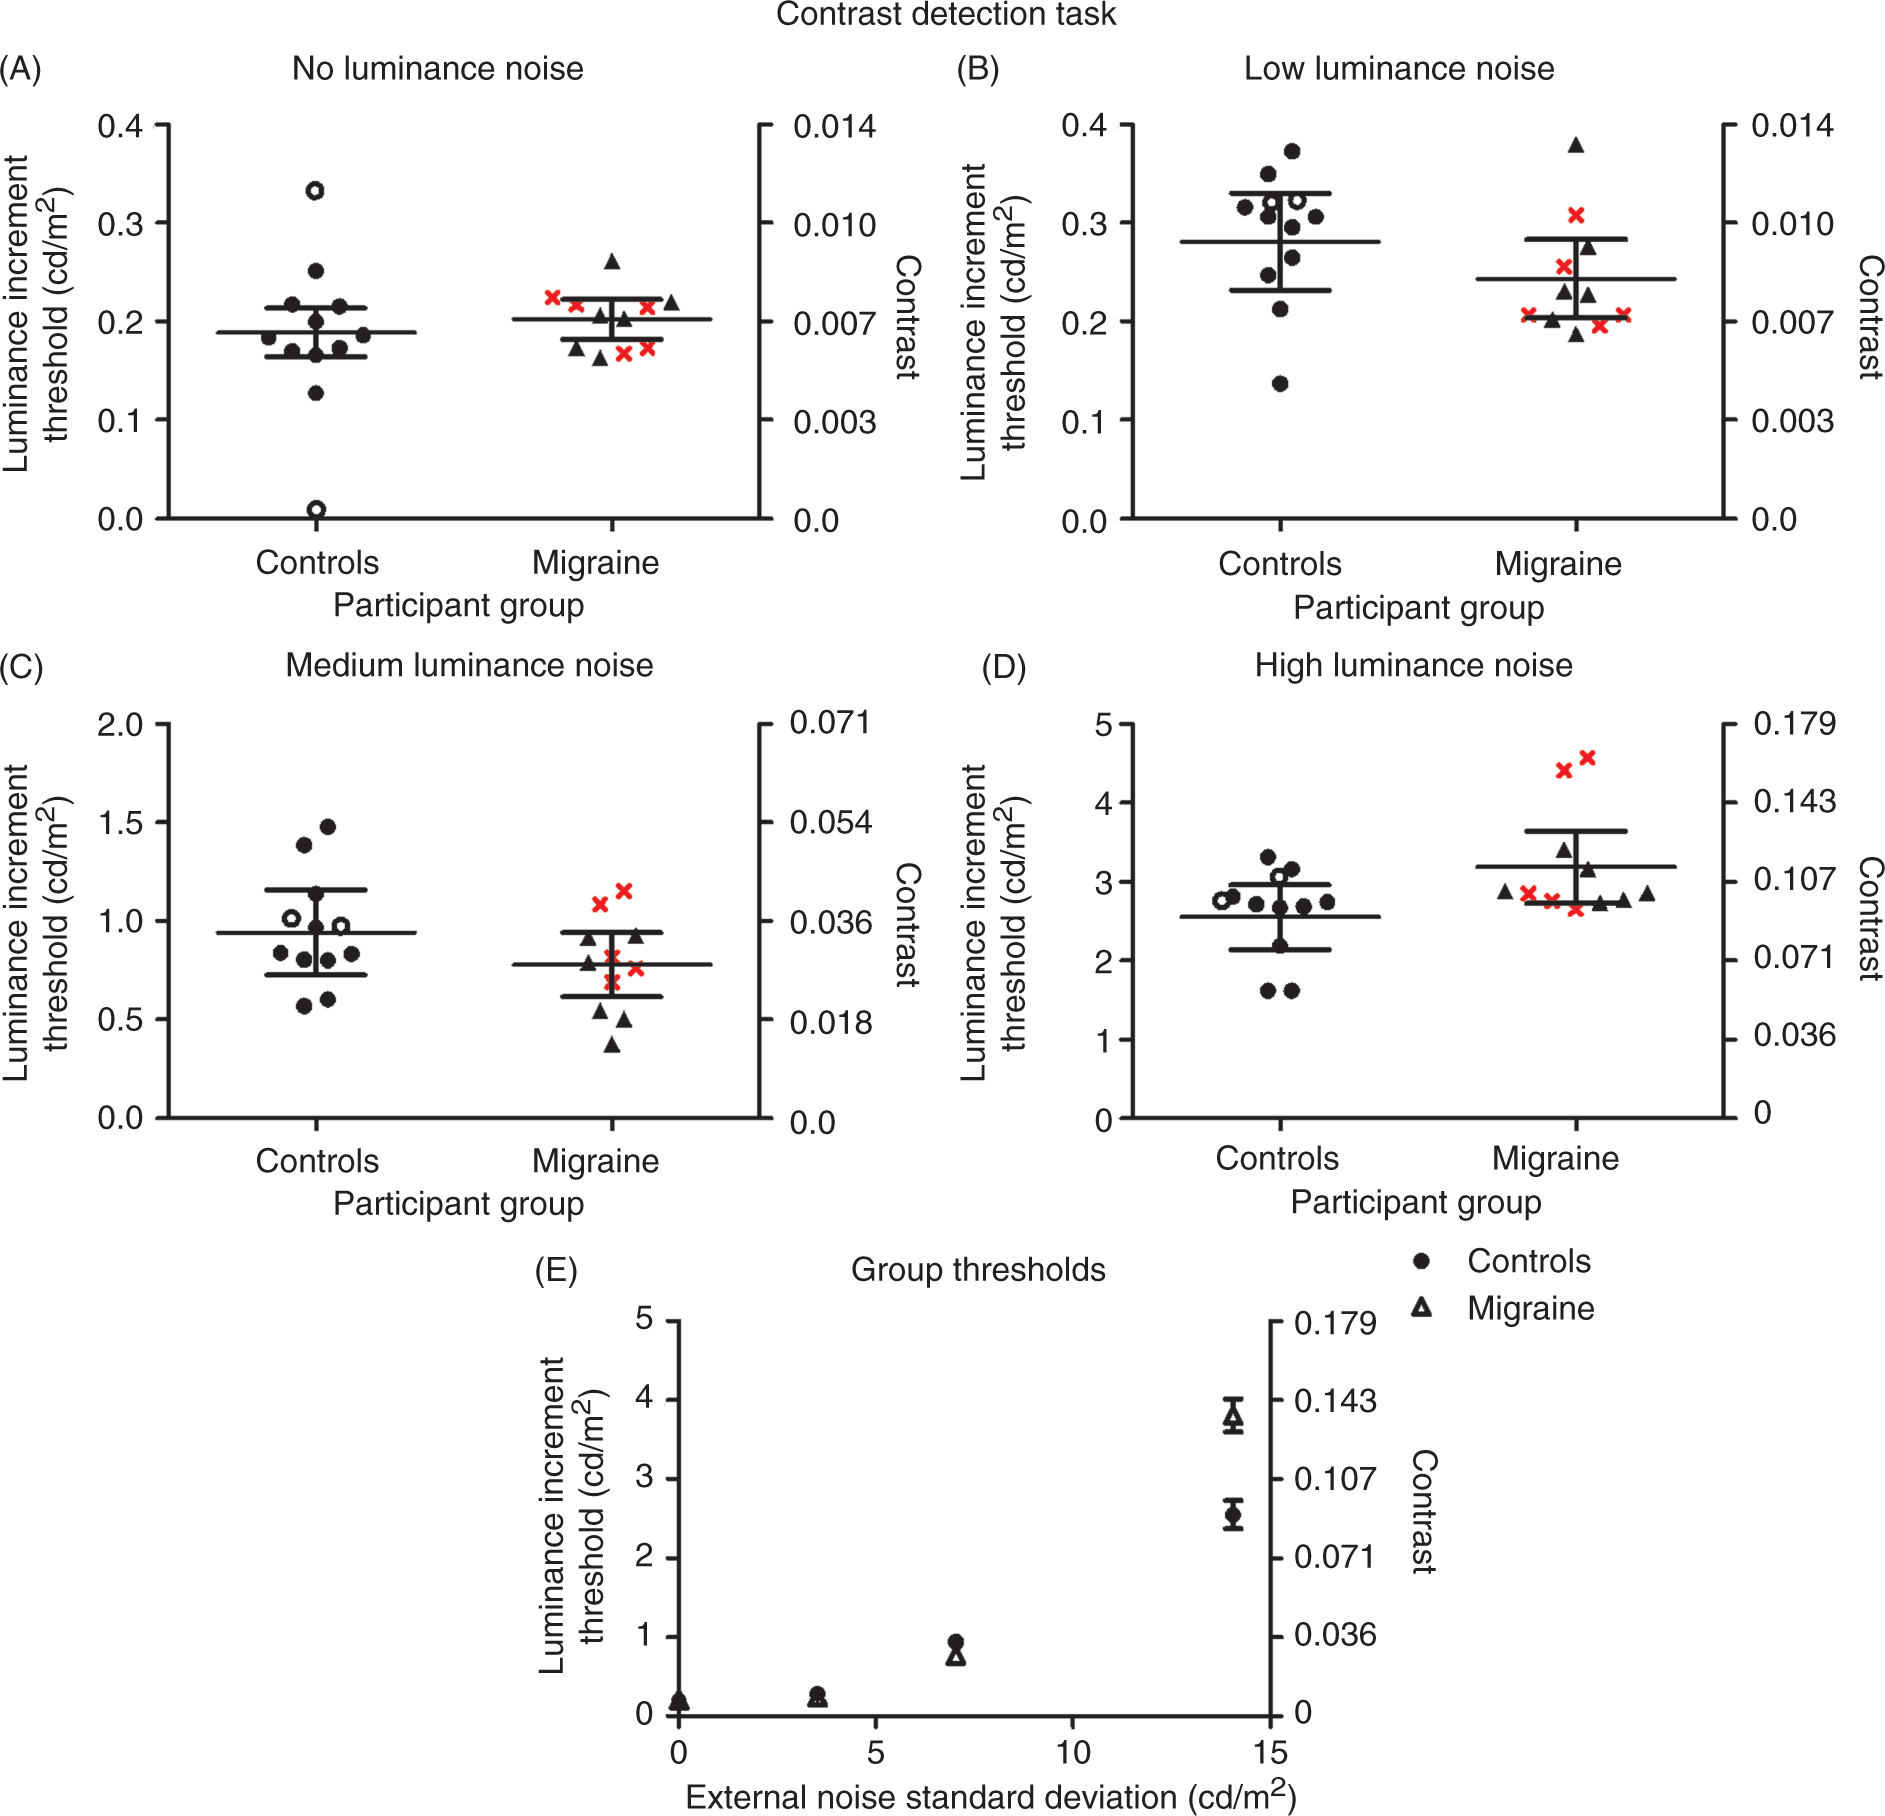
An examination of internal noise estimates using a RM ANOVA showed a significant main effect of external noise level (F(3,19) = 16.67, p < 0.01) and a significant main effect of participant group (F(1,19) = 8.71, p < 0.01). There was also a significant interaction between participant group and external noise level (F(3,19) = 4.97, p < 0.01). To determine where significant differences between the participant groups were, t-tests were conducted and an estimate of the size of the effect (r2) was provided (where a small effect size = 0.1, medium = 0.3 or large = 0.5) (50).
There was no significant difference in estimates between migraineurs and controls in either the ‘no’ noise condition (t(19) = 0.44, p = 0.66), or the ‘low’ noise condition (t(19) = 0.24, p = 0.81). However, consistent with the previous finding by Wagner et al. (29) there was a significant difference in internal noise estimates for the ‘medium’ noise condition (t(19) = 4.05, p < 0.01) with a large effect size of r2 = 0.70, and the ‘high’ noise condition (t(19) = 3.12, p < 0.01) with a large effect size of r2 = 0.55, where migraineurs had significantly more internal noise than controls (Figure 6).
The mean internal noise estimates and 95% confidence intervals for all four conditions on the contrast detection task. MA participants are shown by triangles and MO participants are shown by crosses. As shown by graphs ‘C’ and ‘D’ migraineurs had significantly higher internal noise estimates compared to controls when there was medium and high levels of external noise added to the stimulus.
RF discrimination task
There were four outliers removed (two controls and two migraine) prior to group analysis. The outliers are shown as open symbols on the graphs in Figure 7. A RM ANOVA (within factor: no or added external noise; between factor: migraine or control group) showed a main effect of external noise (F(1,17) = 340.40, p < 0.001).There was no significant difference in participant group means (F(1,17) = 0.37, p = 0.55), and no significant interaction between participant group and external noise (F(1,17) = 0.24, p = 0.63).
1
Graphs ‘A’ and ‘B’ show the threshold estimates for both groups with and without external noise. Graph ‘C’ shows the internal noise estimates for the two groups without added external noise. Graph ‘D’ shows the internal noise estimates when there was external noise added to the stimulus for both groups. MA participants are shown by triangles and MO participants are shown by crosses. Control outliers are shown by open circles, MA outliers are shown by the open triangles and MO participants are shown by the circles with a cross in the centre. The migraine group had significantly higher internal noise estimates with no added external noise but there were no significant differences in thresholds.
Analysis of internal noise estimates using a RM ANOVA (within factor: no or added external noise; between factor: migraine or control group) showed a main effect of external noise (F(1,17) = 11.40, p = 0.003).There was no significant difference in group means (F(1,17) = 3.53, p = 0.078), but there was a significant interaction between participant group and external noise (F(1,17) = 14.59, p = 0.001). Post hoc t-tests showed that the migraine group had significantly higher internal noise estimates for the no external noise condition (t(17) = 3.66, p < 0.01) with a large effect size of r2 = 0.6. There was no significant difference between migraineurs and controls for the added external noise condition (t(17) = 0.15, p = 0.89 (Figure 7).
Spiral path task
In this experimental task two migraine participants were removed as outliers prior to group analysis. The outliers are shown as open symbols on the graphs in Figure 8. A RM ANOVA (within factor: no external noise or added external noise condition; between factor: migraine or control group) showed that adding external noise to the stimulus significantly impaired performance (F(1,19) = 59.43, p = 0.01). There was no significant difference in group means (F(1,19) = 0.28, p = 0.60), and no significant interaction between participant group and external noise (F(1,19) = 0.52, p = 0.48) (see Figure 8).
MA participants are shown by triangles (outliers are shown by open triangles) and MO participants are shown by crosses (outliers are represented by the crosses with a circle around them. ‘A’ shows the thresholds (95% CI) for both groups with no added external noise and ‘C’ shows the internal noise estimates (95% CI) for the same condition. The graphs show no differences between groups. Graph ‘B’ shows thresholds with added orientation noise and ‘D’ show the internal noise estimates for both groups. Again there are no differences between groups.
Examination of the internal noise estimates using a RM ANOVA revealed a significant main effect of external noise level (F(1,19) = 0.15, p = 0.03). However there was no significant difference in group means (F(1,19) = 1.08, p = 0.71), and no significant interaction between participant group and external noise (F(1,19) = 5.41, p = 0.31) (Figure 8).
Discussion
The aim of this study was to: (i) investigate whether migraineurs have a general increase in multiplicative noise associated with processing in V1 using two tasks: a contrast detection task and a spiral path discrimination task, and (ii) whether there are any differences in performance, internal noise or efficiency on a position coding task (RF) which required the integration of local orientation and position information into global shape, targeting the higher cortical area V4.
The contrast detection task showed significantly higher thresholds for migraineurs with high levels of added external noise, consistent with findings by Wagner et al. (29), although no significant difference in thresholds was found for the medium external noise condition for the current study. However, unlike Wagner et al. (29) who reported significantly higher thresholds only for the MA group at high external noise levels, there were no differences between groups in our study. It is acknowledged that the migraine groups are small in this study; however an examination of thresholds did not show a trend for higher thresholds in the MA group in any of the external noise conditions (see Figure 5).
A difference between our study and Wagner et al. (29) was the viewing distance, which was four times closer in our study and altered the size of the stimulus. However, subsequent testing of three participants, two controls and one migraineur, at both viewing distances, showed that viewing distance does not systematically change threshold estimates (Figure 9). Therefore, given that there was a significant difference with high external noise although not medium external noise, and subsequent testing showing that viewing distance does not change threshold estimates, the findings are broadly consistent with Wagner et al. (29) except for the MA vs. MO group differences.
This figure shows the luminance increment thresholds for three observers (one migraine and two controls) for the detection task at a viewing distance of 65 cm and 260 cm.
A very large population study would need to be conducted to conclusively determine whether there are significant performance and internal noise differences between migraine sub-groups. To meet criteria for MA the individual must experience aura in at least some but not all of their migraine episodes (44). However, one study found that up to 70% of their participants had experienced both migraine with and without aura episodes at different stages (51). Given this considerable overlap between MA and MO episodes, it is recommended that visual processing is examined in a large group of migraineurs using a battery of tests that incorporate measures of both threshold and internal noise. An analysis of the data could then be conducted to determine whether clusters of visual performance differences indicate that sub-groups of migraine can be detected reliably.
The estimates of internal noise from our study provided further evidence for increased multiplicative noise in migraineurs as shown by significant differences in internal noise estimates at high external noise levels (Figure 6), which is consistent with Wagner et al. (29). This increased multiplicative noise may arise from the mechanisms that process contrast in V1 or may result from contrast processing mechanisms earlier in the visual pathways. The results also suggest that migraineurs do not have decreased efficiency for contrast processing because that should result in an increase in thresholds when there is no external noise present (see Figure 3 in Wagner et al. (29) for more detail).
A recent study by Allard and Cavanagh (52) used a crowding paradigm to test the assumption made by internal noise estimation methods that the processing strategy is unaltered when external noise is added. Crowding has been shown to only occur with recognition tasks whilst detection tasks remain unaffected (53,54). Therefore if crowding is present at high external noise but not at low levels then the processing strategy must have changed from detection to recognition. The results showed that crowding can be avoided at high external noise levels if the noise is spatially and temporally extended but does occur otherwise. Therefore, according to Allard and Cavanagh the differences in multiplicative noise found by Wager et al. (29), and by extension the current study, could reflect a processing strategy change. However, crowding has been shown to only occur in the periphery whilst changes in the fovea can be predicted by the strength and extent of contrast masking. Given that the stimuli in the Wagner et al. (29) and the current study were shown in the fovea (participants moved their eyes to focus on both arrays separately) it is unlikely in the current study that a crowding-induced change in strategy could account for the differences found.
Furthermore, Wagner et al. (29) used the perceptual template model to characterise performance. This model not only provides estimates of internal noise (both additive and multiplicative) and efficiency but also contains a perceptual template, i.e. a filter with specific selectivity for the stimulus characteristics, and the properties of this filter may be estimated by collecting classification images (55,56). Therefore, if there was a difference in processing strategy from low to high external noise, there should have been a difference in the perceptual template at the different external noise levels. There were no such differences reported by Wagner et al. (29). Therefore, for the current study, it is suggested that the results reflect an increase in multiplicative internal noise rather than a change in processing strategy.
Further evidence for increased internal noise in migraineurs was found in the RF discrimination task. The data showed, on average, a significantly higher internal noise level for the migraine group when there was no added external noise, but no significant difference between groups at high external noise levels. This finding suggests that migraineurs have increased additive internal noise (random and independent of the stimulus noise level) associated with mechanisms that process radial frequency contours, probably in cortical area V4 (40,43). However, there was no difference in thresholds between groups for either experimental condition, suggesting that position coding performance in migraineurs is comparable to controls, despite increased additive internal noise. At high external noise levels, additive noise is a small proportion of the variability and therefore does not significantly impact performance even though it is still present. This finding is consistent with previous research (12), which also found no difference in position coding for migraineurs using a vernier acuity task, but did not directly address internal noise, and suggests that in order to maintain the same threshold and to compensate for increased additive internal noise migraineurs would need increased efficiency associated with position coding. As previous research using vernier acuity tasks did not address either internal noise or efficiency it would be useful to examine position coding using both a vernier acuity task and a global form task within the same group of migraineurs to determine whether there is a general increase in both efficiency and internal noise levels associated with position coding and whether it is specific to tasks involving cortical area V4.
The findings from the spiral path experiment suggest that migraineurs do not have a general increase in multiplicative internal noise associated with cortical area V1, as there were no significant differences in either threshold or internal noise estimates between controls and migraineurs despite differences being found on the contrast detection task. Furthermore, as the processing of local orientation and position information in V1 is critical for the integration of global form processing (V4) and there was no difference in internal noise associated with the spiral path task, it is suggested that the increased additive noise associated with the RF task is localized to V4 and does not arise from processing deficits in V1. However, as suggested above, it would be useful to measure position coding and internal noise in V1 to provide conclusive evidence for normal processing of this property in V1 in migraine. The results from the spiral path task are consistent with findings from our previous study (31), which looked at global form processing using a spiral angle discrimination task rather than a position coding task used in the current study. We found no difference in internal noise estimates between controls and migraineurs, suggesting that migraineurs have no increase in internal noise associated with these forms of angular discrimination.
This study also more generally illustrated the importance of (i) incorporating an internal noise estimation method in the study and (ii) adding external noise to the stimulus to measure performance. The current study demonstrated that increased additive internal noise can co-occur with an absence of differences in thresholds as shown by performance of migraineurs on the RF task. Secondly, adding external noise allowed multiplicative noise in the system to be estimated. Without adding external noise the N-pass method is unable to dissociate multiplicative and additive noise components and separate them from efficiency in order to provide a complete picture of the mechanisms that affect visual performance. The N-pass (32–34) method is appropriate for use with a clinical sample as it requires a smaller quantity of data than other methods, reducing testing time, which can be a limiting factor when using clinical samples. However, there are some costs when using small data samples. Classification images (see Levi and Klein (55) and Ahumada (56) for a review), which provide information about the components of the stimulus the observer uses to make a judgement, could not be obtained. 2 Therefore, there is no direct measure of observer efficiency available. However, differences in efficiency can be suggested by using external noise to map performance changes when accompanied by a measure of internal noise (see Figure 3 in Wagner et al. (29) for details). Decreased efficiency results in consistently higher thresholds across all external noise conditions, but does not change internal noise estimates, i.e. the point at which the internal and external noise are ‘equivalent’ does not change.
In summary, there is a growing body of evidence from this current study, and also the studies of Wagner et al. (29) and Webster et al. (31) that suggests that one mechanism alone cannot account for all psychophysical differences observed in migraineurs. Previous research (31) has found evidence for decreased efficiency associated with motion coherence processing. There is evidence from both the current study and Webster et al. (31) which indicates that angular discrimination is normal in migraineurs and there is no difference in internal noise levels associated with the mechanisms that process angular information. The current research provides evidence for increased additive internal noise associated with position coding, co-occurring with increased efficiency, and also increased multiplicative internal noise for contrast processing, suggesting that no single mechanism can account for all visual performance differences in migraine.
Footnotes
Notes
Funding
This research was supported by NHMRC Project grant #509208 (to authors AMM and DRB).