
Abstract
Purpose: People with migraine often report aversion to flickering lights and show abnormal results on behavioural tasks that require the processing of temporal visual information. Studies have reported that the cortically evoked electrophysiological response to a flickering visual stimulus is abnormal; however, none have considered whether there is an underlying pre-cortical abnormality. In this cross-sectional study, we consider whether people with migraine have retinal and cortical electrophysiological abnormalities to flickering stimuli.
Methods: Monocular transient (1 Hz) and steady-state (8.3 Hz) pattern reversal electroretinograms (PERGs) and pattern visual evoked responses (PVERs) were measured simultaneously in 45 people with migraine (26 without aura, 19 with aura) and 30 non-headache controls at a time between migraine attacks.
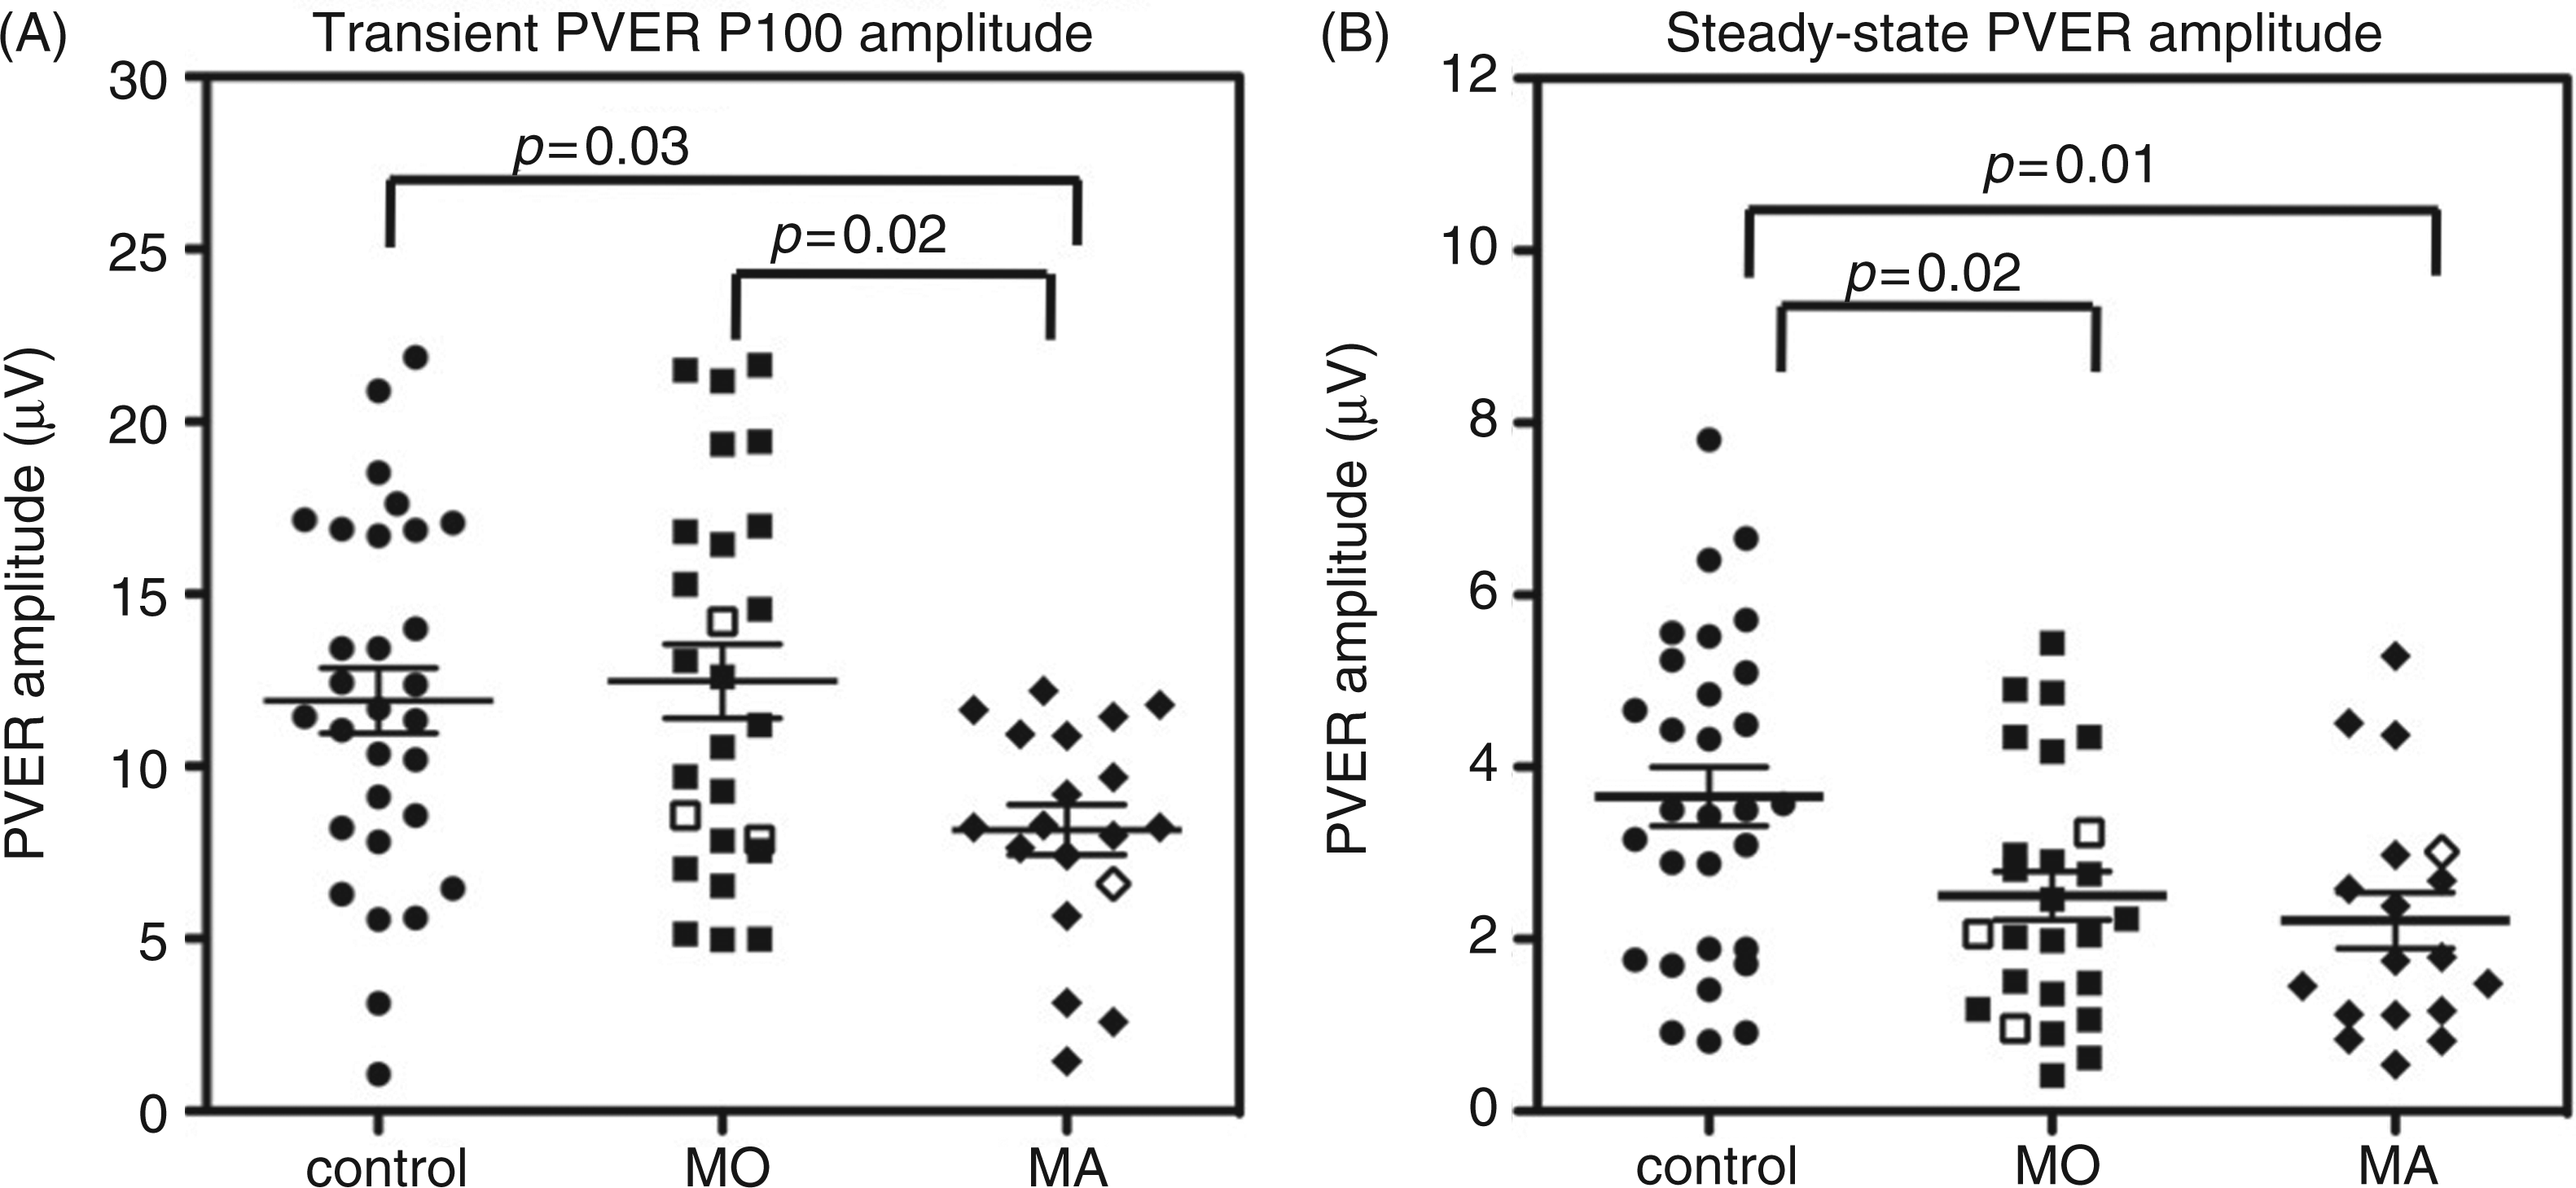
Results: PERG amplitude and timing did not differ significantly between groups. Transient PVER amplitude was significantly reduced (28%) in the migraine with aura group compared to the controls F(2,72) = 3.6, p = 0.03). Both migraine groups showed significant reductions (32%, 39%) in steady-state PVER amplitude relative to controls (F(2,70) = 4.3, p = 0.02).
Conclusions: This study finds normal retinal processing of flickering stimuli in the presence of abnormal cortical function between migraine attacks.
Introduction
Most studies of visual processing in people with migraine focus on cortical processing, as migraine is a disorder of the central nervous system (1). Abnormal performance on cortically processed behavioural tasks has been well documented between migraine attacks (2–8). Such tasks rely on normal contrast processing, which begins in the retina, then the lateral geniculate nucleus, before further processing in the primary visual cortex (V1) (9). It is important to ensure that differences attributed to cortical processing do not reflect reduced inputs from earlier, pre-cortical stages of the visual pathway.
Several lines of research suggest non-cortical dysfunction in migraine. Between attacks, people with migraine show abnormal performance on behavioural tasks designed to assess pre-cortical function (8,10–12). Visual field deficits associated with migraine can be non-homonymous and unilateral (13–19) and sometimes described as ‘glaucomatous’ because of their localised and arcuate pattern (13,17). It has been suggested that such deficits may arise from peripheral vascular causes (17,20), with indirect evidence being an association between migraine and peripheral vasospastic tendencies (20), including transient retinal blood flow changes (21). Moreover, migraine is a recognised risk factor for visual field progression in normal tension glaucoma (22) – a form of glaucoma associated with a vascular aetiology (20) – and has been associated with retinal nerve fibre layer loss (23).
One method of comparing retinal to cortical function in the same individual is by concurrent electrophysiological measurement of neuronal activity in the eye and brain. Pattern electrophysiology invokes activity of contrast-dependent neurones. The pattern electroretinogram (PERG) assesses the integrity of retinal ganglion cells, whereas the function of the visual pathway, including V1, can be assessed with the pattern visual evoked response (PVER) (24). The patterned stimulus can be contrast-reversed at different temporal frequencies. The standard electrophysiological response is a transient response (<3 Hz), where the response is complete before the next contrast reversal. Transient recording allows visualisation of a single waveform characterised by identifiable components. At higher temporal frequencies (≥4 Hz), the successive waveforms overlap and a steady-state response is generated. Steady-state electrophysiological recording is presumed to measure similar mechanisms as behavioural measures of temporal processing (flicker). Flickering and moving stimuli have consistently identified differences between migraine and non-headache groups, (2,3,5–8,11,14,19,25,26) including tests of pre-cortical function (10,16).
Previous electrophysiological studies during the interictal period in migraine have yielded varying outcomes (27,28). Many studies report anomalous PVER results, but most do not consider whether the retina is normal. Only two studies have noted that the PERG was normal in the presence of abnormal cortical function, both measured using transient stimulation (29,30). However, despite studies that have found abnormal cortical responses to steady-state stimulation (31–33), the steady-state retinal response has not previously been measured in migraine.
The purpose of this study was to measure both transient and steady-state retinal and cortical responses in the same individuals with migraine on the same day. This will bring together a range of techniques that have been used previously in isolation to build up a more complete picture of how the electrophysiological response is different between migraine attacks. We hypothesise that a concomitant retinal and cortical abnormality would suggest that the cortical involvement arises, at least partly, downstream from retinal dysfunction. To our knowledge, this is the first study to measure steady-state and transient electrophysiological responses at the retina and cortex simultaneously, which will reveal whether the cortical abnormalities are explained by aberrant function earlier in the visual pathway.
Methods
Participants
Participants in this cross-sectional study were recruited via an advertisement within the University of Melbourne community, as well as from a database of previous study participants, from June 2010 to September 2011. Thirty non-headache controls (aged 19–46 years, mean ± standard deviation [SD]: 26 ± 7), 26 people with migraine without aura (MO, aged 20–41 years, mean ± SD: 28 ± 6) and 19 people with migraine with aura (MA, aged 19–43 years, mean ± SD: 33 ± 6) were tested at the Department of Optometry and Vision Sciences at the University of Melbourne. On average, the MA group was older than the control and MO groups (F(2,72) = 6.88, p = 0.002). The proportion of males to females was not significantly different between each group (controls 9:21, MO: 4:22, MA: 5:14).
All participants had best corrected visual acuity of 6/7.5 or better and refractive errors of less than ±5.00 D sphere and −2.00 D astigmatism. Participants were free from systemic disease and medications known to affect visual function or neurological state, including prophylactic migraine medications, and had normal findings in a comprehensive eye examination (slitlamp biomicroscopy, applanation tonometry, ophthalmoscopy and optic nerve head imaging). All participants were classified as within normal limits using the Moorfield’s regression analysis (MRA) tool of the Heidelberg retinal tomograph (Heidelberg Engineering, Heidelberg, Germany). The MRA has excellent specificity (>85%) for cross-sectional diagnoses of open-angle glaucoma (34).
Control participants had never experienced a migraine and were free from regular headaches (less than four in the past year). All migraine participants met the criteria of the International Headache Society for either MA or MO (35) and were tested at least seven days after a migraine attack to minimise residual effects of medications and the possible influence of transient post-migraine fatigue or nausea. Participants completed a custom headache questionnaire and the Migraine Disability Assessment Score (MIDAS) to determine a variety of headache characteristics, summarised in Figure 1. The MIDAS questionnaire is a validated tool that scores the impact of headaches on tasks of daily living over the past three months (36). MIDAS scores are interpreted as minimal (grade 1, score 0–5), mild (grade 2, score 6–10), moderate (grade 3, score 11–20) or severe disability (grade 4, score 21+). Six of the 30 control participants (20%) reported that only one family member suffered from migraines (e.g. mother, sister, grandmother), whereas 33 of the 45 participants with migraine (73%) had at least one other family member who suffered from migraines (e.g. parent, sibling, grandparent, aunt, cousin).
Comparison of migraine characteristics between the MO and MA groups. The boxes represent the 25th, 50th and 75th percentiles, with the whiskers showing the 10th and 90th percentiles. All outliers are shown as individual symbols. (A) Age at first migraine, (B) years of migraine (estimated from the age of first migraine), (C) number of lifetime attacks (estimated from migraine frequency and years of migraine), (D) days since last migraine, (E) number of weeks between migraines (estimated from the self-reported number of migraines in past year), (F) MIDAS score, the total number of days of lost productivity due to migraine over the past three months. MO: migraine without aura; MA: migraine with aura; MIDAS: Migraine Disability Assessment Score.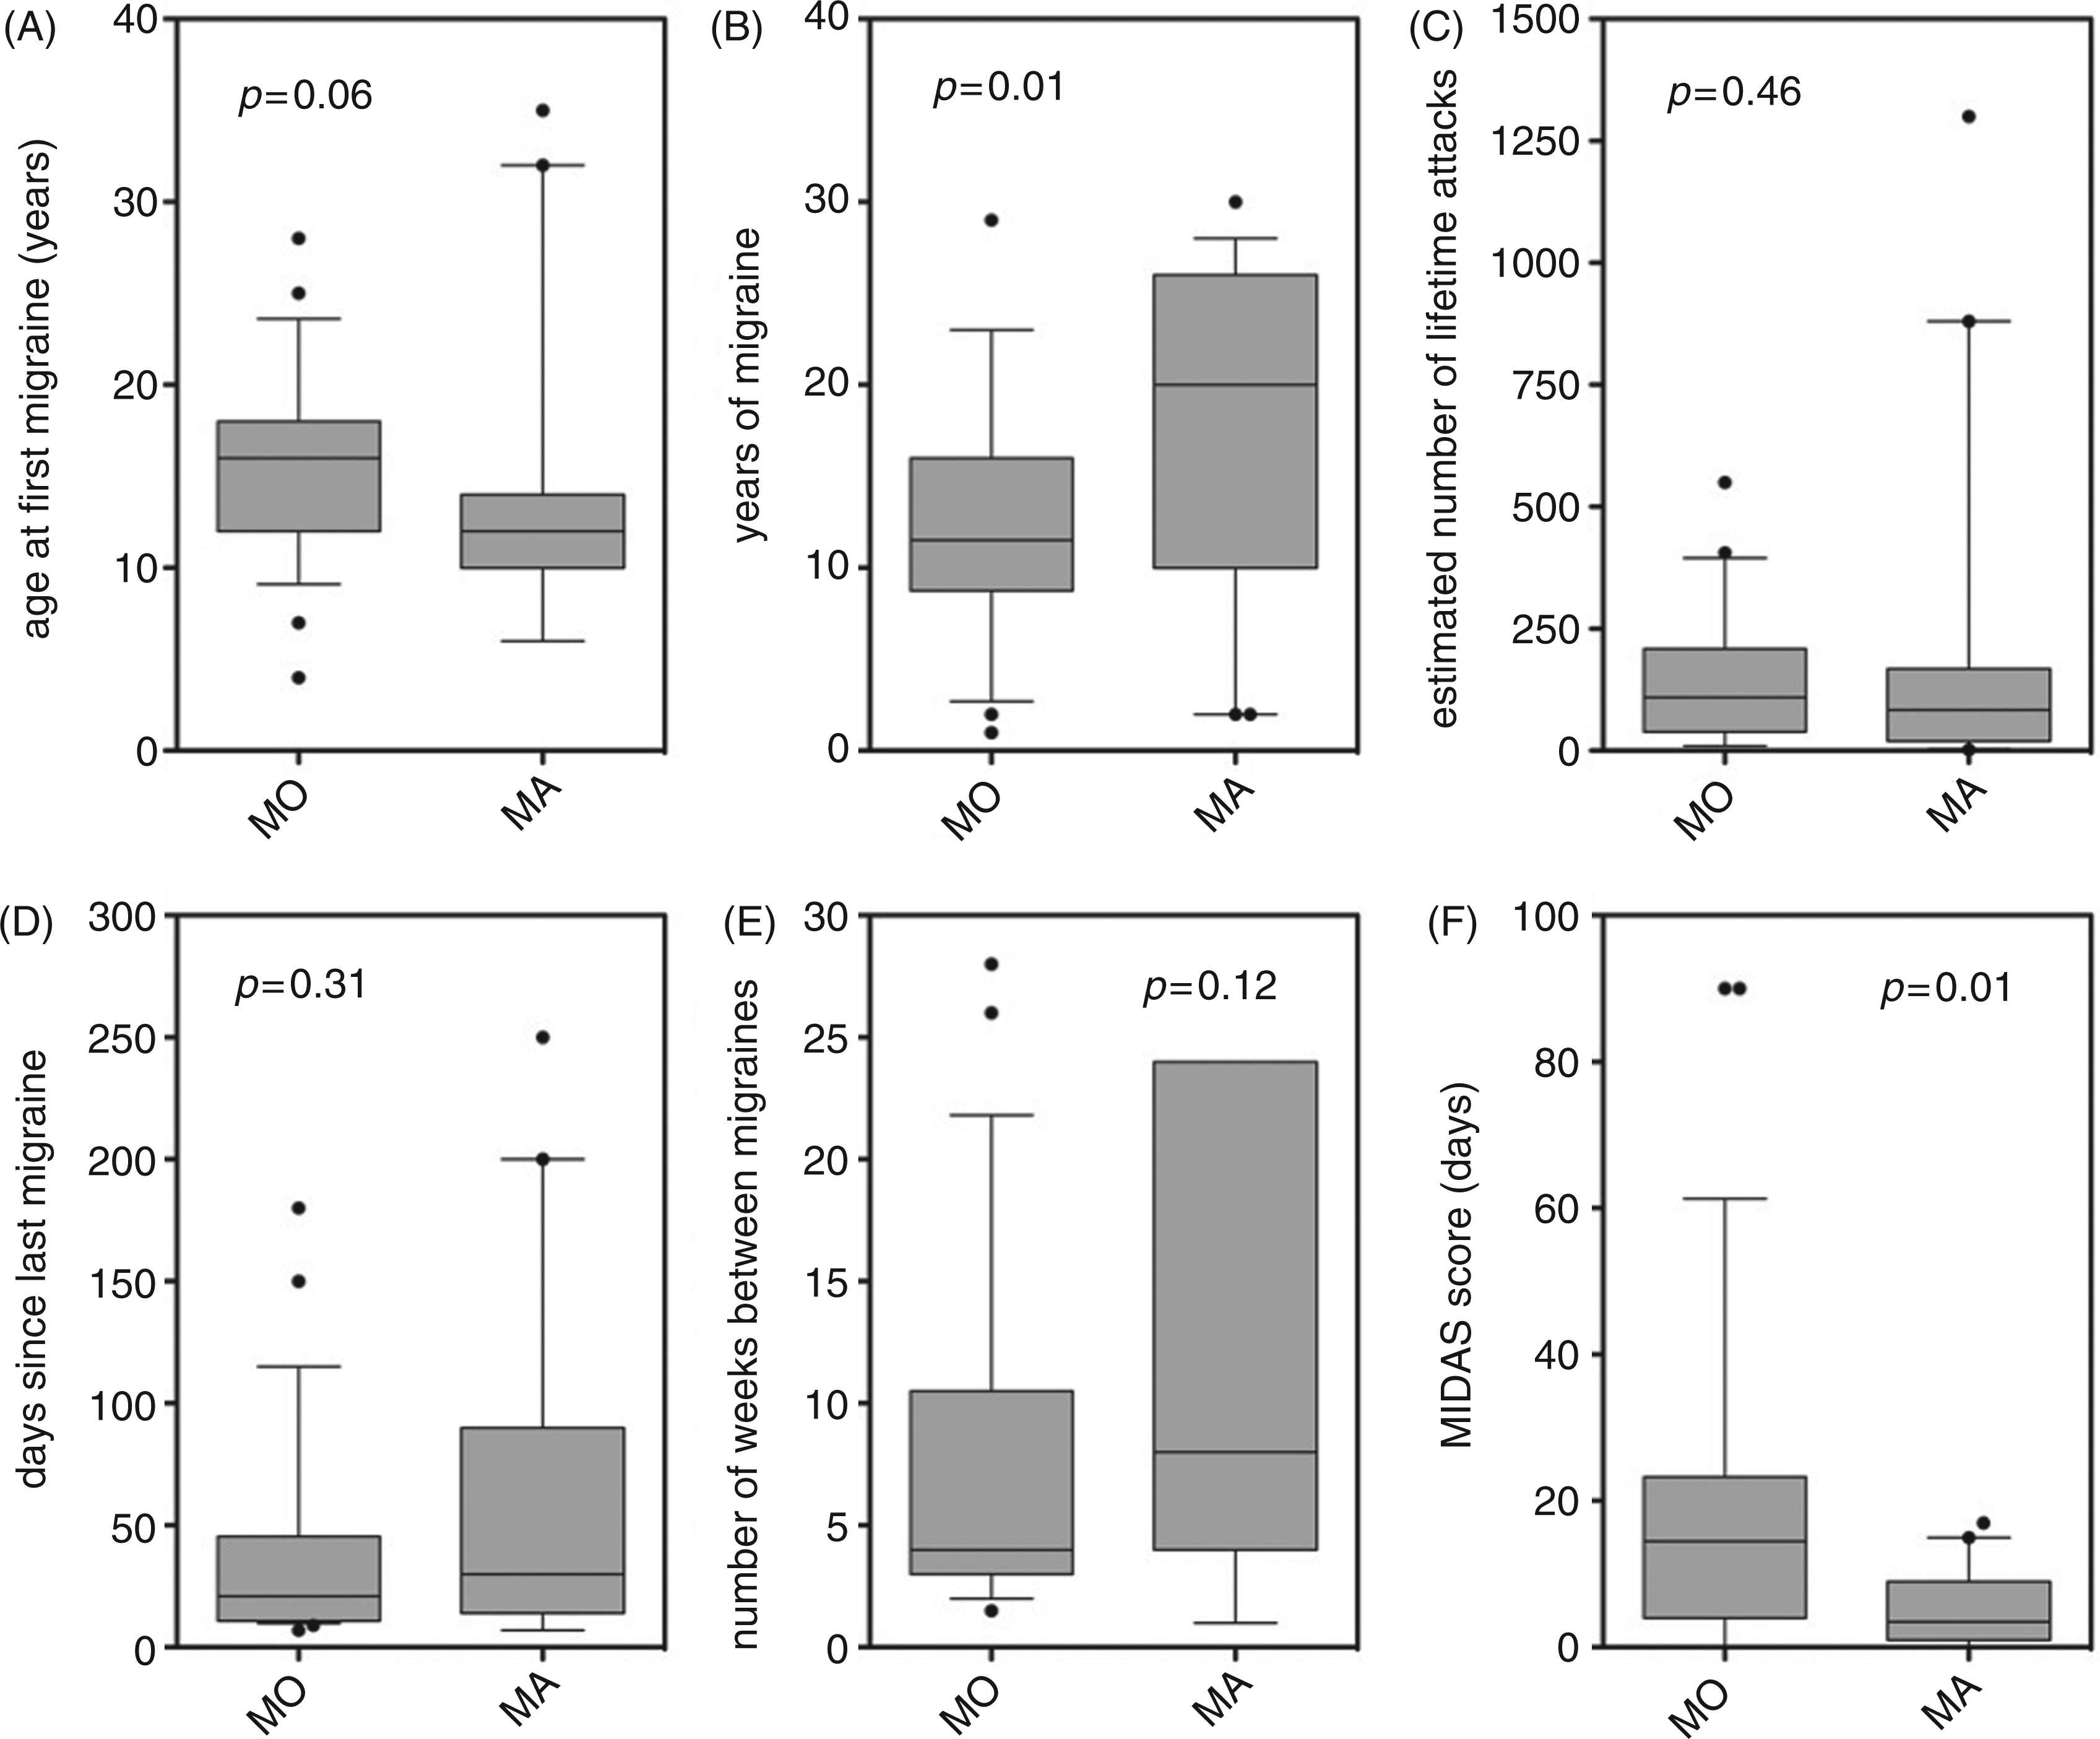
Of the eighty people who agreed to participate in the study, five participants attended the test session but did not complete the testing, as they were excluded for the following reasons: ptosis (one control), glaucoma suspect (one MO), more than four headaches in the past year (four controls) and high intraocular pressure (one control). Thus, the final sample size for analysis was 75 participants (30 non-headache, 26 MO, 19 MA). A power analysis was performed using data from studies that have previously used the steady-state PERG to test people with early glaucoma (37,38). The power analysis indicated that 17 participants in each group provided a power of 80% for detecting a reduction (alpha of 0.05) in the steady-state PERG response of one-third the magnitude observed in people with early glaucoma, because more subtle deficits are expected with migraine.
All participants provided written informed consent prior to testing in accordance with a protocol approved by the Human Research Ethics Committee of the University of Melbourne and compliant with the tenets of the Declaration of Helsinki.
Timing of the test visit
For migraine participants, the test visit was scheduled at least seven days after a migraine. Albeit not a formal requirement of our study, all participants were asked to advise of any adverse effects in the days after the test session, including when their next migraine occurred. In the majority of cases, participants responded to our follow-up attempts that they did not have another migraine in the 72 hours after the test. Of the 45 people with migraine tested, four participants reported a migraine the day after testing. Data from these participants are represented as unfilled symbols (see Figure 4).
Pattern electrophysiology
The PERG and PVER were recorded simultaneously from each eye according to ISCEV (International Society for Clinical Electrophysiology of Vision) standards (39,40) using the Espion system (Diagnosys LLC, Cambridge, UK). A black-and-white square-wave checkerboard stimulus was presented on a gamma-corrected Sony G520 21-inch CRT monitor (100 Hz, 1024 × 768 pixels). The checkerboard subtended 31° at a viewing distance of 50 cm, and consisted of 0.8° checks of 96% contrast and mean luminance of 52 cd/m2. The contrast of the checkerboard was counterphased at 1 Hz (transient) and 8.3 Hz (steady-state). In addition, the transient response to 0.25° checks was measured to confirm the absence of optical problems that may affect the response to finer checks (39). The steady-state response to 16° checks was recorded to enable determination of the PERG ratio (41)—a sensitive measure of PERG dysfunction. The different spatiotemporal frequencies were presented in random order and counterbalanced between participants. A 0.5°-diameter red square provided a central fixation target.
PERG responses were recorded with corneal DTL electrodes near the lower limbus and referenced to the ipsilateral canthus with silver-silver chloride electrodes. The PVER was recorded with gold cup electrodes at Oz, OR and OL, and referenced to Fz with the common ground at Cz (Figure 2). Electrode impedance was kept below 5 kΩ. Signals were amplified, bandpass-filtered (1.25–100 Hz) and digitised (1000 Hz) to 16-bit resolution. Blink artefacts where signals exceeded ±100 µV were automatically rejected. As people with migraine can find high-contrast patterns aversive (42), each stimulus presentation was limited to approximately 20 seconds, corresponding to 25 sweeps, followed by a brief break. A total of 200 signals were averaged for each stimulus condition of differing spatiotemporal frequency. To confirm intrasessional reproducibility, we computed an index of response consistency (39,40), the coefficient of variation (COV) between two consecutive partial averages of 100 sweeps. Typically, the COV of amplitude for the PERG (transient 9.1%, steady-state 8.1%) and PVER (transient 10.7%, steady-state 9.8%) were comparable to those reported in the literature (data not shown) (43,44). A typical recording session lasted approximately 35 minutes.
Electrode locations for simultaneous standard PVER/PERG recording. (A) For the PVER, scalp electrodes are placed in proportion to the size of the head in accordance with the International 10-20 system, which divides the distance between the two bony landmarks, the nasion and inion, into 10% and 20% proportions. The active PVER electrode is located along the vertical midline at OZ and the inactive reference electrode at FZ. For the PERG, the active electrode is a DTL carbon-fibre electrode placed along the lower eyelid margin. The inactive PERG electrode is a skin electrode placed at the cheekbone (left eye shown only). The common ground electrode is placed at CZ, midway between the nasion and inion on the midline. (B) The right and left lateral PVER electrodes are placed at OR and OL, respectively. PVER: pattern visual evoked response; PERG: pattern reversal electroretinogram.
Analysis was performed offline using Microsoft Excel (Microsoft, Redmond, WA, USA). Peak-to-peak amplitudes and peak times for the transient PERG P50 and N95 and PVER P100 and N135 were measured according to ISCEV standards (39,40). Retinocortical time was calculated as the interlatency period from the PERG P50 to PVER P100, as a measure of signal transmission time between retina and cortex (45). Steady-state waveforms were analysed in the frequency domain after discrete Fourier transformation of resampled waveforms into a binary series (Figure 3). Because every change from black to white represents a single change in contrast, the largest contrast-evoked response is at the contrast-reversal frequency, which occurs at twice the stimulation frequency (second harmonic 2F, 16.7 Hz). Steady-state responses were excluded if the 2F amplitude was not significantly different from noise (p > 0.05), where noise was estimated from the average amplitude at the two neighbouring frequencies (14.6 and 18.8 Hz) (46). Phase was calculated from the arctangent of the ratio of the real-to-imaginary components of the discrete Fourier analysis. Because there can be an infinite set of phases separated by 2π radians with the same arctangent, the value modulo was returned (π rads). The phase convention was such that increasing phase corresponded to a delay in the signal. PVER interhemispheric asymmetry was defined as the absolute percentage amplitude difference between the response at OR and OL (29) (Figure 2). A PERG ratio was computed by dividing the steady-state amplitudes to 0.8° and 16° checks (41).
Schematic of PERG/PVER recording setup and representative waveforms. (A) The transient PVER waveform is characterised by a prominent positive peak at 100 ms (vertical dotted line). The P100 amplitude is measured as the peak-to-peak distance from the first negative trough at 75 ms (N75) to the top of the positive peak. The N135 amplitude is taken from the P100 to the second negative trough (vertical dashed line). (B) The transient PERG waveform is characterised by a prominent positive peak at 50 ms (P50, vertical dotted line) and a negative trough (N95, vertical dashed line). Peak-to-peak P50 and N95 amplitudes are taken from N35 to P50, and P50 to N95, respectively. (C) Steady-state waveforms are resampled to give 512 data points and converted into the frequency domain by discrete Fourier transformation in order to measure the amplitude at the second harmonic (2 F). Noise is derived from the average amplitudes at the two neighbouring frequencies, 14.6 and 18.8 Hz (vertical dotted lines). PVER: pattern visual evoked response; PERG: pattern reversal electroretinogram. Distributions of the (A) transient PVER P100 amplitude and (B) steady-state PVER 2F amplitude in the control, MO and MA groups. The four participants who happened to be tested the day before a migraine are shown as unfilled symbols. Error bars indicate the mean ± SEM. PVER: pattern visual evoked response; SEM: standard error of the mean.
Statistical analysis
Statistical analysis was performed using SPSS version 17.0 (SPSS Inc., Chicago, IL, USA). Age was entered as a covariate in all the analyses. Comparisons between control and migraine groups were performed using a repeated measures analysis of co-variance (RM-ANCOVA). Comparisons between migraine groups were performed using student t-tests or non-parametric Mann-Whitney rank sum tests where the data was non-Gaussian (Kolmogorov-Smirnov test). A p < 0.05 was considered significant for all statistical evaluations. As there was no difference between the left and right eyes for any measures, the right eye response is represented in all figures.
Results
Migraine characteristics
Figure 1 shows boxplots of the migraine characteristics. The MA group had a longer duration of migraine history (Mann-Whitney rank sum test, p = 0.01), whereas the MO group reported significantly greater impact of their migraines on daily activities, as reflected in the higher MIDAS questionnaire scores (Mann-Whitney rank sum test, p = 0.01).
Was there evidence for retinal dysfunction in people with migraine?
Summary of PERG parameters (mean ± SD). a
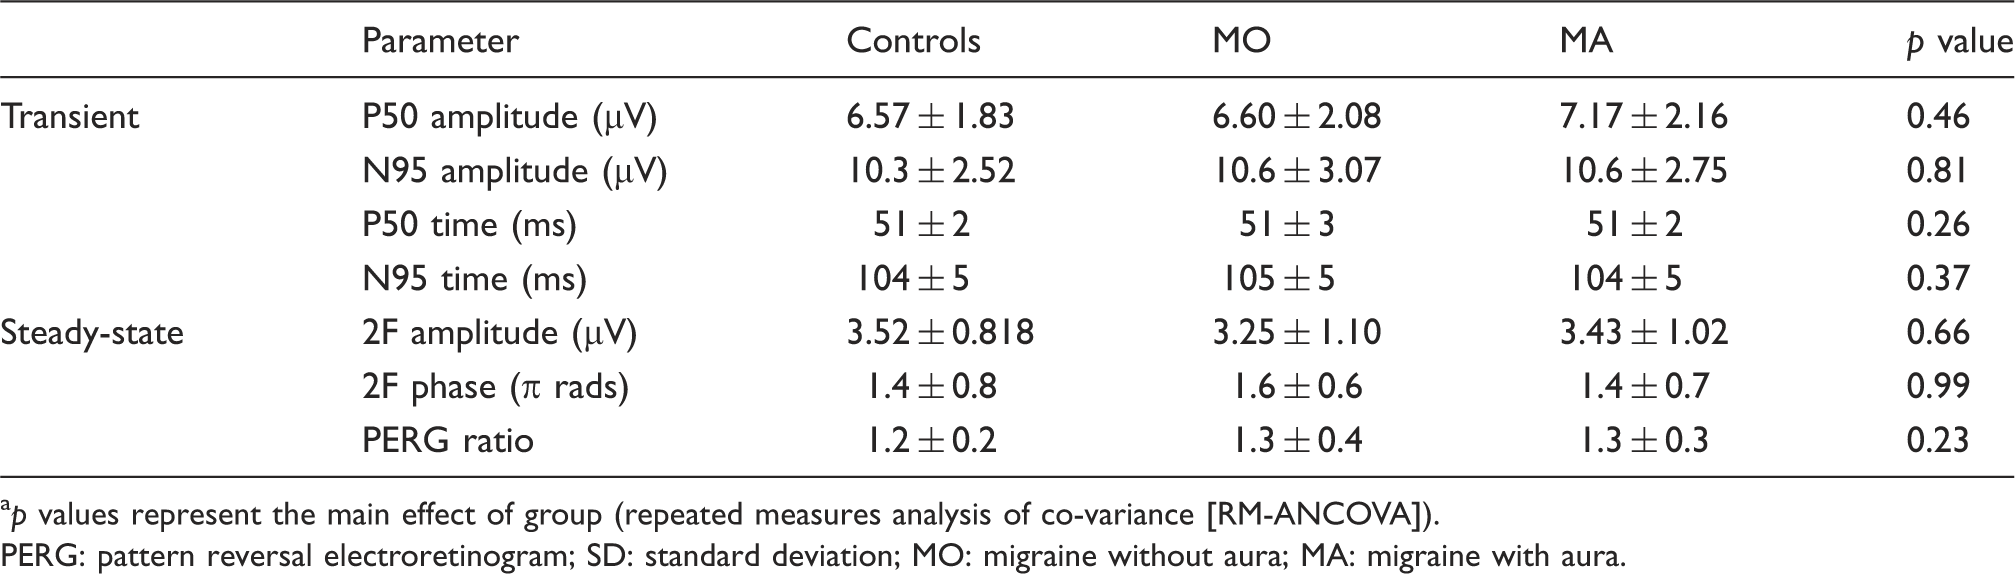
p values represent the main effect of group (repeated measures analysis of co-variance [RM-ANCOVA]).
PERG: pattern reversal electroretinogram; SD: standard deviation; MO: migraine without aura; MA: migraine with aura.
Was there evidence for cortical dysfunction in people with migraine?
Summary of PVER timing parameters (mean ± SD). a

p values represent the main effect of group (repeated measures analysis of co-variance [RM-ANCOVA]).
PVER: pattern visual evoked response; SD: standard deviation; MO: migraine without aura; MA: migraine with aura.
Figure 4 shows the group mean steady-state PVER amplitudes. The steady-state response of one MA participant was excluded from analysis, as the signal was not significantly different to noise. Relative to controls, the steady-state PVER amplitudes of the migraine groups were reduced (RM-ANCOVA: within factor: eye; between factor: group; F(2,70) = 4.293, p = 0.02). Both migraine groups were similarly affected (post-hoc Bonferroni multiple comparisons MO: p = 0.02, MA: p = 0.01). When normalised to the mean control 2F amplitude, the MO group and the MA group amplitude were reduced, on average, by 32% and 39%, respectively. There was no significant difference in phase between groups (Table 2).
Because an increased interhemispheric asymmetry in PVER has been reported previously in some migraine studies (29,47–50), we recorded the PVER at the right and left hemispheres, and calculated an absolute amplitude asymmetry. For the steady-state PVER, the lateral responses of three controls and four MA participants were excluded because at least one response was not significantly different from noise. Separate RM-ANCOVA (within factor: eye; between factor: groups) analyses showed that there was no difference in percentage asymmetry for either transient (controls: 16.2 ± 11.4%; MO: 21.2 ± 15.5%; MA: 22.8 ± 19.6%) or steady-state responses (controls: 18.2 ± 13.2%; MO: 24.4 ± 17.3%; MA: 19.4 ± 9.3%). Given that the PVER amplitude can be altered in the pre-attack period (within 72 hours of a migraine) (51), we excluded the data from the four individuals who reported a migraine the day after the test session (unfilled symbols in Figure 4). The results of the statistical analyses were unchanged.
Did the steady-state response reveal greater dysfunction than the transient response?
To compare steady-state to transient responses between groups, we analysed the P100 and 2F PVER amplitudes in a combined RM-ANCOVA (within factors: eye and test type; between factor: group), where test type was transient or steady-state (Figure 4). The PVER amplitude differed between the groups (F(2,70) = 3.53, p = 0.04). Post-hoc Bonferroni multiple comparisons revealed that the PVER amplitudes of the MA group were reduced for both test types relative to the MO (p = 0.05) and control groups (p = 0.01), whereas the PVER amplitudes of the MO and control groups were similar. The interaction between test type (transient vs. steady-state) and group approached significance (F(2,70) = 2.91, p = 0.06). Effect sizes (Cohen’s d) were determined to enable comparison of the magnitude of PVER deficit across both transient and steady-state recording, taking into consideration measurement variability. The effect size (d) represents the difference between the control and MA groups in numbers of standard deviations, which was calculated as


Relationship with migraine features
Steady-state PVER amplitudes were reduced in both migraine groups relative to controls. To explore the possibility that the reduced cortical response was related to a migraine feature other than the presence or absence of aura, Spearman’s rank correlation coefficients were determined for the entire migraine cohort. There were no significant correlations between PVER amplitude and any of the reported migraine characteristics (age at first migraine, duration of migraine history, estimated number of lifetime attacks, days since last migraine, weeks between migraines and days of lost productivity in past three months).
Discussion
This study aimed to determine whether people with migraine have abnormal retinal and/or cortical electrophysiological responses between attacks, and included both steady-state and transient protocols. The steady-state response is the response to rapidly alternating stimuli, whereas the transient response is seen to low temporal frequencies. Note that the terminology ‘sustained’ and ‘transient’ are often used to mean the opposite, outside of electrophysiology. A concomitant PERG and PVER abnormality would suggest that the abnormal cortical response arises, at least partly, downstream from retinal dysfunction. There was no evidence for such an effect within our data. The exact site of the abnormal cortical response is unclear, as the PVER reflects the patency of input from LGN to V1, and includes the input of lateral connections within V1, as well as feedback connections to V1 from higher cortical areas. Our findings are consistent with previous studies where the transient PERG was normal but the PVER was abnormal (29,30).
A novel component of this study was the addition of steady-state recording to the standard clinical protocol of transient recording, given the vast number of behavioural studies that report abnormal visual function with flickering or moving stimuli between migraine attacks (2,3,5–8,10,11,14,16,18,19,25,26). Steady-state PERG measures are more sensitive than transient measures in identifying early retinal ganglion cell dysfunction (41). In our study, both transient and steady-state PERG measures were normal. Given behavioural evidence for pre-cortical dysfunction (8,10–12), our findings do not necessarily preclude the presence of some retinal involvement in migraine. Rather, the standard clinical protocols employed in this study do not identify abnormalities in people with migraine. This result might arise if the test is insensitive to the type of dysfunction possibly present in migraine. Unlike glaucoma, migraine is not a predominant and global retinal ganglion cell dysfunction, for which the PERG is a sensitive indicator (24). If pre-cortical dysfunction in migraine is of a more subtle or localised nature, it may not be detected by our standard, full-field PERG paradigm. Further investigations may make use of multifocal ERG and VER techniques that enable high spatial resolution and have the potential to provide more information about the presence of localised visual field deficits in people with migraine (13–19).
For the transient PVER, the only abnormal finding was a reduced P100 amplitude within the MA group. Most PVER studies report increased P100 amplitude or no difference at all (27,28). There are difficulties reconciling electrophysiological studies in migraine due to vast differences in experimental protocols. If we compare our results to those obtained under similar stimulus conditions (1 Hz), one study reported a 17% reduction in P100 amplitude in a pooled migraine group (52), while another reported a 36% reduction in P100 amplitude in people with at least 30 years of migraines with aura (53). In contrast, other studies report increased amplitude in specific migraine groups (left-sided hemicrania (54), MO and short-duration MA of less than 10 years (30)) or normal performance (32,49). For the steady-state PVER, we found reduced amplitudes in both migraine groups. In contrast, previous studies have in general reported higher steady-state amplitudes, although the test protocols varied considerably (31–33). Shibata and colleagues observed a significantly increased second harmonic amplitude in both MO and MA groups relative to controls at 5 Hz but not 10 Hz (31). The difference was evident for the grating pattern of 0.5 cyc/deg spatial frequency (equivalent to 1.4° checks) and not for the smaller patterns tested (2 cyc/deg = 0.4°). Marrelli et al. tested children with migraine and found higher amplitudes for the first harmonic response only (32). The presence of a significant first harmonic, however, may indicate technical problems (40), as the greatest response is expected to occur at the contrast-reversal frequency (second harmonic). The protocol used by Diener et al. (33) is most similar to ours (1° checks at 8.33 Hz), but the signals were not analysed in the frequency domain and therefore are difficult to compare to our findings.
One possible interpretation of our data is that reduced PVER amplitudes reflect a low cortical pre-activation level (55), which has been proposed to arise from lower levels of central neuromodulators (e.g. serotonin (56)). Indirect evidence for a reduced pre-activation level in migraine in visual electrophysiology studies is the initial reduction in PVER amplitude relative to controls in the first block of averaged responses, typically obtained within the first minute of recording (57–59) or when two paired-pulse responses are measured in close succession (60). Parallel findings of reduced somatosensory evoked early high-frequency oscillations also imply decreased cortical activation in both MA and MO (61). With increasing stimulation, the cortical response is augmented up to a maximum (or ‘ceiling’), at which point the response is reduced (habituation) in non-headache controls (for a review, see Coppola and colleagues (62)). A low pre-activation state may be protective against cortical hyperexcitability, the presumed anomalous neural state in migraine, by allowing for a large range of activity before the ‘ceiling’ is reached (55). Deficient habituation is the most consistent electrophysiological finding across multiple sensory modalities in migraine (62) and is typically demonstrated using continuous stimulation for at least two minutes. As we did not wish to study habituation, the stimuli in our study were presented for a short time (approximately 20 seconds) with brief breaks between each presentation, which is typical of clinical PVER recordings. Most PVER studies that have not specifically explored habituation fail to specify whether the recordings are made continuously. Without breaks between presentations, the increased PVER amplitude often reported may result from the averaging of progressively larger amplitudes over time due to abnormal habituation in migraine (55).
Alternatively, changes in PVER amplitude might reflect anomalies in the balance between intracortical inhibition and excitation, in particular manifesting as a difference in perceptual centre-surround suppression. Recently, Battista and colleagues demonstrated enhanced centre-surround suppression in migraine (2,3), leading to a greater reduction in the perceived contrast of a drifting central grating patch in the presence of a higher contrast surround of the same spatiotemporal frequency, phase and orientation. Our extended checkerboard stimulus may have induced a similar centre-surround perceptual effect, which, if enhanced in our migraine group would result in increased suppression of the central stimulus and a relatively more depressed PVER response relative to controls.
The reduction in PVER might alternatively reflect structural abnormalities or metabolic disadvantage, possibly as a cumulative result of repetitive ischaemia with migraine attacks (53). The use of advanced neuroimaging techniques to rule out cortical lesions associated with migraine (1) falls outside the scope of this study. An indirect way to infer whether repeated migraine episodes are associated with cumulative injury is by correlating years of migraine or attack frequency with the PVER, which in this study was not significant (data not shown). However, retrospective reporting may not be accurate, and migraine frequency can vary over a lifetime. To determine whether an abnormally reduced PVER is a result of repeated migraine attacks requires longitudinal investigation. It is also unknown whether damage needs to be cumulative, as one migraine might cause lasting damage.
It is worth considering whether our results are explicable by non-visual mechanisms. Prolonged testing can induce drowsiness, thereby reducing the VER amplitude (24). Although attention was not specifically controlled, we have no reason to suspect that the people with migraine were more drowsy or fatigued than our controls. The examiner frequently asked participants to indicate whether the fixation target was clear, and the stimuli were interleaved with regular breaks. Participants were tested at least seven days after migraine offset to minimise migraine-related fatigue. There is also no evidence for greater accommodative fatigue in the migraine group, as their responses to the finer checks (0.25°) were no different to controls (data not shown). An alternate possibility is greater aversion to the checkerboard stimulus in the migraine group, as has been previously reported (26,42). Greater aversion may decrease the ability to voluntarily attend to the target and therefore reduce the PVER amplitude (24). We did not formally measure aversion; however, the examiner informally asked for participant feedback regarding the testing. None of the participants reported discomfort during the recordings or needed to abort the testing due to heightened aversion or an impending migraine attack. It is worth noting that our participants self-selected to be involved in a study with extensive visual testing; hence, people with strong aversion to particular visual stimuli may have been less likely to volunteer. Our participant sample may not be representative of a broader clinical group of people with migraine, who may have more severe events, chronic migraines, or be taking prophylactic medications.
In this study, the MO and MA groups differed in their transient cortical response. The lack of a finding of reduced transient PVER amplitude in the MO group implies that their deficit might show temporal tuning, by only being present at higher temporal frequency stimulation (Figure 4). This is consistent with the temporal tuning found in one MO participant by McKendrick et al. using behavioural methods (16). However, this study also reported greater deficits in flicker contrast processing to higher temporal frequencies for MA subjects. It is still unclear whether a difference in temporal processing exists, given the non-significant interaction between group and temporal frequency in this study.
Alternatively, the two migraine subtype groups differed in age; however, the effect of age on PVER amplitude is insignificant across the age range of our migraine population (19–43 years) (63). Furthermore, age was not identified as a significant co-factor contributing to a between group difference for any of our statistical analyses. The MA group also reported a longer migraine history. A previous study of 47 MA and 37 MO participants reported a significant correlation between disease duration and reduced PVER amplitude (53); however, that study comprised 14 participants (15%) with at least a 30-year history of MA. Only one MA participant in our study had experienced more than 30 years of migraine, so similar correlations cannot be performed. People who experience aura are at slightly greater risk of subclinical brain lesion, stroke, cardiovascular disease and other ischaemic vascular events than are those who experience MO (for a review, see Schwedt and Dodick (1) and Bigal and Lipton (64)). This suggests that the presence of aura may influence a person’s susceptibility to adverse vascular effects, although the absolute risk is only marginally higher (65). A larger population study that includes neuroimaging measures would be required to investigate the presence of brain lesions and the effect on the PVER in people with migraine.
In summary, this study extends our previous knowledge of cortically evoked responses between migraine events, by concurrently measuring retinal responses to both steady-state and transient stimulation. We confirm previous reports of abnormal cortically evoked responses between migraine attacks. However, the overlap between the migraine and control groups indicates that these tests are unlikely to be of use as clinical markers of the disease. PVER amplitude reduction was evident in both migraine subtypes at high temporal frequencies using standard clinical protocols and could not be explained by impairments in the eye or the transmission along the visual pathway. Further research is required to ascertain the underlying mechanism for reduced PVER amplitude to identify the corresponding physiological (structural, vascular and/or metabolic) differences in the migraine brain.
Footnotes
Funding
This work was supported by the National Health and Medical Research Council (grant number 509208) and Australian Research Council (grant number FT0990930) to author AMM.