Abstract
Background: Migraine has been linked with several measures of socioeconomic status (SES). However, results are inconsistent and data on the association between SES and non-migraine headache, migraine subtypes and migraine frequency are sparse.
Methods: We conducted a cross-sectional study among 36,858 participants in the Women’s Health Study. As proxy for SES, we calculated an SES index using annual household income and education. Migraine, migraine aura, and non-migraine headache were self-reported with good validation rates. Multinomial logistic regression models were used to evaluate the association between the SES index and the various headache forms.
Results: Of the women participating in the study, 12,140 (32.9%) reported any history of headache, 6801 (18.4%) reported any history of migraine and 5339 (14.5%) reported non-migraine headache. Women with low SES had an increased risk for all headache forms. The multivariable-adjusted odds ratios (ORs; 95% CI) were 1.22 (1.10–1.36) for non-migraine headache, 1.40 (1.28–1.54) for any migraine, 1.44 (1.23–1.69) for migraine with aura, and 1.38 (1.21–1.58) for migraine without aura. Among active migraineurs, low SES was associated with an increased OR for ≥weekly attack frequency (1.77, 1.26–2.49).
Conclusions: In this large cohort of female health professionals, low SES was associated with an increased prevalence for all headache forms and an increased migraine attack frequency.
Introduction
The impact of socioeconomic inequalities on various health statuses has been studied frequently (1), particularly to identify potential targets for prevention or to initiate prevention strategies. The underlying mechanisms by which socioeconomic status (SES) might be linked to diverse health outcomes are still unclear.
From a public health perspective especially, a relationship between SES and diseases with a high prevalence is of interest. Primary headache disorders are highly prevalent, particularly migraine headaches, and result in large personal and societal burden (2). Approximately 18% of females and 6% of males experience at least one migraine attack per year (3). The prevalence of active migraine changes over the lifespan with a peak in both sexes at ages 25–55, the most productive years of adulthood (4). The economic consequences of migraine are mainly reduced productivity caused by absenteeism or reduced performance at work (2).
The potential association between SES and migraine has been frequently studied with inconsistent results (5–11) and only two cross-sectional studies have evaluated migraine subtypes (12,13). In addition, studies suggest an association between low SES and chronification of headache forms (14–16). One potential mediator for this association is an increased migraine attack frequency, but only few studies have specifically addressed the relationship between SES and migraine attack frequency (6,17,18) and found inconsistent results.
The most commonly used indicators for SES are income, education, and occupation (3,5,6,8–10,17,19–21). However, socioeconomic status is a multidimensional concept, which may not be well represented by single-indicator variables. Combining SES proxies into an index has been proposed as an alternate method to measure SES and addresses the issue of multidimensionality (22–25).
We therefore aimed to evaluate the association of SES, represented by an SES index, with prevalence of migraine and non-migraine headache as well as with migraine attack frequency in a cohort of over 39,000 female health professionals.
Methods
Study population
Study subjects were all participants in the Women’s Health Study (WHS), a completed randomized trial designed to test the benefits and risks of low-dose aspirin and vitamin E in the primary prevention of cardiovascular disease and cancer among apparently healthy women. The design, methods, and results have been described in detail previously (26,27). In brief, a total of 39,876 US female health professionals aged ≥45 years at baseline (1993–1995) and without a history of cardiovascular disease, cancer, or other major illnesses were randomly assigned to active aspirin (100 mg on alternate days), active vitamin E (600 IU on alternate days), both active agents, or both placebos. All participants provided written informed consent and the Institutional Review Board of the Brigham and Women’s Hospital, Boston, Massachusetts, USA approved the procedures of the WHS. Baseline information was self-reported and collected by a mailed questionnaire that asked about many cardiovascular risk factors and lifestyle variables. Twice in the first year and yearly thereafter, participants were sent follow-up questionnaires asking about study outcomes and other information during the study period. Since the trial’s termination in 2004, observational follow-up is still ongoing.
Assessment of migraine
On the baseline questionnaire, participants were asked: ‘Have you ever had migraine headaches?’ and ‘In the past year, have you had migraine headaches?’ We distinguished between women without migraine history, with any migraine history, with active migraine (reported migraine in the year prior to completing the baseline questionnaire), and with prior migraine, which included women who reported ever having had a migraine but none in the year prior to completing the baseline questionnaire. Our ‘any migraine’ category included women with active migraine (migraine with aura, migraine without aura) and prior migraine. Those participants who reported active migraine were asked further details about their migraine attacks, including attack duration of 4–72 h; unilateral location and pulsating quality of pain; inhibition of daily activities; aggravation by routine physical activity; nausea or vomiting; sensitivity to light or sound. Furthermore, participants who reported active migraine were asked whether they had an ‘aura or any indication a migraine is coming’. Responses were used to classify women who reported active migraine into migraine with aura and migraine without aura, similar to previous studies (28,29). In addition, active migraineurs were asked details about the frequency of their migraine attacks (daily, weekly, monthly, every other month, <6 times per year).
In previous studies of the WHS, we have shown good agreement between our migraine categories and migraine classifications based on the International Headache Society criteria. Specifically, we have shown in a sub-study of the WHS that over 87% of women with active migraine could be diagnosed as having migraine without aura (71.5%) or probable migraine without aura (16.2%) when applying current revised criteria (30).
Ascertainment of non-migraine headache
Participants were asked to report on the 6-month follow-up questionnaire whether they had ever had headaches. We subsequently categorized women as having non-migraine headache if a woman reported headache but did not indicate any history of migraine similar to a previous study (29). Women who reported both migraine and non-migraine headache were classified as migraineurs.
Assessment of socioeconomic status
Distribution of SES variables according to SES Index categories a in the Women’s Health Study (N = 36,858)
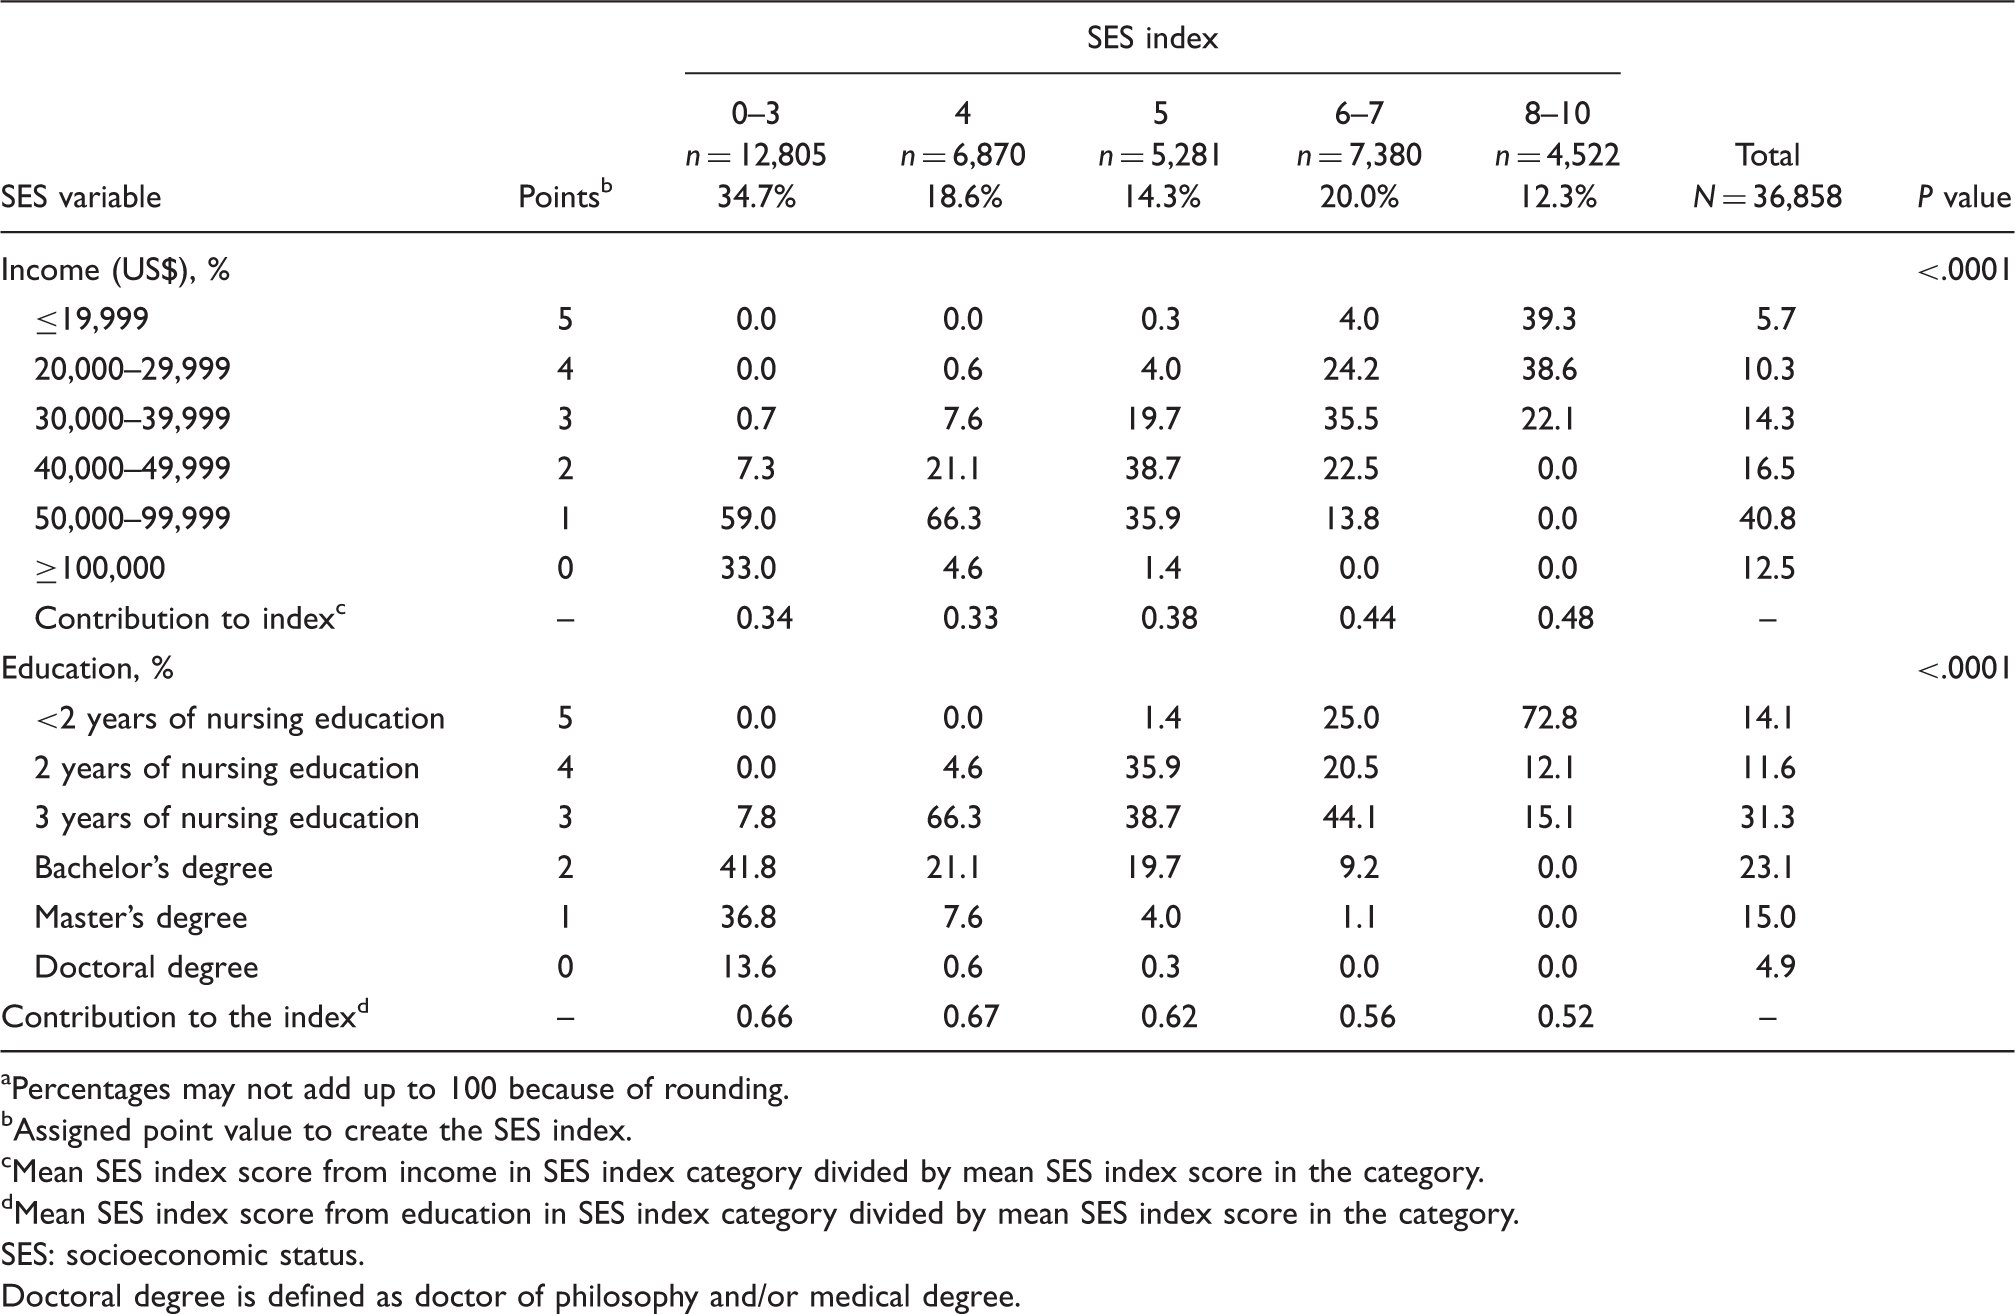
Percentages may not add up to 100 because of rounding.
Assigned point value to create the SES index.
Mean SES index score from income in SES index category divided by mean SES index score in the category.
Mean SES index score from education in SES index category divided by mean SES index score in the category.
SES: socioeconomic status.
Doctoral degree is defined as doctor of philosophy and/or medical degree.
Point values of 0–5 were assigned to each individual variable category as follows: the highest point value, point value 5, was assigned to the lowest income and education categories, respectively. The assigned point values decreased with increasing income and education levels. The highest income and education categories received the lowest point value, point value 0. We then combined the income and education variable to an overall SES index which ranged from 0–10. We divided the overall SES index into quintiles. The lowest quintile represented the highest level of SES and was used as reference category in further analysis. The assigned point scheme and the distribution of the SES variables according to the SES index categories are presented in Table 1.
Studies analyzing data from the general population often additionally include a proxy for occupation in their SES index (23,24). Since our cohort consisted of health professionals, our education and professional occupation variables are very closely related. We decided not to include occupation in our index because of the rather small variation in this traditional SES indicator.
Statistical methods
Of the 39, 876 women, a total of 3018 women were excluded [missing data on migraine status (n = 119), education (n = 669) or income (n = 2230)], leaving 36,858 participants for this analysis. Because age differed according to SES index, we used direct standardization to adjust categorical variables for age in 5-year increments to compare baseline characteristics according to SES index categories.
Multinomial logistic regression models were calculated to evaluate the association between SES index categories and headache subtypes with SES index as the independent variable and headache subtypes as the dependent variable. We ran two multinomial models, one including information on any migraine, non-migraine headache, and no history of headache and the other one including migraine with aura, migraine without aura, prior migraine, non-migraine headache, and no history of headache. Multinomial logistic regression is an extension of binary logistic regression that allows the dependent variable to have more than two categories and then simultaneously compares each of these categories to a reference category. Women within the lowest SES quintile and no history of any headache were used as reference group. Prevalence odds ratios (ORs) and 95% confidence intervals (CIs) were calculated for the association between SES index and the various headache forms.
We further evaluated the association between SES index and migraine attack frequency (daily and weekly, monthly, every other month, <6 times per year) using multinomial logistic regression models. Because of low case counts, we collapsed the SES index quintiles into a binary variable (SES index point values 8–10 versus SES index point values 0–7) for this part of the analysis. Women with a SES index between 0 and 7 with a migraine attack frequency of less than six times per year served as reference category.
We ran age- and multivariable-adjusted models. We selected covariates as potential confounders if they were related to migraine and SES status. The multivariable models were adjusted for age (continuous), race (white, non-white), marital status (single, married, divorced, widowed), geographic region (Northeast, Southeast, Midwest, West), history of hypertension, postmenopausal hormone use (never, past, current), and menopausal status (premenopausal, postmenopausal, biologically uncertain, unclear/subject unsure).To determine whether the associations were influenced by lifestyle factors, we additionally adjusted the multivariable models for smoking status (never, past, current), body mass index (BMI; <25 kg/m2, 25.0–<30.0 kg/m2, ≥30 kg/m2), exercise (rarely/never, <1 per week, 1–3 times per week, ≥4 times per week) and alcohol consumption (rarely/never, 1–3 drinks per month, 1–6 drinks per week, ≥1 drink per day).
To assess the impact of each single SES indicator separately, we additionally calculated multinomial logistic regression models with income and education as exposure variables.
A missing value indicator was included for a covariate if the number of women with missing information was ≥100. We assigned participants with missing values to the reference category of the covariate if the number of women with missing information was less than 100. The total number of missing values for all covariates was 2375 (6.4%).
For all analysis, we used SAS version 9.1 (SAS Institute Inc., Cary, North Carolina, USA). All p values were two-tailed and p < 0.05 was considered statistically significant.
Results
Of the 36,858 women, a total of 12,140 (32.9%) women reported any history of headache; 6,801 (18.4%) women reported any history of migraine and 5,339 (14.5%) solely reported non-migraine headache. Among the 4791 (13.0%) active migraineurs (migraine in the year previous to baseline), 1906 (39.8%) women indicated migraine with aura.
Age-adjusted baseline characteristics according to SES index categories a in the Women’s Health Study (N = 36,858)


Percentages may not add up to 100 because of rounding or missing values.
Other includes Asian Pacific and American Indian.
Association between SES index and headache types (N = 36,858)


Results from multinomial logistic regression models with the headache categories as the dependent variables and SES index categories as the independent variables. One model had the headache categories ‘any migraine’, ‘non-migraine headache’, and ‘no headache’ as outcomes and another model had the migraine subgroups, instead of any migraine, as outcome. Women without headache and who have a SES index of 0–3 served as the reference group. Model 1: adjusted for age, race, marital status, geographic region, menopausal status, hormone use, and history of hypertension. Model 2: Model 1 plus alcohol, smoking, BMI, and exercise. BMI: body mass index; SES: socioeconomic status.
Association between SES index and migraine frequency (n = 4731)

Model 1: adjusted for age, race, marital status, geographic region, menopausal status, hormone use, and history of hypertension. Model 2: Model 1 plus alcohol, smoking, BMI, and exercise. BMI: body mass index; SES: socioeconomic status.
Discussion
In this large cross-sectional study of women with a profession in the health sector, low SES status was associated with an increased OR for any evaluated headache form, including migraine with aura, migraine without aura, and non-migraine headache. Furthermore, active migraineurs with low SES had an increased OR for the ‘≥weekly’ migraine attack frequency. Additional adjustment for lifestyle factors did not substantially change the effect estimates suggesting that in our cohort the observed associations are unlikely to be explained by lifestyle habits. When comparing the two SES proxies, income and education, income predominately contributed to the observed relationship between SES status, headache prevalence, and migraine attack frequency.
The relationship between SES and migraine prevalence has been studied frequently. Several studies support our finding of an association between low SES and overall migraine prevalence (3,8,12,19,31). The majority of studies assessed the association between SES and migraine in general. In a cross-sectional study of 12,750 participants from the United States that distinguished between migraine subtypes, low income was associated with an increased OR for migraine with aura (OR: 1.68, 95% CI: 1.07–2.64), migraine without aura (OR: 1.56, 95% CI: 1.14–2.14), and other headaches with aura (OR:1.89, 95% CI: 1.14–3.13) (12). In a Danish cohort of 31,865 participants, low educational levels were associated with an increased multivariable-adjusted OR of 1.30 (1.08–1.56) for migraine without aura in women (13). In contrast, studies from Canada (9), Sweden (5) and the Netherlands (17) found no association between SES assessed by income or education and migraine prevalence.
We have additionally evaluated data on non-migraine headache. Our non-migraine headache category includes participants with headache other than migraine but the cases are not further classified according to diagnostic criteria. However, as tension-type headache (TTH) along with migraine is the most common primary headache disorder and other headache forms are very rare in the general population, we believe that our non-migraine headache group is primary composed of TTH. Several studies report an association between either low or high educational levels and TTH (32–34). Other studies could not confirm these results and found no association between SES and TTH or other non-migraine headache forms (18,20,32,35,36).
Only few studies have evaluated the relationship between SES and migraine attack frequency (6,17,18). Two studies are in line with our findings and report an association between low SES and frequent headache with migrainous features (18) and frequent headache (migraine and non-migrainous headache) (6), while a study from the Netherlands found no significant differences in attack frequency by SES (17). Data on headache frequency in the non-migraine headache group was not available in our study.
SES is a complex, multidimensional concept and is hard to measure. Most studies evaluating the association between SES and headache have used either income or education as a single proxy for SES. The application of a SES index instead of one single measure has several advantages. First, the SES index addresses SES as a multidimensional concept. Secondly, using a SES index reduces the dominance of one single SES measure and allows variation across categories. Indeed, the average contribution of income and education varies according to our SES index categories (Table 1). In the high SES index category, both income and education contribute equally to the combined SES index score while in the low SES index category education contributes about two-thirds. Single measures, e.g. education or income, represent different dimensions when used as indicators for SES. Education reflects a person’s individual intellectual abilities and may also be associated with different health behaviors. Compared to other SES proxies, education is a stable measure, but may rather represent earlier life circumstances. Annual household income is an economic indicator and several family members may unequally contribute and have access to it. Although income is a more recent indicator for SES, it is prone to fluctuations and may be a result of prevalent health problems (37).
The mechanisms by which SES might be related to migraine prevalence and migraine frequency are unclear. Stress linked to economic hardship and working conditions, diverse diet patterns, and different access to medical care may influence these associations. Furthermore, the direction of the associations still have to be determined. Bigal and colleagues (38) have evaluated two opposing hypotheses, social causation and social selection, for the association between SES and migraine. The social causation hypothesis suggests that factors associated with low SES increase disease prevalence. In contrast, according to the social selection theory, the disease itself affects the individual’s educational and occupational abilities and subsequently leads to lower SES (39). Results of the study suggest that social causation rather than social selection might contribute to the relationship between SES and migraine prevalence (38). However, most of the studies assessing SES and migraine, including our study, have a cross-sectional design that does not allow to address the directionality and causative pathways of the association.
Our study has several strengths including the large number of participants and the large number of individuals with various headache forms. Our migraine assessment has been shown to be valid (30) and we could distinguish migraine subtypes as well as migraine attack frequency. The WHS provides information about a large number of potential confounders that we could adjust for in our analyses.
The following limitations should be considered when interpreting our results. First, information on migraine, migraine features and migraine frequency is self-reported and under-reporting or misclassification is possible. Secondly, information on the SES variables and the potential confounders is also self-reported. However, as information on education and income are likely not related to headache-specific information, such misclassification is expected to be random. Lastly, our cohort consisted of female health professional aged ≥45 years which may limit the generalizability of our results to other populations.
In conclusion, data from this large cohort of female health professionals indicates an association between low SES status and any headache form. In addition, we found an association between low SES status and increased migraine attack frequency. These results support further targeted research on potential triggering factors of headache in lower SES groups and exploration of potential preventive strategies.
Footnotes
Acknowledgements
We are indebted to the participants in the Women’s Health Study for their outstanding commitment and cooperation, and to the entire Women’s Health Study staff for their expert and unfailing assistance.
Association between annual household income levels and headache subtypes (N = 36,858) Results from multinomial logistic regression models with the headache categories as the dependent variables and income categories as the independent variables. One model had the headache categories ‘any migraine’, ‘non–migraine headache’, and ‘no headache’ as outcomes and another model had the migraine subgroups instead of any migraine as outcome. Women without headache and who have an income of ≥100,000 served as reference group. Model 1: adjusted for age, race, marital status, geographic region, menopausal status, hormone use, history of hypertension. Model 2: Model 1 plus alcohol, smoking, BMI, exercise. BMI: body mass index.
Income categories (US$)
No. of subjects with the specific headache type
Age-adjusted OR (95% CI)
Model 1 (95%CI)
Model 2 (95%CI)
Any migraine (n = 6,801)
≤19,999
376
1.28 (1.11, 1.47)
1.35 (1.17, 1.57)
1.24 (1.07, 1.45)
20,000–29,999
668
1.10 (0.98, 1.23)
1.13 (1.00, 1.27)
1.05 (0.92, 1.18)
30,000–39,999
946
1.04 (0.94, 1.16)
1.07 (0.96, 1.19)
1.00 (0.89, 1.12)
40,000–49,999
1113
1.00 (0.91, 1.11)
1.01 (0.91, 1.12)
0.95 (0.86, 1.06)
50,000–99,999
2795
0.99 (0.91, 1.07)
0.98 (0.90, 1.07)
0.94 (0.86, 1.03)
≥100,000
903
1.00
1.00
1.00
Migraine with aura (n = 1,906)
≤19,999
86
1.04 (0.80, 1.34)
1.19 (0.91, 1.55)
1.06 (0.81, 1.40)
20,000–29,999
191
1.07 (0.88, 1.30)
1.17 (0.95, 1.43)
1.06 (0.86, 1.30)
30,000–39,999
252
0.92 (0.77, 1.10)
0.99 (0.83, 1.19)
0.91 (0.75, 1.10)
40,000–49,999
322
0.94 (0.80, 1.11)
0.99 (0.83, 1.17)
0.91 (0.77, 1.09)
50,000–99,999
770
0.87 (0.75, 1.00)
0.88 (0.76, 1.01)
0.83 (0.72, 0.96)
≥100,000
285
1.00
1.00
1.00
Migraine without aura (n = 2,885)
≤19,999
119
1.14 (0.92, 1.43)
1.25 (1.00, 1.58)
1.13 (0.89, 1.43)
20,000–29,999
264
1.15 (0.97, 1.36)
1.21 (1.02, 1.45)
1.10 (0.92, 1.32)
30,000–39,999
394
1.11 (0.95, 1.29)
1.15 (0.99, 1.35)
1.06 (0.90, 1.24)
40,000–49,999
458
1.02 (0.88, 1.17)
1.04 (0.90, 1.21)
0.96 (0.82, 1.11)
50,000–99,999
1270
1.07 (0.95, 1.21)
1.08 (0.96, 1.22)
1.02 (0.90, 1.15)
≥100,000
380
1.00
1.00
1.00
Prior migraine (n = 2,010)
≤19,999
171
1.55 (1.25, 1.93)
1.47 (1.17, 1.85)
1.42 (1.12, 1.80)
20,000–29,999
213
1.06 (0.87, 1.29)
1.00 (0.81, 1.22)
0.97 (0.79, 1.19)
30,000–39,999
300
1.09 (0.91, 1.30)
1.03 (0.86, 1.24)
1.01 (0.84, 1.22)
40,000–49,999
333
1.05 (0.88, 1.25)
1.01 (0.84, 1.20)
0.98 (0.82, 1.18)
50,000–99,999
755
0.99 (0.85, 1.15)
0.96 (0.82, 1.11)
0.94 (0.81, 1.10)
≥100,000
238
1.00
1.00
1.00
Non-migraine headache (n = 5,339)
≤19,999
306
1.55 (1.33, 1.82)
1.63 (1.38, 1.92)
1.51 (1.28, 1.79)
20,000–29,999
516
1.26 (1.11, 1.44)
1.29 (1.13, 1.48)
1.21 (1.05, 1.39)
30,000–39,999
749
1.23 (1.09, 1.39)
1.26 (1.11, 1.42)
1.18 (1.04, 1.34)
40,000–49,999
860
1.15 (1.02, 1.29)
1.16 (1.03, 1.31)
1.09 (0.97, 1.23)
50,000–99,999
2299
1.20 (1.09, 1.33)
1.20 (1.09, 1.33)
1.15 (1.04, 1.27)
≥100,000
609
1.00
1.00
1.00


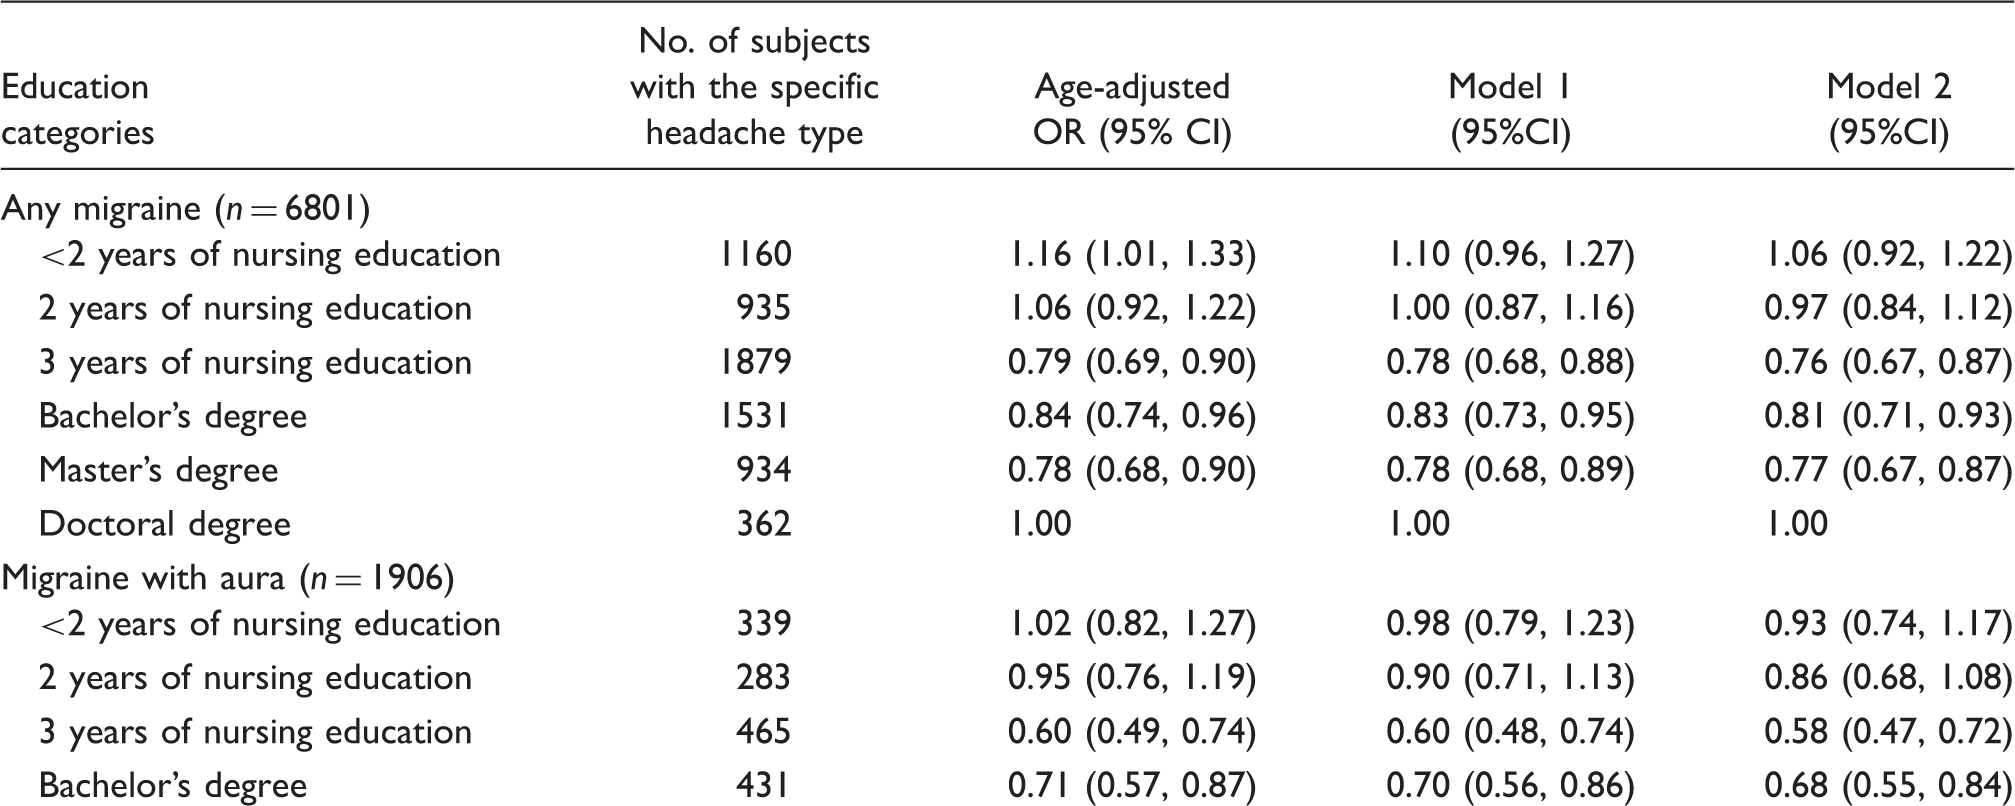
Association between highest education levels and headache subtypes (N = 36,858) Results from multinomial logistic regression models with the headache categories as the dependent variables and the education categories as the independent variables. One model had the headache categories any migraine, non-migraine headache, and no headache as outcomes and another model had the migraine subgroups instead of any migraine as outcome. Women without headache and who have a doctoral degree served as reference group. Model 1: adjusted for age, race, marital status, geographic region, menopausal status, hormone use, history of hypertension. Model 2: Model 1 plus alcohol, smoking, BMI, exercise. BMI: body mass index.
Education categories
No. of subjects with the specific headache type
Age-adjusted OR (95% CI)
Model 1 (95%CI)
Model 2 (95%CI)
Any migraine (n = 6801)
<2 years of nursing education
1160
1.16 (1.01, 1.33)
1.10 (0.96, 1.27)
1.06 (0.92, 1.22)
2 years of nursing education
935
1.06 (0.92, 1.22)
1.00 (0.87, 1.16)
0.97 (0.84, 1.12)
3 years of nursing education
1879
0.79 (0.69, 0.90)
0.78 (0.68, 0.88)
0.76 (0.67, 0.87)
Bachelor’s degree
1531
0.84 (0.74, 0.96)
0.83 (0.73, 0.95)
0.81 (0.71, 0.93)
Master’s degree
934
0.78 (0.68, 0.90)
0.78 (0.68, 0.89)
0.77 (0.67, 0.87)
Doctoral degree
362
1.00
1.00
1.00
Migraine with aura (n = 1906)
<2 years of nursing education
339
1.02 (0.82, 1.27)
0.98 (0.79, 1.23)
0.93 (0.74, 1.17)
2 years of nursing education
283
0.95 (0.76, 1.19)
0.90 (0.71, 1.13)
0.86 (0.68, 1.08)
3 years of nursing education
465
0.60 (0.49, 0.74)
0.60 (0.48, 0.74)
0.58 (0.47, 0.72)
Bachelor’s degree
431
0.71 (0.57, 0.87)
0.70 (0.56, 0.86)
0.68 (0.55, 0.84)
Master’s degree
268
0.67 (0.53, 0.84)
0.67 (0.54, 0.84)
0.66 (0.53, 0.83)
Doctoral degree
120
1.00
1.00
1.00
Migraine without aura (n = 2885)
<2 years of nursing education
468
1.24 (1.02, 1.53)
1.24 (1.01, 1.53)
1.20 (0.97, 1.48)
2 years of nursing education
395
1.16 (0.94, 1.42)
1.14 (0.92, 1.41)
1.10 (0.89, 1.36)
3 years of nursing education
805
0.93 (0.77, 1.13)
0.95 (0.78, 1.16)
0.93 (0.76, 1.13)
Bachelor’s degree
683
0.99 (0.81, 1.20)
1.01 (0.83, 1.23)
0.98 (0.81, 1.20)
Master’s degree
399
0.88 (0.71, 1.08)
0.89 (0.72, 1.09)
0.88 (0.71, 1.08)
Doctoral degree
135
1.00
1.00
1.00
Prior Migraine (n = 2010)
<2 years of nursing education
353
1.21 (0.96, 1.51)
1.06 (0.84, 1.33)
1.04 (0.83, 1.32)
2 years of nursing education
257
1.07 (0.85, 1.36)
0.95 (0.75, 1.21)
0.94 (0.74, 1.20)
3 years of nursing education
609
0.82 (0.67, 1.02)
0.76 (0.61, 0.94)
0.75 (0.61, 0.94)
Bachelor’s degree
417
0.82 (0.66, 1.02)
0.77 (0.61, 0.96)
0.76 (0.61, 0.95)
Master’s degree
267
0.80 (0.63, 1.00)
0.76 (0.60, 0.97)
0.76 (0.60, 0.97)
Doctoral degree
107
1.00
1.00
1.00
Non-migraine headache (n = 5339)
<2 years of nursing education
799
1.14 (0.98, 1.34)
1.11 (0.95, 1.30)
1.04 (0.88, 1.22)
2 years of nursing education
628
1.02 (0.87, 1.20)
0.98 (0.84, 1.16)
0.93 (0.79, 1.10)
3 years of nursing education
1550
0.94 (0.81, 1.08)
0.94 (0.81, 1.09)
0.90 (0.77, 1.04)
Bachelor’s degree
1283
1.01 (0.87, 1.18)
1.01 (0.87, 1.17)
0.97 (0.84, 1.13)
Master’s degree
827
0.99 (0.85, 1.16)
1.00 (0.85, 1.17)
0.98 (0.83, 1.14)
Doctoral degree
252
1.00
1.00
1.00