
Abstract
Background: Asymmetry of visual phenomena and headache is an important feature of migraine with aura.
Methods: This asymmetry was explored by assessment of visual illusions, hemifield spatial contrast detection (HCD) and hemifield pattern reversal visual evoked potentials (HVEPs) in 47 migraineurs with aura (MA), who were not taking prophylactic medications, and 62 controls with the same age range (16–59).
Results: Illusions were greater and HCD was poorer in MA than in controls. There were no group differences with respect to P100 amplitude. The longer the duration of migraine the poorer the HCD. When the aura was consistently unilateral it was associated with greater illusions, reduced HCD and reduced hemifield P100 amplitude. These findings were not related to the side of headache.
Conclusion: The lateralised changes suggest that the visual dysfunction occurs at a cortical level, and the correlation with the side of the aura suggests that dysfunction is most likely to occur in an area of preexisting anomaly of neural function.
Keywords
Introduction
Visual phenomena are among the most prominent features of migraine with aura (1–3). The typical aura lasts under one hour, but occasionally a prolonged aura may last up to seven days (4). Persistent positive visual phenomena lasting months to years have also been reported (5).
Visual functions in migraine have been investigated using visual evoked potentials (VEPs) and to a lesser extent psychophysical tests. Abnormalities have been found in VEPs using single and repetitive flash stimuli and pattern (6). Abnormalities have also been found with various psychophysical tests, namely visual illusions (7), spatial contrast sensitivity (8–10), temporal contrast sensitivity (11,12), motion perception (13,14), critical flicker fusion (15) and colour perception (16,17). There is evidently visual dysfunction in migraine in the interictal period. However, an important feature of migraine with aura is the asymmetry or lateralisation of headache and of the associated neurological phenomena. This has not been well explored in the literature. Only a few neurophysiological studies have looked at the relationship between asymmetry in evoked potentials and the lateralisation of headache or aura (18–21), and one psychophysical study by Wilkins et al. (7) looked at the relationship between the side of interictal illusions and the side of headache. In this study we aimed to explore laterality of headache and visual aura in migraine in the same patients using a range of psychophysical and neurophysiological tests so as to study the relationship between the various dysfunctions and the characteristics of the headache. The assessments included visual illusions, hemifield spatial contrast detection (HCD), and hemifield pattern reversal visual evoked potentials (HVEPs).
Participants and Methods
Participants
Forty-seven migraine with aura (MA) patients diagnosed according to the criteria of the International Headache Society (4) and 62 controls with the same age range (ages 1–59) were tested. The duration of migraine ranged from several months to 48 years.
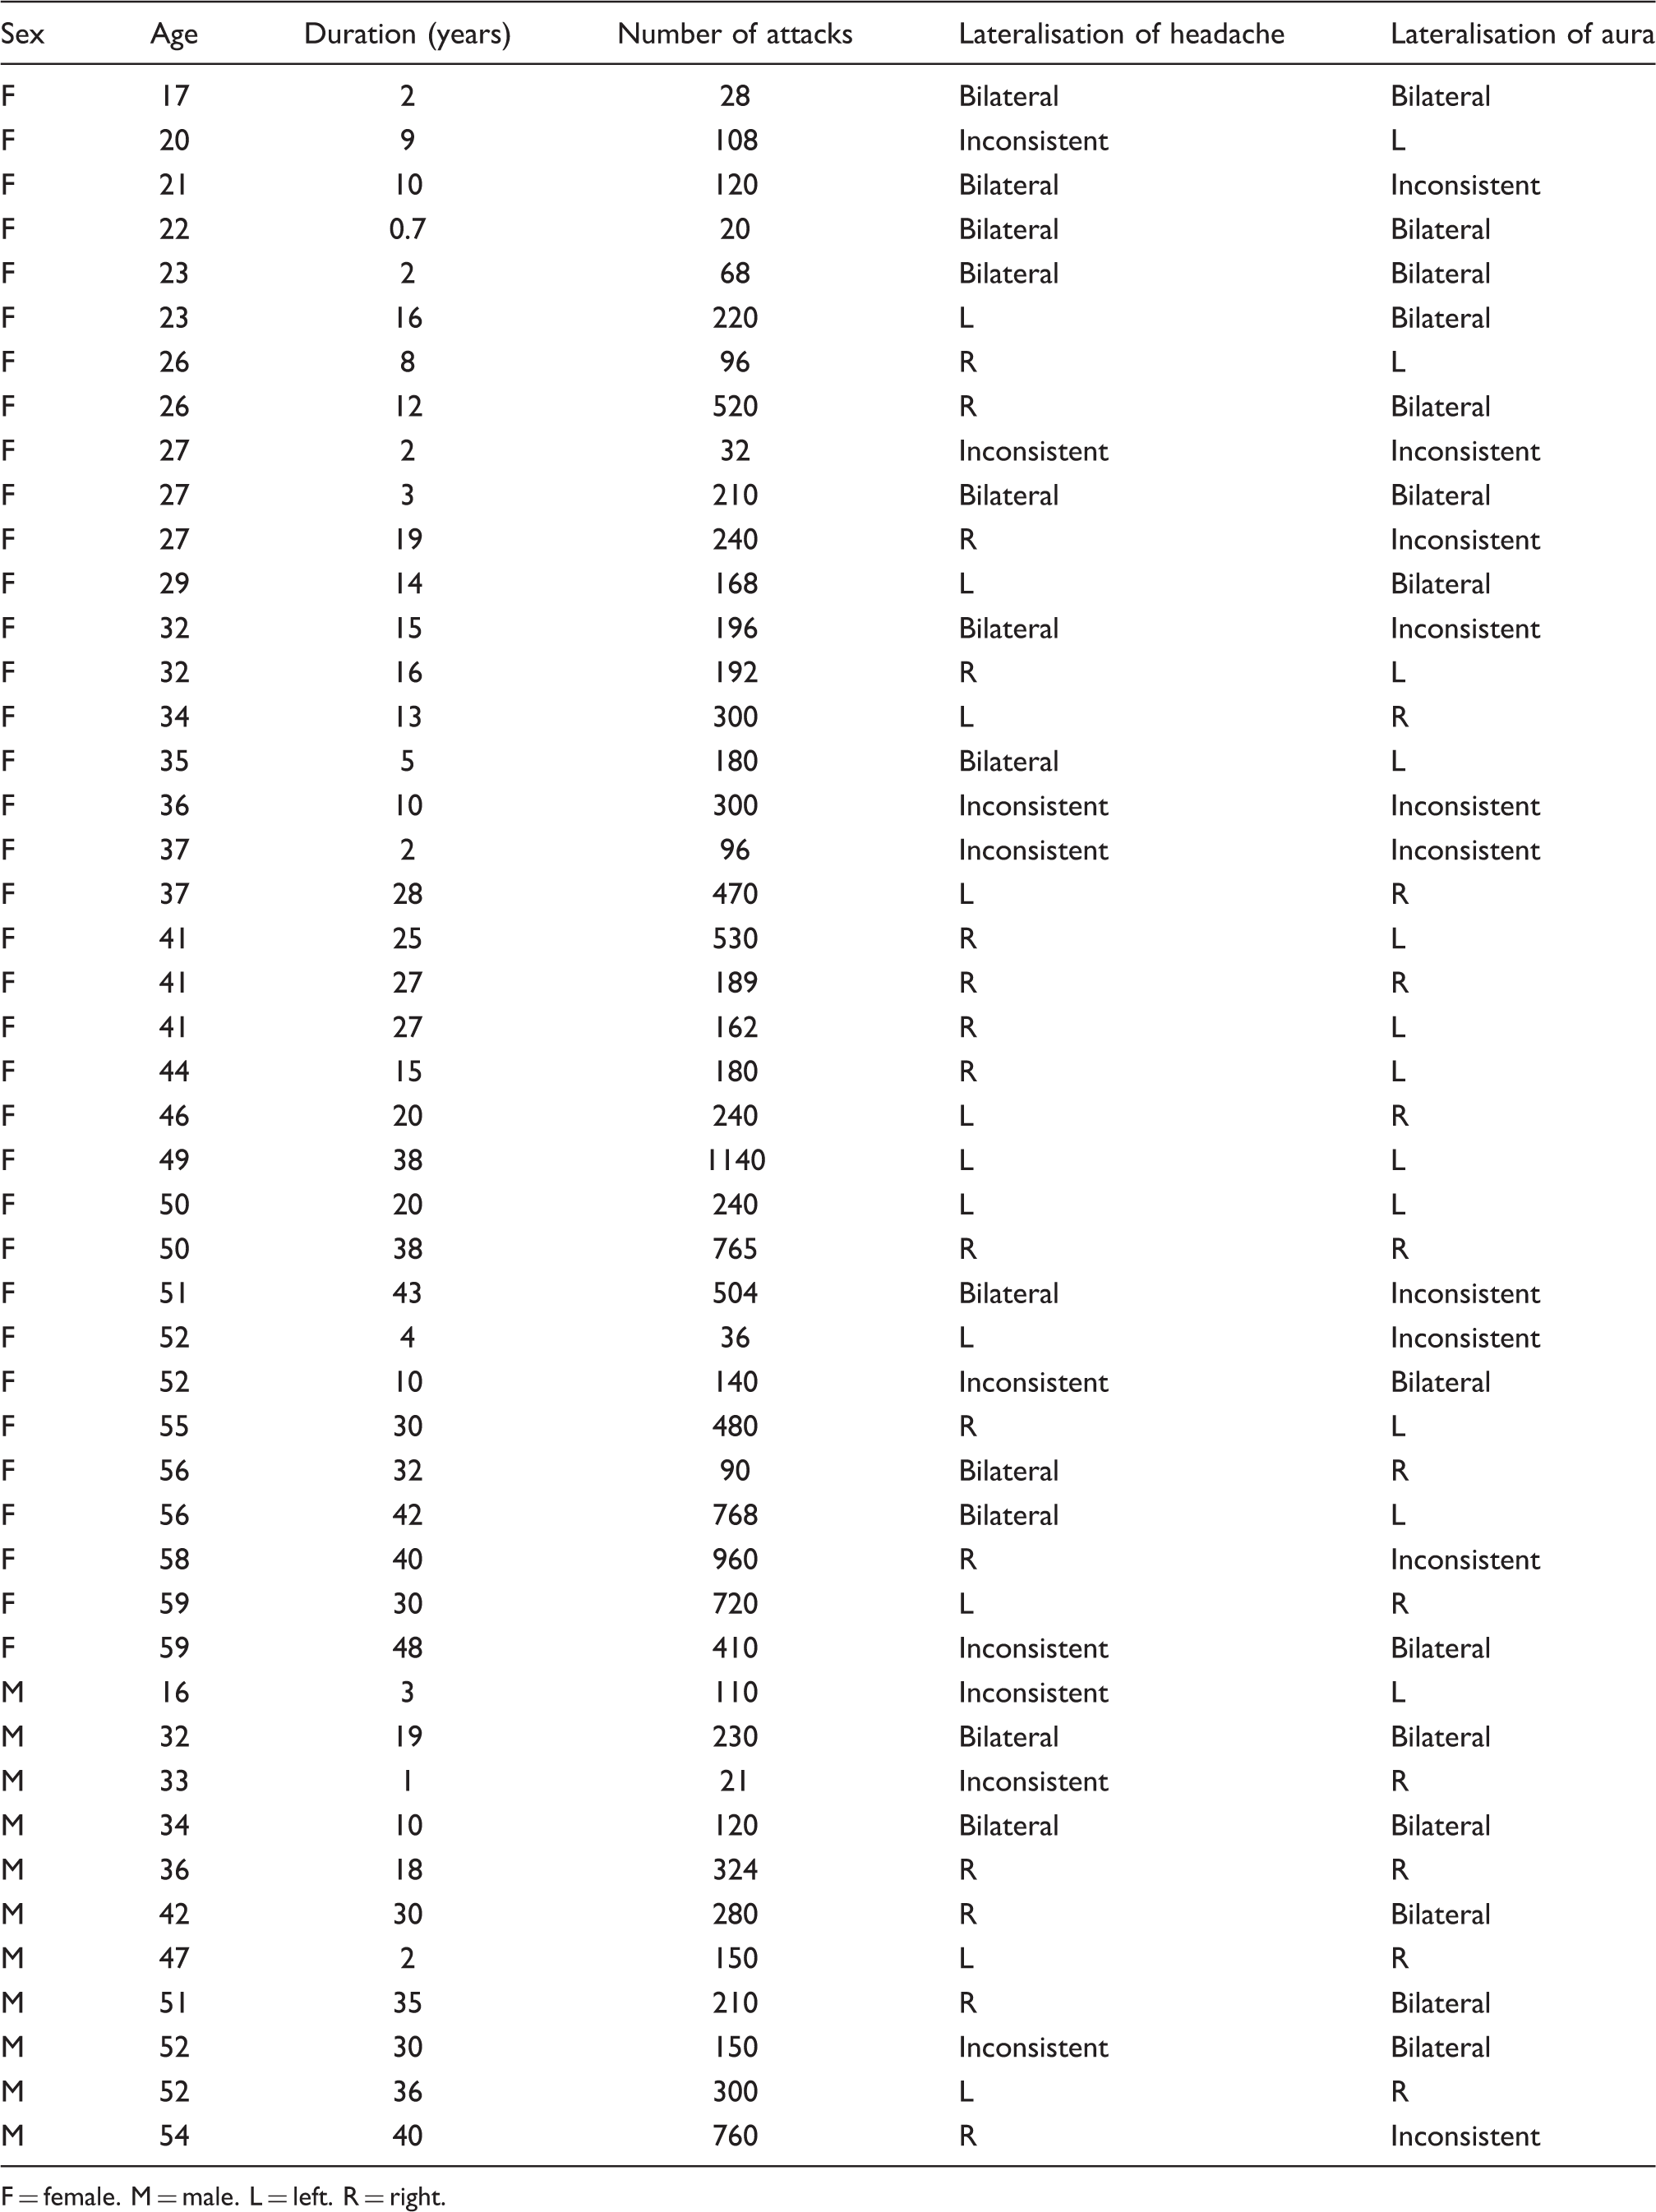
MA patients were recruited from migraine and neurology clinics. To reduce any effects of medication on the physiological findings we selected only those who were not taking medication on a daily basis to prevent attacks. All patients were examined at least three days after their last attack. They were first provided with a headache questionnaire. Key questions from the headache questionnaire included: “When did you start having this type of headache? Are there sometimes bright flickering lights or zigzags in front of your eyes just before the headache begins? If so, do they appear on the right, left, or both sides and how long do they last? Have you noticed any change in your sight before or during the attack? How often do you get the headache? How long does your headache usually last?” Then at a consultation patients were questioned further about details of their migraine with special attention to the lateralisation of their visual aura and headache. The headache and aura were classified after discussion of the symptoms and their frequency of occurrence. The aura and headache were considered unilateral when more than 80% of the visual auras or headaches were unilateral. The frequency of headache proved very variable over the course of the illness. For this reason we attempted to estimate the total number of headaches in the previous month and year and used this information together with other information concerning the progression of illness to estimate the total number of headaches over the period of the illness. Appendix 1 provides a table of the clinical findings. Patients were also questioned about a history of neurological or ophthalmological problems, and received a thorough neurological examination, with particular attention to the optic fundi, visual fields, visual acuity and pupils. No disorders were found other than refractive errors. All patients had a visual acuity of 6/6 or better using a standard Snellen chart at a distance of 6 meters; 15 needed correction to achieve this. All migraine patients had visual aura. Seven also had other aura symptoms including motor, sensory and speech disturbances.
Sixty-two controls were selected from friends and relatives of patients, assessed by a modified questionnaire and rejected if there was any doubt about their freedom from migraine. Visual acuity was 6/6 or better and 11 needed correction to achieve this.
The study was approved by the Hammersmith Hospital ethical committee.
Methods
Visual illusions
High-contrast patterns, similar to those used by Wilkins et al. (7), of various radii were prepared. Each pattern consisted of horizontal stripes, was circular in outline and included a central vertical line separating left and right halves and a central fixation point. The patterns had a square-wave luminance profile with 70% Michelson contrast and from the viewing distance of 50 cm had a spatial frequency of 4 cycles per degree. Six patterns were used. The first four had diameters of 2.5, 5, 10 and 20 cm, respectively, and the other two consisted of the right and left halves of the largest pattern, and were grey on the unpatterned side. The patterns were illuminated by a spotlight and their space-averaged luminance was 74 cd.m−2.
The participant was seated on a chair. Patterns were presented for 5–10 seconds each, the whole-field patterns first, starting with the smallest and progressing to the largest, followed by the half-field patterns, left then right. The participants recorded on a checklist the illusions seen after each presentation of a pattern. The checklist of illusions was as follows: blurring, shimmering, flickering, fading of stripes, intermingling of lines, zigzags, colours (red, green, blue, yellow), shadowy shapes and “any other illusions” The total number of illusions of all kinds was then recorded for all the whole-field patterns. To look for asymmetry of illusions, initially participants were asked to record the number of illusions on each side of the pattern, when viewing both the whole-field and the hemifield patterns. However, many participants found that the number of illusions was the same on the two sides but that there was nevertheless a marked asymmetry in that illusions were more prominent on one side than the other. Therefore, we adopted a criterion whereby asymmetry of illusions was a qualitative judgment about their relative prominence on the two sides, based on the whole-field and hemifield patterns.
Hemifield spatial contrast detection
HCD was accomplished using a grating generator (Prisma VR 1000) made by Millipede Electronic Graphics, a board designed for an IBM PS/2 model 30 computer with custom made software. The system generated vertical sinusoidal grating patterns at various contrasts on a monochrome oscilloscope with white P4 phosphor coating, refresh rate of 200 Hz and space-averaged luminance of about 100 cd.m−2. The screen had a central fixation point, a red diamond of 10 mm width and 7 mm height. The gratings had a spatial frequency of 4 cycles per degree at the viewing distance of 114 cm. They subtended 10 degrees of visual angle high by 2.5 degrees wide. The contrast varied across each pattern according to a horizontal raised cosine envelope, the extremes of which subtended 2.5 degrees of visual angle. The gratings were positioned at one of four contiguous positions in the visual field, two left and two right of central fixation. Positions 2 and 3 were centred 1.25 degrees eccentrically so that each had one margin at the centre of the screen and overlapped the macular field. Positions 1 and 4 were centred 3.7 degrees from fixation.
Each participant was asked to fixate the central fixation point and was told to expect to see a pattern of vertical stripes in one of the four positions, and to identify the position in which it occurred. The pattern was presented in one of the four positions for 200 msec (so that participants did not have time to move their eyes).
The patterns were presented in a random order and in the following sequence of reducing Michelson contrast: 13%, 9.2%, 6.5%, 4.6%, 3.3%, 2.3%, 1.6%, 1.3%, until the participant started making errors. At this contrast level the test measurements were started. The pattern was presented 16 times at each position in random order, and the same procedure was then repeated at the next lower contrast, so that there were altogether 32 presentations at each position. The number of errors at each position was recorded. It is important to emphasize here that the error score does not represent the spatial contrast sensitivity, obtained by the conventional method of recording the last contrast at which the pattern was seen, because error scores were obtained at two contrast levels. The objective of the procedure was to look for asymmetry between the two hemifields, not to establish an absolute measure of contrast threshold. Therefore to distinguish it from spatial contrast sensitivity we refer here to HCD.
Hemifield pattern reversal visual evoked potentials
The hemifield pattern reversal visual evoked potentials (HVEPs) were elicited using a checkerboard reversing at 2 Hz. At the viewing distance of 1 metre the stimulus field subtended 30 × 25 degrees and the individual squares 38 minutes.
The mean luminance of the screen was 90 cd.m−2 and the Michelson contrast was 95%.
The active electrodes were placed at 5 and 10 cm lateral to Oz on both sides with an Fz reference. The participant was instructed to gaze at the dot in the centre of the pattern and the responses were obtained from left or right visual field stimulation by blanking half of the screen. The responses were collected in two steps, each lasting one minute. This made a total of 240 responses, which were averaged and displayed on paper printout at different gain settings. The amplitude of the principal positive wave (P100 amplitude) was measured at the ipsilateral electrode 5 cm from the midline when the hemifield was stimulated because it is most clearly recorded at this position. The amplitude was measured peak-to-trough.
Except where otherwise indicated, contingency tables were analysed using a one-tailed Fisher’s exact probability test and correlations were expressed using Pearson’s product moment correlation coefficient.
Results
A. Abnormalities on visual tests
Visual illusions. Migraine participants saw significantly more illusions than normal controls (MA 13.3 ± 3.9 vs. controls 6.3 ± 2.9, t(80) = 10.24, p = .000). This was not affected by the duration of migraine (r = 0.05, p = .72); see Figure 1a.
Hemifield spatial contrast detection. HCD error scores in MA were significantly greater than in controls (MA 41.5 ± 14.3 vs. controls 23.3 ± 10.2, t(79) = 7.44, p = .000). The errors increased with the duration of migraine, Figure 1b, and to a less extent with the age of the participant, Figure 1c. The correlation between duration of migraine and HCD was 0.61, p = .0000, whereas the correlation between age and HCD was 0.36, p = .01. The partial correlation between HCD errors and duration, accounting for age, was 0.51 (p = .0001). Evidently the effect of duration was not attributable simply to the generally greater age of the patients with longer lasting migraine. There was no significant correlation between the duration of headache and the estimate of the annual frequency of headache averaged over the duration of the illness (r = 0.07). The HCD scores did not correlate significantly with the average frequency (r = −0.26).
Hemifield pattern reversal visual evoked potentials. The amplitude of the P100 HVEP (µV) is shown in Table 1. Student t-tests revealed no significant differences between the groups. Scatterplot showing (a) the total number of illusions reported, (b) the errors at hemified contrast detection (HCD), as a function of the duration of migraine, and (c) as a function of age. The least squares fit is shown. P100 amplitude (µV) in 47 migraine patients and 62 controls shown separately for each hemifield and each eye


B. Relationship of asymmetries in visual tests to the side of headache and aura
Relationship between aura side and headache side. The migraine participants were classified according to the laterality of their aura and headache, as illustrated in Table 2. After excluding patients with inconsistent lateralisation of aura and headache, six out of 11 patients with bilateral aura had bilateral headache and 17 out of 20 patients with unilateral aura had unilateral headache, a significant relationship between the occurrence of lateralised aura and lateralised headache (p = .038). The relationship between side of aura and side of (contralateral) headache showed a trend, but it did not approach statistical significance (p = .15).
Number of patients, according to the lateralisation of headache and aura
Relationship between asymmetries of illusions and side of headache and aura. The distribution of patients according to lateralisation of headache and illusions is illustrated in Table 3. After excluding patients with inconsistent lateralisation of headache, it was found that of 12 patients with bilateral headache, eight had symmetrical illusions and four had asymmetrical illusions and out of 26 patients with unilateral headache six had symmetrical illusions and 20 had asymmetrical illusions (p = .014). Evidently, when headaches were lateralised, illusions tended to be lateralised. However, when the 20 patients who had both asymmetric illusions and consistently unilateral headache were examined, 11 had more illusions in the visual field contralateral to the side of headache and nine had more on the ipsilateral side: the relationship between side of headache and the lateral asymmetry of illusions was not significant (p = .5).
Number of patients, according to the lateralisation of headache and illusions

Number of patients, according to the lateralisation of aura and illusions

Relationship between asymmetries in hemifield spatial contrast detection and side of headache and aura. In normal participants HCD was better in the left hemifield than the right (i.e. more errors were made on the right). Only two of the normal participants made more errors on the left, and both of them were ambidextrous. The mean excess of right-sided errors over left-sided errors in normal observers was 2.29, standard deviation (SD) 1.94. Thus, the normal range of asymmetry, mean ± 2SD, was −1.59 to 6.17, where minus scores denote more errors on the left and plus scores indicate more on the right. Abnormal asymmetry was therefore present if errors on the left exceed those on the right by 2 or more, or if errors on the right exceed those on the left by 6 or more. Using these criteria, all controls fell within the normal range, whereas 29/47 patients had abnormal asymmetry; 18 had abnormal asymmetry favouring the right hemifield and 11 had abnormal asymmetry favouring the left hemifield.
Number of patients, according to the lateralisation of headache and performance at hemifield contrast detection
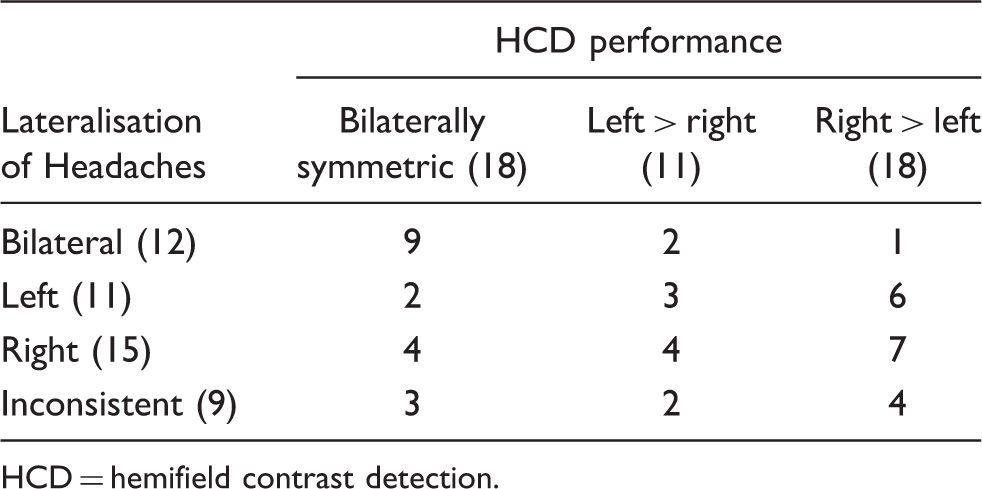
HCD = hemifield contrast detection.
Number of patients, according to the lateralisation of aura and performance at hemifield contrast detection

HCD = hemifield contrast detection.
Relationship between hemifield spatial contrast detection and hemifield P100 amplitude. Hemifield P100 amplitude was examined in relation to HCD in eight patients with reduced HCD in the right hemifield and nine patients with reduced HCD in the left hemifield. The mean P100 amplitude is shown in Table 7. For both groups and for both eyes, there proved to be a significant reduction in P100 amplitude in the hemifield with reduced HCD when compared to the opposite field in the same subjects.
Right and left hemifield P100 amplitude of HVEP (µV) for each eye in migraine participants with asymmetric HCD scores

HVEP = hemifield pattern reversal visual evoked potential. HCD = hemifield contrast detection.
Impaired.
Discussion
The main findings were as follows Patients with bilateral headache tended to have a bilateral aura and patients with asymmetrical headache tended to have an asymmetrical aura, but the trend of the headache to be on the opposite side from the aura was not significant. Illusions were greater in MA compared to controls, and more prominent on the side of a consistently unilateral visual aura. HCD was poorer in MA than controls. In patients with consistently lateralised aura HCD was reduced on the side of the aura. HCD was influenced by the duration of migraine, whereas illusions were not. Lateral asymmetry of illusions, HCD and P100 amplitude were generally consistent, and related to the side of visual aura but not to the side of headache.
The absence of a relationship between the laterality of headache and of aura found here has previously been reported by Peatfield et al. (2,22). In a larger series, they found that aura symptoms were on the same side as the headache in 55 out of 111 patients and on the opposite side in 20. This inconsistency is important considering that changes in regional cerebral blood flow (rCBF) are consistently related to the side of the aura but not to the side of the headache (23), and asymmetry of contrast sensitivity and illusions likewise. This finding has led Lance’s group (24) to postulate two independent mechanisms for the production of aura and headache. However, Olesen et al. (25), studying rCBF during attacks, observed that the headache was always contralateral to the neurological symptoms. The data in Table 2 suggest that a significant contralateral relationship might be apparent with a larger sample, but nevertheless a substantial number of patients do have headaches on the same side as their aura symptoms.
The finding of a greater susceptibility to illusions in migraineurs agrees with that of Wilkins et al. (7) who first drew attention to this observation in individuals with nonspecific headache as well as in migraineurs. The occurrence of asymmetry of illusions between the two hemifields suggests that the underlying mechanism of illusions lies behind the optic chiasm, presumably at a cortical level, rather than being related, for example, to eye movements (26).
The perception of illusion depends on the number of neurones activated, as indicated by their greater prominence with larger stimulus sizes (7), and with binocular rather than monocular perception (27). Wilkins et al. (7,28,29) found that patterns which induced illusions also induced paroxysmal EEG activity in patients with photosensitive epilepsy, and concluded that the underlying neural mechanisms were similar for both. These observations suggest that illusions may well be further manifestations of hyperexcitability of the visual cortex, which has been evaluated by the generation of phosphenes from transcranial magnetic stimulation of the occipital cortex (30), as reviewed by Welch (31).
Illusions could be due to a reduction in lateral inhibition between neurones of the visual cortex, as suggested by several authors (32–35). One might therefore propose the following synthesis. Patterns of high contrast and square-wave luminance profile, such as those used in this study, may be aversive and induce illusions by evoking excessive excitation of neurones in the visual cortex. This excitation may exceed the inhibitory capacity of the GABA-ergic lateral inhibition system, which is thought to be important for sharpening the boundaries of spatial contrast. Overriding the process of lateral inhibition by a process of massive excitation could result in both alteration of form/contrast perception and the production of illusions of motion, due to inappropriate excitation of nearby visual areas. Thus, illusions could be produced by a combination of hyperexcitability of cortical neurones and an insufficiency of the appropriate mechanisms to check this excitation.
The low-contrast stimuli used for HCD are clearly different from those that produce visual discomfort and illusions. At low contrast a square-wave pattern does not induce illusions (35), presumably because it does not produce excessive cell excitation nor influence lateral inhibition, as hypothesised above.
Most normal participants started making errors of contrast detection at a contrast level of 3.3%, so their score represents the number of errors collected at 3.3% and 2.3%. HCD was better in the right than the left hemisphere. It is well known that the right hemisphere is more important for visual perceptual and spatial abilities (36), but the extent of the lateral asymmetry in HCD in normal observers was substantial.
Several authors have reported asymmetry in the VEPs of migraineurs in the headache-free period (20), during attacks (37) and with serial recording (38,39), but only a few studies have examined the relationship of these asymmetries with the laterality of headache and aura. Winter (18) found no effect of either headache side or aura side, and Polich et al. (19) found no effect of headache side for either full-field or half-field stimulation. Dalla-Volta and Anzola (21), with pattern VEP hemifield binocular stimulation, reported “asymmetry” in the ipsilateral P100 amplitudes of the two hemifields in five out of nine patients with migraine with aura, but no asymmetry in migraine without aura. However, their criteria of asymmetry, were unclear as no figures were given, and the asymmetry was not correlated with the side of headache or aura. With whole field pattern VEP, Kennard et al. (20) found higher P100 amplitude over the left hemisphere in migraine with aura with left-sided headache notwithstanding the paradoxical lateralisation of pattern-reversal VEPs. In the present study, however, with half-field stimulation, which is a more suitable measure for testing each hemisphere, P100 amplitude was found to be asymmetrically reduced in the 17 migraineurs with a strictly unilateral aura, on the side corresponding to the aura, and this was associated with reduced HCD.
The correlation between the side of aura, illusions, reduction in HCD and reduction in P100 amplitude suggest that they all share a common anatomical substrate, an interpretation that appears weakened by selective effect of the duration of migraine on HCD but not illusions. However, in a consecutive series of patients in general optometric practice, Evans and Stevenson (40) have shown a decrease in susceptibility to illusions with age. Our data did not show the expected decline in illusions with age. The failure to find such a decline with age when such a decline was expected may indicate that there was in fact an increase with age relative to normal expectations. There may therefore have been an increase with duration relative to expectations. If so, a general parsimonious explanation of the present findings is possible. Measurements of blood flow suggest that in the least perfused areas of the cortex the flow can drop to 16–23 ml/100 gm/min and this degree of ischaemia is sufficient to explain transient neurological deficits in migraine with aura (41). We hypothesise that repeated progressive ischaemic attrition in visual areas increased cortical excitability, increasing illusions, and impairing the cortical function that sustains contrast sensitivity, HCD, and contributes to the amplitude of the VEP.
Footnotes
Clinical details of patients
| Sex | Age | Duration (years) | Number of attacks | Lateralisation of headache | Lateralisation of aura |
|---|---|---|---|---|---|
| F | 17 | 2 | 28 | Bilateral | Bilateral |
| F | 20 | 9 | 108 | Inconsistent | L |
| F | 21 | 10 | 120 | Bilateral | Inconsistent |
| F | 22 | 0.7 | 20 | Bilateral | Bilateral |
| F | 23 | 2 | 68 | Bilateral | Bilateral |
| F | 23 | 16 | 220 | L | Bilateral |
| F | 26 | 8 | 96 | R | L |
| F | 26 | 12 | 520 | R | Bilateral |
| F | 27 | 2 | 32 | Inconsistent | Inconsistent |
| F | 27 | 3 | 210 | Bilateral | Bilateral |
| F | 27 | 19 | 240 | R | Inconsistent |
| F | 29 | 14 | 168 | L | Bilateral |
| F | 32 | 15 | 196 | Bilateral | Inconsistent |
| F | 32 | 16 | 192 | R | L |
| F | 34 | 13 | 300 | L | R |
| F | 35 | 5 | 180 | Bilateral | L |
| F | 36 | 10 | 300 | Inconsistent | Inconsistent |
| F | 37 | 2 | 96 | Inconsistent | Inconsistent |
| F | 37 | 28 | 470 | L | R |
| F | 41 | 25 | 530 | R | L |
| F | 41 | 27 | 189 | R | R |
| F | 41 | 27 | 162 | R | L |
| F | 44 | 15 | 180 | R | L |
| F | 46 | 20 | 240 | L | R |
| F | 49 | 38 | 1140 | L | L |
| F | 50 | 20 | 240 | L | L |
| F | 50 | 38 | 765 | R | R |
| F | 51 | 43 | 504 | Bilateral | Inconsistent |
| F | 52 | 4 | 36 | L | Inconsistent |
| F | 52 | 10 | 140 | Inconsistent | Bilateral |
| F | 55 | 30 | 480 | R | L |
| F | 56 | 32 | 90 | Bilateral | R |
| F | 56 | 42 | 768 | Bilateral | L |
| F | 58 | 40 | 960 | R | Inconsistent |
| F | 59 | 30 | 720 | L | R |
| F | 59 | 48 | 410 | Inconsistent | Bilateral |
| M | 16 | 3 | 110 | Inconsistent | L |
| M | 32 | 19 | 230 | Bilateral | Bilateral |
| M | 33 | 1 | 21 | Inconsistent | R |
| M | 34 | 10 | 120 | Bilateral | Bilateral |
| M | 36 | 18 | 324 | R | R |
| M | 42 | 30 | 280 | R | Bilateral |
| M | 47 | 2 | 150 | L | R |
| M | 51 | 35 | 210 | R | Bilateral |
| M | 52 | 30 | 150 | Inconsistent | Bilateral |
| M | 52 | 36 | 300 | L | R |
| M | 54 | 40 | 760 | R | Inconsistent |
F = female. M = male. L = left. R = right.