
Abstract
The TEG® 5000 and novel TEG® 6s measure the viscoelasticity of whole blood during in vitro clot formation. The two devices measure similar coagulation variables but utilize distinctly different technologies. This study aimed to determine the correlation and agreement between the thrombelastographic parameters obtained by the two devices during liver transplant surgery. We obtained blood samples at six predefined intervals during the surgery of 10 consecutive patients. Two operators proficient in the use of the TEG® 6s and TEG® 5000 systems performed thrombelastographic measurements on each sample: non-citrated TEG® 5000, citrated TEG® 5000 and citrated TEG® 6s. Agreement and correlation were assessed using Bland Altman plots and Lin’s concordance correlation. There was considerable inter-device variability for the different parameters measured by the TEG® 5000 and TEG® 6s devices. Acceptable agreement was observed when results were within the normal reference ranges. However, with increasing coagulopathy, agreement was poor and results could not be considered interchangeable. Although each of the three tests appeared reliable for qualitative detection of abnormalities of clot formation during liver transplant surgery, we found their quantitative results were not interchangeable.
Introduction
Thrombelastography (TEG) is a whole blood viscoelastic haemostatic assay that evaluates the kinetics of coagulation based on the cell-mediated coagulation theory. TEG enables qualitative assessment of initiation, amplification and propagation of the coagulation process, maximum clot strength and clot stability. It has been suggested that TEG more accurately reflects functional coagulation in vivo than conventional laboratory coagulation tests. 1 Hence, TEG supplemented by standard laboratory tests is commonly used for goal-directed management of haemostasis in orthotopic liver transplantation (OLT).
The TEG® 5000 (Haemonetics Corporation, Braintree, MA, USA) has been used in OLT, as well as cardiovascular surgery, trauma and obstetrics.2–10 Kang et al. first reported its use in OLT in 19852 and demonstrated that TEG-directed therapy reduced transfusion of blood products during OLT. Algorithms have been developed to provide targeted transfusion therapies during liver transplant surgery.3,4 Factors that limit the use of the TEG® 5000 as a point-of-care device are that it is labour intensive and operator dependent, it requires multiple blood sample transfers and is prone to errors caused by vibrations or movement. The TEG® 6s (Haemonetics Corporation, Braintree, MA, USA) was developed to overcome these issues and is marketed as a true point-of-care device. The TEG® 6s has been validated in healthy volunteers and patients undergoing cardiovascular surgery. 12 However, its use in the liver transplant patient group has not previously been assessed.
The aim of this study was to evaluate the clinical agreement and correlation between the thrombelastographic parameters obtained from the TEG® 6s and TEG® 5000 devices during OLT.
Method
Study design
This was a prospective observational study in patients over the age of 18 years undergoing OLT. Following institutional ethics committee approval (protocol X16-0416), 10 consecutive patients undergoing OLT were enrolled. To minimise inter-operator variability, all assays were performed by two operators trained in the use of both the TEG® 5000 and TEG® 6s devices. During OLT we routinely perform TEG with a non-citrated sample using the TEG® 5000. However, the TEG® 6s requires a citrated sample. In this study we compared results from the TEG® 6s with those from the TEG® 5000 using both citrated and non-citrated samples (TEG® 5000-C and TEG® 5000-NC, respectively).
Blood sampling and handling
A 4 ml blood sample was obtained via a radial arterial catheter. The first 7 ml (approximately five times the dead space from the patient to the sampling port) of blood aspirated from the line was discarded to avoid contamination. The first 1.3 ml of each sample was used to run the TEG® 5000-NC and the remaining 2.7 ml was added to a blood-collecting tube containing 0.109 M sodium citrate (TEG® 5000-C). This citrated sample was then divided between the TEG® 5000-C and the TEG® 6s. The TEG® 6s and TEG® 5000 devices were calibrated according to the manufacturer’s guidelines to simulate normal clinical practice.
TEG® 5000 method
In the TEG® 5000 method, a discrete quantity of blood is pipetted into a reagent tube. The sample is mixed by gentle inversion, then pipetted into cups in the TEG® 5000 machine. The cup is then mounted on the stationary pin and oscillation of the cup begins. As the blood clot forms there is an increase in the modulus of elasticity, which increases the force binding the cup and pin. This force is transmitted to the torsion wire and is displayed as the thrombelastograph.
Four channels were used across two TEG® 5000 devices. The first device was designated the ‘non-citrate machine’. The non-citrated blood sample was divided between the kaolin (CK) assay and CK + heparinase (CKH) assay: this required 360 μl blood per channel. The second device (designated ‘citrate machine’) was used for the citrated samples only. These assays required 340 μl blood per channel; the reduced volume allowed for the 20 μl of 0.2 M calcium chloride required to reverse the citrate in the sample (Figure 1).
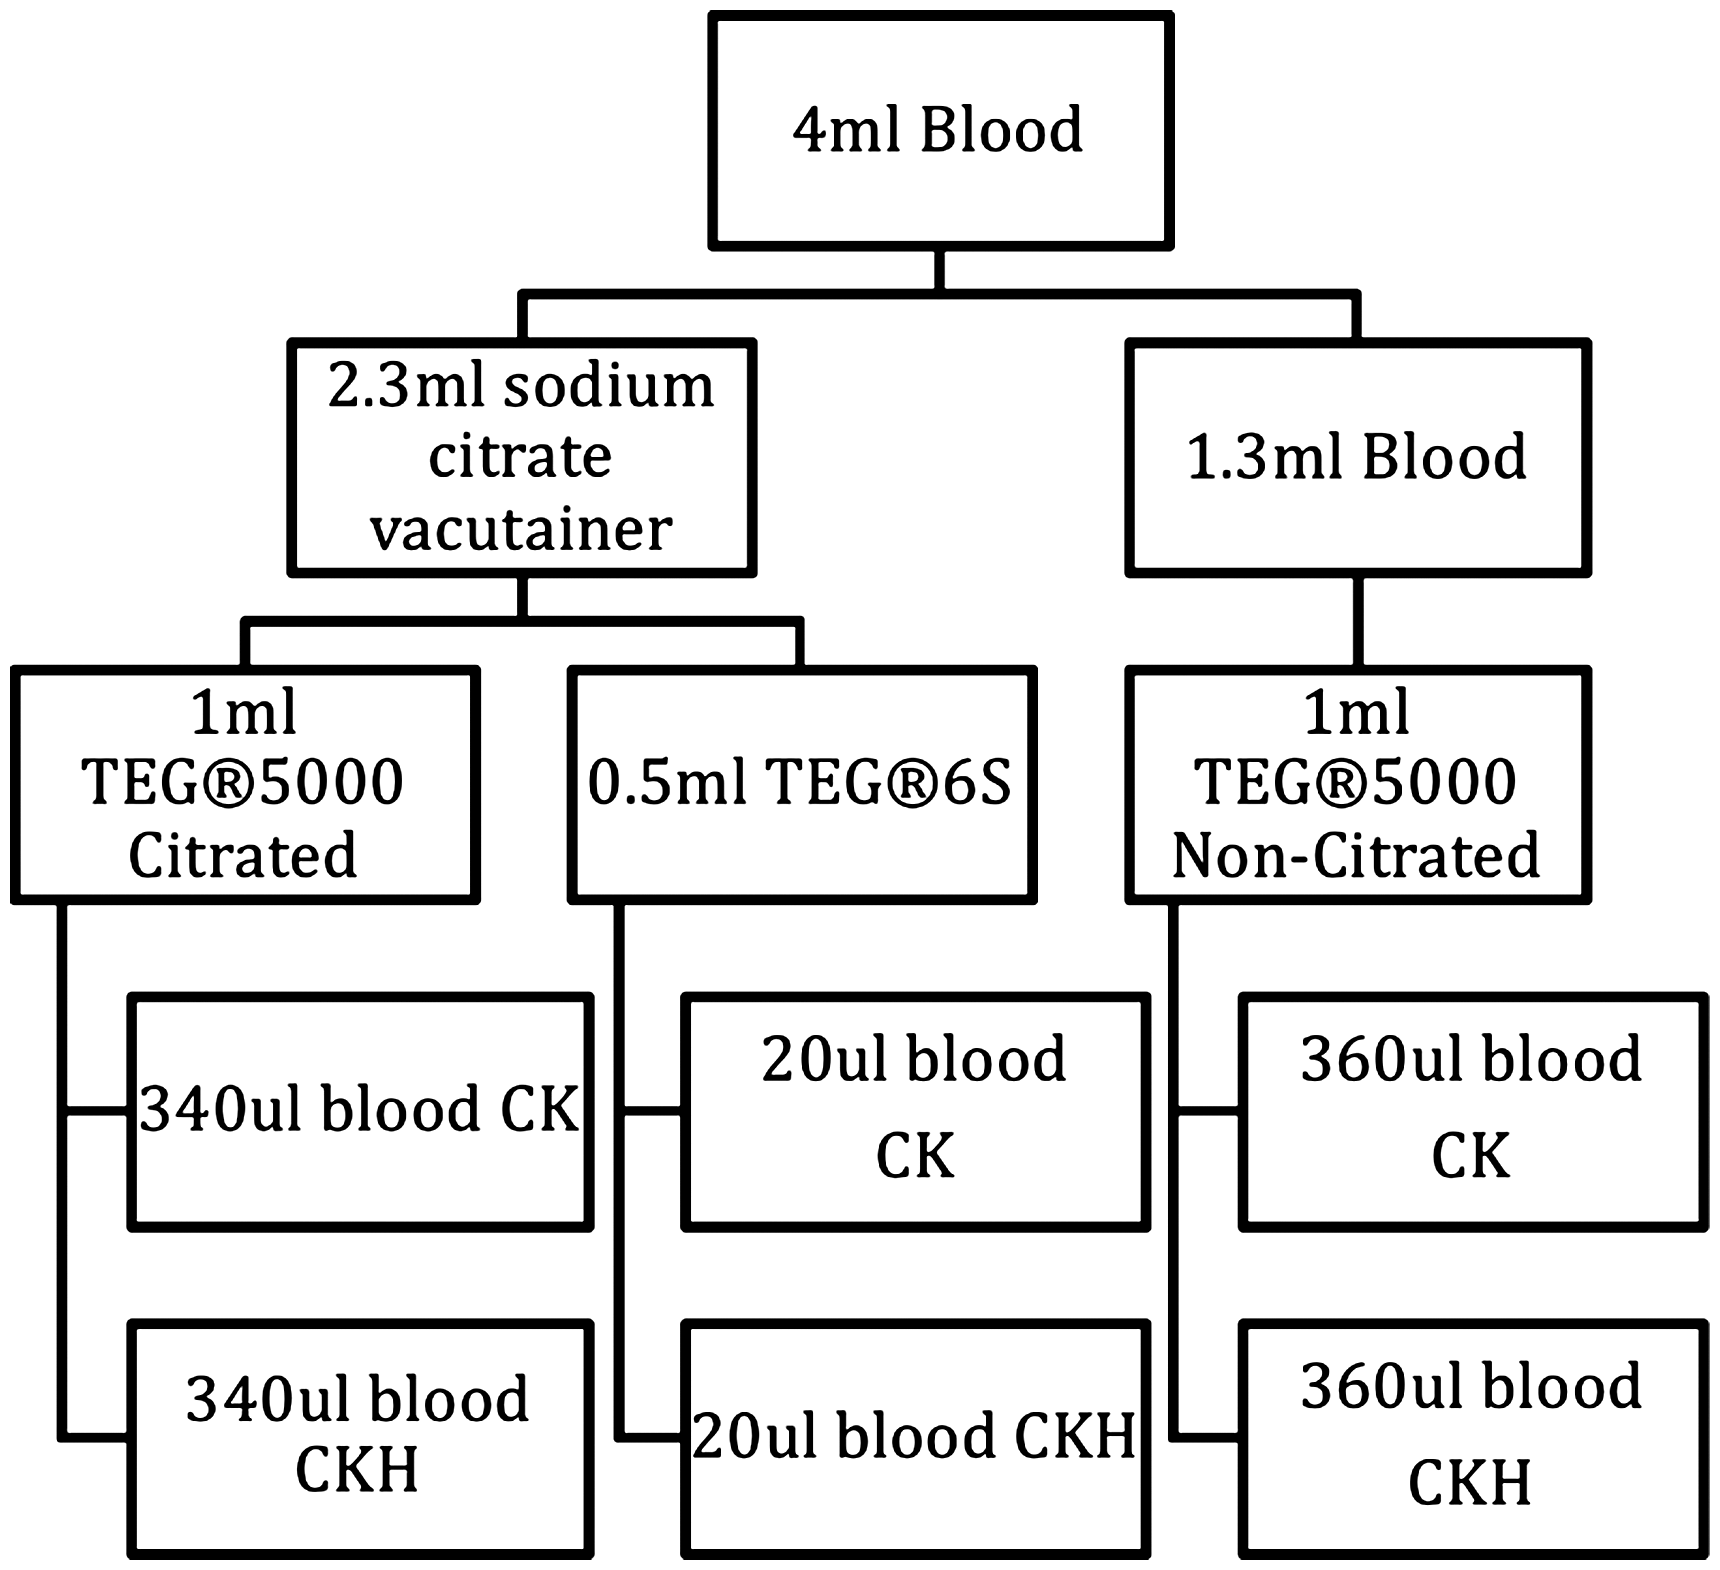
Division of blood samples across the three different types of TEG assays.
The TEG® 6s method
The TEG® 6s is a new cartridge-based system that is automated, compact and portable. Using a four-channel microfluidic cartridge containing the required reagents, the TEG® 6s automatically aspirates 400 μl of citrated blood into the test chambers. It requires the user to perform a single transfer of blood into the pre-inserted cartridge. The clot is exposed to high frequency ultrasound (20–500 Hz) pulses. Clot strength is measured by a resonance method. The TEG® 6s uses optical detection by a silicon photodiode of the motion of the free surface of the sample. All the four channels in the cartridge contain calcium chloride to reverse the sodium citrate. In addition, channel 1 contains CK; channel 2, CK + activated tissue factor (RapidTEG); channel 3, CKH; and channel 4, CK + abciximab (functional fibrinogen).
For the purposes of this study only the data from the CK channels of the TEG® 6s were collected and compared with the matched TEG® 5000 CK.
The above assays were measured concurrently at specific intervals during the liver transplant procedure: (i) baseline measurements: immediately prior to incision; (ii) dissection phase: 30 minutes after incision; (iii) anhepatic period: 15 minutes after the liver blood flow ceased; (iv) post-reperfusion: two samples taken, one 10 minutes and the other 60 minutes after reperfusion of the transplanted liver; and (v) neo-hepatic phase: abdominal muscle layer closure.
TEG parameters
The thrombelastographic parameters recorded from the assays for each channel and each interval were reaction time (r-time), kinetic time (k-time), alpha angle (α-angle), maximum amplitude (MA) and percent lysis at 30 min (LY30). These parameters were manually transcribed directly into an electronic spreadsheet at the conclusion of each test to avoid transcription errors.
Other standard coagulation tests and physiological variables were recorded in accordance with our standard of care protocol during OLT. These included temperature, international normalised ratio, activated partial thromboplastin time, serum calcium, platelet count and fibrinogen concentration.
Only the information from the routine non-citrated TEG® 5000 was used to guide patient management. The information collected from the additional citrated TEG® 5000 and the TEG® 6s was not available to the treating clinician.
Statistical analysis
STATA release 14 software (STATAcorp) and Microsoft Excel was used to analyse the data.
We compared the results of four parameters (r-time, k-time, α-angle, MA) from each of three tests (TEG® 5000-NC, TEG® 5000-C, TEG® 6s). Clot lysis time assays were not analysed as no significant lysis was detected.
Bland Altman plots were used to assess the level of agreement between the three tests. On a standard Bland Altman plot the differences between paired results are plotted against the averages of the paired results. The bias (mean of the differences) is plotted as a horizontal line and 95% limits of agreement are plotted as the bias ± 1.96 times the standard deviation of the differences. This analysis is most appropriate when the variance in the differences is consistent across the range of means.
For two of the parameters we tested (r-time and α-angle), the variability in the differences between paired results was not equal across the range of means. For those plots we performed a log-transformation to calculate sloped limits of agreement that are proportional to the mean (the slope is calculated as ± 2*(10(1.96*SD−1))/(10(1.96*SD+1)) where SD refers to the standard deviation of the base-10 log of the differences). In the case of the α-angle results, the variability of the differences increased as the measured α-angle decreased, therefore it was necessary to invert the results prior to performing the log-transformations. We inverted the results by subtracting each measurement from 90 degrees, which we considered the theoretical maximum α-angle.
When comparing the k-time results from the TEG® 5000-C with the other two tests, the differences varied linearly with the mean (Figure 2). For these two Bland Altman plots we plotted the sloped linear regression line instead of a horizontal bias, and we calculated the limits of agreement according to the method recommended by Bland and Altman. 13
In addition to the Bland Altman analyses, we assessed the degree of association between the three tests using Lin’s concordance correlation coefficient. This coefficient equals zero if there is no correlation between paired results and equals one if there is perfect agreement between the results. 14
Results
Demographic data
Blood samples were obtained from 10 liver transplant patients: six males and four females; average age = 57.4 years (range 41–66 years). The recipient’s primary pathology included hepatocellular carcinoma, hepatitis C cirrhosis, hepatitis B cirrhosis, alcohol-induced cirrhosis, non-alcohol steatohepatitis and primary sclerosing cholangitis.
Reference ranges
The reference ranges from normal subjects of the parameters obtained from both the TEG® 5000 and TEG® 6s are summarised in Table 1 and are relatively similar. 12
TEG® 5000 and TEG® 6s reference ranges. 12
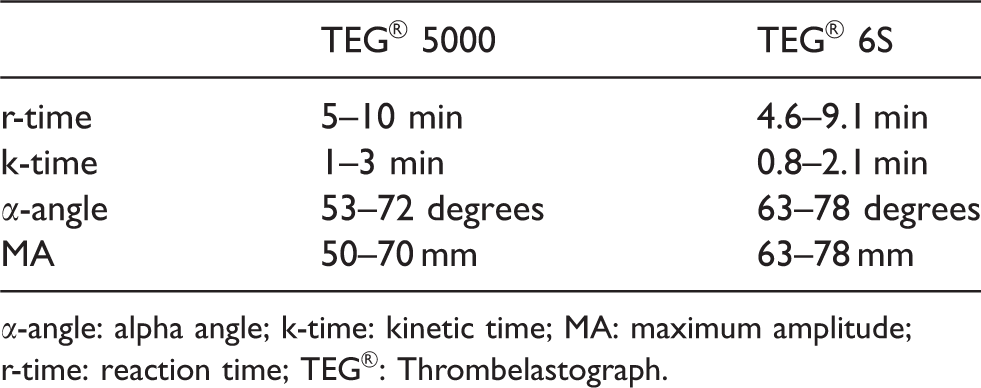
α-angle: alpha angle; k-time: kinetic time; MA: maximum amplitude; r-time: reaction time; TEG®: Thrombelastograph.
Analysis of data
One outlier was censored for each of the four parameters in the TEG® 5000-C assays due to the result being highly discrepant compared to the other two assays.
The Lin’s concordance correlation coefficients are presented in Table 2. The concordance coefficient for the k-time comparing the TEG® 6s and the TEG® 5000-NC was 0.83. The coefficient was well below 0.8 for all the other comparisons.
Lin’s concordance coefficients between the TEG® 6s vs TEG® 5000.
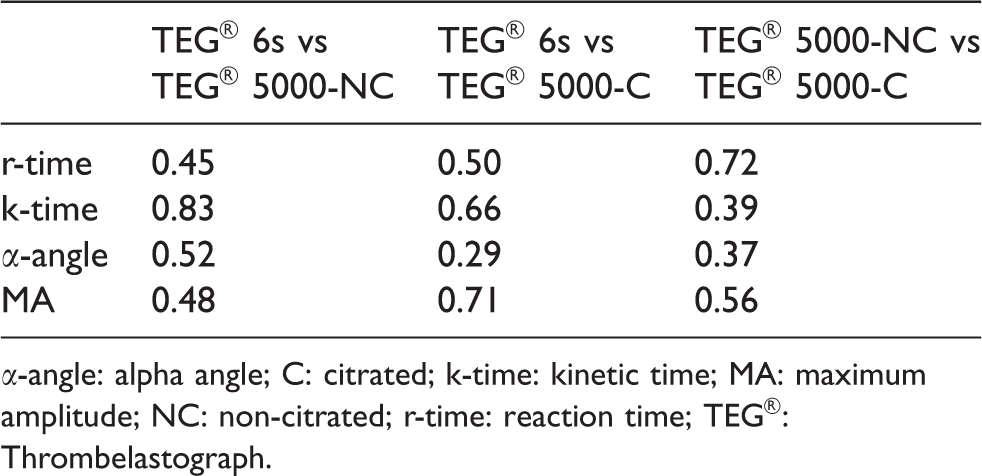
α-angle: alpha angle; C: citrated; k-time: kinetic time; MA: maximum amplitude; NC: non-citrated; r-time: reaction time; TEG®: Thrombelastograph.
Results of the Bland Altman analyses are shown in Figures 2–5 and are summarised below. The vertical dashed lines on the figures represent the limits of the reference ranges for the TEG values for each parameter being assessed. (The reference ranges for the two devices are slightly different (Table 1), therefore the vertical lines on the figures comparing TEG® 5000 results with TEG® 6s depict the averages of the two reference ranges.)
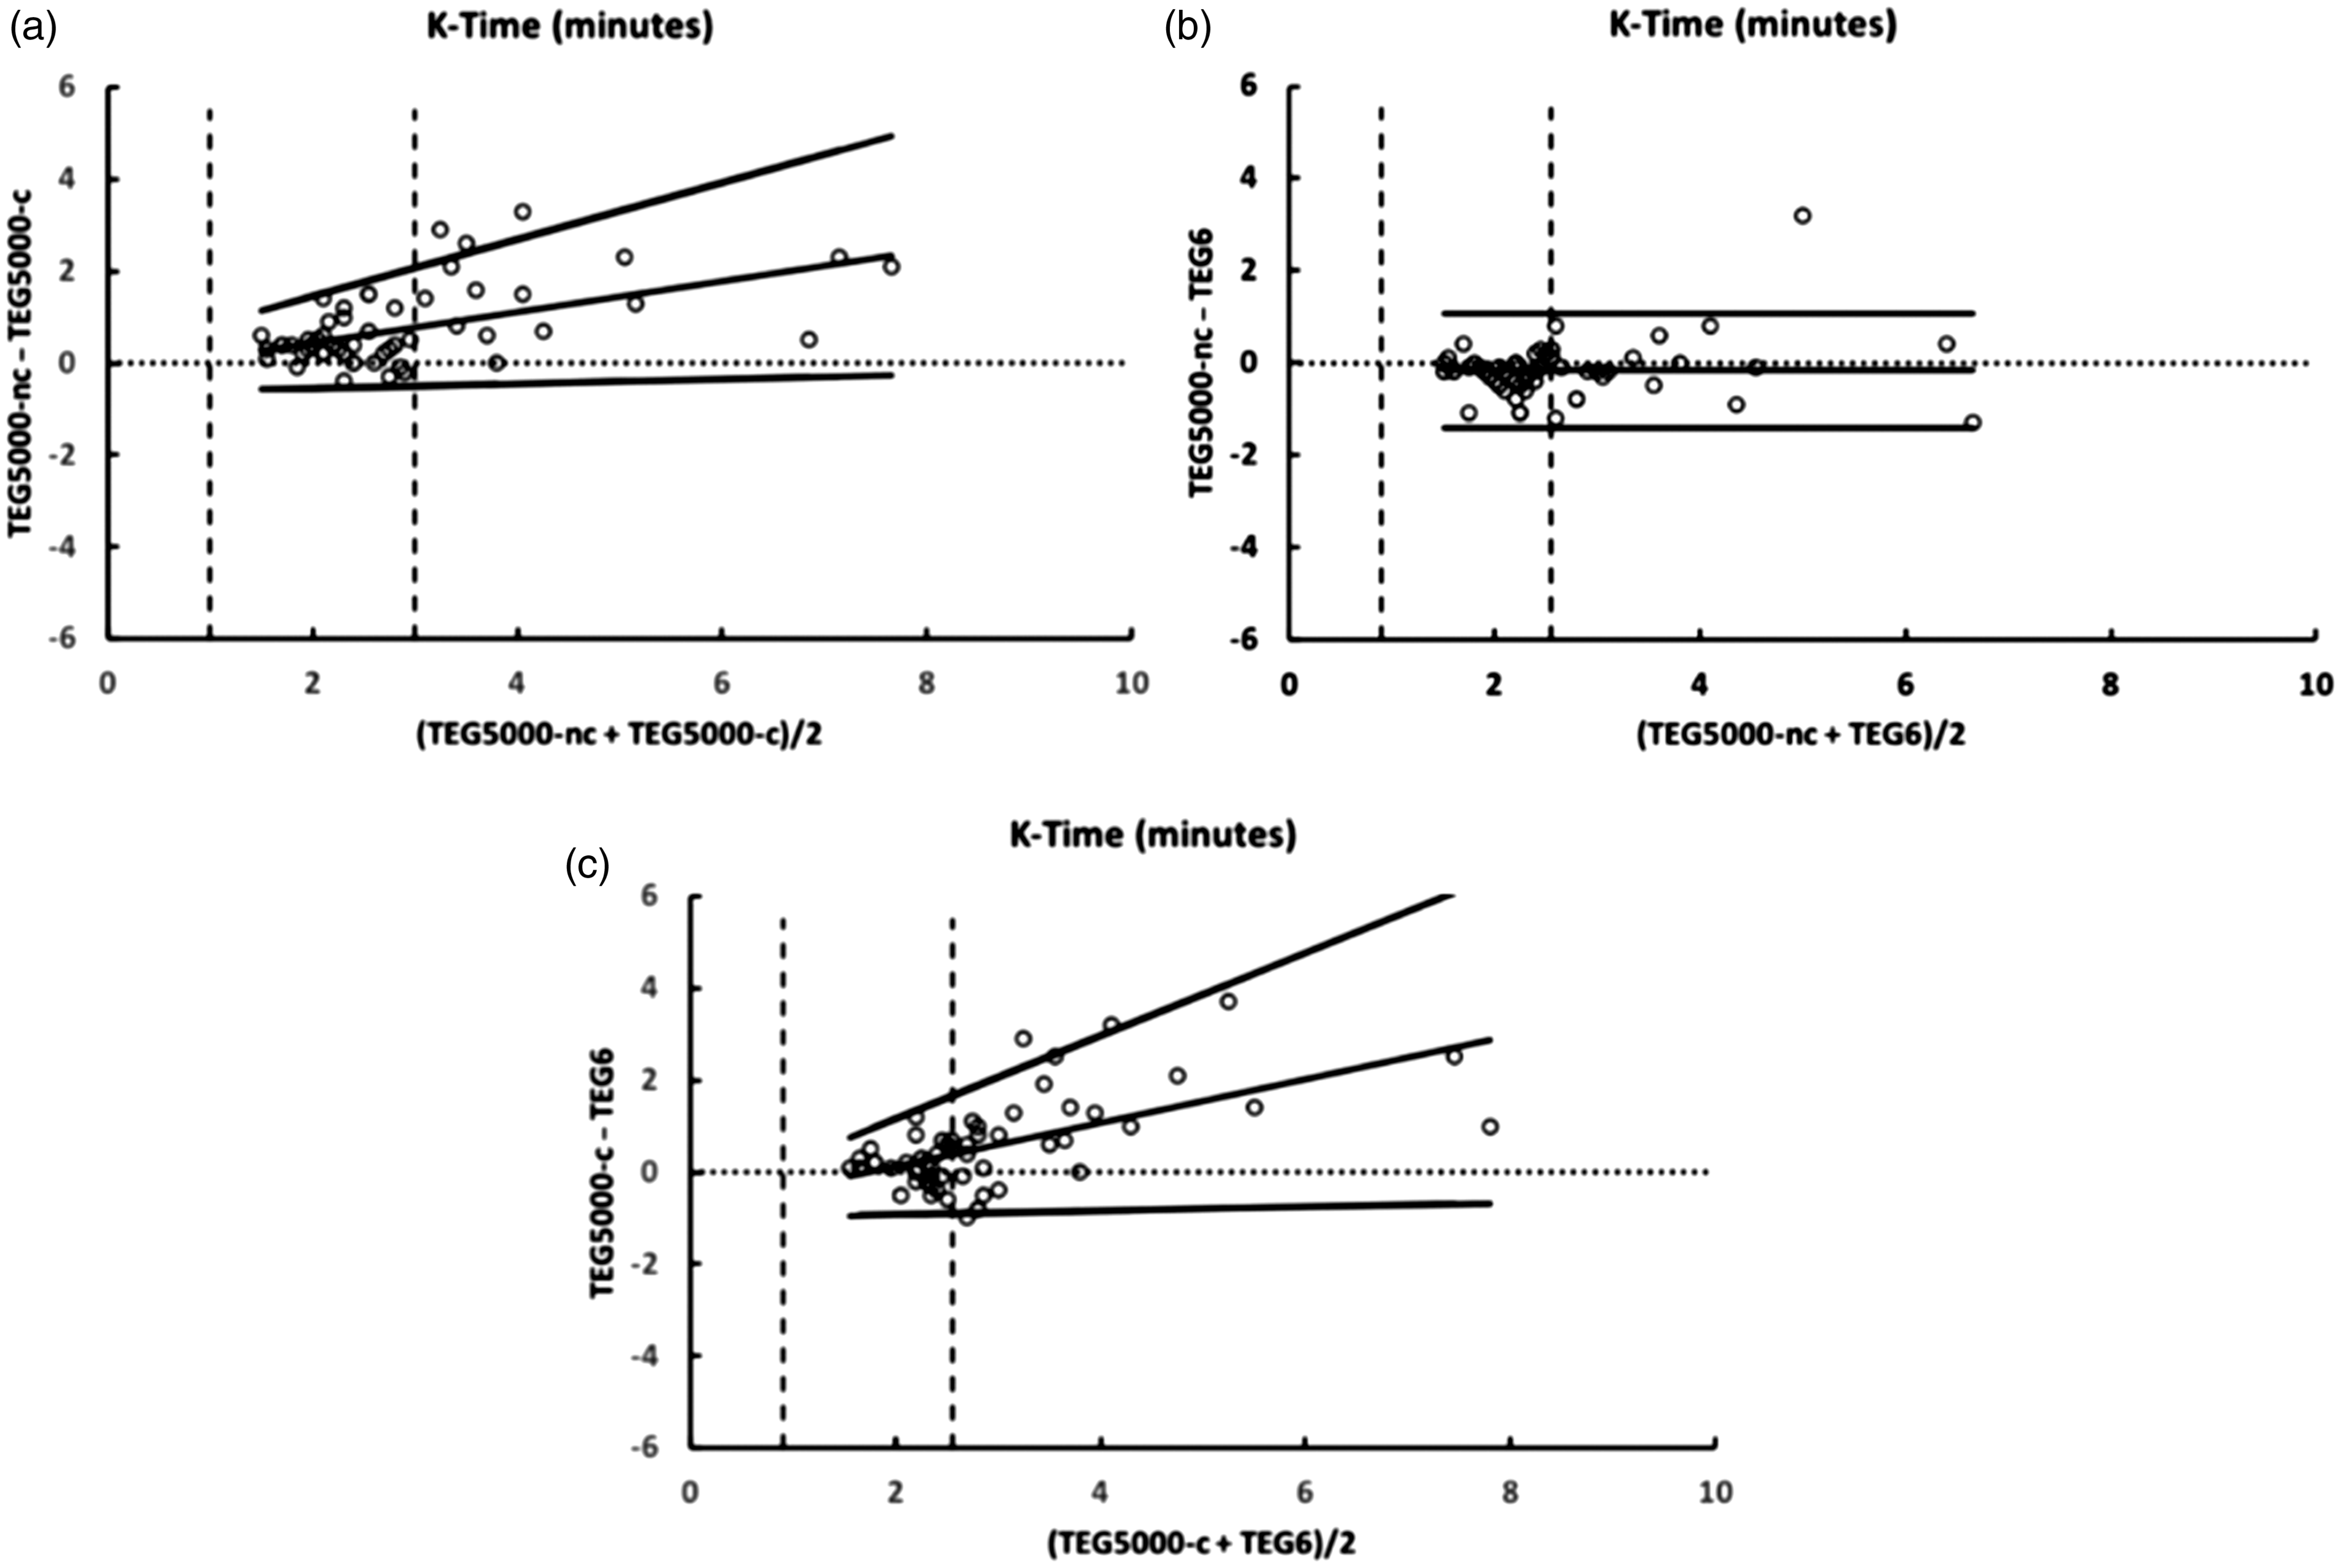
Bland Altman plots comparing kinetic time (k-time) from the TEG® 5000 citrated kaolin (TEG® 5000-C), TEG® 5000 non-citrated (TEG® 5000-NC) and TEG® 6s citrated kaolin. Vertical dashed lines indicate the limits of the reference ranges.
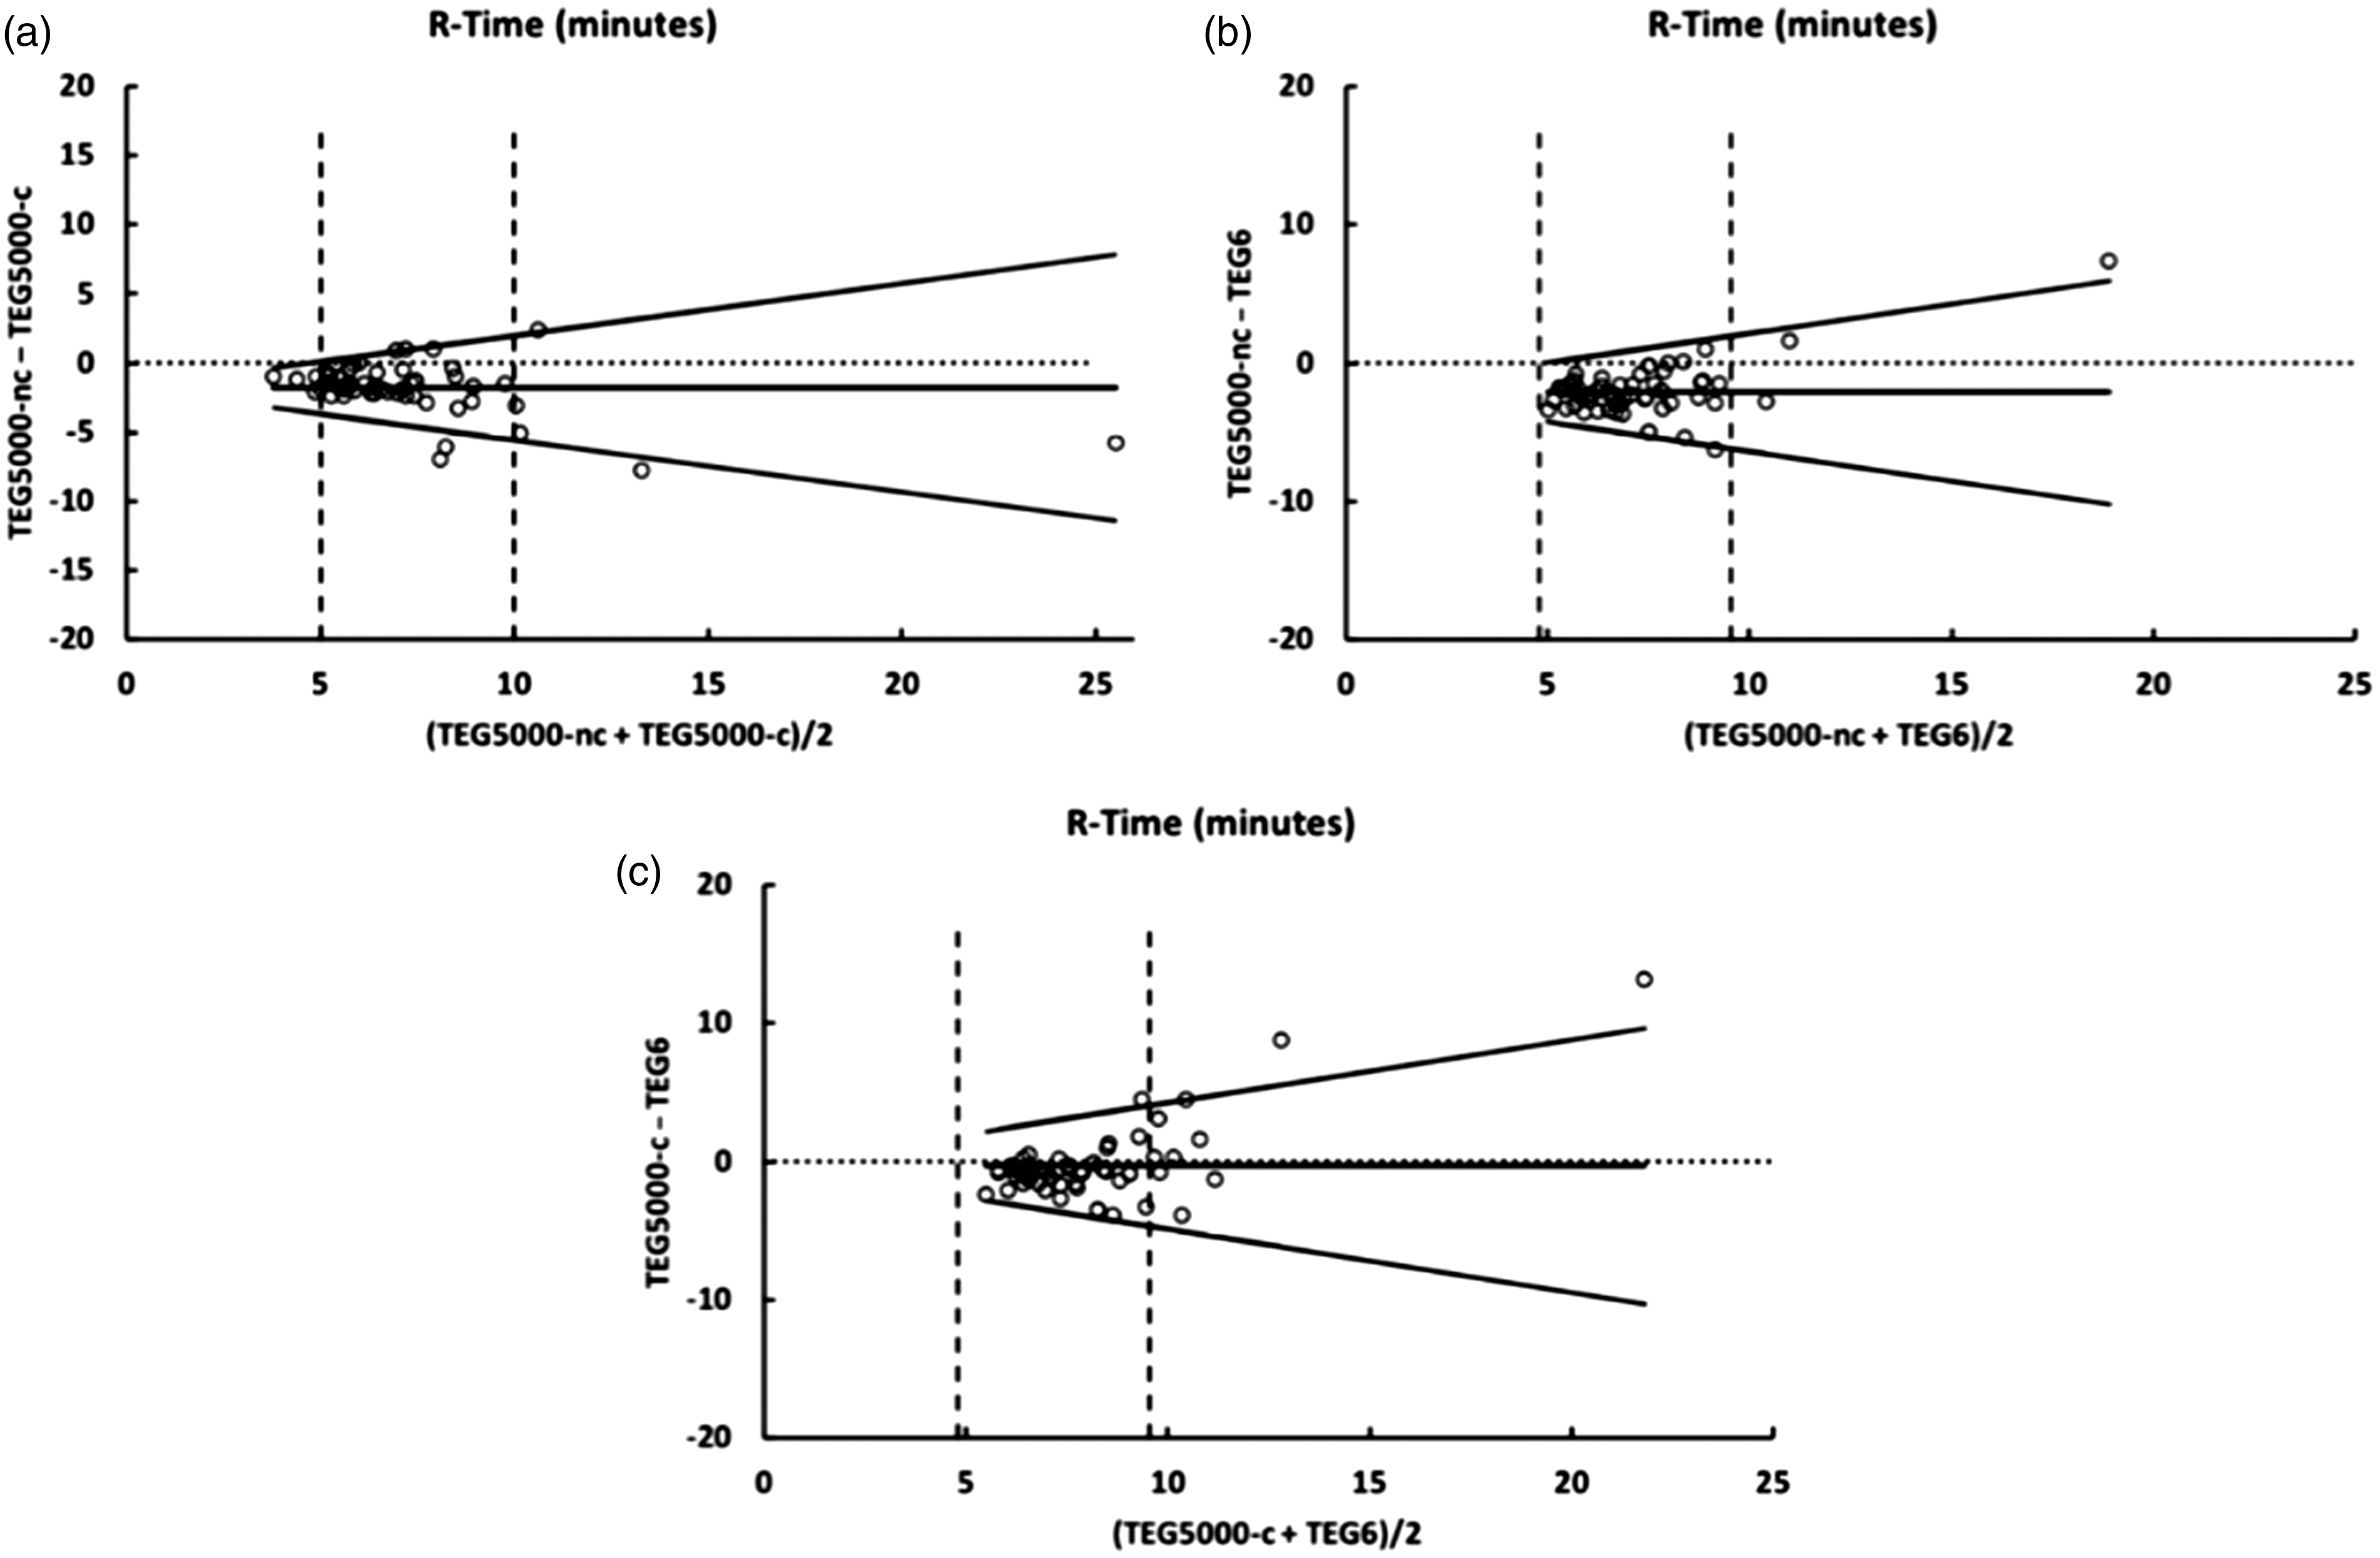
Bland Altman plots comparing reaction time (r-time) from the TEG® 5000 citrated kaolin (TEG® 5000-C), TEG® 5000 non-citrated (TEG® 5000-NC) and TEG® 6s citrated kaolin. Vertical dashed lines indicate the limits of the reference ranges.TEG®: Thrombelastograph.
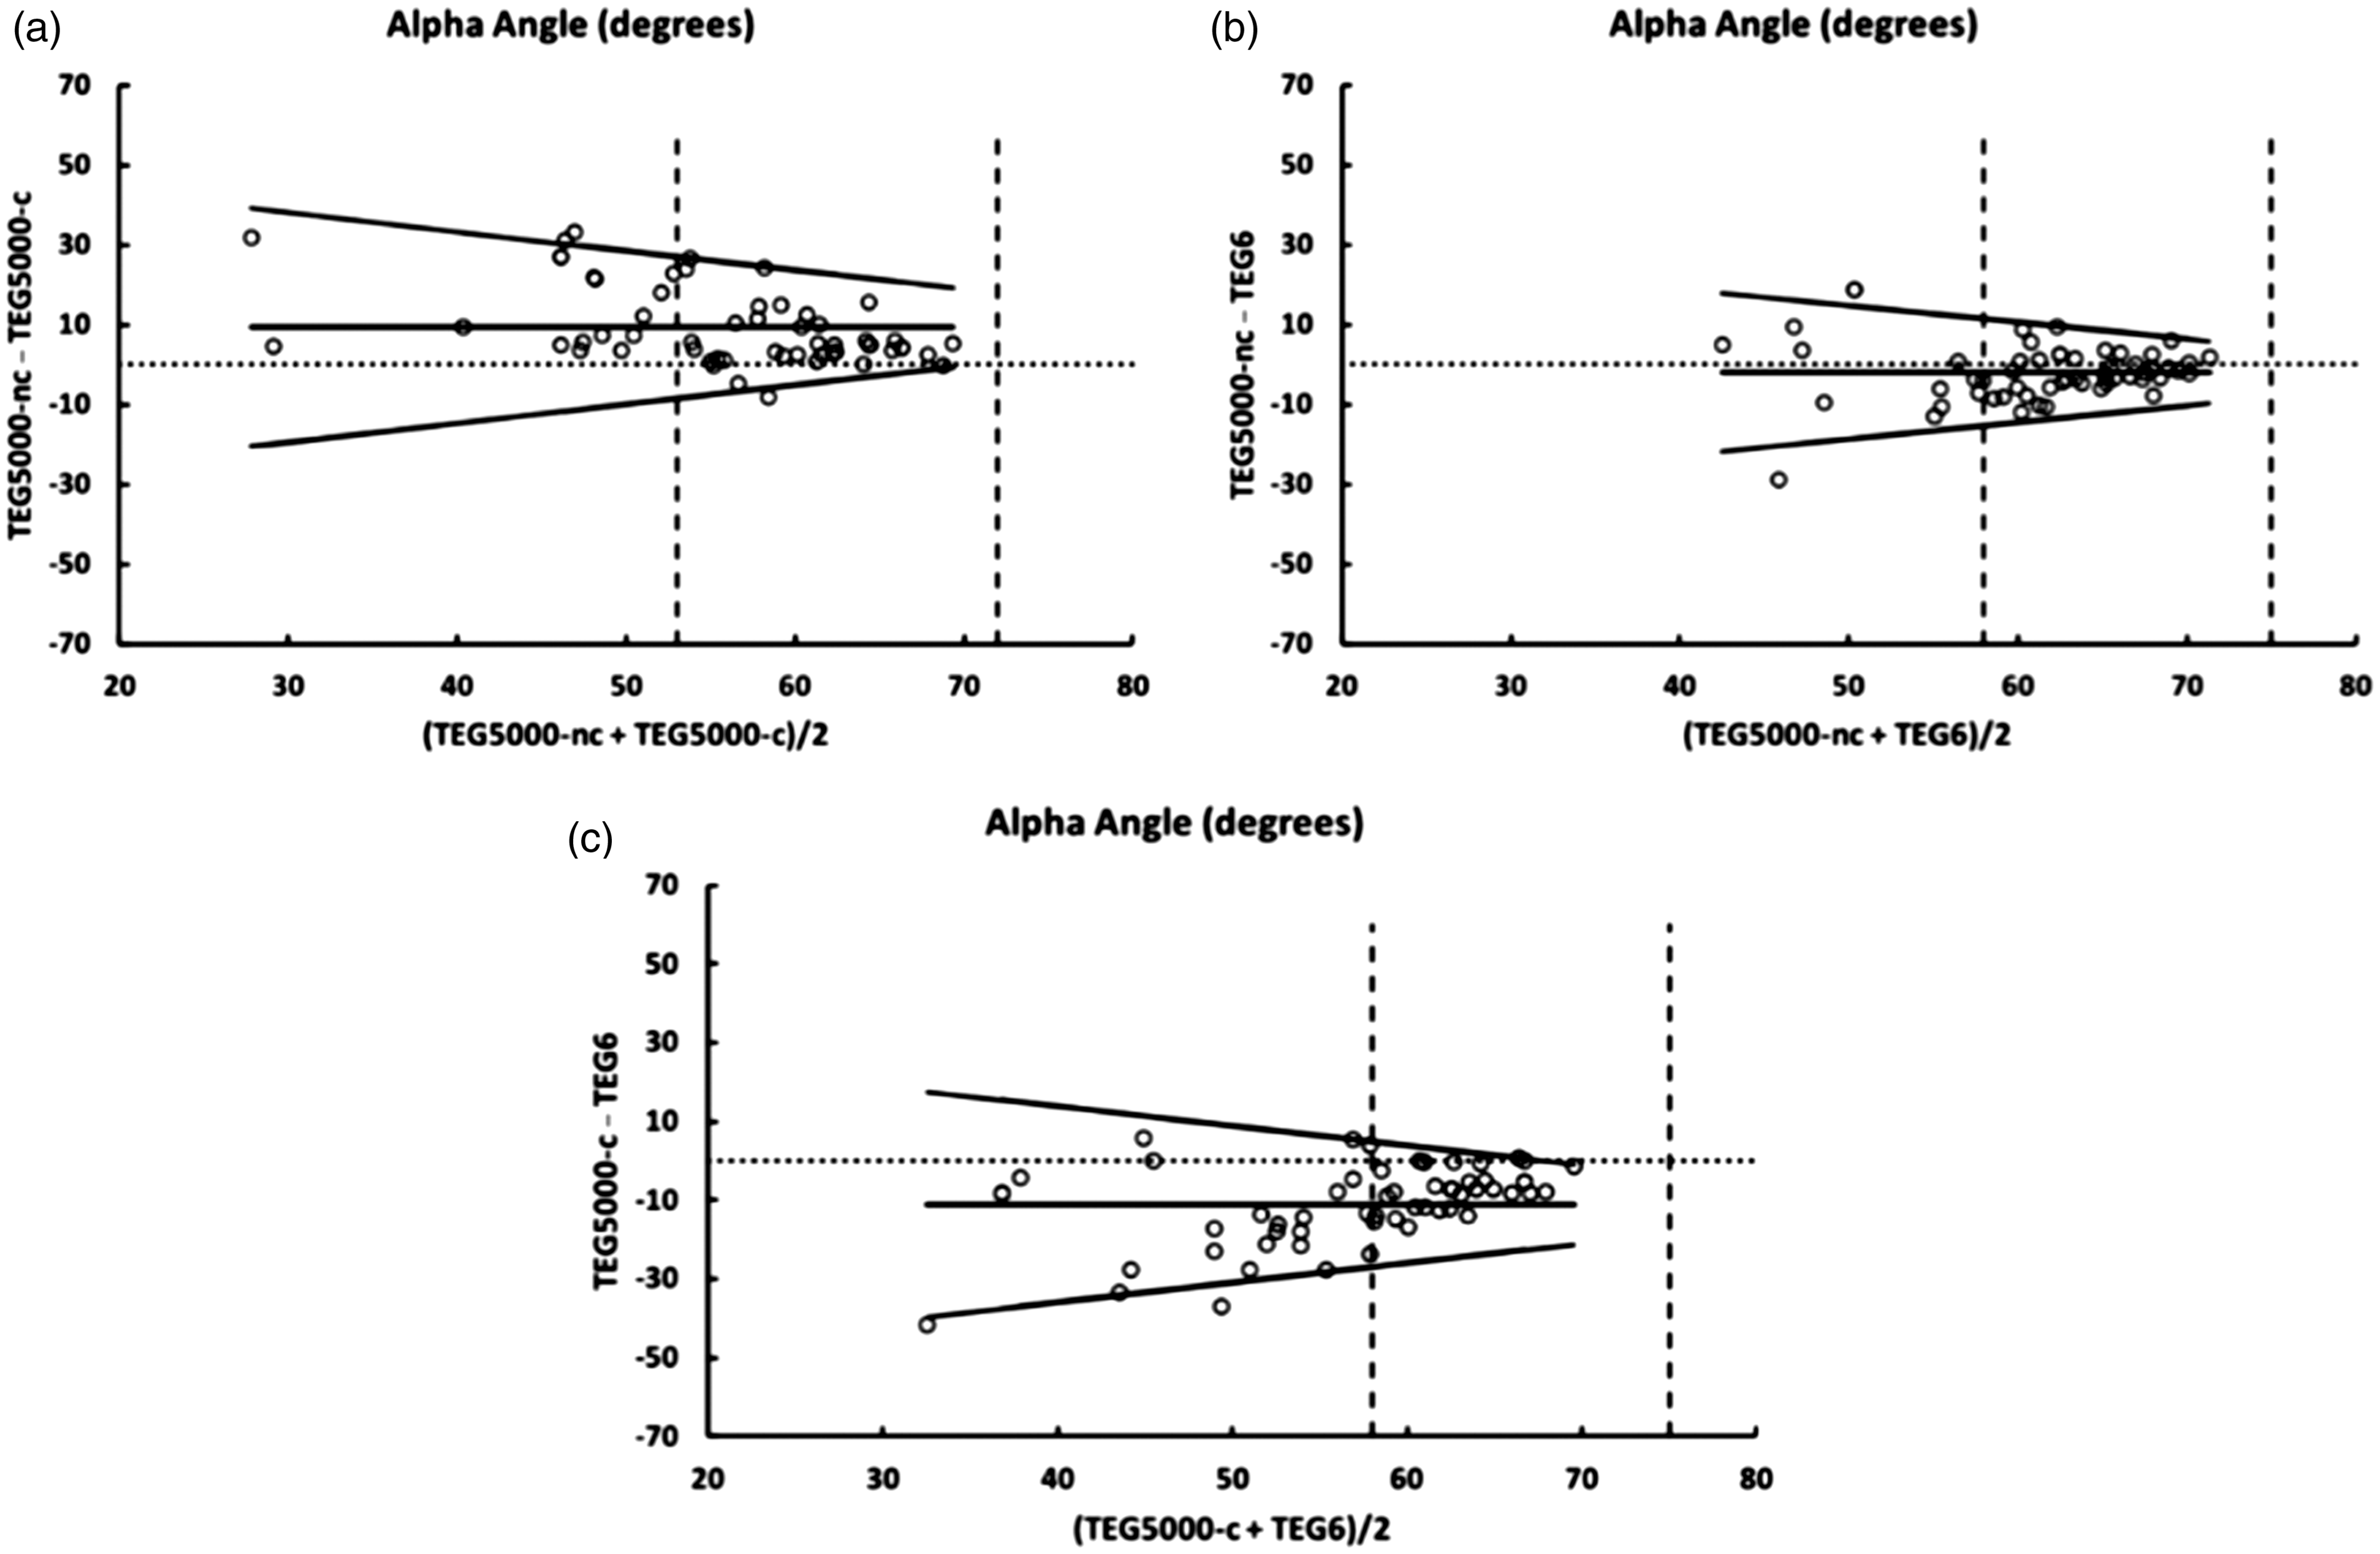
Bland Altman plots comparing alpha angle from the TEG® 5000 citrated kaolin (TEG® 5000-C), TEG® 5000 non-citrated (TEG® 5000-NC) and TEG® 6s citrated kaolin. Vertical dashed lines indicate the limits of the reference ranges.TEG®: Thrombelastograph.
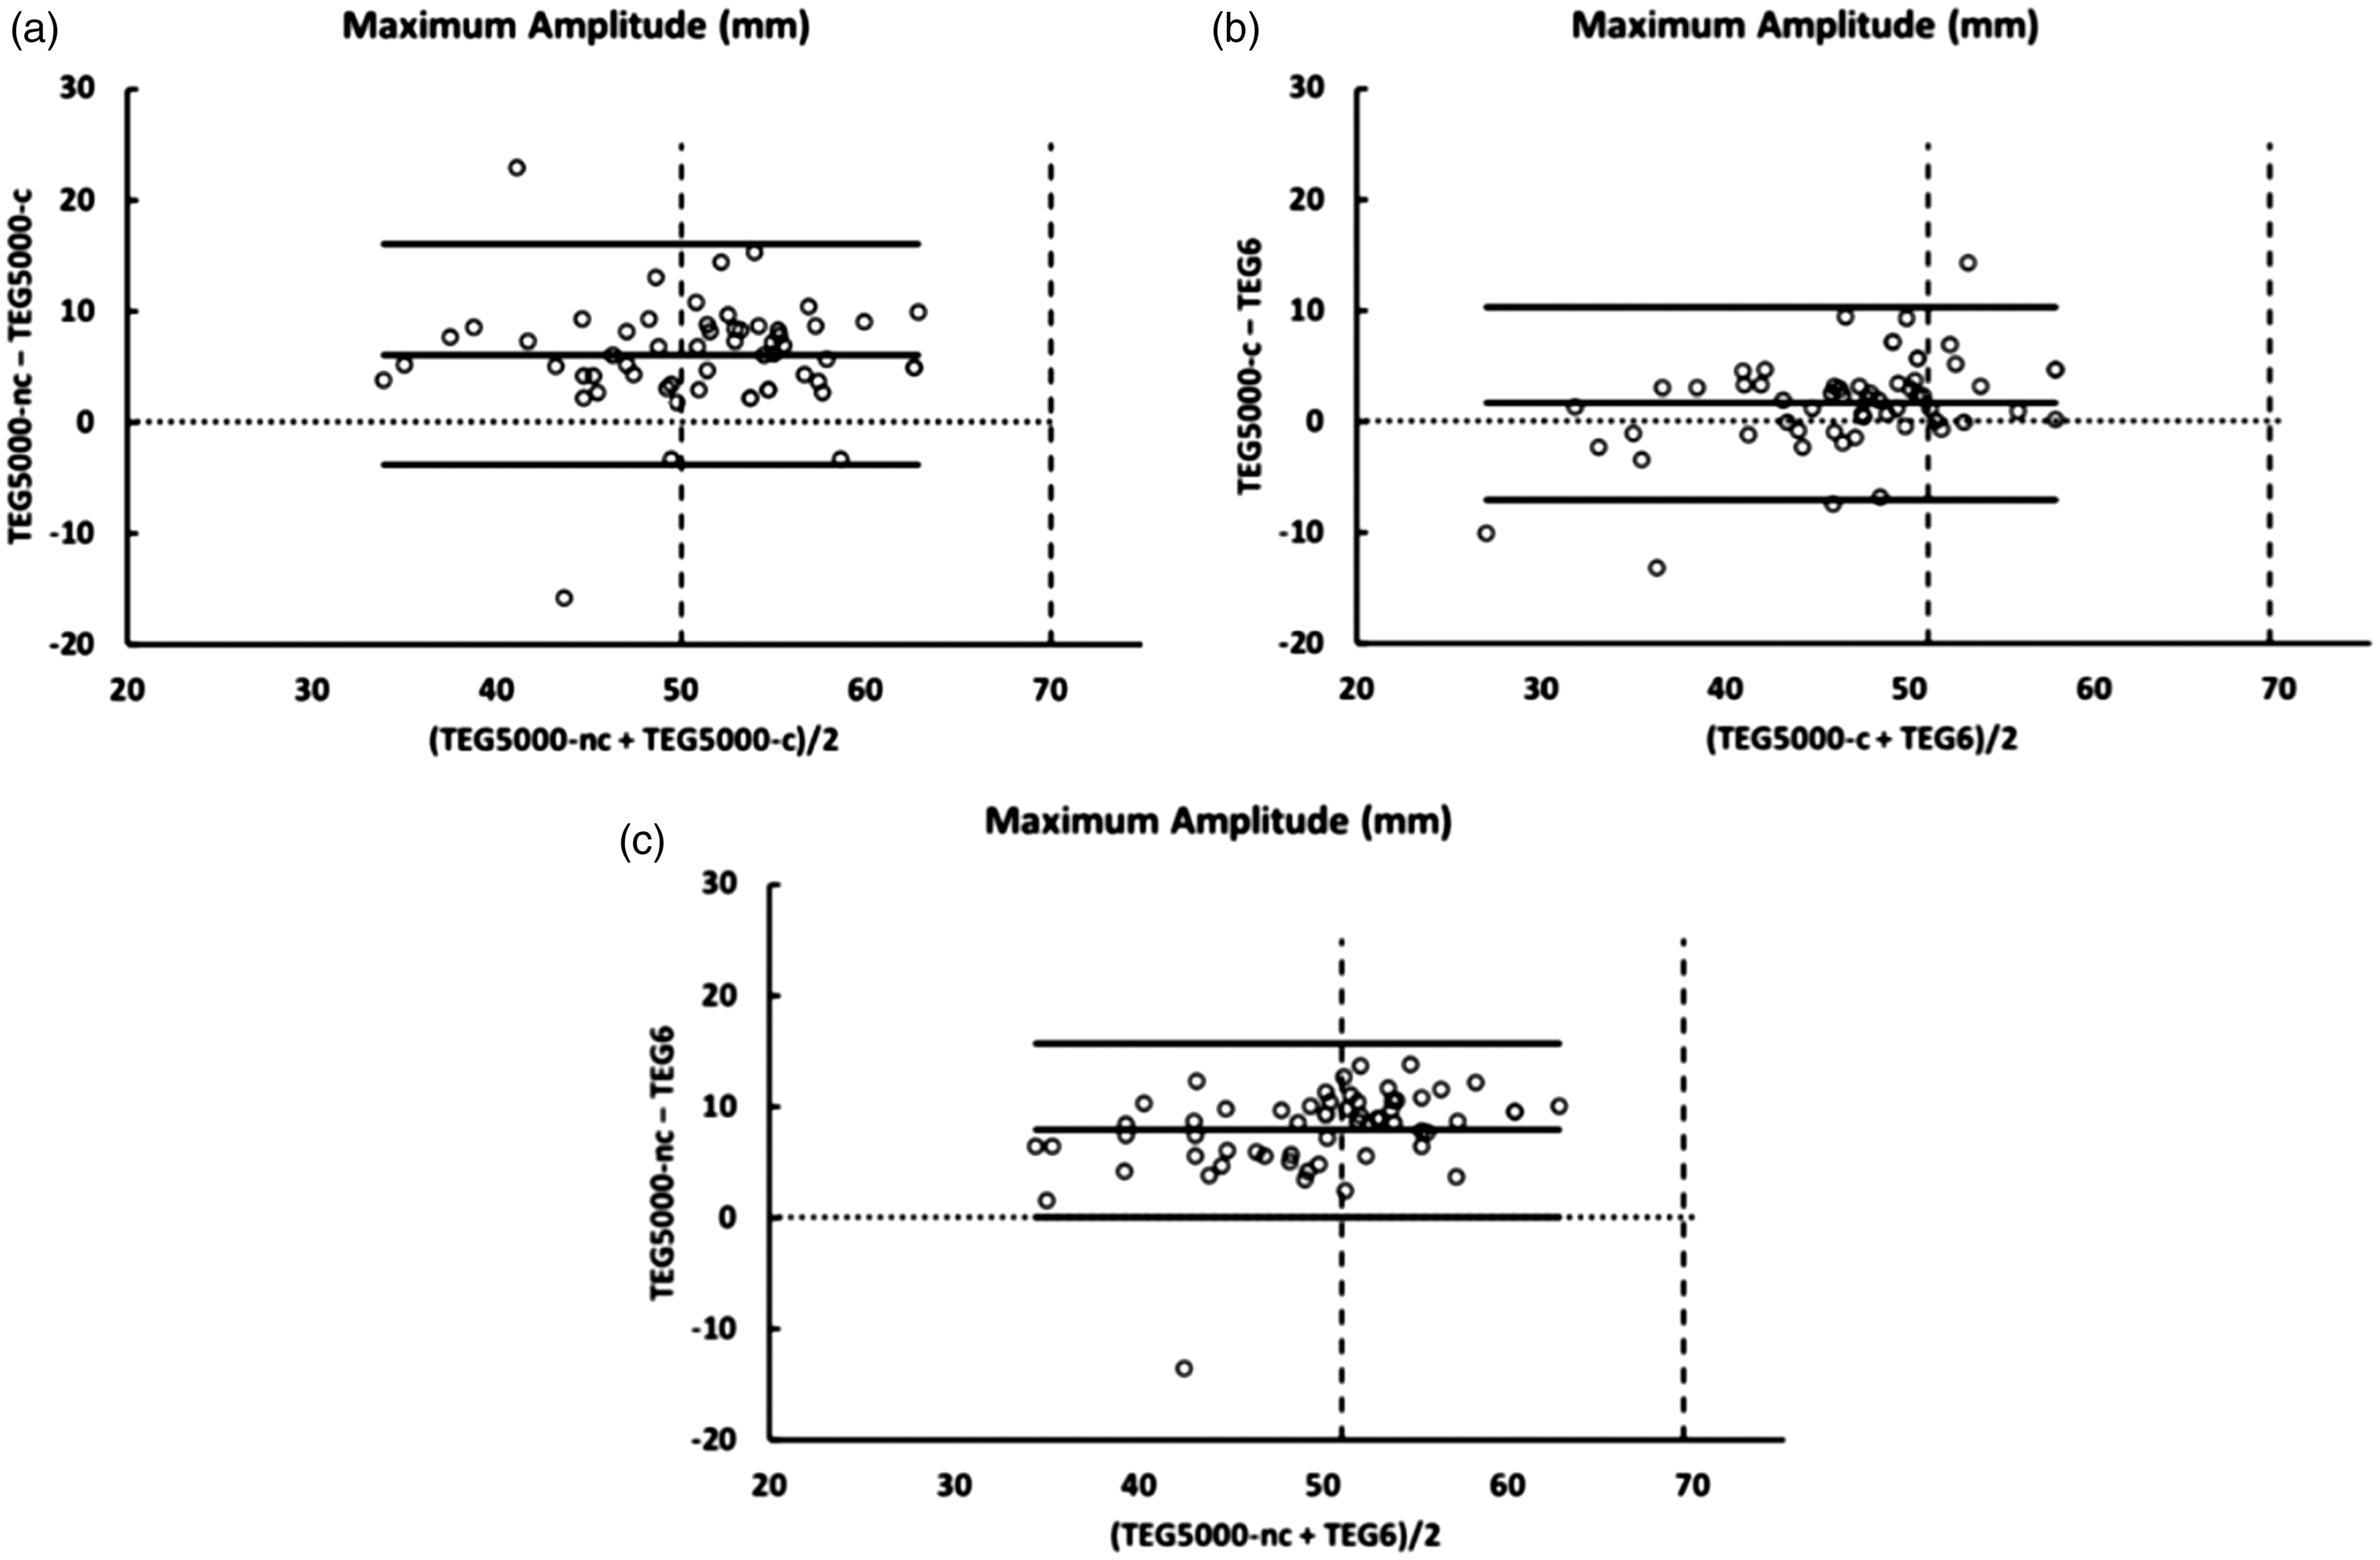
Bland Altman plots comparing maximum amplitude from the TEG® 5000 citrated kaolin (TEG® 5000-C). TEG® 5000 non-citrated (TEG® 5000-NC) and TEG® 6S citrated kaolin. Vertical dashed lines indicate the limits of the reference ranges.TEG®: Thrombelastograph.
k-time
Comparing the k-time measurements of the TEG® 5000-NC and the TEG® 6s, there was a minimal bias of −0.2 seconds with upper and lower limits of agreement of 1.1 seconds and −1.4 seconds respectively (Figure 2(b)). There was less agreement for the other two comparisons. When the k-time exceeded the upper limit of normal, the TEG® 5000-C results tended to exceed the other two assays, causing the differences to be positively correlated with the means. This is represented in Figures 2(a) and 2(c) as sloping regression lines and sloping limits of agreement.
r-time
The average difference (bias) in r-times ranged from 0.3 seconds (TEG® 5000-C compared to TEG® 6s) to 2.1 seconds (TEG® 5000-NC compared to TEG® 6s). The variability of the differences increased with increasing r-times, particularly with results exceeding the upper limit of the normal. This is represented in Figure 3 as V-shaped limits of agreement. The slopes of the limits of agreement were similar for each of the three comparisons (range ±0.38 to ±0.46).
α-angle
Increasingly abnormal α-angle results were associated with increasing variability between assays (Figure 4). This is similar to the findings for the r-times described above. The bias ranged from 2 degrees (TEG® 5000-NC compared to TEG® 6s) to 11 degrees (TEG® 5000-C compared to TEG® 6s). The slopes of the limits of agreement were similar for each of the three comparisons (range ±0.42 to ±0.50).
Maximum amplitude
There was minimal bias between the TEG® 5000-C and the TEG® 6s (1.6 mm). The MA results from the TEG® 5000-NC averaged higher than both the TEG® 5000-C (bias 6.1 mm) and the TEG® 6s (bias 7.8 mm). There was similar variance for all three comparisons with the width of the limits of agreement ranging from 16 mm to 20 mm (Figure 5).
Discussion
In this prospective observational study, we assessed the TEG results from three assays: TEG® 6s and TEG® 5000 with either citrated or non-citrated blood. The results from these assays were not interchangeable as there was often significant disagreement, particularly with results outside the normal ranges. However, despite their quantitative disagreement, we believe each of the three tests is effective in qualitatively identifying abnormalities of clot formation in the clinical environment.
Regarding the MA results, we consider the biases and limits of agreement to be reasonable in comparison to the normal ranges of 54 mm to 72 mm for the TEG® 5000 and 52 mm to 69 mm for the TEG® 6s. For the other three parameters, inspection of the Bland Altman plots indicates there was close agreement between assays when the results were within the normal range. The variability between the tests increased for increasingly abnormal results. This is emphasised when comparing the results that lie both within and outside the limits of the normal range – the vertical dashed lines on Figures 2–4. The only exception was the k-time comparison between the TEG® 5000-NC and the TEG® 6s, which showed reasonably close agreement across the range of results, both normal and abnormal. It could be argued that agreement between the absolute magnitude of results outside the normal range is less important than reliably detecting that there is a clotting abnormality.
Our concordance analysis confirms that the test results were not interchangeable. All our concordance coefficient values were below 0.8, the only exception being the k-time when comparing the TEG® 6s and TEG® 5000-NC. For the purposes of confirming the reliability of laboratory analytical techniques, it has been recommended that a concordance coefficient below 0.9 be taken to indicate poor agreement. 15 However, we are not aware of any published criteria for acceptable concordance when comparing point-of-care tests such as the TEG.
In orthotopic liver transplantation (OLT), excessive bleeding is clinically influenced by many other factors independent of coagulopathy. Additionally, no global indices of coagulation can assess all the factors that contribute to or inhibit clot formation. Hence, clinical management of bleeding in these patients should be based on clinical endpoints rather than reference standards. Tests such as the TEG may then be used in conjunction with the clinical picture to facilitate management decisions.16,17
There are several limitations of this study. It should be noted that our data derive from a small sample size of 10 patients, using six separate samples from each patient to generate 60 comparisons for any one parameter. This method of data collection has the primary limitation that the data points from each patient are not independent and additionally some TEG variables (r-time and k-time) are related to each other and hence constrained. However, this sample size and repeat sampling method were similar to the evaluations and validations of TEG® 5000 and the TEG® 6s assays provided by the device manufacturers in a healthy patient population. 18
The TEG® 6s has theoretical advantages over the TEG® 5000. It is more compact and portable. Non-trained personnel may use the machine reliably, as technical skills such as pipetting and mixing of samples, or prior preparation of reagents are not required. The TEG® 6s assay requires less time to perform; approximately 30 seconds compared with an average of 3 minutes for the TEG® 5000. Technical issues with the torsion wire and requirement for a level surface have been eliminated. The TEG® 6s is purported to be a more robust device and less influenced by movement. It is, however, not immune to movement artefact, which may affect test results. 19
The accuracy of the TEG® 6s within normal range has been validated previously. 12 The study reported that both TEG® 5000 and TEG® 6s devices provided comparable data with respect to global haemostasis and platelet function in healthy volunteers and cardiac patients. Our study has also demonstrated there was close agreement between the thrombelastographic parameters measured by the two devices when the results were within the normal range. As results became more abnormal, variability in the measured parameters increased. The significance of this is not entirely clear. The variability between our measurements could be partly due to the markedly different technologies employed in the TEG® 5000 and the TEG® 6s. However, we found similar disagreement between paired tests using only the TEG® 5000, depending on whether the sample was citrated.
Our study demonstrates that the TEG® 6s is capable of detecting and recognising disordered coagulation. However, as the results of TEG® 5000 and TEG® 6s are not interchangeable, units planning to transition from TEG® 5000 to TEG® 6s should exercise caution in the interpretation of the results based on previous experience. TEG-based transfusion algorithms and protocols may need to be developed for this novel device. Irrespective of this, we suggest management of a coagulopathy and clinical bleeding should be directed not only by correction of the TEG parameters but also the evolving clinical picture.
Footnotes
Declaration of conflicting interests
The author(s) declared no potential conflicts of interest with respect to the research, authorship, and/or publication of this article.
Funding
The author(s) received no financial support for the research, authorship, and/or publication of this article.