
Abstract
The Hybrid Power Flow Controller (HPFC) has a simple design configuration, where the upgrading of the line functionality and controller can be performed in stages. This paper applies two HPFC configurations to a multi-machine power network. The first HPFC is a combination of two static synchronous series compensators (SSSC) connected in series, and a Static Var compensator (SVC). The second one consists of two shunt Static synchronous compensators (STATCOM) connected through a Thyristor controlled series compensator (TCSC), across a coupling transformer in a common DC link. The HPFC topologies are tested with a multi-machine power network with faults, in the presence of solar and wind energy sources. The overall model is simulated using SimPowerSystems toolbox and the performance of the two HPFC topologies is compared under various operating conditions. The comparison of simulation results shows that the second HPFC gives a better view than the first in analyzing the power system transient stability.
Introduction
With the ever-increasing load demands, the large number of interconnections, the additional generating installations, and the growing penetration of renewable energy sources such as wind and solar photovoltaics, power systems are forced to operate under unplanned, variable, and stressful conditions while striving to maintain its stability and reliability.
Flexible AC Transmission Systems (FACTS) have long been used to enhance power systems’ transmission capacity and efficiency.
The Hybrid Power Flow Controller (HPFC) has proved a very efficient power flow control device in electric transmission systems. It is a combination of various Flexible AC Transmission System Controllers (FACTS), operating under several conditions. Since the HPFC is considered as an alternative to the Unified Power Flow Controller (UPFC), variable impedances controlled by thyristors replace one of the switching converters of the UPFC. Therefore, each HPFC consists of Facts controllers’ type (voltage source converter VSC) via coordination with impedance type (shunt susceptance or an SVC). The HPFC is used to control the real power in the distribution system and regulate the total reactive power flow between the two ends of transmission lines.
The HPFC has been recently studied and used to enhance the stability of power systems. The authors in Mathew and Chatterji (2012c) presented a modeling and simulation study using MATLAB/Simulink of three different configurations of HPFC connected to a Single Machine Infinite Bus (SMIB) system. In another work, in Mathew and Chatterji (2012a) they have again tested these HPFC configurations on a 3-machine, 9-bus power system using LabVIEW. However, Aggarwal et al. (2014; Bhasin et al. (2019) implemented an HPFC on an SMIB power system and presented a comparative study of the HPFC with the classical UPFC which demonstrated the superior capability of the HPFC in power system stability enhancement.
The authors in Tamimi et al. (2016) presented the modeling of the HPFC in steady-state for optimal power flow control. A detailed dynamic model of the HPFC connected to a distribution network was developed and implemented in PSCAD by Tamimi and Canizares (2018). The HPFC is integrated into a two-area benchmark test system of Ontario-Canada’s grid and different controllers such as Fuzzy, Radial Basis Function Neural Network and Neuro-Fuzzy with HPFC are proposed in Vineela and Rao (2020). It has been shown that the HPFC can minimize the voltage sag by using an acceptable control scheme under different operating conditions.
The authors have implemented the HPFC on Real Time Simulator OPAL-RT-OP4510 in Anjali and Mathew (2020) and compared it with the UPFC. This experimental study was based on a multi-machine-9-bus system, by considering the characteristics of the network such as line voltage, and active and reactive power.
Rose and Kumar (2020) focused the research on the simulation of an HPFC on a 4-bus system and analyzed the system in open-loop and closed-loop using PI (Proportional and Integral) and Hysteresis controllers, The results have shown that the Hysteresis controller was able to improve the power quality.
In this paper, two different configurations of HPFC are presented and implemented on a modern multimachine network connected to solar and wind energy sources and subjected to a 3-phase-to-phase. A simulation study is presented in MATLAB/Simulink to compare the performance of the two topologies. The purpose of this comparative analysis is to illuminate the relationship between these two topologies. Different HPFC configurations have already been analyzed and implemented on multi-machine system in Mathew and Chatterji (2012a), where all the HPFC configurations behave almost in the similar manner. For more comprehensiveness, we introduce renewable energy sources in the system and the steady state stable values of relative inter-area mechanical rotor speed (wm) and load angle (delta) have been investigated.
The remainder of the paper is organized as follows: Section 2 presents the structure of the power system studied in this paper. In section 3, the principle of the HPFC is discussed, and the proposed two topologies are described. Section 3 presents the simulation and discussion and finally, Section 4 summarizes the conclusions of the paper.
Power system structure
The power system considered in this study is depicted in Figure 1. It is based on the Kundur 4 machines, 11 bus test system consisting of two similar areas interconnected via two 220 km long transmission lines (Appendix A).
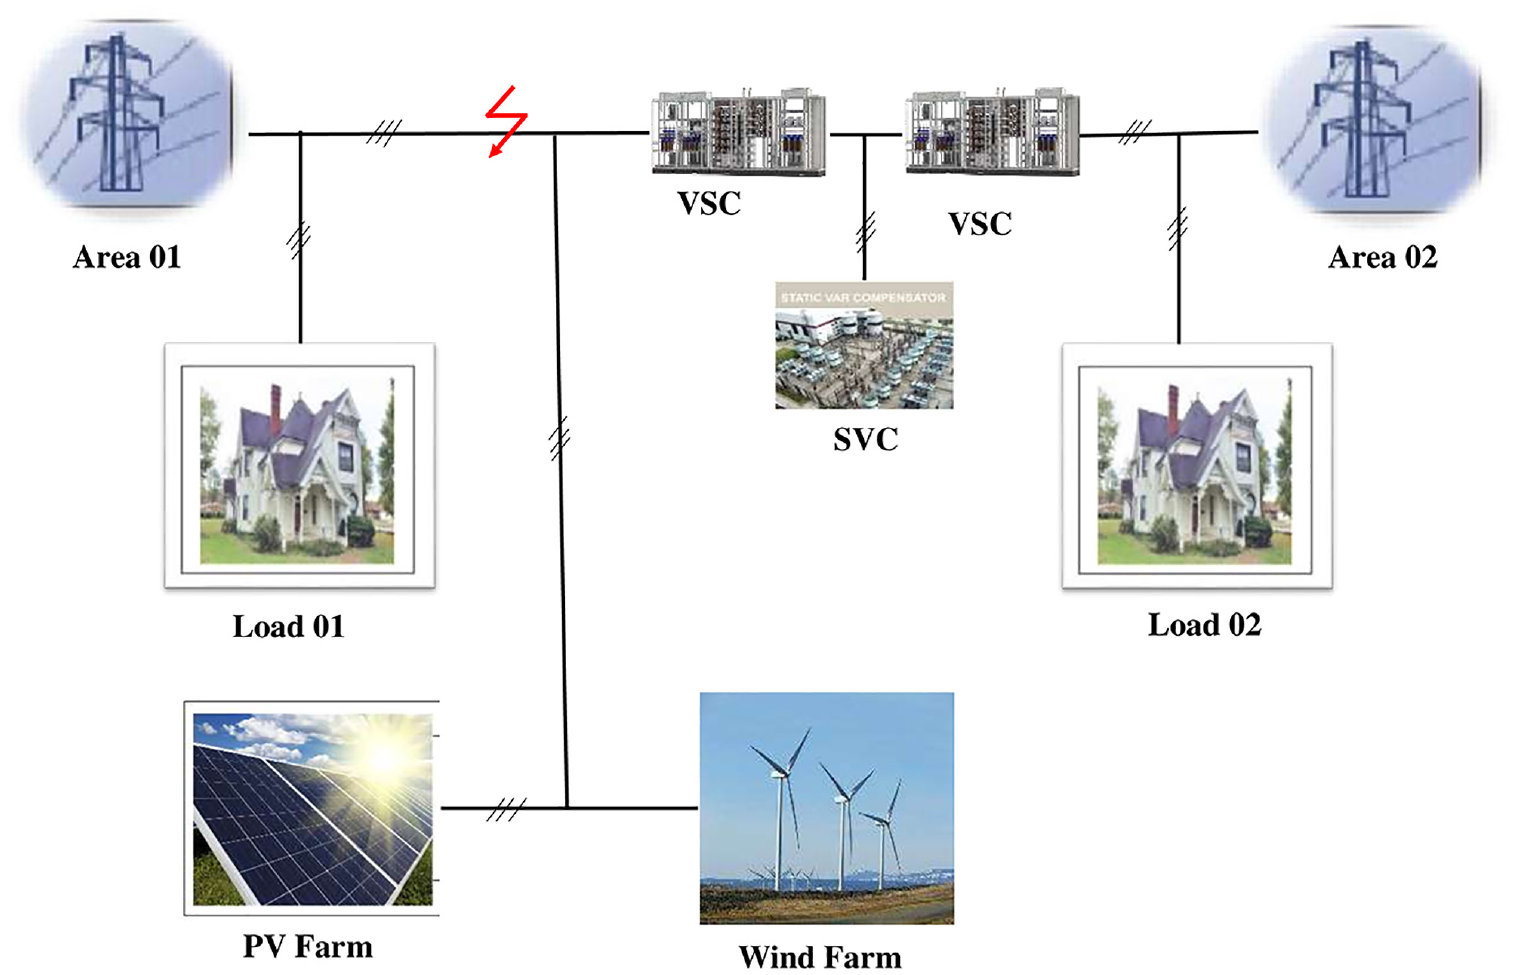
Power system structure.
Two Hybrid Power Flow Controllers (HPFC) are connected in separate and unified modes to the network transmission line. A reactive power shunt source and two series voltage converters are the components of the first HPFC., Two shunt current converters and a reactive power shunt source consist of the second HPFC. The simulation block representations of HPFCD1 and HPFC2 are represented in Appendix B.
Renewable sources consisting of a solar photovoltaic park generating 100 MW and a wind farm generating 12 MW are connected to area 1 of the system. The PV farm produces energy proportional to three factors: the size of the area covered by the PV farm, the efficiency of the solar panels, and the irradiance data. Whereas, the simplified wind farm model presented in this work generates power using a linear relationship between the nominal wind speed and nominal power.
The renewable energy sources are simulated based on real wind speeds and real solar radiation taken from World Weather API and Weather Forecast, Kundur Weather Karnataka, in Kundur is Fri 3rd Dec 3:38 am.
The system is simulated in 15 seconds and a three-phase symmetrical fault occurs in the middle of the main circuit line at time = 1 second.
HPFC topology
The HPFC has been proposed to overcome the disadvantages of the UPFC such as high cost, complexity of structure and operation. The authors in Seddiki et al. (2022) confirm that its presence ensures the control of real power and the regulation of the voltage of the power system. It also can control separately the total reactive power exchanged with the sending and receiving ends of the line.
Figure 2(a) shows an equivalent circuit diagram of the HPFC. It consists of two half Voltage Source Converters (VSC) connected back-to-back, and one controlled variable impedance. The converters VSCX and VSCY are represented by voltage sources
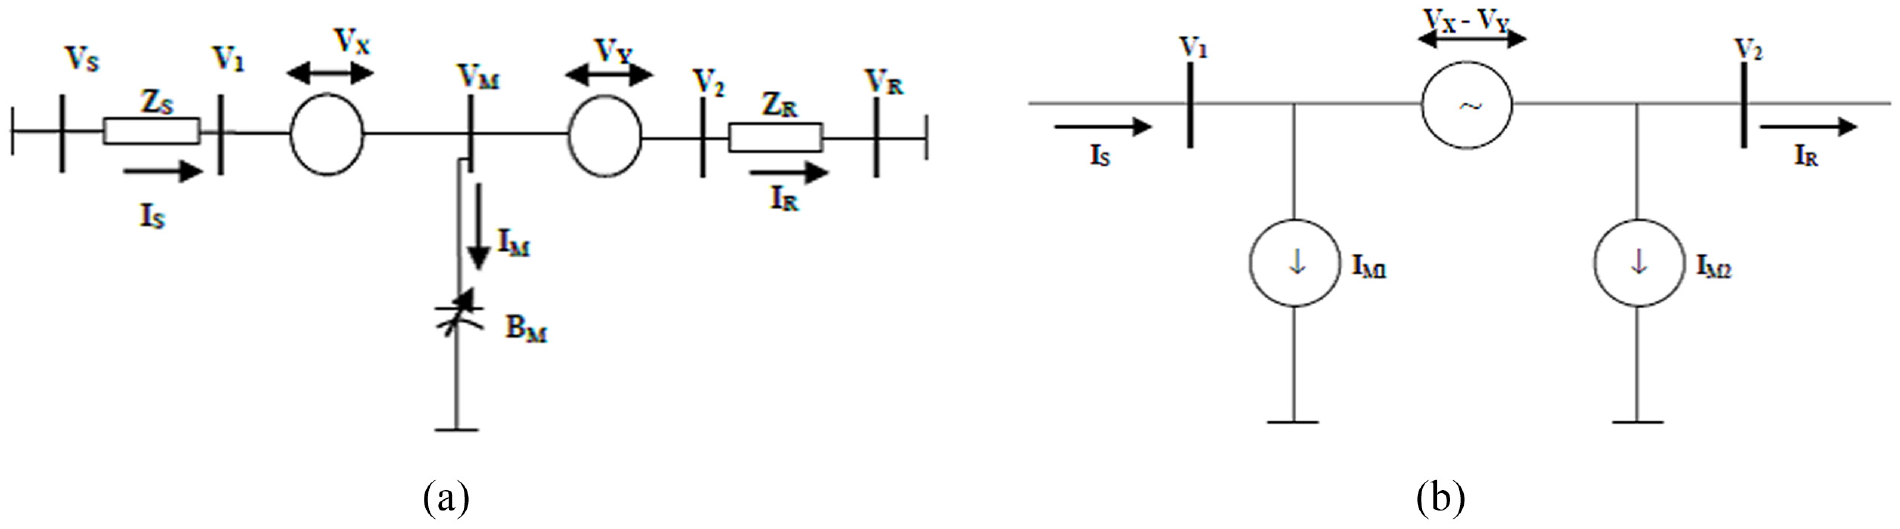
HPFC configuration: (a) equivalent circuit diagram and (b) simplified equivalent circuit.
Figure 2(b) shows a simplified equivalent transformation of the HPFC in Figure 2(a) (Agarala and Marutheswar, 2015). The current source is divided into two half-value currents
The FACTS devices of the HPFC are designed to adjust independently and simultaneously the power flow parameters to regulate the active and reactive powers. As illustrated in the schematic diagram of Figure 3 taken from Ghahremani and Kamwa (2012), the HPFC can then be useful to control the flow of active power while compensating for the serial line impedance by using a Controlled Series Capacitors (TCSC), or a Static Synchronous Series Capacitors (SSSC). They can control the voltage and, in the meantime, compensate for reactive energy by using a Static Compensator Shunt (SVC) or a Static Synchronous Compensator (STATCOM). In addition, they can control the transport angle by using Phase Shifting Transformers (PST)
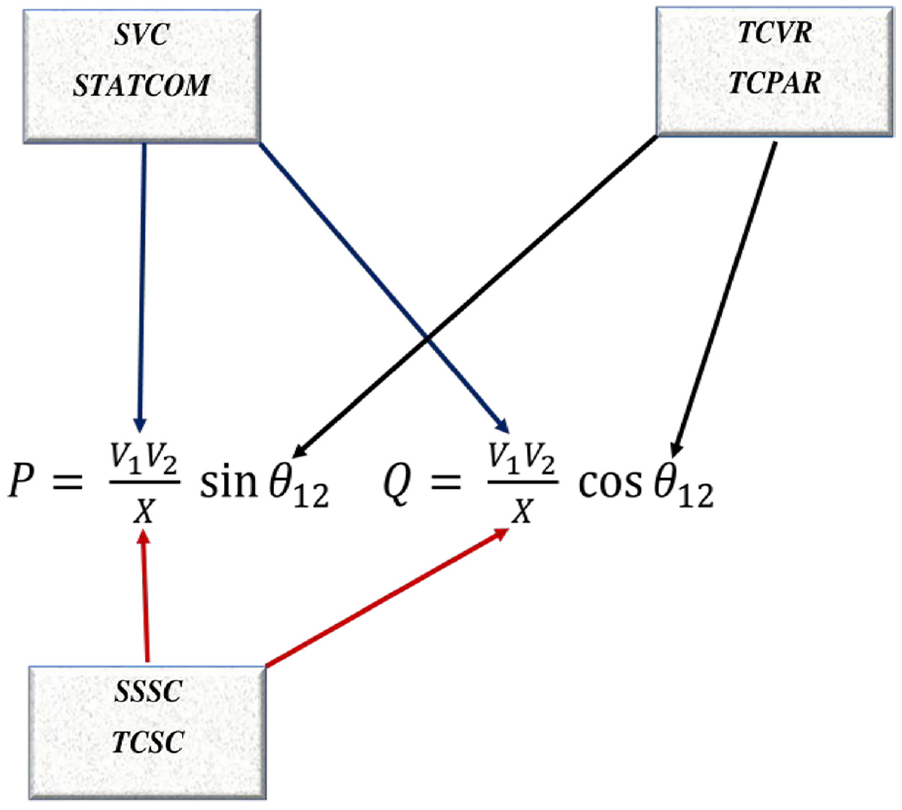
Diagram illustrating the application of FACTS in power system.
In the rest of the paper, the original HPFC structure consisting of SVC with the SSSC will be referred to as HPFC1 relating, while the envisioned typical HPFC consisting of a STATCOM with the TCSC will be referred to as HPFC2.
HPFC1 configuration
HPFC1 consists of two SSSC connected in series, and an SVC connected at the nodal point between the controllers. The SVC is used to deliver reactive power on high-voltage electricity transmission grids, to regulate voltage and power factor, and to stabilize the system. The SSSC is used to reduce the equivalent line impedance and to improve the active power transfer aptitude of the line. It also accomplishes the role of a controlled voltage source when it is coupled in series to the transmission line as cited in Cherif et al. (2021). HPFC1 is shown in Figure 4, and the mathematical presentation is in Yadav et al. (2020).
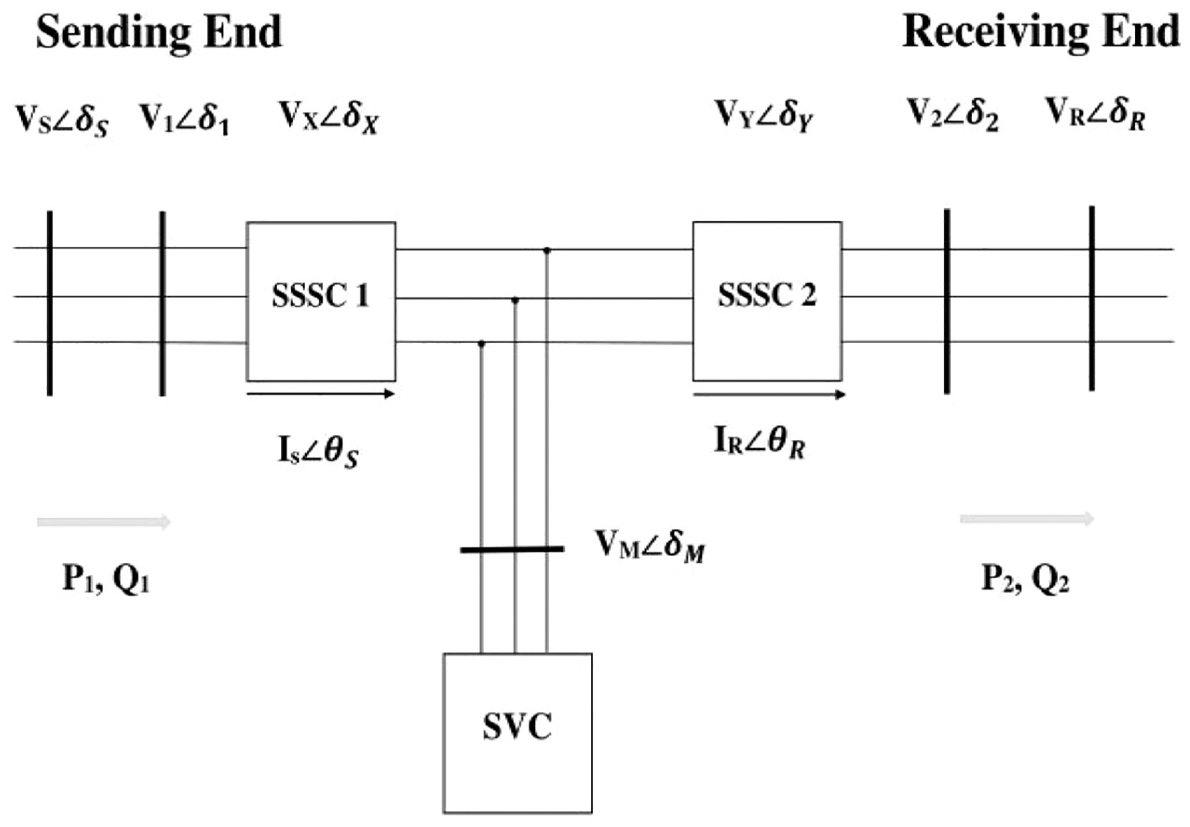
HPFC1 configuration.
The power transferred between the sending and receiving ends VS and VR is:

Where

RS: Series resistance representing SSSC1
XS: Series reactance representing SSSC1

RR: Series resistance representing SSSC2
XR: Series reactance representing SSSC2
δ: The angle between the two voltages

Steady-state phasor while are given as a function of the shunt susceptance of the SVC (BM) between the two regions:


VX: Series voltage phasor representing SSSC1
VY: Series voltage phasor representing SSSC2
The receiving end’s active and reactive powers are then calculated as:


Where
HPFC2 configuration
HPFC2 consists of two shunt STATCOMs connected through a TCSC, across a coupling transformer in a common DC link, for exchanging active power as shown in Figure 5. The role of the STATCOM is to provide reactive power compensation, while the TCSC is used to add voltage in series with the line and to control the impedance of the transmission line.
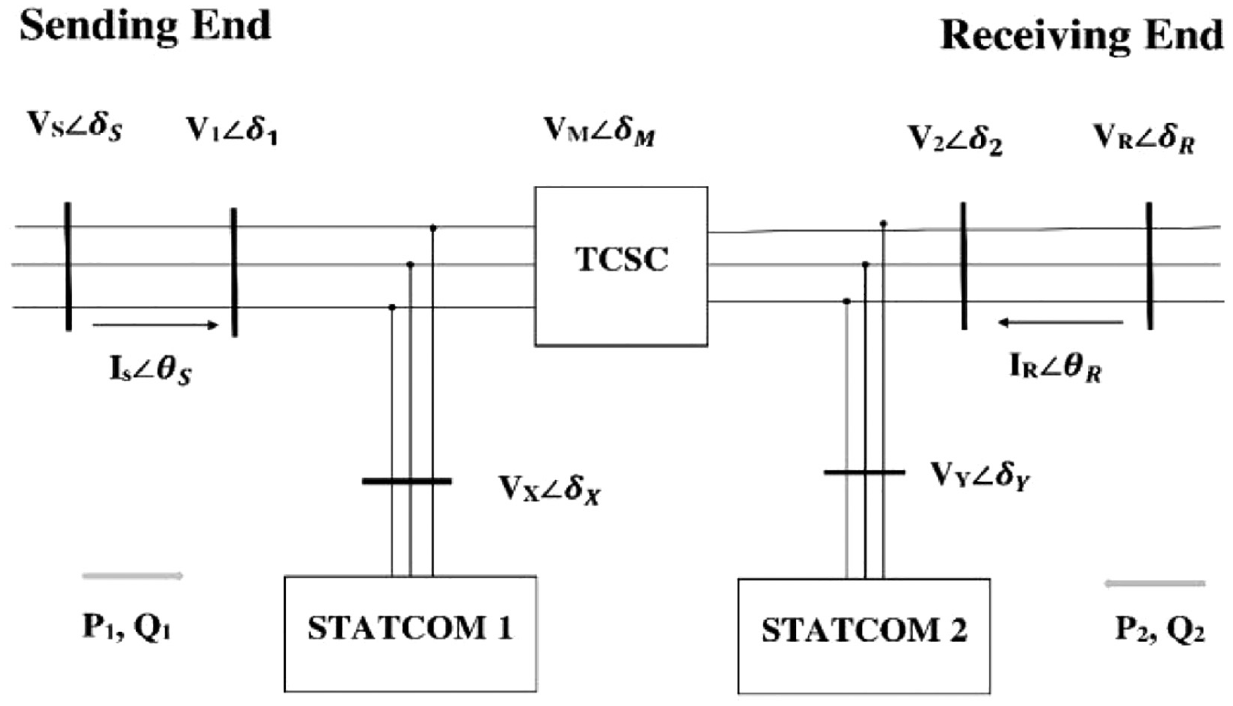
HPFC2 configuration.
From (Anjali and Mathew, 2020), the current flowing through the line is as:

Where
jX: The impedance of the transmission line.


The receiving end’s active and reactive powers are then calculated as:


Simulation results
The electric power systems with HPFC1 and HPFC2 are implemented in MATLAB/Simulink and SimPowerSystems toolbox. The three-phase fault of 100 ms occurs at the medium of the system, after 1 second of the beginning of the simulation.
The following four scenarios of simulation are performed:
Simulation of the system included Wind + PV with fault and without controllers.
Simulation of the system in the presence of HPFC1.
Simulation of the system in the presence of HPFC2.
Simulation of the system in the presence of HPFC1 and HPFC2 connected in series.
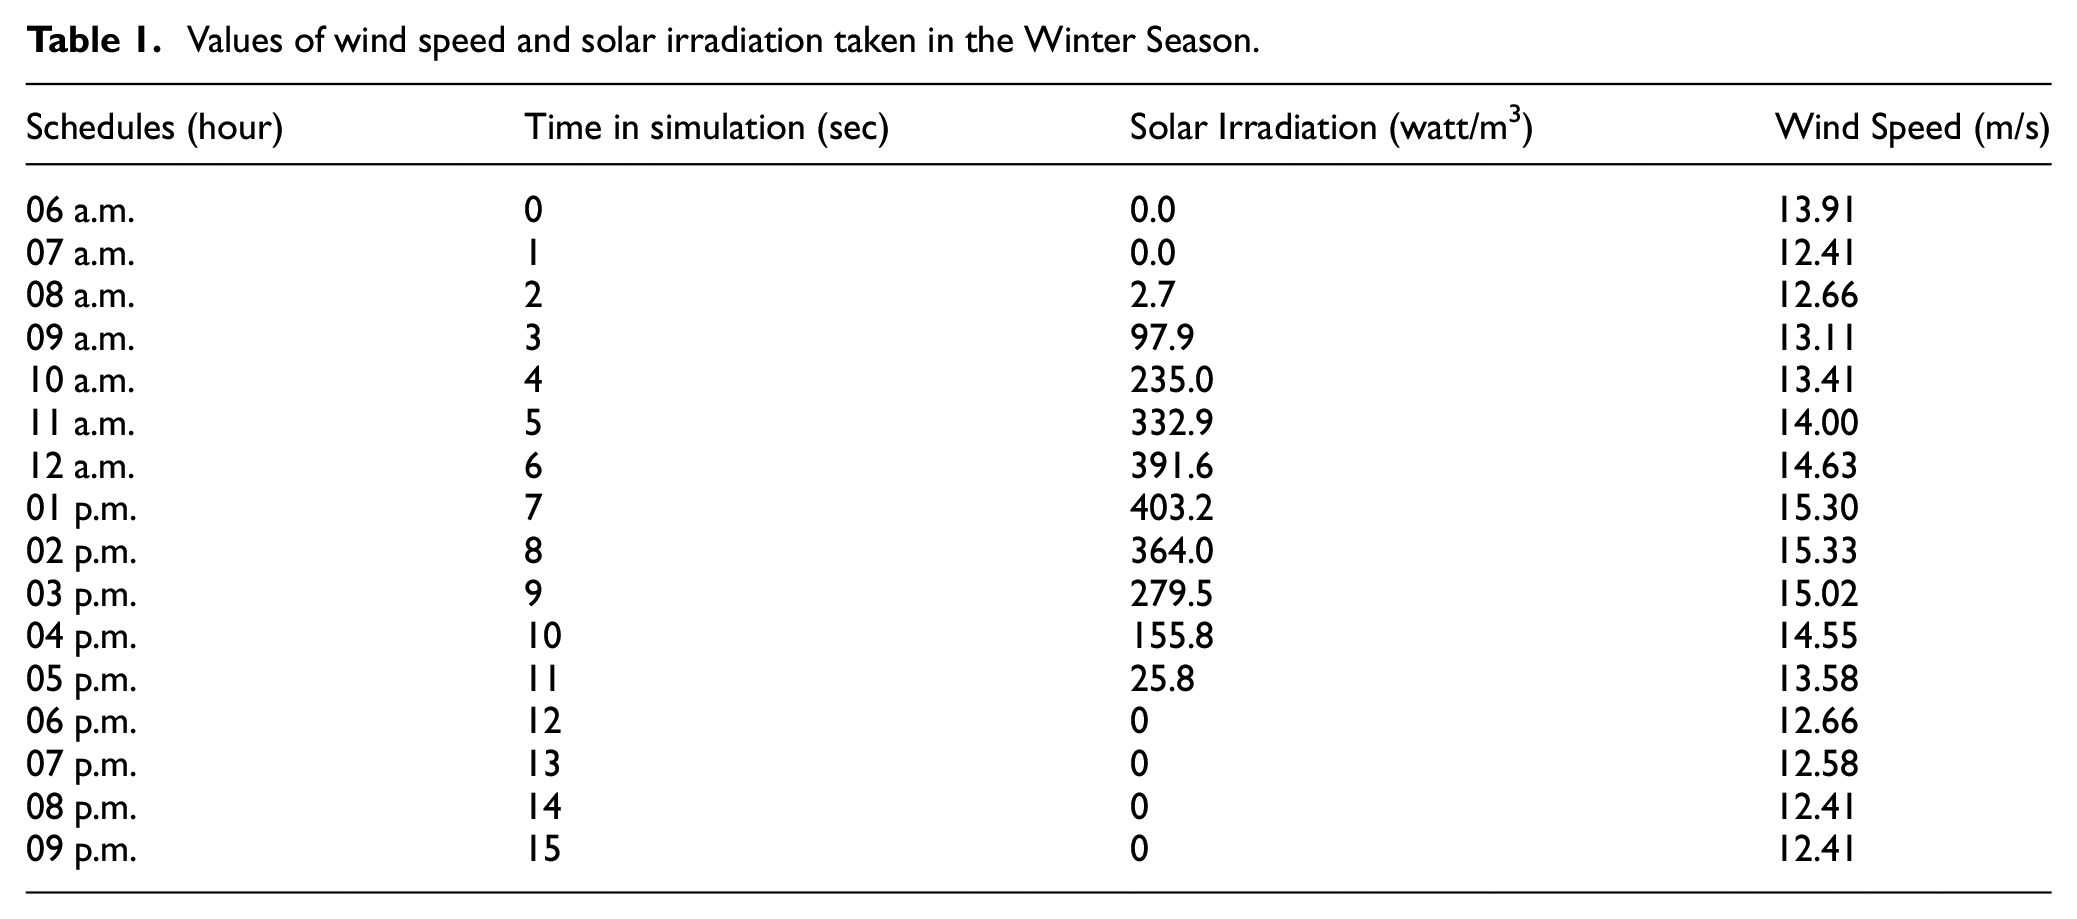
The wind turbine is stressed by winds of different speeds oscillating from 12.41 m/s to 15.33 m/s with a nominal speed of 13.50 m/s, in the winter season in Toronto Canada (Real wind values recorded on December 12, 2021, from 06 a.m. to 09 p.m.). For the same conditions, the solar irradiation varies from 0 watt/m2 to a maximum value of 403.2 watt/m2, The phasor mode of Simscape Power Systems allows a fast simulation of a 15 hours scenario The values are exposed in Table 1 and the curves are schematized in Figure 6.
Values of wind speed and solar irradiation taken in the Winter Season.
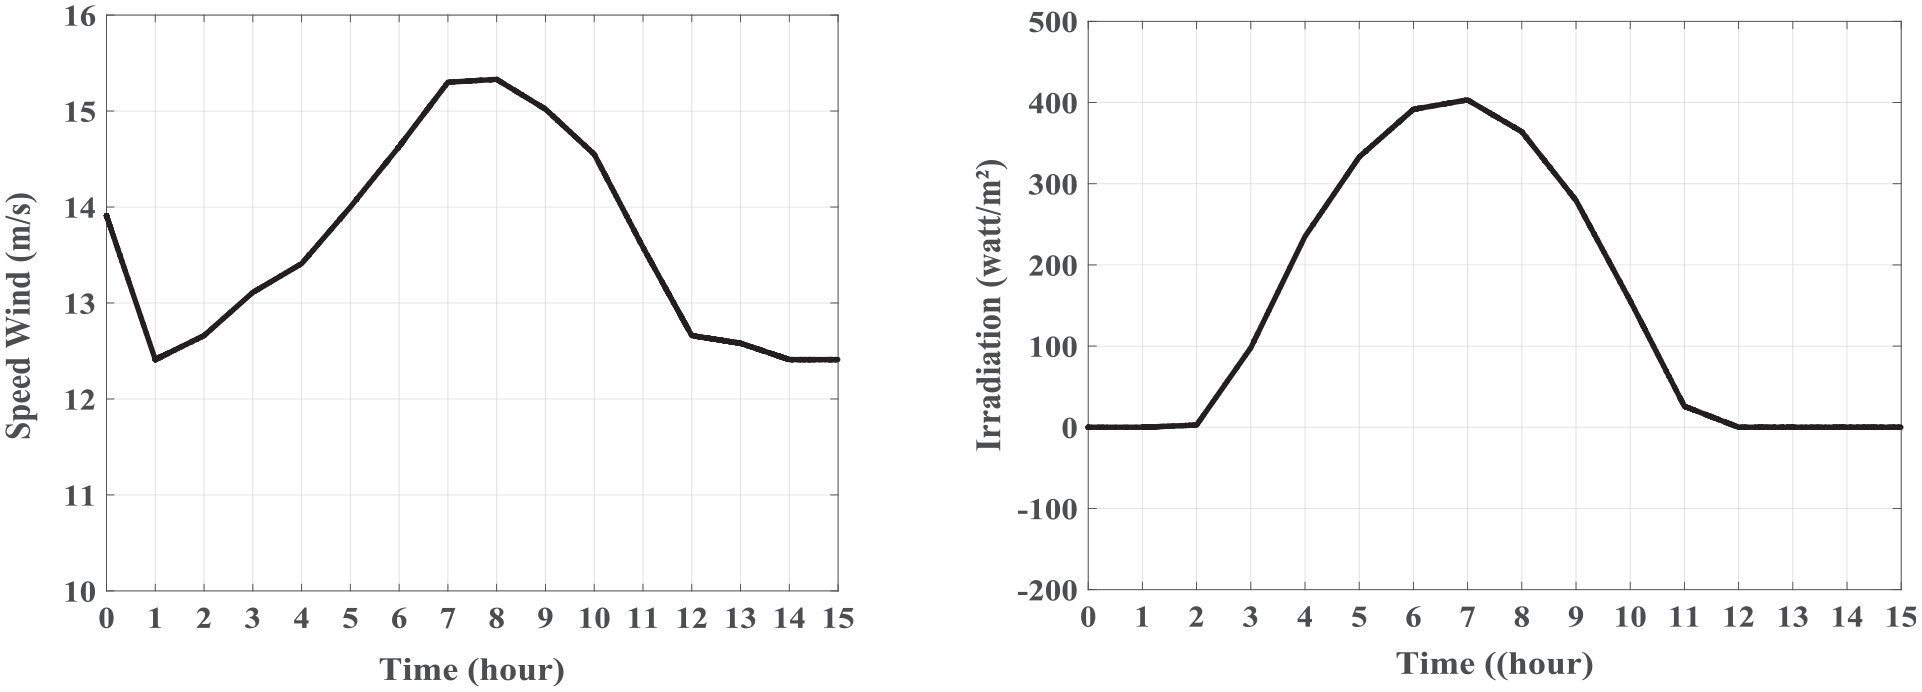
Wind speed and solar irradiation curves taken in winter season.
Figure 7 indicates for all scenarios, the curves of:
Active and reactive Powers generated by the wind source.
Active and reactive Powers generated by the solar source.
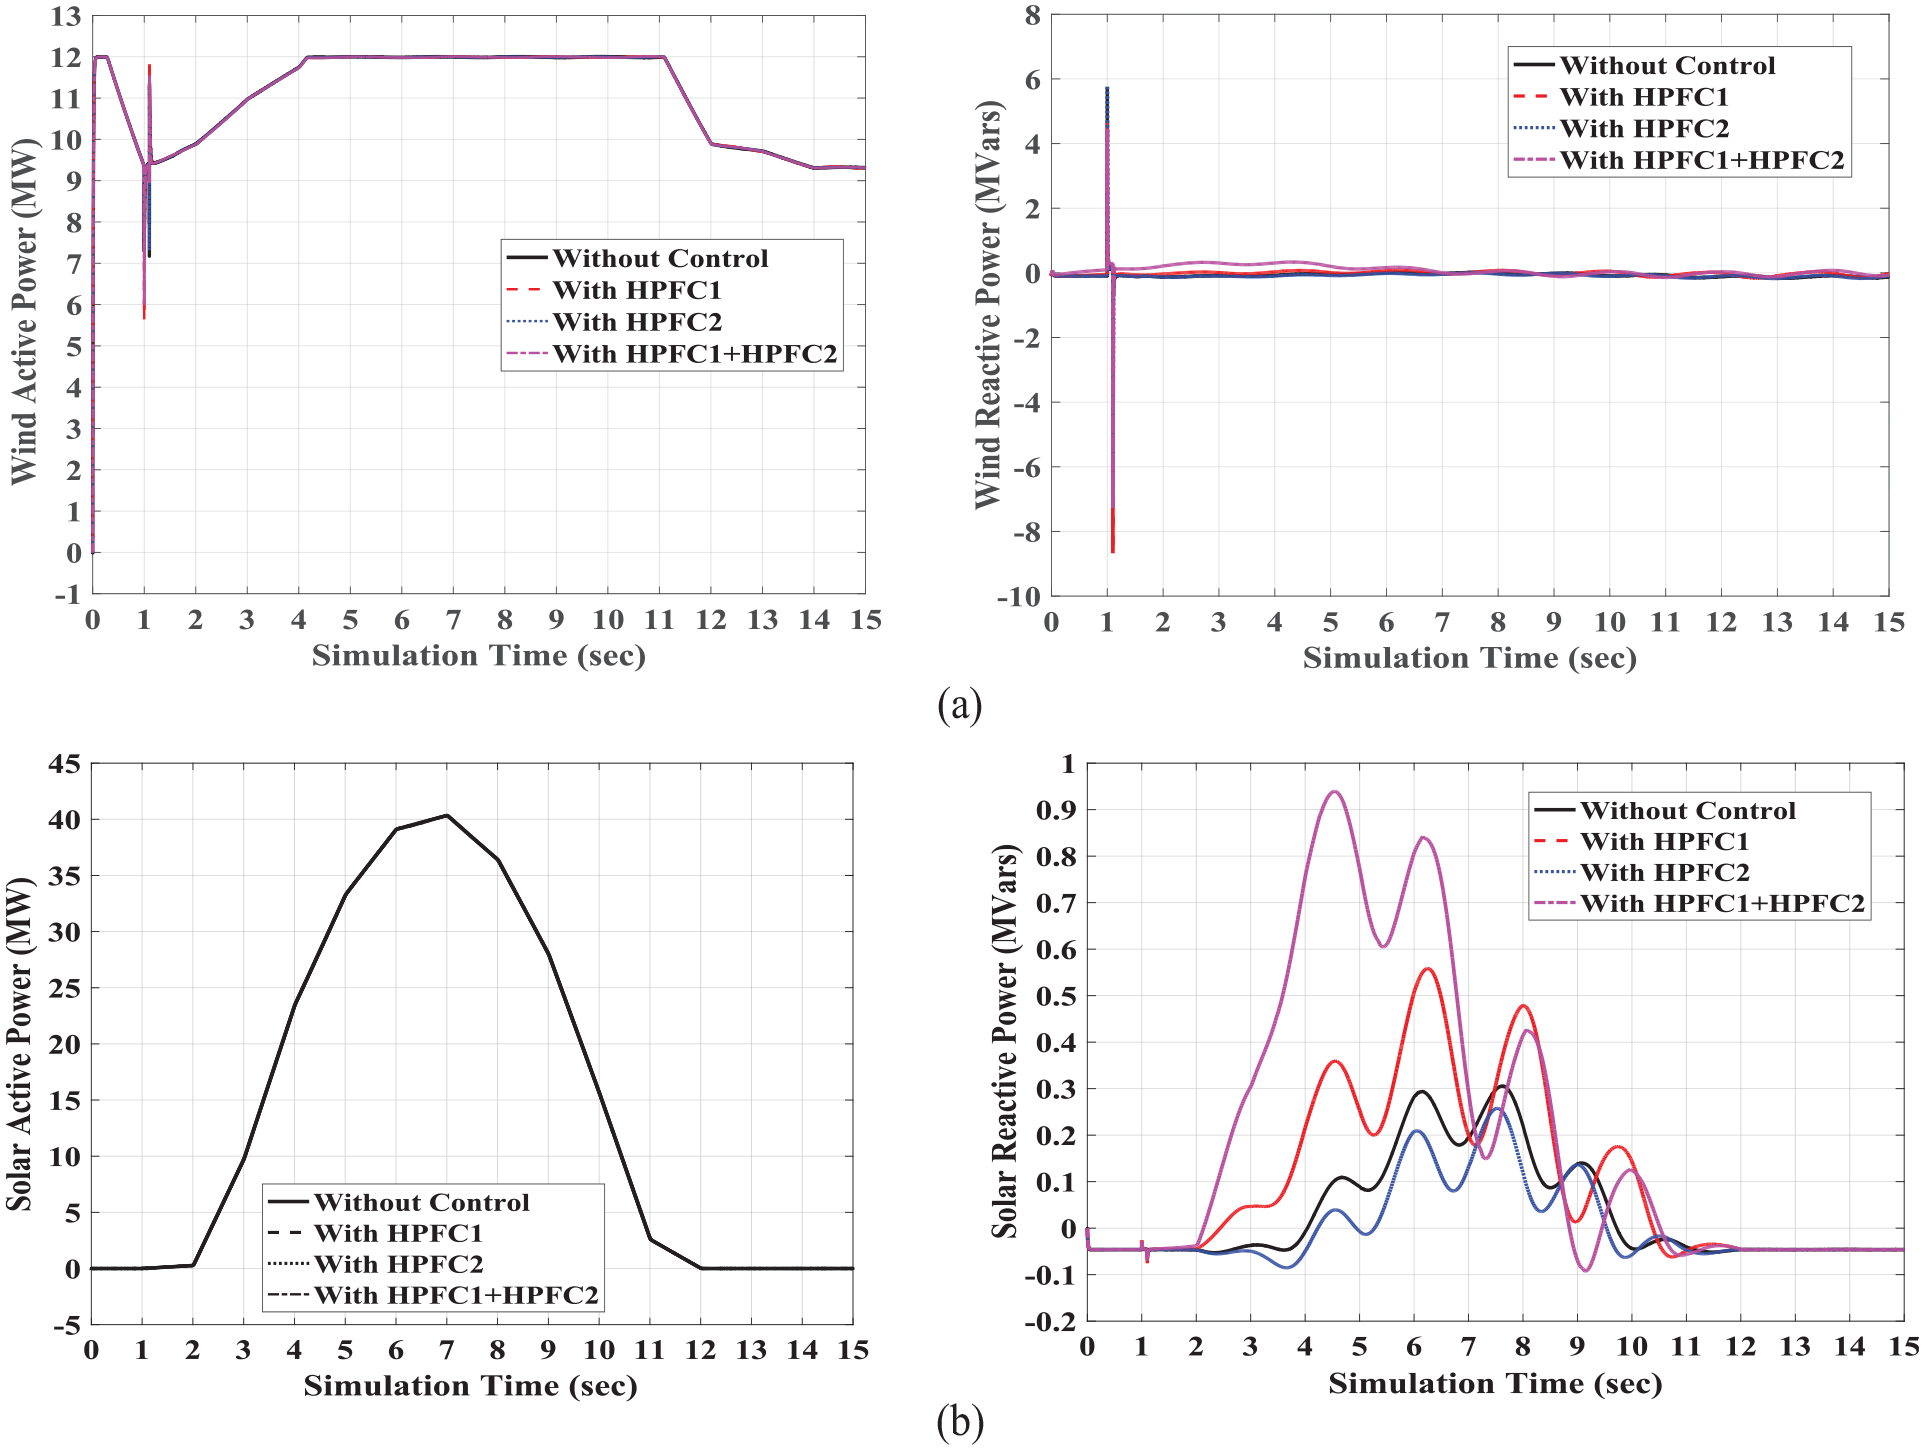
Solar and wind active and reactive powers for all scenarios in the Kundur System: (a) active and reactive powers generated by wind turbine and (b) active and reactive powers generated by solar source.
To study the transient stability of the system in the presence of symmetrical default, the mechanical rotor speed (wm) and the load angle (delta) between two areas, are intentional for all the scenarios. These results of the characteristic parameters of the generator in the swing bus (generator 02 in area 01) and for the PV generator (generator 04 in area 02) are presented in Figures 8 and 9 respectively. At first attendance, it is perceived that the curve of active power generated by the wind source is almost similar to the wind speed without exceeding the nominal value (13.50 m/s), since the mechanical power available on the turbine shaft is proportional to the cube of the wind speed in (Benali et al., 2018) as indicated in the equation (14):

Where
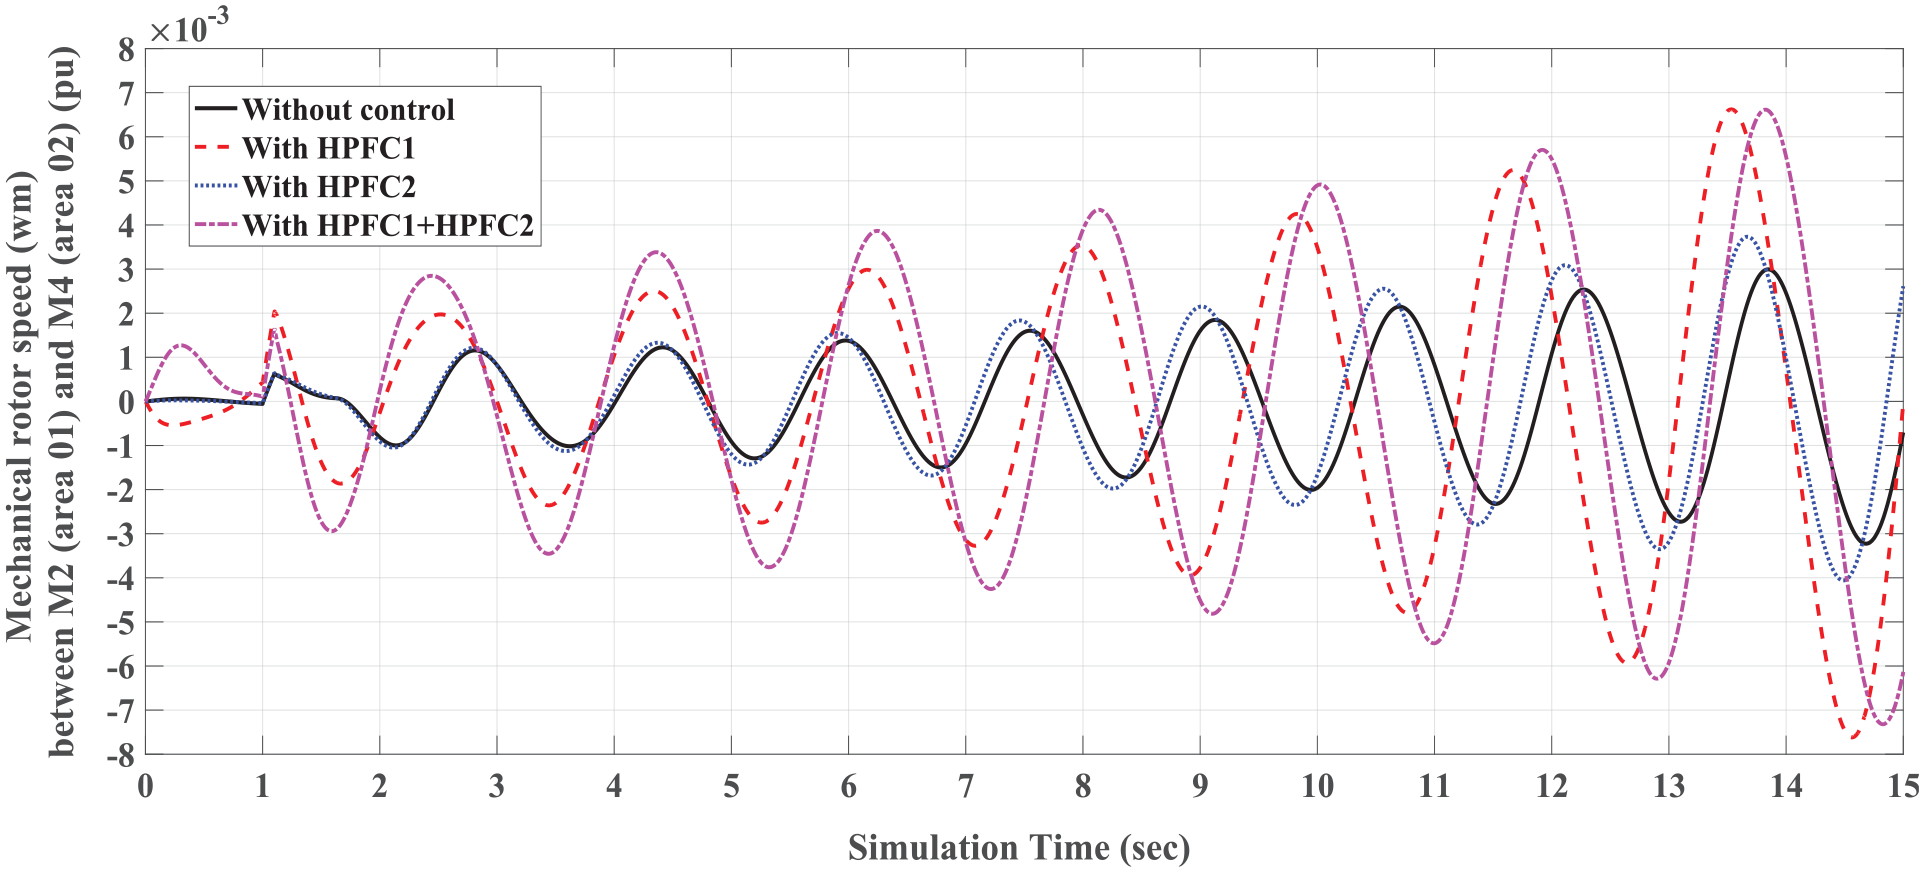
Relative mechanical rotor speed (wm) between two areas of the Kundur System for all scenarios.
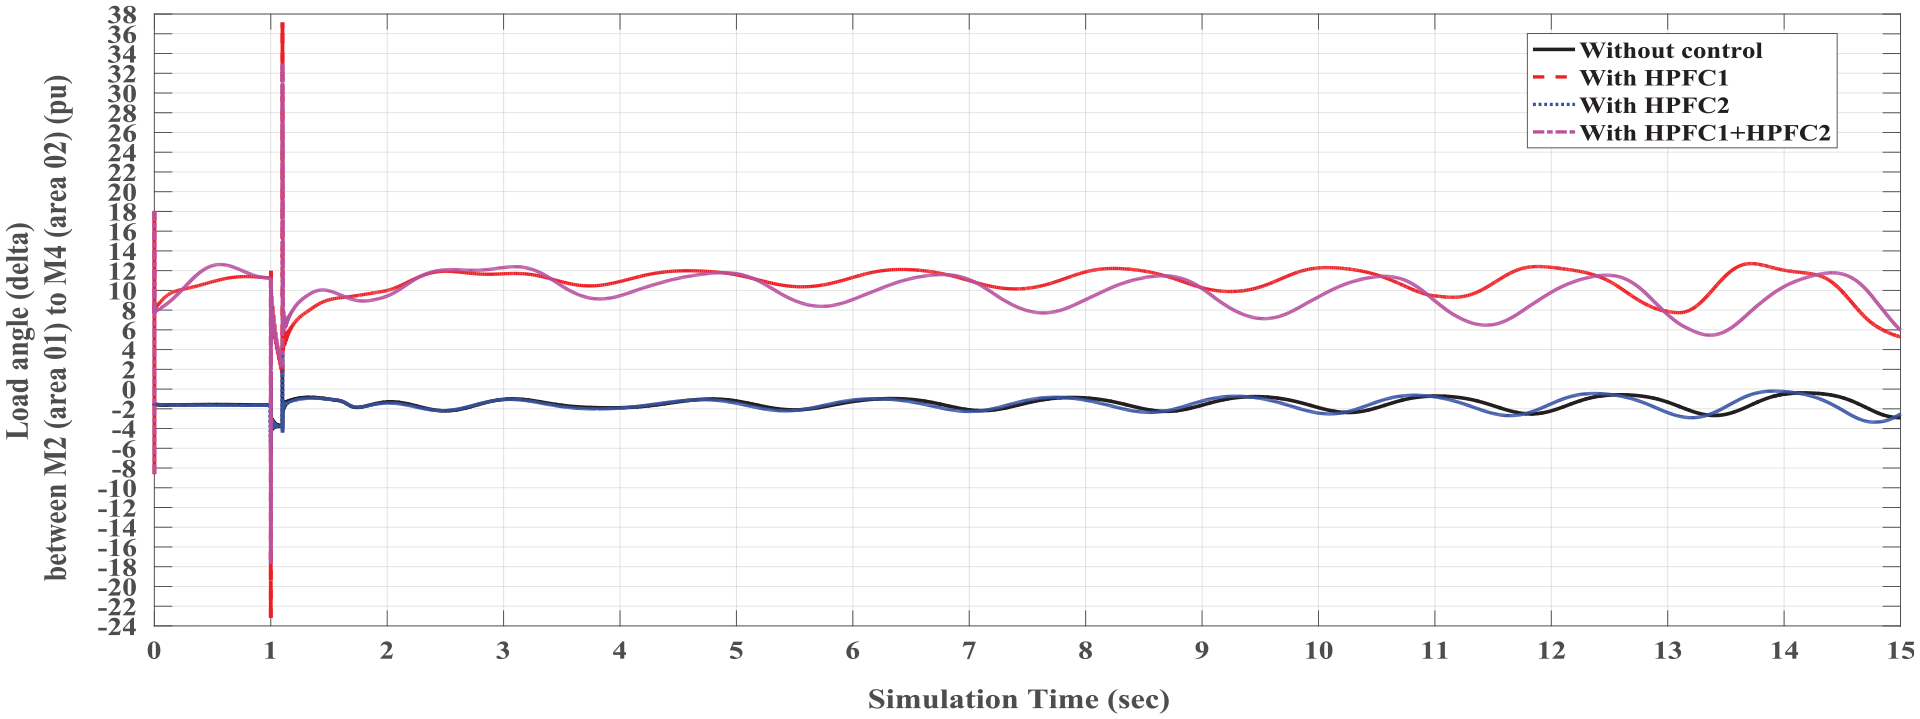
Relative load angle (delta) between two areas of the Kundur System for all scenarios.
On the other hand, the solar active power is proportional to the irradiation with a yield of 10%, according to the following formula:

Where:
P = Photovoltaic Active Power (Watt)
A = Area covered by PV farm (m2)
r = solar yield or efficiency (%)
I = Solar irradiation (Watt/m2)
As shown in (Benali et al., 2013), the integration of STATCOM is useful for avoiding the disconnection of wind turbines due to voltage sags or overcurrents, and for offering the possibility of connecting the wind farm to the electricity grid.
However, the reactive power delivered by the wind remains null after the fault is cleared, while the reactive power delivered by the solar source increases with large oscillations, especially when the system is connected to HPFC1 and HPFC2 together. Then, the oscillations decrease and become almost null in all cases. The simulation from the 2nd second to the 11th second (from 8 a.m. to 5 p.m.) is characterized by a change in the shape of the active and reactive power curves delivered simultaneously by the wind source and the solar source.
On the other hand, when the system is connected to one of the Hybrid Power Flow Controllers HPFC1 or HPFC2 together or separately, the system does not lose the synchronism. Both the curves of mechanical rotor speed (wm) and the load angle (delta) between the two areas show that the system becomes unstable for all studied cases. Precisely when the HPFC1 is active, the oscillations are more significant but are generally far from reaching an important value (7 × 10⁻³ p.u for mechanical rotor speed wm, and 13° for load angle delta).
When the system is linked to HPFC2, the results are similar to a system without the presence of any control
Conclusion
In this paper, two different configurations of HPFC based on the proposed concept have been simulated, under a short-circuit current, and compared, employing the phasor solution method available in SimPowerSystems software of MATLAB. A comparison of results shows that HPFC constituted of two STATCOMs connected through a TCSC, is found to be better than HPFC designed by two SSSCs connected in series and an SVC, despite that in the two cases, the system loses its stability, but it still keeps its synchronization.
The experience of combining HPFC1 and HPFC2 in series shows that the oscillations are countless and the results are not satisfactory. For this reason, it is technically preferable to use each HPFC independently.
Footnotes
Appendix A
Appendix B
Simulink model of HPFC1 and HPFC2 in Figures B1 and B2.
Declaration of conflicting interests
The author(s) declared no potential conflicts of interest with respect to the research, authorship, and/or publication of this article.
Funding
The author(s) received no financial support for the research, authorship, and/or publication of this article.